Embed Size (px)
Citation preview
University of California Treasurer's Annual Report, 2010-2011
Short Term Investment Pool (STIP)Short Term Investment Pool (STIP)
The Short Term Investment Pool (STIP) is a cash investment pool established in fiscal 1976 by The Regents, in which all University fund groups participate, including retirement and endowment funds as well as campus endowment funds. Cash to meet payrolls, operating expenses, and construction funds of all the campuses and teaching hospitals of the University are the major funds invested in the STIP until expended. Pension, endowment, and defined contribution funds awaiting permanent investment are also invested in the STIP until transferred. The STIP participants are able to maximize returns on their short-term cash balances by taking advantage of the economies of scale of investing in a large cash pool.
INVESTMENT OBJECTIVEThe basic investment objective of the STIP is to
maximize returns consistent with safety of principal, liquidity, and cash-flow requirements. The STIP’s invest-ments managed by the Treasurer’s Office include a broad spectrum of high-quality money-market and fixed-income instruments with a maximum maturity of five-and-a-half years. Investment maturities are structured to ensure an adequate flow of funds to meet the University’s cash needs as well as to provide the liquidity needed to facilitate asset class rebalancing and other major liquidity events.
In September 2009, The Regents authorized a change in the investment guidelines for the STIP, effective October 2009. As the liquidity requirements of the University have changed, due in part to the financial status of the State of California, an increased level of liquidity is now maintained in the STIP portfolio. Accordingly, to reflect the fact that there are now implicitly two components of the portfolio— a very short-term liquid portion and a somewhat longer portion—the policy benchmark has been changed to one that combines both components. The new benchmark is the weighted average of the income return on a constant maturity two-year U.S. Treasury Note and the return on the 30-day U.S. Treasury Bills. The weights are set at the actual average weights of the bond and cash equivalent components of the pool, rebalanced monthly. This change allows the managers to continue managing STIP consistent with the fund’s guidelines, while allowing for volatility in the amount of cash equivalents needed at any given time.
INVESTMENT STRATEGY AND RETURNSThe Treasurer’s Office manages the STIP as a highly
liquid portfolio, using maturity distribution strategies to maximize returns in different yield-curve environments. Select swapping strategies are employed to take advantage of disparities in the market to improve quality and yield, while maintaining liquidity.
For the fiscal year ended June 30, 2011, the amortized book value of the STIP investments managed by the Treasurer’s Office was $8.6 billion. The STIP’s income return was 2.56% versus the policy benchmark income return of 0.49%. The weighted average maturity of the fund was 1.7 years.
The STIP has achieved attractive returns over the long term. Over the last 10 years, the average annual income return on the STIP was 3.86%, compared to the policy benchmark income return of 2.57%.
The Federal Reserve Board has kept monetary policy very accommodative. The Federal funds rate has been near zero (0-0.25%) since December 2008. In light of considerably slower than expected economic growth, along with a deterioration in the labor market conditions, the Federal Open Market Committee made an historic policy move at its August 2011 meeting and committed to leave the federal funds rate at the current range of 0-0.25% at least through mid-2013. Federal Reserve Chairman Ben Bernanke also noted that the Fed has a range of policy tools that could be used to provide additional stimulus, as appropriate.
With the record level of low interest rates of the past few years, short-term yields remain pressured in a difficult market as the front end of the yield curve is anchored to the Fed’s 0% policy. During the year, the front end (0-5 years) of the yield curve continued to flatten. The decline in U.S. Treasury yields has been relentless and yields are now at the lowest levels seen in decades. As of October 17, 2011, the two-year U.S. Treasury Note yield is at 0.27% and the five-year U.S. Treasury Note yield is at 1.07%. Credit spreads have widened again and still offer excellent opportunities to add incremental yield to the portfolio, especially as high-grade corporate credit fundamentals
1 STIP returns are net of (after) investment management costs which are automatically deducted from income. The distribution return (net of all expenses) was 2.52%, 3.63%, and 3.82% for the one-, five-, and 10-Year periods respectively.
2 The STIP Policy Benchmark is a weighted average of the income return on a constant maturity two-year Treasury Note and the return on U.S. 30-day Treasury Bills. The weight is the average of the actual weights of the bond and cash equivalent components of the pool, rebalanced monthly. This benchmark was effective October 1, 2009.
3 Inflation as measured by the Consumer Price Index.
STIP Annualized Income Return1
June 30, 2011
1-Year 5-Year 10-Year 10-YearCumulative
STIP 2.56% 3.68% 3.86% 45.99%Policy Benchmark2 0.49 2.23 2.57 28.93Inflation3 3.56 2.16 2.41 26.84
University of California Treasurer's Annual Report, 2010-2011
UNIVERSITY PROGRAMS UTILIZING STIP
In fiscal 1985, The Regents authorized the University of California Mortgage Origination Program (MOP), which was funded by the legally available cash balances in the unrestricted portion of STIP. The MOP provides first deed of trust variable-rate mortgage loans with up to 40-year terms to eligible members of the University’s faculty and staff. In November 2001, The Regents approved interest-only mortgage loans under the MOP. Graduated payment mortgages, which offer a reduced interest rate during the initial years of the loan, were approved for the MOP by The Regents in May 2007. These loans totaled $705.5 million at June 30, 2011.
In March 1999, The Regents authorized the use of the legally available cash balances in the unrestricted portion of STIP to provide liquidity support for the University’s Commercial Paper Program. At the July 2008 meeting, The Regents authorized the President to increase the program from $550 million to $2 billion. The STIP also provides working capital advances to the medical centers.
Subsequent to the creation of the TRIP portfolio, in November 2008, The Regents authorized the President to utilize up to 40% of the combined outstanding balances from the combined STIP and TRIP investment portfolios as liquidity support for the Commercial Paper Program, the medical centers’ working capital borrowings, and the MOP loans. In November 2009, the Regents revised the internal limits and liquidity support options for the Commercial Paper Program.
At the March 2011 meeting, the Regents authorized the President to utilize borrowing from STIP, restructuring of University debt, and other internal or external sources to fund the gap between scheduled pension contributions from the University and employees and the required funding amount.
remain positive. We continue to take advantage of the dislocations in the market to purchase very high-quality credit spread products at attractive levels to lock in higher yields. At all times, the STIP’s primary investment objective remained the safety of principal with the focus on maintaining liquidity and managing the risk in the portfolio.
The University continues to struggle with the challenges of an ongoing budget shortfall and significant unfunded pension and post-employment benefits liabilities. The high quality of the STIP portfolio, with its highly liquid investments, provides the needed liquidity to meet the University’s cash needs. During the fiscal year, the campuses transferred $1.2 billion out of STIP to TRIP. Additionally, $1.1 billion was transferred from STIP to UCRP, as part of a $2.1 billion funding plan authorized by the Regents to contribute to the UCRP the “modified” annual required contribution (ARC), which would include the University’s normal cost for the pension system plus interest only on the unfunded actuarial accrual liability in UCRP.
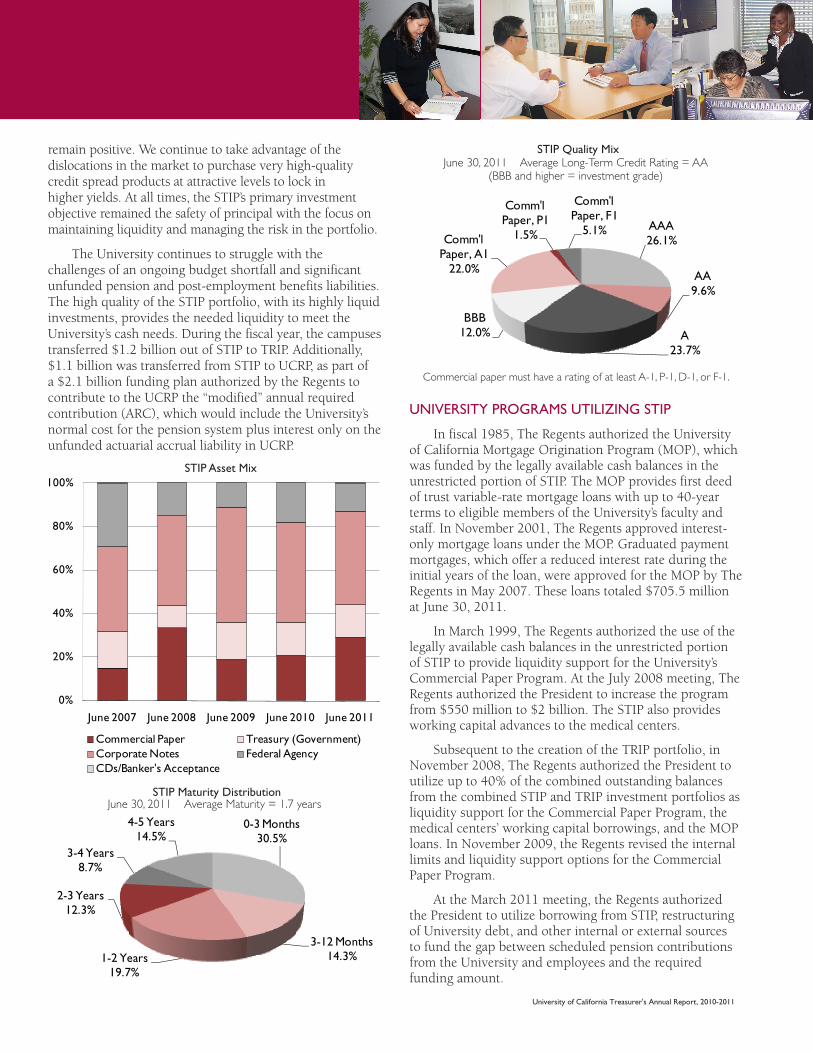
Commercial paper must have a rating of at least A-1, P-1, D-1, or F-1.
STIP Quality MixJune 30, 2011 Average Long-Term Credit Rating = AA
(BBB and higher = investment grade)
STIP Maturity DistributionJune 30, 2011 Average Maturity = 1.7 years
STIP Asset Mix
0%
20%
40%
60%
80%
100%
June 2007 June 2008 June 2009 June 2010 June 2011
Commercial Paper Treasury (Government)Corporate Notes Federal AgencyCDs/Banker's Acceptance
0-3 Months30.5%
3-12 Months14.3%1-2 Years
19.7%
2-3 Years12.3%
3-4 Years8.7%
4-5 Years14.5%
AAA26.1%
AA9.6%
A23.7%
BBB12.0%
Comm'l Paper, A1
22.0%
Comm'l Paper, P1
1.5%
Comm'l Paper, F1
5.1%