Embed Size (px)
Citation preview
October 2008
Abstract Local Area Transportation Review and Policy Area Mobility Guidelines
Planning Board Update: October 2, 2008
Subject Guidelines to be used for preparation and review of transportation impact studies for development in
Montgomery County. It should be used by transportation engineers, planners, public agency reviewers, and
community members participating in the development review process.
Source of Copies The Maryland-National Capital Park and Planning Commission
8787 Georgia Avenue
Silver Spring, MD 20910-3760
www.mc-mncppc.org/transportation/index.shtm
M-NCPPC Local Area Transportation Review and Policy Area Mobility Review Guidelines Page 1
TABLE OF CONTENTS I. Introduction
A. Background 4 B. Policy Areas 4 C. Local Area Transportation Review and
Policy Area Mobility Review Standards 4 D. Policy Area Mobility Review 7 E. Relationship Between Policy Area Mobility Review and
Local Area Transportation Review 9
II. Criteria for Screening Cases for Local Area Transportation Review 11 A. Significantly Sized Project 11 B. Congestion Standards 14 C. Exceptions to the General Guidelines 14
III. Method and Preparation of Local Area Transportation Review Traffic Study 16 A. General Criteria and Analytical Techniques 16 B. Scope of LATR/PAMR Traffic and Transportation Study 17
IV. Finding for Inadequate Facilities 22
A. Transportation Solutions 22 B. Degree of Local Congestion 23 C. Unavoidable Congestion 23 D. Transportation Demand Management Strategies 23 E. Project-Related Traffic 24 F. Queuing Analysis 24
V. Procedures for Application in the Central Business District
and Metro Station Policy Areas 25 A. Adequacy of Traffic Flows 25 B. Site Access and Pedestrian/Bicycle Safety 25 C. Other Criteria 26 D. Information Provided by Staff 26 E. Traffic Mitigation Agreement 27 F. Participation in Transportation Improvements 27
VI. Methods to Reduce Local Area Transportation Review Impact 28 A. Methods to Reduce LATR or PAMR Impact For Residential
and Non-Residential Development 28 B. Procedures for Applying Section VI - Trip Reduction Methods 32 C. Payment Instead of Construction 32
VII. Assigning Values to Traffic Study Factors 33 A. Capital Improvements Program Definition 33 B. Trip Generation 33 C. Peak Hour 34 D. Trip Distribution 34 E. Directional Split 34 F. Trip Assignment 34 G. Critical Lane Volume Analysis 35 H. Traffic Data 35
I. Adequate Accommodation of Traffic 35 J. Critical Lane Volume Method 36 K. Required Traffic Study Submittals to Satisfy
Local Area Transportation Review 38
VIII. Policy Area Mobility Review 40
A. Background 40
B. PAMR Trip Reduction/Mitigation 43
Appendix A: Weekday Peak Hour Trip Generation Formulas and Rates for
Local Area Transportation Review 46 Appendix B: Weekday Peak Hour Trips Generated by Land Uses for
Local Area Transportation Review 52 Appendix C: Weekday Peak Hour Trip Generation Rates and
Directional Splits for the Bethesda, Friendship Heights,
and Silver Spring CBDs 58 Appendix D: Trip Distribution and Traffic Assignment Guidelines 60 Appendix E: Procedure Delegating Certain APF Findings to Staff
at Time of Building Permit 71
Appendix F: PAMR Deminimis Payment in Lieu for PAMR Mitigation of
Fewer than 50 Peak Hour Vehicle Trips 72
M-NCPPC Local Area Transportation Review and Policy Area Mobility Review Guidelines Page 3
MAPS, FIGURES, and TABLES Map 1
Montgomery County, Maryland Annual Growth Policy Areas .................................................................... 5
Table 1
LATR Intersection Congestion Standards by Policy Area .......................................................................... 6
Figure 1
PAMR for Montgomery County - 2007 Growth Policy……………………………………………………… ................. 7
Table 2
Trip Mitigation Required by Policy Area………………………………… ............................................................... 8
Table 3
PAMR and LATR Approaches to Mitigating Unacceptable Impacts ........................................................ 10
Figure 2
Checklist for Determining the Completeness of Traffic Studies ............................................................. 12
Table 4
Signalized Intersections to be Included in a Traffic Study ...................................................................... 18
Table 5
Graduated and Maximum Trip Credits Related to Congestion Standards............................................. 31
Table 6
Montgomery County Lane Use Factors .................................................................................................... 36
Table 7
Critical Volume Calculations ..................................................................................................................... 37
Table 8
Relative Arterial Mobility and Arterial LOS…………………………………… ...................................................... 40
Table 9
Relative Transit Mobility and Transit LOS……………………………….......................................................... …41
Table 10
Equivalency Between Transit LOS and Arterial LOS………………………. .................................................... 41
Table 11
Trip Mitigation Required by Policy Area………………………………… ........................................................ …..42
Table 12
PAMR Mitigation Options for Providing Roadway Capacity……… ............................................... ………….45
Introduction A. Background
County Code Section 50-35(k) (the Adequate Public Facilities Ordinance or APFO) directs the
Montgomery County Planning Board to approve preliminary plans of subdivision or other
approvals that require a finding of Adequate Public Facilities (APF) only after finding that public
facilities will be adequate to serve the subdivision. This involves forecasting future travel demand
from private development and comparing it to the capacity of existing and programmed public
transportation facilities.
In accordance with the FY 2007-09 Growth Policy adopted by the County Council on November
13, 2007, subdivision applications are subject to two transportation tests called Local Area
Transportation Review (LATR) and Policy Area Mobility Review (PAMR).
B. Policy Areas
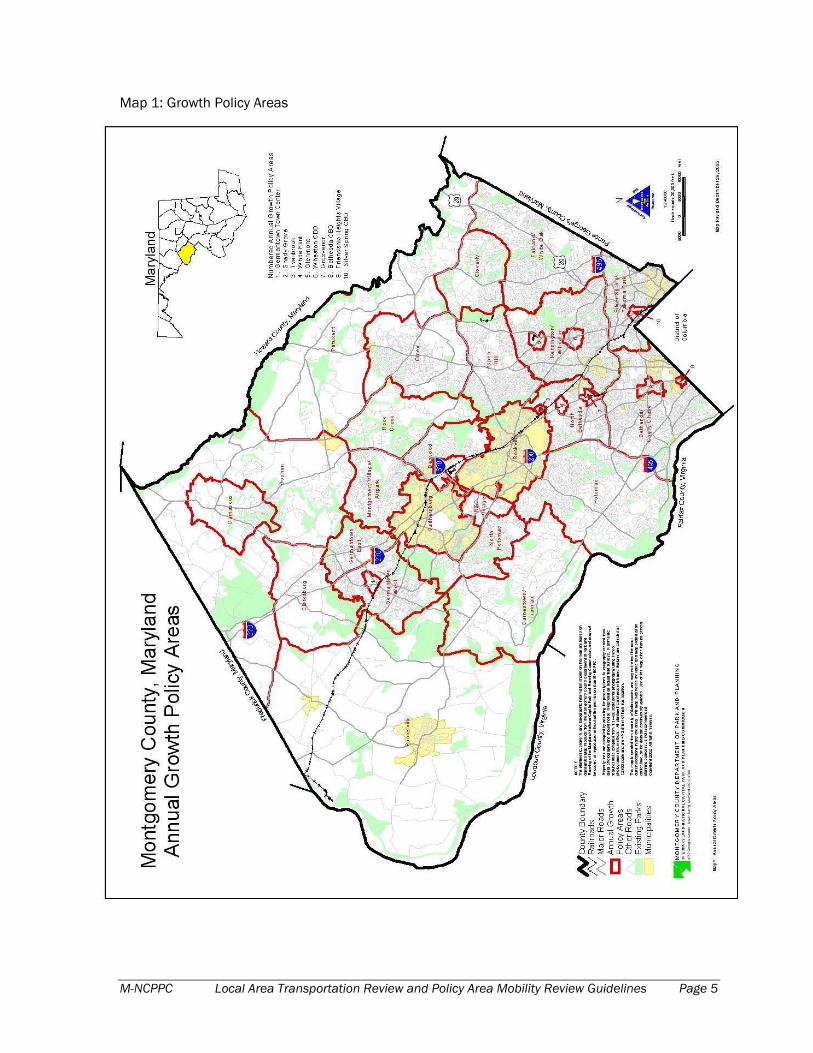
The County is divided into traffic zones, which are grouped into policy areas (Map 1). The
congestion standards for both LATR and the mitigation requirements for PAMR are established
by the County Council, adopted in these Guidelines, and applied to policy areas.
C. Local Area Transportation Review and Policy Area Mobility Review Standards
The Local Area Transportation Review and Policy Area Mobility Review Guidelines are to be used
by applicants in preparing reports to the Planning Board that determine the requirement for and
the scope of a traffic study or review prepared by an applicant for APF review and mandatory
referral cases brought before the Planning Board.
The Guidelines are also recognized as the standard for reports to the Board of Appeals and the
Hearing Examiner for special exception and zoning cases.
The Guidelines may also apply to building permit review for cases requiring an APF finding
without subdivision, though in limited cases (less than 12 months vacancy, no increase in square
footage, fewer than 30 peak hour trips) the APF test may be approved administratively by staff.
On May 15, 2008, the Planning Board adopted new PAMR trip mitigation requirements that are
effective for subdivision applications submitted after July 1, 2008. This document reflects their
action.
M-NCPPC Local Area Transportation Review and Policy Area Mobility Review Guidelines Page 5
Map 1: Growth Policy Areas
Page 6 Local Area Transportation Review and Policy Area Mobility Review Guidelines M-NCPPC
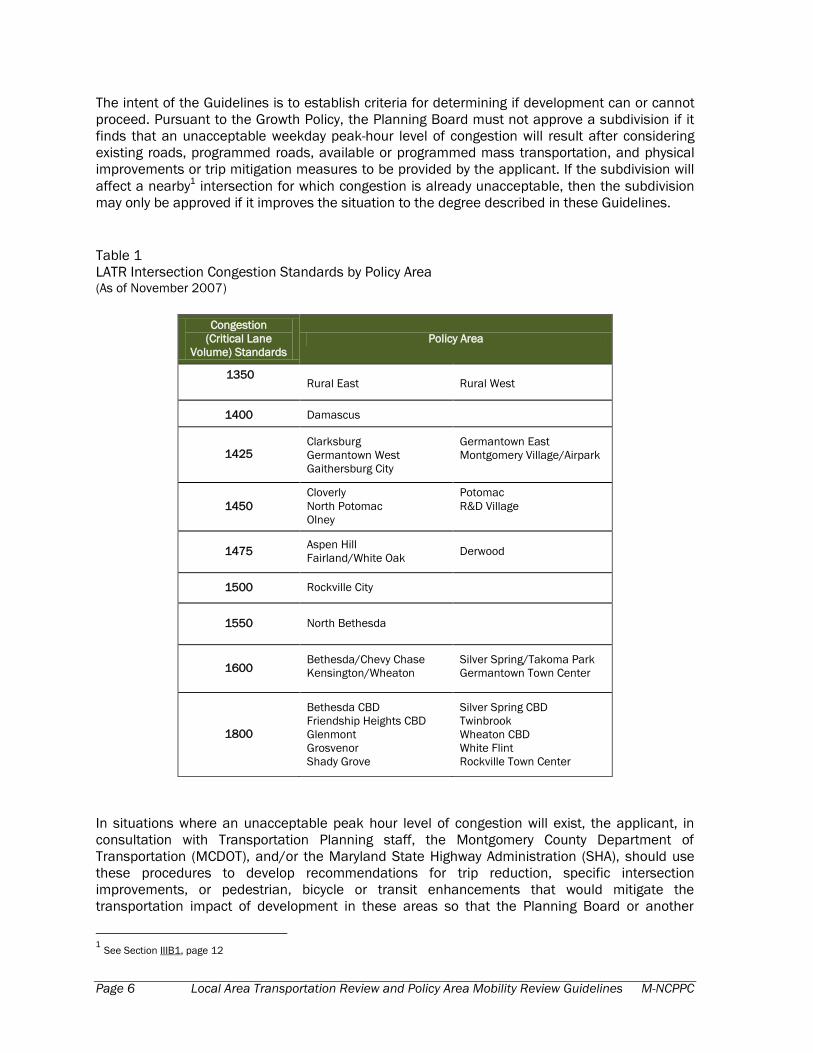
The intent of the Guidelines is to establish criteria for determining if development can or cannot
proceed. Pursuant to the Growth Policy, the Planning Board must not approve a subdivision if it
finds that an unacceptable weekday peak-hour level of congestion will result after considering
existing roads, programmed roads, available or programmed mass transportation, and physical
improvements or trip mitigation measures to be provided by the applicant. If the subdivision will
affect a nearby1 intersection for which congestion is already unacceptable, then the subdivision
may only be approved if it improves the situation to the degree described in these Guidelines.
Table 1
LATR Intersection Congestion Standards by Policy Area (As of November 2007)
Congestion
(Critical Lane
Volume) Standards
Policy Area
1350
Rural East Rural West
1400 Damascus
1425 Clarksburg
Germantown West
Gaithersburg City
Germantown East
Montgomery Village/Airpark
1450
Cloverly
North Potomac
Olney
Potomac
R&D Village
1475 Aspen Hill
Fairland/White Oak
Derwood
1500 Rockville City
1550
North Bethesda
1600 Bethesda/Chevy Chase
Kensington/Wheaton
Silver Spring/Takoma Park
Germantown Town Center
1800
Bethesda CBD
Friendship Heights CBD
Glenmont
Grosvenor
Shady Grove
Silver Spring CBD
Twinbrook
Wheaton CBD
White Flint
Rockville Town Center
In situations where an unacceptable peak hour level of congestion will exist, the applicant, in
consultation with Transportation Planning staff, the Montgomery County Department of
Transportation (MCDOT), and/or the Maryland State Highway Administration (SHA), should use
these procedures to develop recommendations for trip reduction, specific intersection
improvements, or pedestrian, bicycle or transit enhancements that would mitigate the
transportation impact of development in these areas so that the Planning Board or another
1 See Section IIIB1, page 12
M-NCPPC Local Area Transportation Review and Policy Area Mobility Review Guidelines Page 7
elected or appointed body could consider granting approval. The Guideline’s procedures are
intended to provide a near-term ―snapshot in time‖ of estimated future traffic conditions and to
present a reasonable estimate of traffic conditions at the time of development. They are not
intended to establish delay-free conditions.
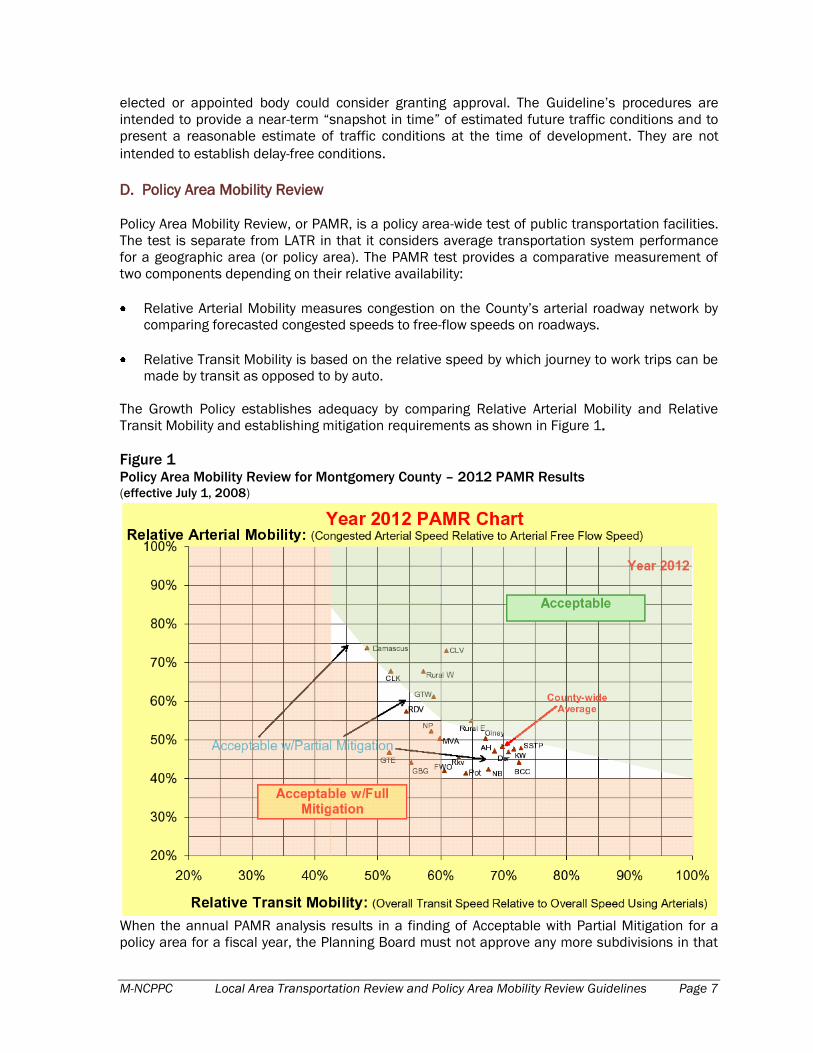
D. Policy Area Mobility Review
Policy Area Mobility Review, or PAMR, is a policy area-wide test of public transportation facilities.
The test is separate from LATR in that it considers average transportation system performance
for a geographic area (or policy area). The PAMR test provides a comparative measurement of
two components depending on their relative availability:
Relative Arterial Mobility measures congestion on the County’s arterial roadway network by
comparing forecasted congested speeds to free-flow speeds on roadways.
Relative Transit Mobility is based on the relative speed by which journey to work trips can be
made by transit as opposed to by auto.
The Growth Policy establishes adequacy by comparing Relative Arterial Mobility and Relative
Transit Mobility and establishing mitigation requirements as shown in Figure 1.
Figure 1 Policy Area Mobility Review for Montgomery County – 2012 PAMR Results (effective July 1, 2008)
When the annual PAMR analysis results in a finding of Acceptable with Partial Mitigation for a
policy area for a fiscal year, the Planning Board must not approve any more subdivisions in that
Page 8 Local Area Transportation Review and Policy Area Mobility Review Guidelines M-NCPPC
policy area in that fiscal year except as allowed by the current growth policy. For FY2009, the
Planning Board will consider certain policy areas to be Acceptable with Partial Mitigation for
transportation at the policy area level. The full listing of policy areas for which either full or partial
mitigation is required in FY09 are listed below.
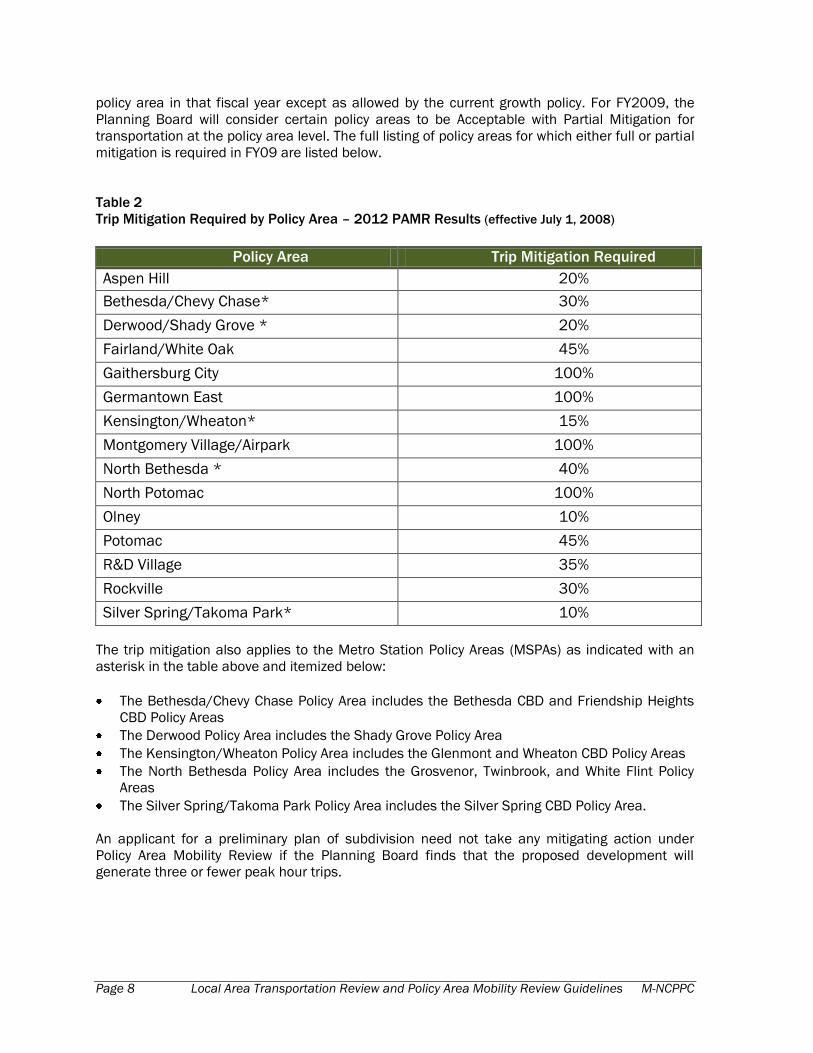
Table 2
Trip Mitigation Required by Policy Area – 2012 PAMR Results (effective July 1, 2008)
Policy Area Trip Mitigation Required
Aspen Hill 20%
Bethesda/Chevy Chase* 30%
Derwood/Shady Grove * 20%
Fairland/White Oak 45%
Gaithersburg City 100%
Germantown East 100%
Kensington/Wheaton* 15%
Montgomery Village/Airpark 100%
North Bethesda * 40%
North Potomac 100%
Olney 10%
Potomac 45%
R&D Village 35%
Rockville 30%
Silver Spring/Takoma Park* 10%
The trip mitigation also applies to the Metro Station Policy Areas (MSPAs) as indicated with an
asterisk in the table above and itemized below:
The Bethesda/Chevy Chase Policy Area includes the Bethesda CBD and Friendship Heights
CBD Policy Areas
The Derwood Policy Area includes the Shady Grove Policy Area
The Kensington/Wheaton Policy Area includes the Glenmont and Wheaton CBD Policy Areas
The North Bethesda Policy Area includes the Grosvenor, Twinbrook, and White Flint Policy
Areas
The Silver Spring/Takoma Park Policy Area includes the Silver Spring CBD Policy Area.
An applicant for a preliminary plan of subdivision need not take any mitigating action under
Policy Area Mobility Review if the Planning Board finds that the proposed development will
generate three or fewer peak hour trips.
M-NCPPC Local Area Transportation Review and Policy Area Mobility Review Guidelines Page 9
E. Relationship between Policy Area Mobility Review
and Local Area Transportation Review
In most instances, applicants will be required to submit a traffic statement with their
development application concerning the need for an LATR. Transportation planning staff will use
the following criteria to determine whether and when the applicant needs to submit a traffic
study.
Application Types
PAMR Review and LATR are separate evaluation processes, but must be examined concurrently
as part of a development application submission. Each applicant must satisfy both PAMR and
LATR requirements. The requirements must be addressed in a single document, which may
include a combination of traffic statements and traffic studies. There are four types of
development review scenarios:
Type 1. Traffic statement describing exemption from both LATR and PAMR studies
A development case that requires neither an LATR study nor a PAMR study must submit a traffic
statement describing the basis for the exemption. The traffic statement must identify the number
of peak hour trips generated by the application during both weekday AM and PM peak periods,
and the site’s policy area and required mitigation percentage. Examples of Type 1 cases are:
A site generating three or fewer peak hour vehicle trips
A site generating fewer than 30 vehicle trips located in a policy area defined as Acceptable
without mitigation for PAMR.
Type 2. Traffic study for LATR including statement regarding PAMR study exemption
A development case for a site that requires an LATR study, but only a PAMR statement, must
include the PAMR statement within the LATR study. An example of a Type 2 case is a site
generating 30 or more peak hour vehicle trips located in a Policy Area defined as Acceptable
without mitigation for PAMR.
Type 3. Traffic study for PAMR including statement regarding LATR study exemption
A development case for a site that requires a PAMR study, but only an LATR statement, must
include the LATR statement within the PAMR study. An example of a Type 3 case is a site
generating between three and 30 total peak hour vehicle trips located in a policy area defined as
Acceptable with Partial Mitigation or Acceptable with Full Mitigation for PAMR.
Type 4. Traffic study for both LATR and PAMR
A development case for a site that requires both an LATR study and a PAMR study must include
both studies in the same submittal. An example of a Type 4 case is a site generating more than
30 peak hour vehicle trips located in a policy area defined as Acceptable with Partial Mitigation
or Acceptable with Full Mitigation for PAMR.
Both PAMR and LATR use similar approaches to mitigating unacceptable impacts, including
encouraging non-auto oriented solutions.
Page 10 Local Area Transportation Review and Policy Area Mobility Review Guidelines M-NCPPC
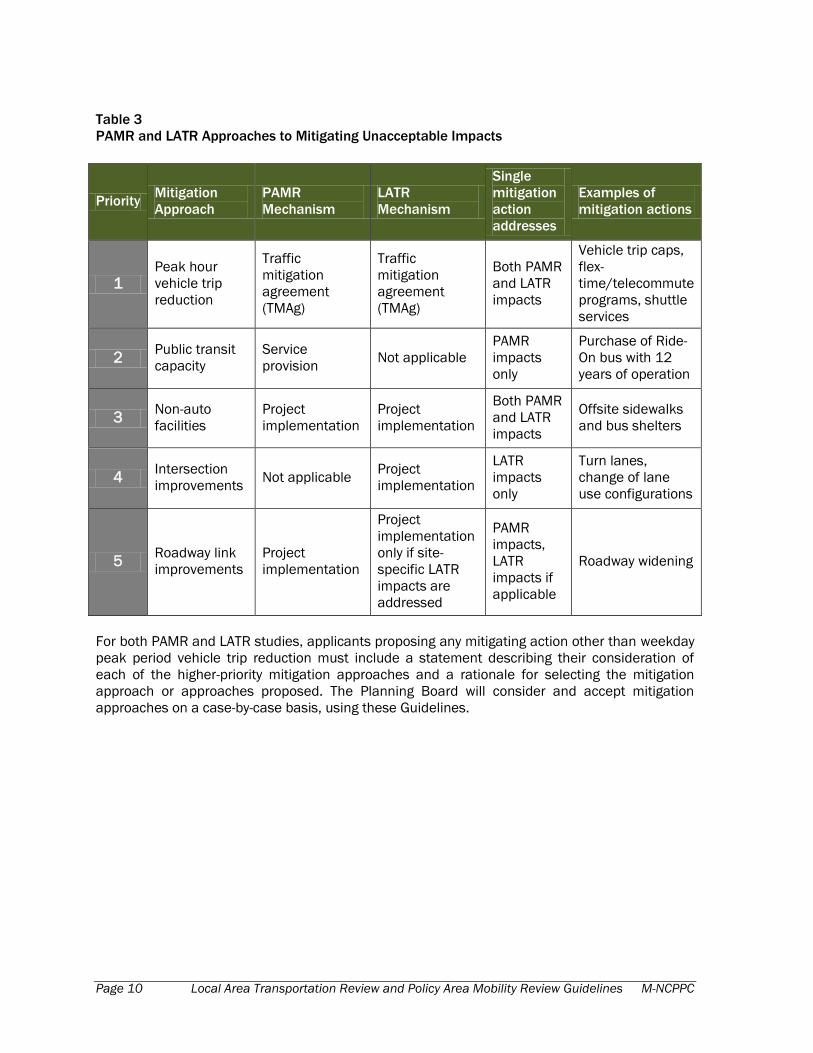
Table 3
PAMR and LATR Approaches to Mitigating Unacceptable Impacts
Priority Mitigation
Approach
PAMR
Mechanism
LATR
Mechanism
Single
mitigation
action
addresses
Examples of
mitigation actions
1 Peak hour
vehicle trip
reduction
Traffic
mitigation
agreement
(TMAg)
Traffic
mitigation
agreement
(TMAg)
Both PAMR
and LATR
impacts
Vehicle trip caps,
flex-
time/telecommute
programs, shuttle
services
2 Public transit
capacity
Service
provision Not applicable
PAMR
impacts
only
Purchase of Ride-
On bus with 12
years of operation
3 Non-auto
facilities
Project
implementation
Project
implementation
Both PAMR
and LATR
impacts
Offsite sidewalks
and bus shelters
4 Intersection
improvements Not applicable
Project
implementation
LATR
impacts
only
Turn lanes,
change of lane
use configurations
5 Roadway link
improvements
Project
implementation
Project
implementation
only if site-
specific LATR
impacts are
addressed
PAMR
impacts,
LATR
impacts if
applicable
Roadway widening
For both PAMR and LATR studies, applicants proposing any mitigating action other than weekday
peak period vehicle trip reduction must include a statement describing their consideration of
each of the higher-priority mitigation approaches and a rationale for selecting the mitigation
approach or approaches proposed. The Planning Board will consider and accept mitigation
approaches on a case-by-case basis, using these Guidelines.
M-NCPPC Local Area Transportation Review and Policy Area Mobility Review Guidelines Page 11
II. Criteria for Screening Cases for
Local Area Transportation Review
In cases where an LATR is required a traffic study must be filed as a part of the development
submittal. Transportation planning staff will review the traffic statement and/or traffic study. If
staff determines that a traffic study is necessary, but one was not submitted with the filed appli-
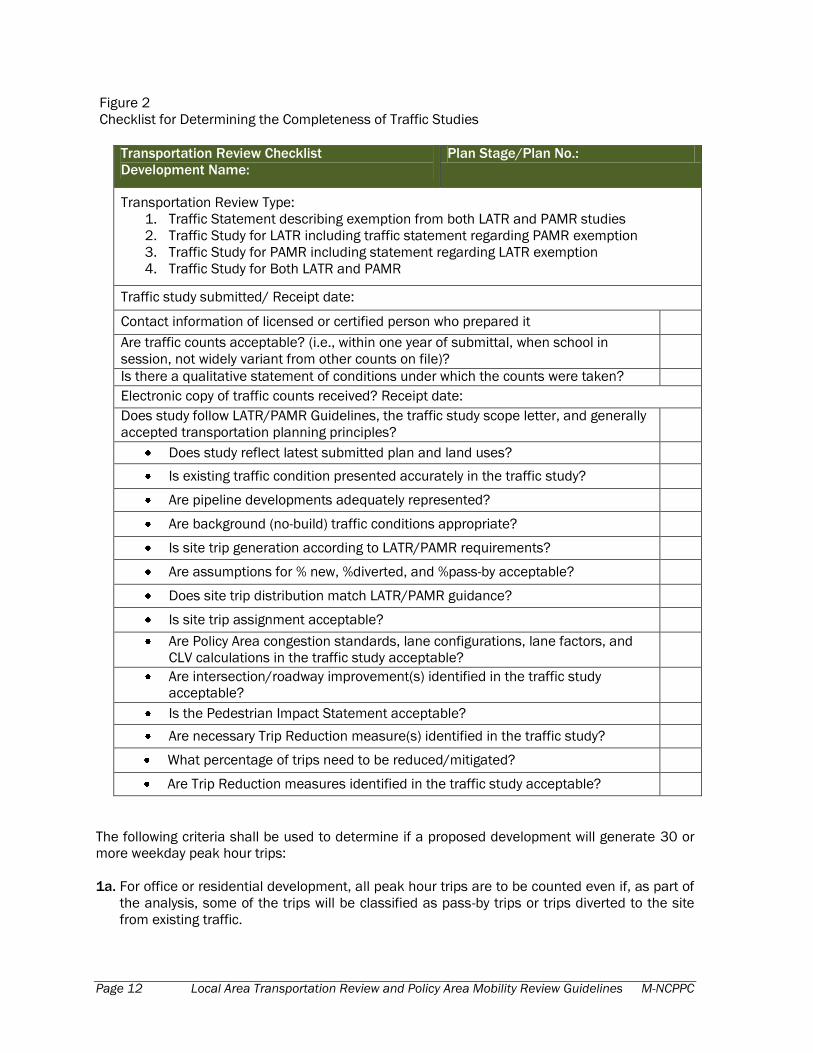
cation, the application will not be considered complete until a traffic study is submitted. Figure 2
is an example of a checklist used by staff for determining the completeness of a traffic study. Any
modifications in the analysis identified by staff’s review are the responsibility of the applicant,
after appropriate oral and/or written notice of the issues identified or change(s) required.
Staff will determine the acceptability of the conclusions and recommendations of a traffic study
in consultation with the applicant, the Montgomery County Department of Transportation
(MCDOT), the Maryland State Highway Authority (SHA), and community representatives. MCDOT
and SHA have 30 working days to review an approved study and comment on the feasibility of
the recommendations, but the staff will work with the applicant to obtain comments from SHA
and MCDOT and transmit them to Transportation Planning staff four weeks prior to a scheduled
Planning Board hearing. As long as a traffic study is determined to be complete, staff will
consider the date of receipt as the completion date. Once a traffic study has been found to be
complete, staff will notify the applicant in writing within 15 working days and, by copy of that
letter, inform representatives of nearby community and/or business groups or associations.
Traffic studies area available for public review from the application general file. Copies can be
made by the public or requested from the applicant and their consultant. A digital copy (in .PDF
format) will also be made available, with an electronic link provided in the Commission’s
Development Activity Information Center (DAIC).
A. Significantly Sized Project
The proposed development must be of sufficient size to have a measurable traffic impact on a
specific local area to be considered in a local area transportation review. Measurable traffic
impact is defined as a development that generates 30 or more total (i.e., existing, new, pass-by
and diverted) weekday trips during the peak hour of the morning (6:30 a.m. to 9:30 a.m.) and/or
evening (4:00 p.m. to 7:00 p.m.) peak period of adjacent roadway traffic.
Page 12 Local Area Transportation Review and Policy Area Mobility Review Guidelines M-NCPPC
Figure 2
Checklist for Determining the Completeness of Traffic Studies
Transportation Review Checklist
Development Name:
Plan Stage/Plan No.:
Transportation Review Type:
1. Traffic Statement describing exemption from both LATR and PAMR studies
2. Traffic Study for LATR including traffic statement regarding PAMR exemption
3. Traffic Study for PAMR including statement regarding LATR exemption
4. Traffic Study for Both LATR and PAMR
Traffic study submitted/ Receipt date:
Contact information of licensed or certified person who prepared it
Are traffic counts acceptable? (i.e., within one year of submittal, when school in
session, not widely variant from other counts on file)?
Is there a qualitative statement of conditions under which the counts were taken?
Electronic copy of traffic counts received? Receipt date:
Does study follow LATR/PAMR Guidelines, the traffic study scope letter, and generally
accepted transportation planning principles?
Does study reflect latest submitted plan and land uses?
Is existing traffic condition presented accurately in the traffic study?
Are pipeline developments adequately represented?
Are background (no-build) traffic conditions appropriate?
Is site trip generation according to LATR/PAMR requirements?
Are assumptions for % new, %diverted, and %pass-by acceptable?
Does site trip distribution match LATR/PAMR guidance?
Is site trip assignment acceptable?
Are Policy Area congestion standards, lane configurations, lane factors, and
CLV calculations in the traffic study acceptable?
Are intersection/roadway improvement(s) identified in the traffic study
acceptable?
Is the Pedestrian Impact Statement acceptable?
Are necessary Trip Reduction measure(s) identified in the traffic study?
What percentage of trips need to be reduced/mitigated?
Are Trip Reduction measures identified in the traffic study acceptable?
The following criteria shall be used to determine if a proposed development will generate 30 or
more weekday peak hour trips:
1a. For office or residential development, all peak hour trips are to be counted even if, as part of
the analysis, some of the trips will be classified as pass-by trips or trips diverted to the site
from existing traffic.
M-NCPPC Local Area Transportation Review and Policy Area Mobility Review Guidelines Page 13
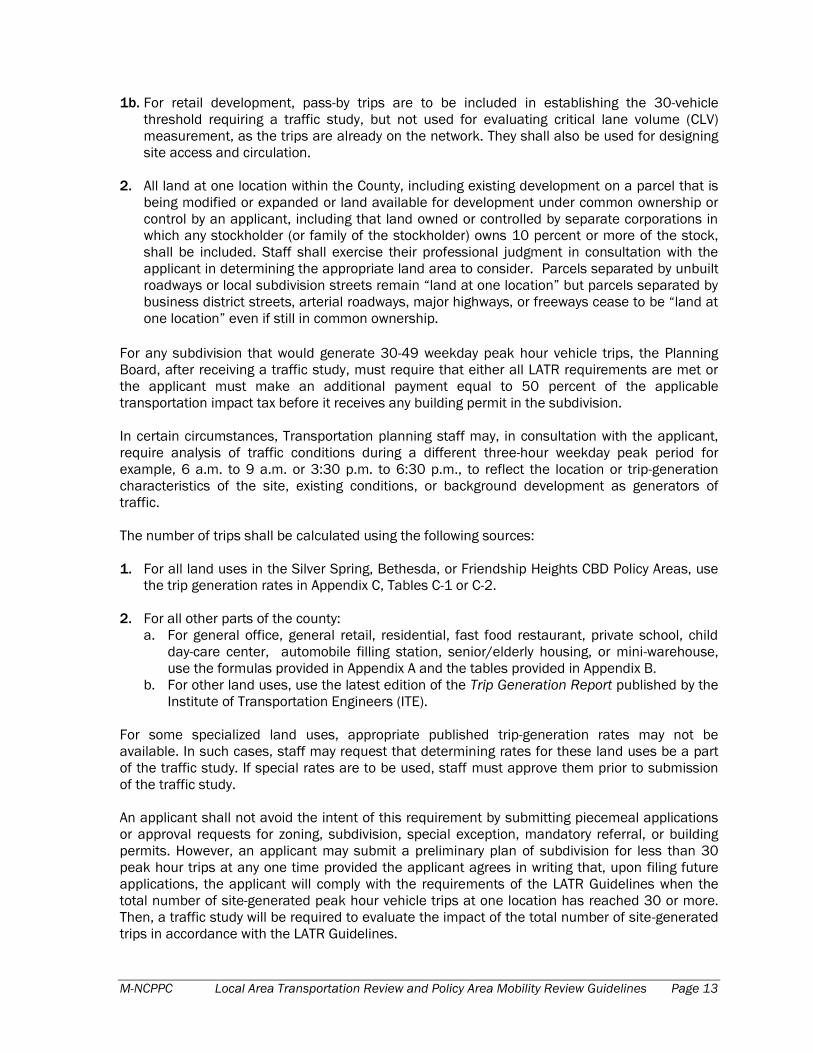
1b. For retail development, pass-by trips are to be included in establishing the 30-vehicle
threshold requiring a traffic study, but not used for evaluating critical lane volume (CLV)
measurement, as the trips are already on the network. They shall also be used for designing
site access and circulation.
2. All land at one location within the County, including existing development on a parcel that is
being modified or expanded or land available for development under common ownership or
control by an applicant, including that land owned or controlled by separate corporations in
which any stockholder (or family of the stockholder) owns 10 percent or more of the stock,
shall be included. Staff shall exercise their professional judgment in consultation with the
applicant in determining the appropriate land area to consider. Parcels separated by unbuilt
roadways or local subdivision streets remain ―land at one location‖ but parcels separated by
business district streets, arterial roadways, major highways, or freeways cease to be ―land at
one location‖ even if still in common ownership.
For any subdivision that would generate 30-49 weekday peak hour vehicle trips, the Planning
Board, after receiving a traffic study, must require that either all LATR requirements are met or
the applicant must make an additional payment equal to 50 percent of the applicable
transportation impact tax before it receives any building permit in the subdivision.
In certain circumstances, Transportation planning staff may, in consultation with the applicant,
require analysis of traffic conditions during a different three-hour weekday peak period for
example, 6 a.m. to 9 a.m. or 3:30 p.m. to 6:30 p.m., to reflect the location or trip-generation
characteristics of the site, existing conditions, or background development as generators of
traffic.
The number of trips shall be calculated using the following sources:
1. For all land uses in the Silver Spring, Bethesda, or Friendship Heights CBD Policy Areas, use
the trip generation rates in Appendix C, Tables C-1 or C-2.
2. For all other parts of the county:
a. For general office, general retail, residential, fast food restaurant, private school, child
day-care center, automobile filling station, senior/elderly housing, or mini-warehouse,
use the formulas provided in Appendix A and the tables provided in Appendix B.
b. For other land uses, use the latest edition of the Trip Generation Report published by the
Institute of Transportation Engineers (ITE).
For some specialized land uses, appropriate published trip-generation rates may not be
available. In such cases, staff may request that determining rates for these land uses be a part
of the traffic study. If special rates are to be used, staff must approve them prior to submission
of the traffic study.
An applicant shall not avoid the intent of this requirement by submitting piecemeal applications
or approval requests for zoning, subdivision, special exception, mandatory referral, or building
permits. However, an applicant may submit a preliminary plan of subdivision for less than 30
peak hour trips at any one time provided the applicant agrees in writing that, upon filing future
applications, the applicant will comply with the requirements of the LATR Guidelines when the
total number of site-generated peak hour vehicle trips at one location has reached 30 or more.
Then, a traffic study will be required to evaluate the impact of the total number of site-generated
trips in accordance with the LATR Guidelines.
Page 14 Local Area Transportation Review and Policy Area Mobility Review Guidelines M-NCPPC
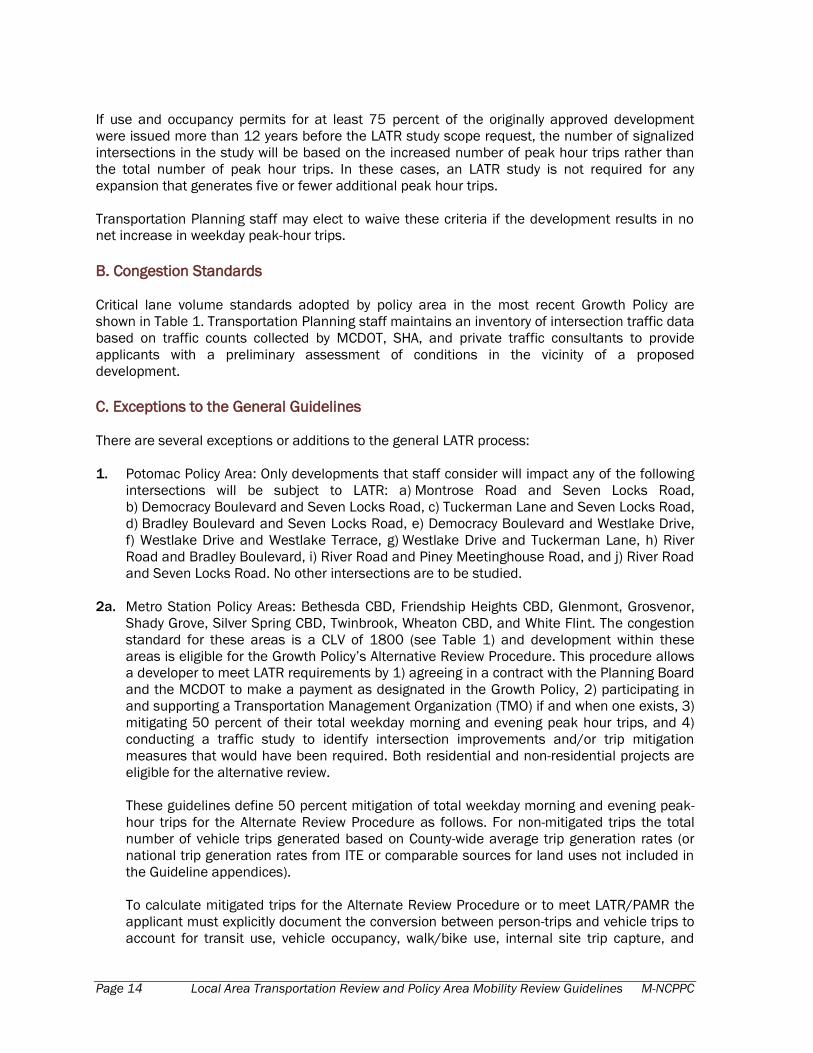
If use and occupancy permits for at least 75 percent of the originally approved development
were issued more than 12 years before the LATR study scope request, the number of signalized
intersections in the study will be based on the increased number of peak hour trips rather than
the total number of peak hour trips. In these cases, an LATR study is not required for any
expansion that generates five or fewer additional peak hour trips.
Transportation Planning staff may elect to waive these criteria if the development results in no
net increase in weekday peak-hour trips.
B. Congestion Standards
Critical lane volume standards adopted by policy area in the most recent Growth Policy are
shown in Table 1. Transportation Planning staff maintains an inventory of intersection traffic data
based on traffic counts collected by MCDOT, SHA, and private traffic consultants to provide
applicants with a preliminary assessment of conditions in the vicinity of a proposed
development.
C. Exceptions to the General Guidelines
There are several exceptions or additions to the general LATR process:
1. Potomac Policy Area: Only developments that staff consider will impact any of the following
intersections will be subject to LATR: a) Montrose Road and Seven Locks Road,
b) Democracy Boulevard and Seven Locks Road, c) Tuckerman Lane and Seven Locks Road,
d) Bradley Boulevard and Seven Locks Road, e) Democracy Boulevard and Westlake Drive,
f) Westlake Drive and Westlake Terrace, g) Westlake Drive and Tuckerman Lane, h) River
Road and Bradley Boulevard, i) River Road and Piney Meetinghouse Road, and j) River Road
and Seven Locks Road. No other intersections are to be studied.
2a. Metro Station Policy Areas: Bethesda CBD, Friendship Heights CBD, Glenmont, Grosvenor,
Shady Grove, Silver Spring CBD, Twinbrook, Wheaton CBD, and White Flint. The congestion
standard for these areas is a CLV of 1800 (see Table 1) and development within these
areas is eligible for the Growth Policy’s Alternative Review Procedure. This procedure allows
a developer to meet LATR requirements by 1) agreeing in a contract with the Planning Board
and the MCDOT to make a payment as designated in the Growth Policy, 2) participating in
and supporting a Transportation Management Organization (TMO) if and when one exists, 3)
mitigating 50 percent of their total weekday morning and evening peak hour trips, and 4)
conducting a traffic study to identify intersection improvements and/or trip mitigation
measures that would have been required. Both residential and non-residential projects are
eligible for the alternative review.
These guidelines define 50 percent mitigation of total weekday morning and evening peak-
hour trips for the Alternate Review Procedure as follows. For non-mitigated trips the total
number of vehicle trips generated based on County-wide average trip generation rates (or
national trip generation rates from ITE or comparable sources for land uses not included in
the Guideline appendices).
To calculate mitigated trips for the Alternate Review Procedure or to meet LATR/PAMR the
applicant must explicitly document the conversion between person-trips and vehicle trips to
account for transit use, vehicle occupancy, walk/bike use, internal site trip capture, and
M-NCPPC Local Area Transportation Review and Policy Area Mobility Review Guidelines Page 15
telecommute options. The estimates should document the effect of home-based work trips
separately from all other trips. Special trip rates in the appendices, such as for office uses
within 1,000 feet of Metrorail stations outside the Beltway, or rates for any uses within the
Bethesda, Silver Spring, and Friendship Heights CBDs should not be used in either non-
mitigated or mitigated trip calculations. Countywide rates found in Appendix A and B are
allowed, otherwise calculation rates and procedures recommended in documents published
by the ITE or the TRB must be applied and referenced for staff to consider the quantification
of any trip reduction proposal.
2b. Development in MSPAs will be reviewed in accordance with Section V of the Guidelines.
These procedures provide specific criteria to satisfy the general guidelines included in the
Growth Policy.
3. Area-specific trip generation rates have been developed for the Bethesda, Friendship
Heights, and Silver Spring CBDs (see Appendix C).
Page 16 Local Area Transportation Review and Policy Area Mobility Review Guidelines M-NCPPC
III. Method and Preparation of
Local Area Transportation Review
Traffic Study A. General Criteria and Analytical Techniques
The following general criteria and analytical techniques are to be used by applicants for
subdivision, zoning, special exceptions, and mandatory referrals when submitting information to
demonstrate the expected impact on public roadway intersections by the proposed development.
The applicant’s analysis should consider existing traffic, potential traffic that will be generated by
their development, and nearby approved but unbuilt development (i.e., background).
The traffic study for a proposed development under consideration must include in background
traffic all developments approved and not yet built and occupied prior to the submission of an
application.
Transportation Planning staff may require that applications in the immediate vicinity of the
subject application filed within the same time frame be included in background traffic, even if
the Planning Board has not approved them. If an application is approved after a traffic study has
been submitted for another project and both require improvements for the same intersection(s),
then the traffic study for the pending application must be updated to account for the traffic and
improvements from the approved application.
Staff has 15 working days to develop a study scope after receiving a written request and will
supply the applicant with information on approved but unbuilt developments, (background
development), nearby intersections for study, trip distribution and traffic assignment guidelines,
and other required information.
The traffic study should be submitted along with the application, following the guidelines in the
Development Review Manual. If a traffic study is submitted at the same time as the application,
the applicant will be notified concerning the completeness of the traffic study within 15 working
days of the Development Review Committee (DRC) meeting at which the application is to be
discussed. If not submitted before the DRC meeting, Transportation staff has 15 working days
after submittal to notify the applicant as to whether or not the traffic study is complete.
For a trip mitigation program or an intersection improvement to be considered for more than one
application, the program or improvement must provide enough capacity to allow all the
applications participating in the program or improvement to satisfy the conditions of LATR. An
intersection improvement may be used by two or more developments to meet LATR even though
construction of the improvement has not been completed and open to the public.
To be considered, the program or improvement must provide sufficient capacity to:
result in a calculated CLV in the total traffic condition that is less than the congestion
standard for that policy area, or
M-NCPPC Local Area Transportation Review and Policy Area Mobility Review Guidelines Page 17
a number of trips equal to 150 percent of the CLV impact attributable to the
development (for the LATR test). Any type of mitigation listed in this document or
acceptable to the Planning Board can be used to achieve this goal.
When development is conditioned upon improvements by more than one application, those
improvements must be bonded, under construction, or under contract for construction prior to
the issuance of building permits for any new development. Construction of an improvement by
one applicant does not relieve other applicants who have been conditioned to make the same
improvement of their responsibility to participate in the cost of that improvement.
If the Planning Board grants an extension of the Adequate Public Facilities requirements, for an
approved preliminary plan for example, Transportation Planning staff will determine if the traffic
study needs to be updated based on the APF validity period, usually three years from the date
originally approved by the Planning Board.
In some cases, a Special Exception modification may be submitted where the observed traffic
reflects a level of activity greater than that already permitted. In such cases, the petitioner must
estimate the reduction in traffic activity that would be caused by reducing the operations to the
permitted level, and use those conditions for establishing adequate public facility impacts.
B. Scope of LATR/PAMR Traffic and Transportation Study
At a meeting or in written correspondence with Transportation Planning staff, the following
aspects of the traffic study will be proposed by the applicant and/or provided by staff and agreed
upon.
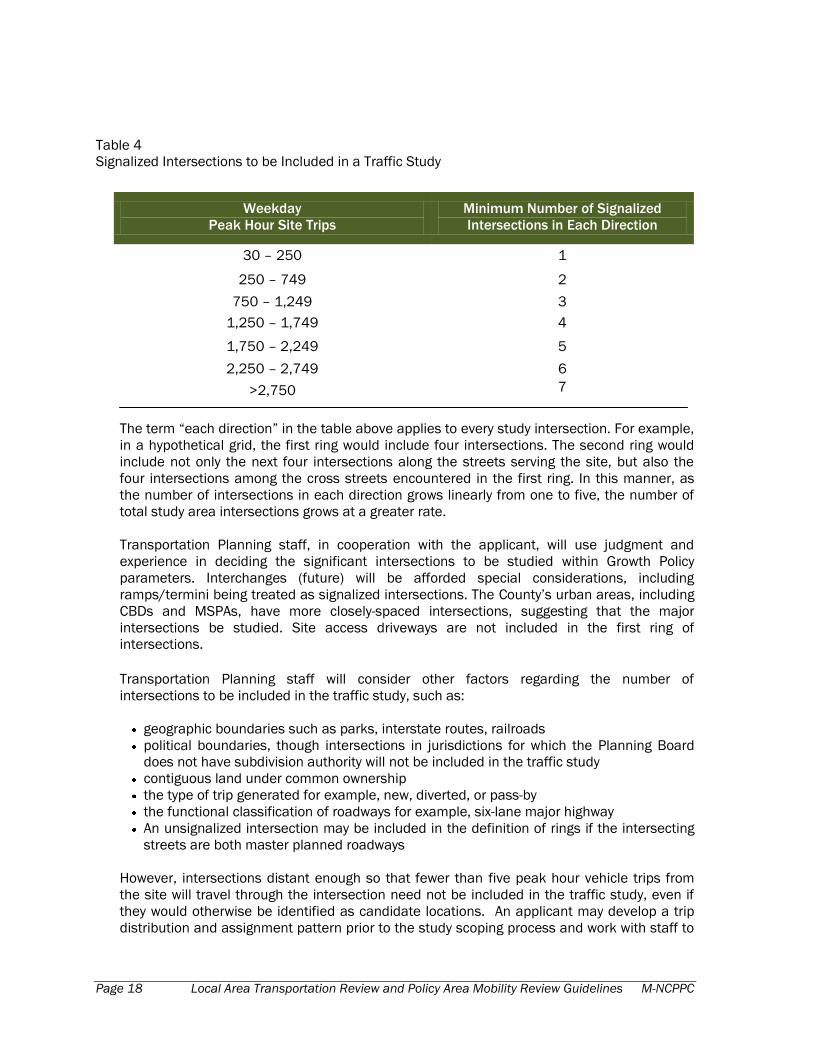
1. Intersections that are to be included in the traffic study. The number of intersections to be
included will be based on the trips generated by the development under consideration (see
Section II.A.2 for specific criteria regarding ―land at one location‖). As a general guideline,
Table 4 indicates the number of signalized intersections from the site in each direction to be
included in the traffic study, based on the maximum number of weekday peak-hour trips
generated by the site, unless staff finds that special circumstances warrant a more limited
study. For large projects, i.e., greater than 750 peak-hour site trips, the number of
intersections shall reflect likely future signalized intersections as determined by staff and the
applicant.
Page 18 Local Area Transportation Review and Policy Area Mobility Review Guidelines M-NCPPC
Table 4
Signalized Intersections to be Included in a Traffic Study
Weekday
Peak Hour Site Trips
Minimum Number of Signalized
Intersections in Each Direction
30 – 250 1
250 – 749 2
750 – 1,249 3
1,250 – 1,749 4
1,750 – 2,249 5
2,250 – 2,749 6
>2,750 7
The term ―each direction‖ in the table above applies to every study intersection. For example,
in a hypothetical grid, the first ring would include four intersections. The second ring would
include not only the next four intersections along the streets serving the site, but also the
four intersections among the cross streets encountered in the first ring. In this manner, as
the number of intersections in each direction grows linearly from one to five, the number of
total study area intersections grows at a greater rate.
Transportation Planning staff, in cooperation with the applicant, will use judgment and
experience in deciding the significant intersections to be studied within Growth Policy
parameters. Interchanges (future) will be afforded special considerations, including
ramps/termini being treated as signalized intersections. The County’s urban areas, including
CBDs and MSPAs, have more closely-spaced intersections, suggesting that the major
intersections be studied. Site access driveways are not included in the first ring of
intersections.
Transportation Planning staff will consider other factors regarding the number of
intersections to be included in the traffic study, such as:
geographic boundaries such as parks, interstate routes, railroads
political boundaries, though intersections in jurisdictions for which the Planning Board
does not have subdivision authority will not be included in the traffic study
contiguous land under common ownership
the type of trip generated for example, new, diverted, or pass-by
the functional classification of roadways for example, six-lane major highway
An unsignalized intersection may be included in the definition of rings if the intersecting
streets are both master planned roadways
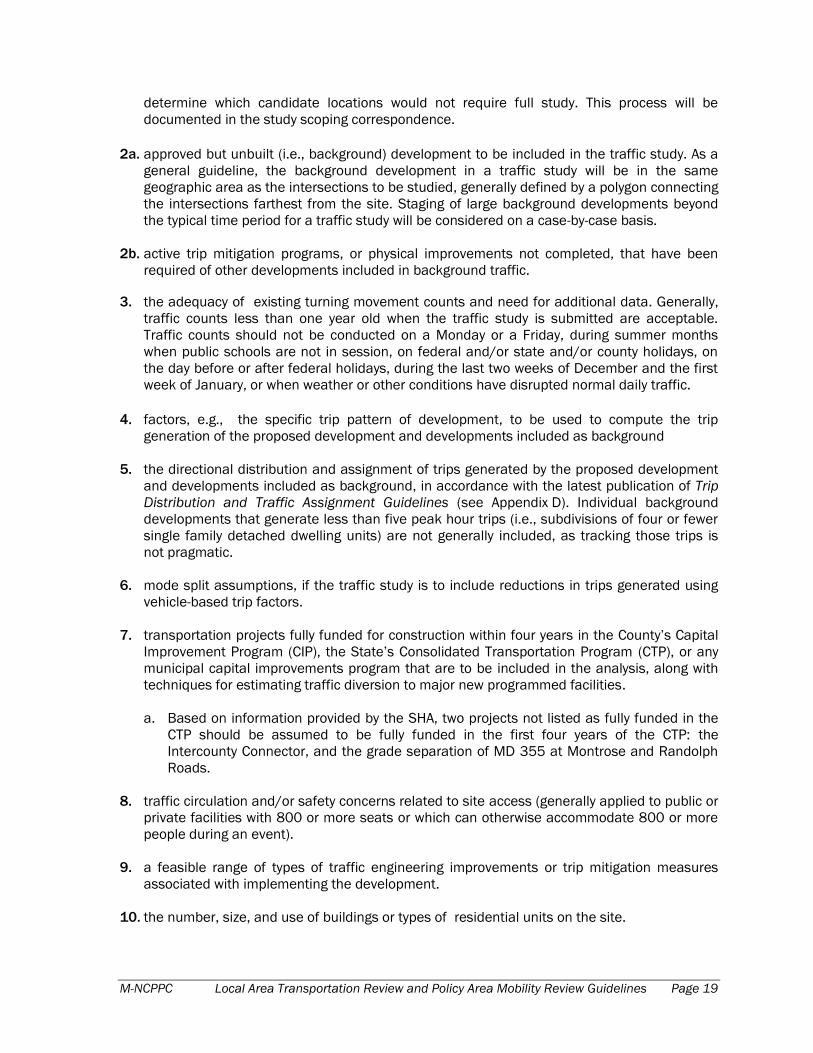
However, intersections distant enough so that fewer than five peak hour vehicle trips from
the site will travel through the intersection need not be included in the traffic study, even if
they would otherwise be identified as candidate locations. An applicant may develop a trip
distribution and assignment pattern prior to the study scoping process and work with staff to
M-NCPPC Local Area Transportation Review and Policy Area Mobility Review Guidelines Page 19
determine which candidate locations would not require full study. This process will be
documented in the study scoping correspondence.
2a. approved but unbuilt (i.e., background) development to be included in the traffic study. As a
general guideline, the background development in a traffic study will be in the same
geographic area as the intersections to be studied, generally defined by a polygon connecting
the intersections farthest from the site. Staging of large background developments beyond
the typical time period for a traffic study will be considered on a case-by-case basis.
2b. active trip mitigation programs, or physical improvements not completed, that have been
required of other developments included in background traffic.
3. the adequacy of existing turning movement counts and need for additional data. Generally,
traffic counts less than one year old when the traffic study is submitted are acceptable.
Traffic counts should not be conducted on a Monday or a Friday, during summer months
when public schools are not in session, on federal and/or state and/or county holidays, on
the day before or after federal holidays, during the last two weeks of December and the first
week of January, or when weather or other conditions have disrupted normal daily traffic.
4. factors, e.g., the specific trip pattern of development, to be used to compute the trip
generation of the proposed development and developments included as background
5. the directional distribution and assignment of trips generated by the proposed development
and developments included as background, in accordance with the latest publication of Trip
Distribution and Traffic Assignment Guidelines (see Appendix D). Individual background
developments that generate less than five peak hour trips (i.e., subdivisions of four or fewer
single family detached dwelling units) are not generally included, as tracking those trips is
not pragmatic.
6. mode split assumptions, if the traffic study is to include reductions in trips generated using
vehicle-based trip factors.
7. transportation projects fully funded for construction within four years in the County’s Capital
Improvement Program (CIP), the State’s Consolidated Transportation Program (CTP), or any
municipal capital improvements program that are to be included in the analysis, along with
techniques for estimating traffic diversion to major new programmed facilities.
a. Based on information provided by the SHA, two projects not listed as fully funded in the
CTP should be assumed to be fully funded in the first four years of the CTP: the
Intercounty Connector, and the grade separation of MD 355 at Montrose and Randolph
Roads.
8. traffic circulation and/or safety concerns related to site access (generally applied to public or
private facilities with 800 or more seats or which can otherwise accommodate 800 or more
people during an event).
9. a feasible range of types of traffic engineering improvements or trip mitigation measures
associated with implementing the development.
10. the number, size, and use of buildings or types of residential units on the site.
Page 20 Local Area Transportation Review and Policy Area Mobility Review Guidelines M-NCPPC
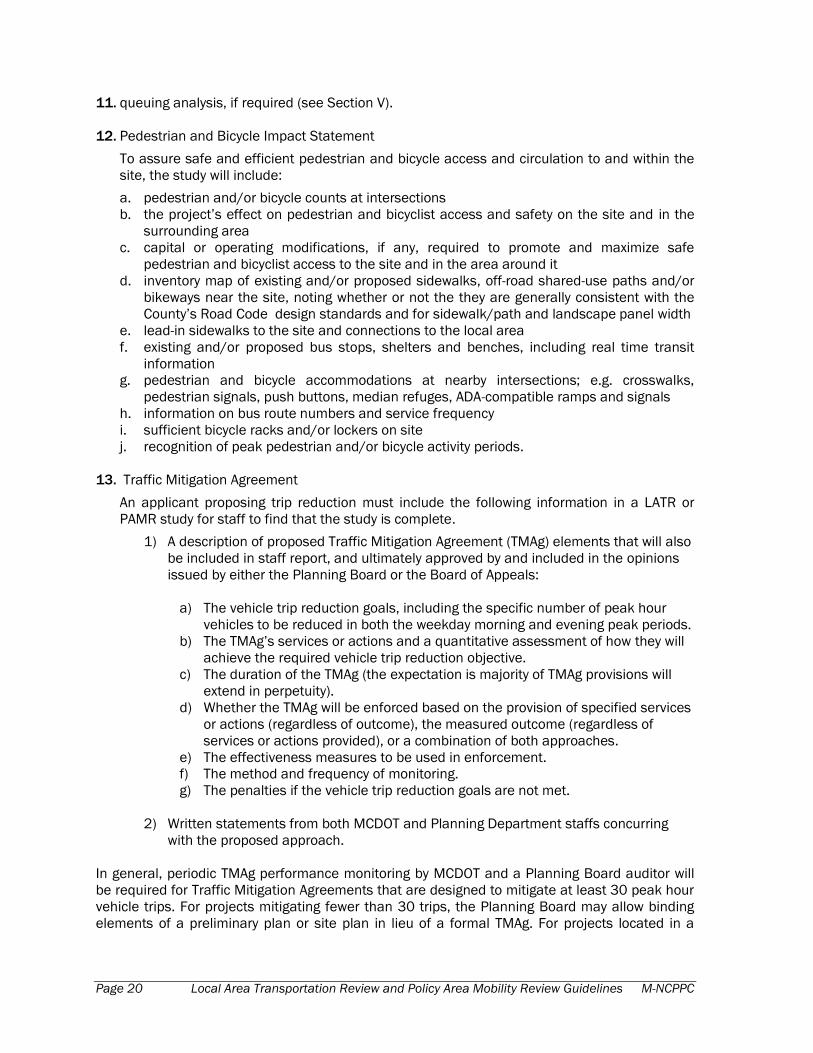
11. queuing analysis, if required (see Section V).
12. Pedestrian and Bicycle Impact Statement
To assure safe and efficient pedestrian and bicycle access and circulation to and within the
site, the study will include:
a. pedestrian and/or bicycle counts at intersections
b. the project’s effect on pedestrian and bicyclist access and safety on the site and in the
surrounding area
c. capital or operating modifications, if any, required to promote and maximize safe
pedestrian and bicyclist access to the site and in the area around it
d. inventory map of existing and/or proposed sidewalks, off-road shared-use paths and/or
bikeways near the site, noting whether or not the they are generally consistent with the
County’s Road Code design standards and for sidewalk/path and landscape panel width
e. lead-in sidewalks to the site and connections to the local area
f. existing and/or proposed bus stops, shelters and benches, including real time transit
information
g. pedestrian and bicycle accommodations at nearby intersections; e.g. crosswalks,
pedestrian signals, push buttons, median refuges, ADA-compatible ramps and signals
h. information on bus route numbers and service frequency
i. sufficient bicycle racks and/or lockers on site
j. recognition of peak pedestrian and/or bicycle activity periods.
13. Traffic Mitigation Agreement
An applicant proposing trip reduction must include the following information in a LATR or
PAMR study for staff to find that the study is complete.
1) A description of proposed Traffic Mitigation Agreement (TMAg) elements that will also
be included in staff report, and ultimately approved by and included in the opinions
issued by either the Planning Board or the Board of Appeals:
a) The vehicle trip reduction goals, including the specific number of peak hour
vehicles to be reduced in both the weekday morning and evening peak periods.
b) The TMAg’s services or actions and a quantitative assessment of how they will
achieve the required vehicle trip reduction objective.
c) The duration of the TMAg (the expectation is majority of TMAg provisions will
extend in perpetuity).
d) Whether the TMAg will be enforced based on the provision of specified services
or actions (regardless of outcome), the measured outcome (regardless of
services or actions provided), or a combination of both approaches.
e) The effectiveness measures to be used in enforcement.
f) The method and frequency of monitoring.
g) The penalties if the vehicle trip reduction goals are not met.
2) Written statements from both MCDOT and Planning Department staffs concurring
with the proposed approach.
In general, periodic TMAg performance monitoring by MCDOT and a Planning Board auditor will
be required for Traffic Mitigation Agreements that are designed to mitigate at least 30 peak hour
vehicle trips. For projects mitigating fewer than 30 trips, the Planning Board may allow binding
elements of a preliminary plan or site plan in lieu of a formal TMAg. For projects located in a
M-NCPPC Local Area Transportation Review and Policy Area Mobility Review Guidelines Page 21
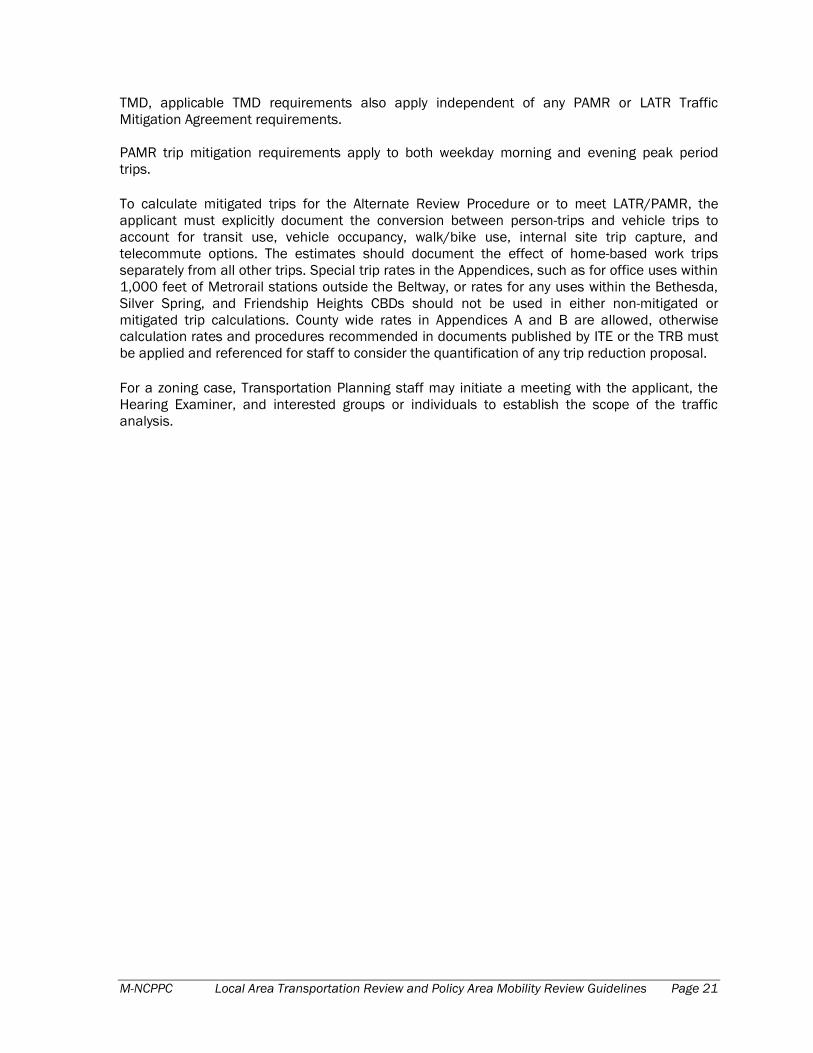
TMD, applicable TMD requirements also apply independent of any PAMR or LATR Traffic
Mitigation Agreement requirements.
PAMR trip mitigation requirements apply to both weekday morning and evening peak period
trips.
To calculate mitigated trips for the Alternate Review Procedure or to meet LATR/PAMR, the
applicant must explicitly document the conversion between person-trips and vehicle trips to
account for transit use, vehicle occupancy, walk/bike use, internal site trip capture, and
telecommute options. The estimates should document the effect of home-based work trips
separately from all other trips. Special trip rates in the Appendices, such as for office uses within
1,000 feet of Metrorail stations outside the Beltway, or rates for any uses within the Bethesda,
Silver Spring, and Friendship Heights CBDs should not be used in either non-mitigated or
mitigated trip calculations. County wide rates in Appendices A and B are allowed, otherwise
calculation rates and procedures recommended in documents published by ITE or the TRB must
be applied and referenced for staff to consider the quantification of any trip reduction proposal.
For a zoning case, Transportation Planning staff may initiate a meeting with the applicant, the
Hearing Examiner, and interested groups or individuals to establish the scope of the traffic
analysis.
Page 22 Local Area Transportation Review and Policy Area Mobility Review Guidelines M-NCPPC
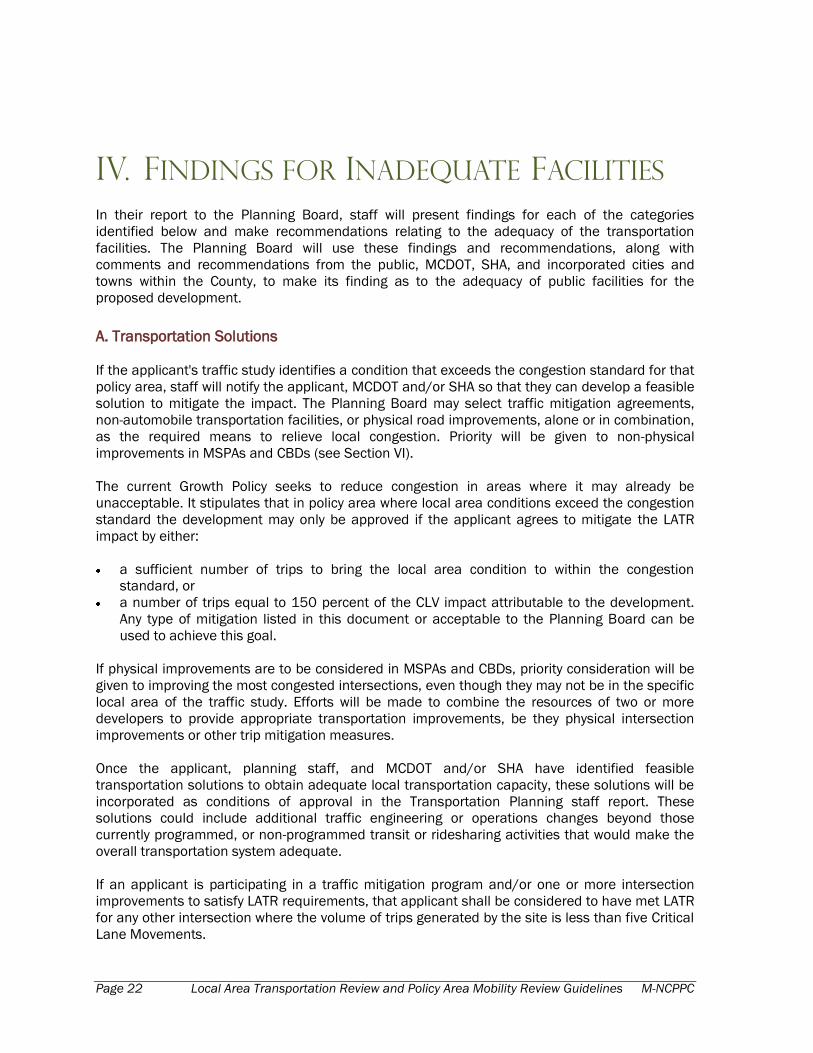
IV. Findings for Inadequate Facilities
In their report to the Planning Board, staff will present findings for each of the categories
identified below and make recommendations relating to the adequacy of the transportation
facilities. The Planning Board will use these findings and recommendations, along with
comments and recommendations from the public, MCDOT, SHA, and incorporated cities and
towns within the County, to make its finding as to the adequacy of public facilities for the
proposed development.
A. Transportation Solutions
If the applicant's traffic study identifies a condition that exceeds the congestion standard for that
policy area, staff will notify the applicant, MCDOT and/or SHA so that they can develop a feasible
solution to mitigate the impact. The Planning Board may select traffic mitigation agreements,
non-automobile transportation facilities, or physical road improvements, alone or in combination,
as the required means to relieve local congestion. Priority will be given to non-physical
improvements in MSPAs and CBDs (see Section VI).
The current Growth Policy seeks to reduce congestion in areas where it may already be
unacceptable. It stipulates that in policy area where local area conditions exceed the congestion
standard the development may only be approved if the applicant agrees to mitigate the LATR
impact by either:
a sufficient number of trips to bring the local area condition to within the congestion
standard, or
a number of trips equal to 150 percent of the CLV impact attributable to the development.
Any type of mitigation listed in this document or acceptable to the Planning Board can be
used to achieve this goal.
If physical improvements are to be considered in MSPAs and CBDs, priority consideration will be
given to improving the most congested intersections, even though they may not be in the specific
local area of the traffic study. Efforts will be made to combine the resources of two or more
developers to provide appropriate transportation improvements, be they physical intersection
improvements or other trip mitigation measures.
Once the applicant, planning staff, and MCDOT and/or SHA have identified feasible
transportation solutions to obtain adequate local transportation capacity, these solutions will be
incorporated as conditions of approval in the Transportation Planning staff report. These
solutions could include additional traffic engineering or operations changes beyond those
currently programmed, or non-programmed transit or ridesharing activities that would make the
overall transportation system adequate.
If an applicant is participating in a traffic mitigation program and/or one or more intersection
improvements to satisfy LATR requirements, that applicant shall be considered to have met LATR
for any other intersection where the volume of trips generated by the site is less than five Critical
Lane Movements.
M-NCPPC Local Area Transportation Review and Policy Area Mobility Review Guidelines Page 23
In the case of developments that elect to use one of the Growth Policy’s alternative review
procedures, the solutions must be identified and agreed to as above but will not be made
conditions of approval.
B. Degree of Local Congestion
Staff will identify the degree of intersection congestion calculated for the peak hour of weekday
morning and evening peak periods using the CLV method and the congestion standards by policy
area listed in Table 1. For intersections that straddle policy area boundaries, the higher
congestion standard shall be used.
In establishing the LATR congestion standards, an approximately equivalent transportation level
of service that balances transit availability with roadway congestion in all policy areas of the
County is assumed. In areas where greater transit accessibility and use exist, greater traffic
congestion is permitted. Table 1, which shows the CLV congestion standard adopted by the
County Council for each policy area, is based on this concept.
Staff will present findings comparing the calculated CLVs with the congestion standards of the
nearby intersections. If the congestion standards are exceeded under background conditions, an
applicant is required to provide a traffic mitigation program (consisting of either or both trip
reduction or intersection improvements). The mitigation program should:
bring the intersection to acceptable levels of congestion, or
result in improved operating conditions equal to 150 percent of the CLV impact attributable
to the development than those that would occur without the applicant’s development.
C. Unavoidable Congestion
Transportation Planning staff will identify the degree to which alternate routes to serve the trips
associated with the proposed development can be considered (see Section VII.F. Trip
Assignment). If there are no appropriate alternate routes to use to avoid the congestion, then it
must be assumed that trips from the proposed development will increase the local area
congestion. It is not appropriate to anticipate that the trips associated with the development
would use local streets other than for site access unless such streets have been functionally
classified as being suitable for handling background and site-generated trips, e.g., arterial,
business district, or higher classifications.
D. Transportation Demand Management Strategies
As part of the traffic study review and approval staff, in coordination MCDOT, will confirm the
degree to which transit, ridesharing, or other TDM activities can be considered to mitigate vehicle
trips generated by a development. If there is sufficient potential for serving the proposed
development and/or immediate area with transit or ridesharing services, then priority will be
given to developing a transit alternative or trip mitigation program to mitigate the development’s
local and policy area traffic impact. If it is physically or fiscally ineffective for the public agencies
to provide transit or ridesharing services, then it must be assumed that trips from the proposed
development will increase the local area congestion. In most cases, TDM strategies will be
included in TMAgs and monitored over time to ensure effectiveness.
Page 24 Local Area Transportation Review and Policy Area Mobility Review Guidelines M-NCPPC
E. Project-Related Traffic
Transportation Planning staff will identify the degree to which local traffic congestion is
attributable to the proposed development. Traffic from three sources will be measured: 1)
existing traffic, 2) background traffic generated by the sum total of all nearby approved but
unbuilt developments, and 3) total trips generated by the proposed development. The more trips
the proposed development contributes to local traffic congestion, the greater the assumed
severity of local impact.
F. Queuing Analysis
In addition to the CLV analysis, staff may require queuing analysis. The generally accepted
practice for evaluating queue lengths in CBDs and MSPAs is to observe the existing maximum
queue during the peak hour and add background and site-generated traffic, assuming LATR lane
distribution factors, a 25-foot average vehicle length, and a division of hourly approach volumes
equally among the number of signal cycles in the peak hour. Alternative methods, such as
simulation using software such as Synchro or CORSIM, may be acceptable if simulation
parameters are agreed to by staff.
The average queue length in the weekday peak hour should not extend more than 80 percent of
the distance to an adjacent signalized intersection, provided the adjacent signalized
intersections are greater than 300 feet apart. The 80 percent standard provides a margin of
safety for peaking. If adjacent signalized intersections are closer together than 300 feet, the
average queue length in the weekday peak hour should not extend more than 90 percent of the
distance to the adjacent signalized intersection.

M-NCPPC Local Area Transportation Review and Policy Area Mobility Review Guidelines Page 25
V. Procedures for Application in
Central Business District and
Metro Station Policy Areas Except where noted, the technical definitions and procedures applied in CBDs and MSPAs will be
consistent with those defined elsewhere in these guidelines. In reviewing CBD and MSPA
applications, staff will use the following criteria.
A. Adequacy of Traffic Flows
1. Any intersection with a CLV of 1,800 or less will, in most cases, be considered acceptable
with no further analysis required. However, staff may require queuing analysis if
abnormally long queuing might be present even at intersections with a CLV below 1,800.
Staff shall notify the applicant in writing as early in the review process as possible, and
no later than written notification of a complete traffic study. The CLV will be calculated in
accordance with the procedures defined in these Guidelines.
2. If the CLV is over 1,800, a queuing analysis shall be performed. Existing queues shall be
measured by the applicant and total traffic (existing, background, and site) and planned
roadway and circulation changes shall be taken into account. The generally accepted
practice for evaluating queue lengths in CBDs and MSPAs is to observe the existing
maximum queue during the peak hour and add background and site-generated traffic,
assuming LATR lane distribution factors, a 25-foot average vehicle length, and a division
of hourly approach volumes equally among the number of signal cycles in the peak hour.
Alternative methods, such as simulation using software such as Synchro or CORSIM, may
be acceptable if simulation parameters are agreed to by staff.
The average queue length in the weekday peak hour should not extend more than 80
percent of the distance to an adjacent signalized intersection, provided the adjacent
signalized intersections are greater than 300 feet apart. The 80 percent standard
provides a margin of safety for peaking. If adjacent signalized intersections are closer
together than 300 feet, the average queue length in the weekday peak hour should not
extend more than 90 percent of the distance to the adjacent signalized intersection. The
assumed signal timing analysis must be consistent with the crossing time required for
pedestrians in paragraph B.2.b. of this section.
If adequate conditions cannot be achieved and no mitigating measures are programmed
that would result in an acceptable CLV, the transportation system in the CBD or MSPA
may not be deemed adequate to support the development.
B. Site Access and Pedestrian/Bicycle Safety
In addition to the traffic flow analysis, applicants must demonstrate that the following guidelines
are not violated by their site development.
Page 26 Local Area Transportation Review and Policy Area Mobility Review Guidelines M-NCPPC
1. Vehicle access points for parking and loading must be located so that they will not
interfere with traffic flows on the adjacent streets or with access points to neighboring
buildings or transit terminal areas. Access directly onto the major roads should be
avoided, but if proposed it will be considered in the context of the application.
2. In addition to the Pedestrian and Bicycle Impact Statement (III.B.12), pedestrian and
bicycle safety shall be assessed based on the following characteristics.
a. Conflicts between pedestrians, bicycles, and vehicles shall be minimized. Actions
shall be taken to ensure pedestrian and bicycle safety on and adjacent to the site.
b. The applicant must provide evidence from MCDOT that the pedestrian phase of the
traffic signal cycle for each approach at the adjacent and critical intersections will
provide at least enough time for pedestrians to completely cross the street walking at
a speed of 3.5 feet per second. Where possible, enough time should be provided to
completely cross while walking at 3.0 feet per second. An additional five seconds
should be added to the minimum crossing time to reflect the delay caused by
pedestrians stepping off the curb in competition with vehicles turning during the walk
cycle.
In MSPA cases where pedestrian crossing time criteria are not met, the applicant
must inform MCDOT and request them to revise the signal timing.
These aspects must be documented in the traffic study submitted as part of the development
application. In the analysis, all pedestrian and bicycle movements are assumed to be made at
the street level.
C. Other Criteria
1. Total traffic is defined as the existing traffic, plus trips from approved but unbuilt
development, plus the trips from the proposed development during the peak hour of the
weekday morning and evening peak periods.
2. Critical intersections are those within the CBD or MSPA, defined by Transportation
Planning staff, generally adjacent to the site, or allowing site traffic to enter an arterial or
major road. In some cases, where site volumes are large, additional intersections within
or contiguous to the CBD or MSPA may be identified by staff for inclusion in the traffic
study.
3. Vehicles can be assigned to parking garages encountered on their trip into the CBD or
MSPA. The capacity of parking garages must be accounted for based on guidance from
the Transportation Planning staff and consultation with MCDOT.
4. Trip generation rates for background and site development traffic are contained in
Appendices A, B, and C.
D. Information Provided by Staff
The following information will be provided to the applicant by Transportation Planning and
MCDOT staffs for use in the traffic study.

M-NCPPC Local Area Transportation Review and Policy Area Mobility Review Guidelines Page 27
1. Existing traffic counts at selected locations. (The applicant shall be required to update
these data if the application is submitted more than one year after the data were initially
gathered.)
2. Trip generation rates
3. Directional distributions (see Appendix D)
4. Parking garage capacity information and locations of future public parking garages
5. A listing of background developments.
E. Traffic Mitigation Agreement
Each applicant in a TMD must have a proposed TMAg (see p.20) outlining a participation plan for
trip reduction measures and other strategies for participating in efforts to achieve the mode
share goals for that area. This plan should be prepared in conjunction with the area’s TMD,
MCDOT, and Transportation Planning staff. The TMAg for TMD participation may be structured to
incorporate any applicable PAMR requirements.
F. Participation in Transportation Improvements
The Planning Board may require that applicants participate in some capital program
transportation improvements. Participation will be proportional to the development impact on the
improvement and will be determined by Transportation Planning staff, MCDOT, and SHA. If the
traffic study identifies roadway changes or other transportation-related activities required to
mitigate the proposed development’s on- or off-site impact, these changes will be the
responsibility of the applicant as part of satisfying LATR procedures.
Page 28 Local Area Transportation Review and Policy Area Mobility Review Guidelines M-NCPPC
VI. Methods to Reduce Local Area
Transportation Review and
Policy Area Mobility Review Impact
A. Methods to Reduce LATR or PAMR Impact for Residential and Non-Residential
Development
1. Traffic Mitigation Agreement Measures
The applicant may be required to reduce LATR and PAMR impact by entering into a
legally-binding agreement with the Planning Board and MCDOT to mitigate the impact of
all or a part of their site-generated trips within the policy area where the site is located.
Each traffic mitigation program will be required to operate for at least 12 years once trip
reduction requirements are initially achieved and after use and occupancy permits are
drawn. Many elements are designed to continue in perpetuity.
The following are examples of the measures that could be included in a TMAg:
Subsidizing transit fares to increase ridership on existing or other transit bus
routes
Constructing a new park-and-ride facility and maintaining it over time
Providing funds to increase use of an existing park-and-ride facility
Funding a private shuttle service; e.g., to and from the site to a nearby Metrorail
station or to a park-and-ride facility
Constructing queue-jumper lanes, providing traffic signal priority treatment for
transit devices and other techniques to improve bus travel times. Only results that
are shown to improve travel times are to be considered.
Parking management activities
Establishing live-near-work programs
Other measures may be suggested by applicants, Transportation Planning staff, or
MCDOT. Creative approaches to reducing traffic impacts are encouraged.
TMAgs require monitoring to ensure compliance with the conditions of the contract.
Monitoring will be done on a quarterly basis, at minimum, at the applicant’s expense by
DWPT staff or a consultant selected by the Planning Board. If the goals are not being
met, MCDOT staff or the consultant shall monitor the TMAg on a monthly basis until the
goals are met for three consecutive months. Transportation Planning staff and MCDOT
shall work with the applicant to seek additional measures to ensure compliance during
periods when the goals are not being met.
M-NCPPC Local Area Transportation Review and Policy Area Mobility Review Guidelines Page 29
2. Non-Automobile Transportation Facilities
To maintain an approximately equivalent transportation local level of service for both
auto and non-auto modes of travel, the Planning Board may permit a reduction in the
amount of roadway improvements or traffic mitigation in exchange for the installation or
construction of non-automobile transportation facilities that will enhance pedestrian
safety or encourage non-automobile mode choices, including sidewalks, bike paths, curb
extensions, countdown pedestrian signals, Super Shelters, bus shelters and benches,
bike lockers, and static or real time transit information signs.
Such facilities must be implemented to offset the local area impact at the intersections
that exceed the congestion standard and the need for an improvement has been
identified. Thus, trip distribution and assignment assumptions are a key factor in
determining local area intersection impacts and the level of trip mitigation required.
In determining the adequacy of such improvements in mitigating local area congestion,
the Planning Board must balance the environmental and community impacts of reducing
congestion at an intersection against the safe and efficient accommodation of
pedestrians, bike riders, and bus patrons. Periodic monitoring shall not be required of
non-automobile transportation facilities.
a. Construction of Sidewalks, Bike Paths, Curb Extensions, Pedestrian Refuge Islands,
Accessible or Countdown Pedestrian Signals, and Handicap Ramps
An applicant may propose to reduce LATR impact by constructing off-site sidewalks
and/or bike paths, curb extensions, pedestrian refuge islands, accessible or
countdown pedestrian signals and handicap ramps that provide safe access from
proposed or existing development to any of the following uses:
Transit stations or stops (rail or bus)
Public facilities (school, library, park, post office, etc.)
Recreation centers
Retail centers that employ 20 or more persons at any time
Housing projects
Office centers that employ 100 or more persons
Existing sidewalks or bike paths
Adjacent development or private amenity space (sitting area, theater, community
center).
Curb extensions may be considered along streets where on-street parking already
exists, provided the extenstions don’t reduce traffic capacity and operations at the
proposed intersections. Accessible pedestrian signals (for the visually-impaired
community), retrofitting existing traffic signals with countdown lights, and
reconstructing existing sub-standard handicap ramps (to current ADA guidelines)
should be allowed as optional facilities.
These uses must be within one-quarter mile of the proposed development. For transit
stations or stops, the frequency of transit service must be at intervals of 20 minutes
or less during the weekday morning and evening peak periods.
Page 30 Local Area Transportation Review and Policy Area Mobility Review Guidelines M-NCPPC
New bikeway segments can be indentified from the Countywide Bikeway Functional
Master Plan. The Plan’s prioritization strategy lists bikeways categorized by activity
center for example, Metro stations, CBDs, park trails, etc.
b. Provision of Super Shelters, Bus Shelters, and Benches
An applicant may propose to reduce LATR impact by constructing a ―Super Shelter,‖
bus shelter or bench, including a concrete pad, to encourage bus use, which reduces
weekday peak-hour vehicle trips by diverting some person-trips to buses. Two types
of shelters can be provided: standard bus shelters and Super Shelters.
The County has an agreement with Clear Channel Outdoor, Inc. (CCO) to provide a
minimum of 500 standard bus shelters in the County. CCO has first choice of
locations for these shelters, a number of which will carry advertising. Standard
bus shelters to be provided under LATR must be located in areas where CCO
chooses not to provide shelters. CCO must be offered right of first refusal for any
new sites before shelter placement is accepted from the developer.
―Super Shelters‖ include heating and lighting, have larger capacity, four walls
(with openings to enter and exit), and a higher level of design than standard
shelters. A Super Shelter is located on Rockville Pike near Marinelli Road (as part
of an agreement with Target/Home Depot). These shelters may be provided only
at locations where CCO has chosen not to provide shelters. If agreed to by
MCDOT and the developer, Super Shelters should be incorporated as part of
development planning and will need to be coordinated with existing and planned
locations for standard shelters.
All bus shelters must be on a bus route, at an existing stop, within one-quarter mile of
the edge of the proposed development. The frequency of the transit service must be
at intervals of 20 minutes or less during the weekday morning and evening peak
periods.
For any off-site improvement shown in Table 5, pedestrians and bicyclists should be
able to safely cross any roadway to reach their destination. The applicant may
provide improvements that Transportation Planning and MCDOT staffs agree would
increase the safety of the crossing.
c. Provision of Bike Lockers
An applicant may propose to reduce LATR impact by providing bike lockers for a
minimum of eight bikes at an activity center located within a one-mile radius of the
edge of the development.
d. Provision of Transit Information Signs and Kiosks
An applicant may propose to reduce LATR impact by providing static or electronic
signs, and/or information kiosks at bus shelters, large office buildings, retail centers,
transit centers, or residential complexes. They should communicate scheduled or
real-time transit information, for example, the scheduled or estimated arrival of the
next bus on a given route.
M-NCPPC Local Area Transportation Review and Policy Area Mobility Review Guidelines Page 31
Static transit information signs may be provided only at locations other than CCO-
provided standard bus shelters, since the CCO agreement already provides for type of
information. For static transit information provided at office buildings, retail centers,
etc., the applicant should provide for changing this information three times a year.
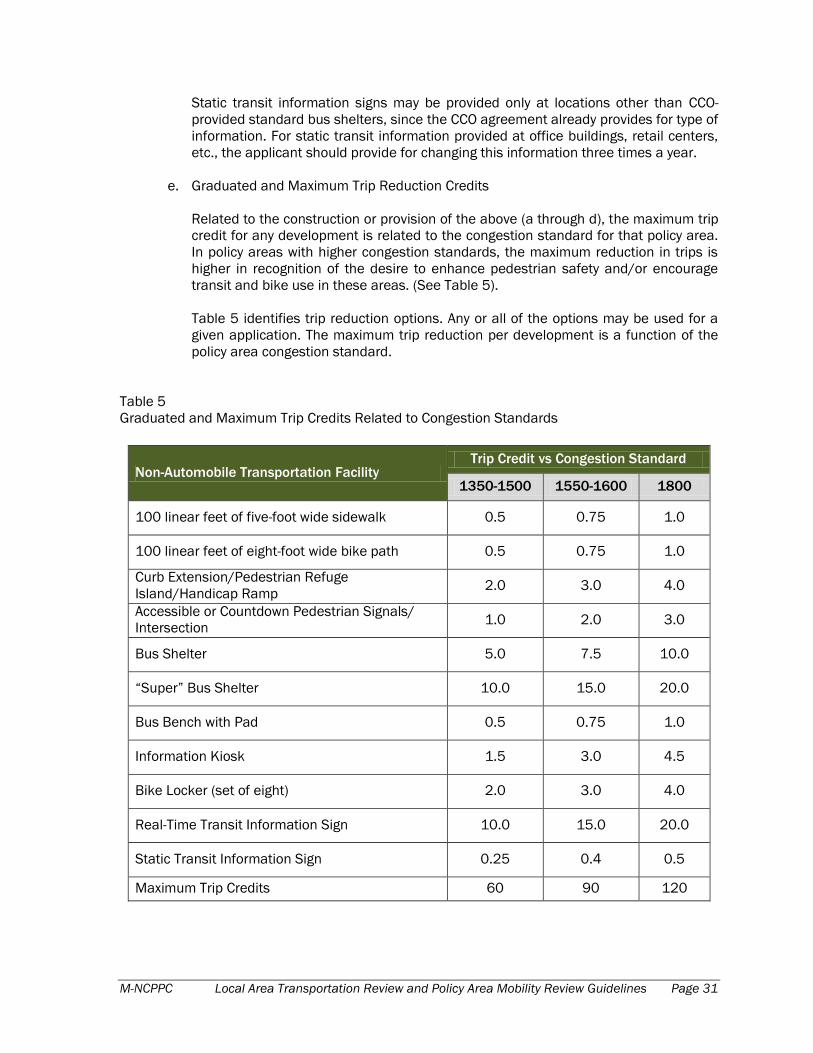
e. Graduated and Maximum Trip Reduction Credits
Related to the construction or provision of the above (a through d), the maximum trip
credit for any development is related to the congestion standard for that policy area.
In policy areas with higher congestion standards, the maximum reduction in trips is
higher in recognition of the desire to enhance pedestrian safety and/or encourage
transit and bike use in these areas. (See Table 5).
Table 5 identifies trip reduction options. Any or all of the options may be used for a
given application. The maximum trip reduction per development is a function of the
policy area congestion standard.
Table 5
Graduated and Maximum Trip Credits Related to Congestion Standards
Non-Automobile Transportation Facility Trip Credit vs Congestion Standard
1350-1500 1550-1600 1800
100 linear feet of five-foot wide sidewalk 0.5 0.75 1.0
100 linear feet of eight-foot wide bike path 0.5 0.75 1.0
Curb Extension/Pedestrian Refuge
Island/Handicap Ramp 2.0 3.0 4.0
Accessible or Countdown Pedestrian Signals/
Intersection 1.0 2.0 3.0
Bus Shelter 5.0 7.5 10.0
―Super‖ Bus Shelter 10.0 15.0 20.0
Bus Bench with Pad 0.5 0.75 1.0
Information Kiosk 1.5 3.0 4.5
Bike Locker (set of eight) 2.0 3.0 4.0
Real-Time Transit Information Sign 10.0 15.0 20.0
Static Transit Information Sign 0.25 0.4 0.5
Maximum Trip Credits 60 90 120
Page 32 Local Area Transportation Review and Policy Area Mobility Review Guidelines M-NCPPC
B. Procedures for Applying Section VI – Trip Reduction Methods
The determination of the total number of trips generated by a proposed development will be
made prior to any reduction. If a proposed development generated more than 30 total weekday
peak-hour trips, a traffic study would be required. If an applicant proposes a traffic mitigation
agreement or non-automobile transportation facilities, the reduction will be accounted for in the
traffic study. An applicant proposing these trip reduction strategies may be required to gather
data on current bus patronage or pedestrian/bicycle activity within the local area to aid in
evaluating effectiveness.
The applicant may only apply a trip reduction method after the total number of peak-hour trips is
determined using standard trip rates.
C. Payment Instead of Construction
For requirements of LATR where an applicant has made a good faith effort to implement an
acceptable improvement and where the Board finds that a desirable improvement cannot
feasibly be implemented by the applicant but that it can be implemented by a public agency
within four years after the subdivision is approved, The County Council has authorized the
Planning Board to accept payment to the County of a fee commensurate with the cost of the
required improvement.
M-NCPPC Local Area Transportation Review and Policy Area Mobility Review Guidelines Page 33
VII. Assigning Values to
Traffic Study Factors A. Capital Improvements Program Definition
If the applicant finds it necessary or appropriate to incorporate programmed transportation
improvements into a traffic study, they must rely upon the County’s Capital Improvement
Program (CIP) or the State’s Consolidated Transportation Program (CTP). For an improvement to
qualify for use in a traffic study, it must be fully funded in the CIP or CTP for construction within
four years as of the date of the traffic study’s submission.
However, under certain circumstances, staff may recommend the Planning Board delay a
decision on physical intersection improvements until building permit, when the County or State is
ready to purchase or construct a capital project. The Planning Board would require the developer
to consult with the County or State when building permit applications are filed. If the County or
State agrees in writing that the capital project will be constructed within four years, then the
developer will contribute an amount equivalent to the cost of the LATR improvements at that
time.
B. Trip Generation
Trip generation equations and rates are shown in Appendix A for nine general land uses: general
office, retail, residential, fast food restaurants, child day care centers, private
schools/educational institutions, senior/elderly housing, mini-warehouse, and automobile filling
stations with or without ancillary uses for car washes, convenience stores, and garages.
Equations for calculating trips from other land uses or zoning classifications can be obtained
from ITE’s latest edition of the Trip Generation report. Guidance regarding pass-by and internal
trip capture rates can be found in the current ITE Trip Generation Handbook (2nd Edition). Staff
can assist in calculating tips and/or using the trip tables in Appendix B. In the Silver Spring,
Bethesda, and Friendship Heights CBDs, different rates reflecting higher transit use apply (see
Appendix C).
The rate for a retail site over 200,000 square feet GLA will be set after discussion with staff and
the applicant’s analysis of one or more similar-sized retail sites within Montgomery County. In
lieu of data collection, a retail rate set at two times the latest edition of ITE’s Trip Generation
report rate may be used.
Transportation Planning staff is authorized to make minor technical changes to Appendices A, B,
and C as needed to reflect new information or to correct errors. Users should check with staff to
ensure they are using the latest version.
In some cases, adjusting the trips from the equations may be appropriate. Examples include the
effect of pass-by trips for retail, including fast food restaurants, child day care centers, and
automobile filling stations, and the total trips from mixed uses such as office and retail. These
will be considered on a case-by-case basis, using the best available information concerning each
site situation. There may be instances where site characteristics will make it appropriate to
deviate from the referenced rates. These proposed deviations could be determined by ground

Page 34 Local Area Transportation Review and Policy Area Mobility Review Guidelines M-NCPPC
counts of comparable facilities, preferably in Montgomery County, and will be considered by staff
and used with their concurrence.
C. Peak Hour
The traffic study shall be based on the highest one-hour period that occurs during the typical
weekday morning (6:30 a.m. – 9:30 a.m.) and/or evening (4 p.m. – 7 p.m.) peak periods, i.e., the
street peak, or the time period established and agreed to in Section II.A. This one-hour period
shall be determined from the highest sum of the existing traffic entering all approaches to each
intersection during four consecutive 15-minute intervals.
D. Trip Distribution
Staff shall provide the applicant with the directional distribution of background and site traffic
generated by office and residential uses, per the latest edition of the Trip Distribution and Traffic
Assignment Guidelines (see Appendix D). The distribution of trips entering and leaving the
proposed development and background development via all access points must be justified by
the relative locations of other traffic generators (employment centers, commercial centers,
regional or area shopping centers, transportation terminals, or trip table information provided by
staff). For land uses not covered by the guidelines, distribution should be developed in
consultation with Transportation Planning staff.
E. Directional Split
The directional split is the percentage of the generated trips entering or leaving the site during
the peak hour. Refer to Appendix A for the directional split for general land uses and to Appendix
C for directional split assumptions for the Bethesda, Friendship Heights, and Silver Spring CBDs.
For all other uses, refer to the latest edition of ITE’s Trip Generation report. If data are not
available, staff and the applicant will determine an appropriate in/out directional split.
F. Trip Assignment
The distribution factors furnished by Transportation Planning staff shall be applied to the
generated trips, and the resulting volumes assigned to the road network providing access to the
proposed development. These trips will be added to existing traffic as well as the trips generated
by background development to determine the adequacy of transportation facilities. The
assignment is to be extended to the nearest major intersection, or intersections, as determined
by staff (see Table 4).
Trip distribution and assignment is an estimate of the impact of future traffic on the nearby road
network and is less accurate farther from the trip origin/destination.
Once an intersection under assignment conditions of existing plus background traffic or existing
plus background plus site-generated traffic exceeds a CLV of 2,000, diversions to alternate
routes may be considered if there are feasible alternatives, as discussed in paragraph IV.C.,
Unavoidable Congestion. Appropriate balancing of assignments to reflect impacts of the site on
both the primary and alternate routes is necessary. Impacts on the primary and alternate
intersections must be identified and mitigated in accordance with the congestion standards of
these Guidelines. Such situations should be discussed with staff, SHA, and MCDOT and resolved
on a case-by-case basis before presentation to the Planning Board.
M-NCPPC Local Area Transportation Review and Policy Area Mobility Review Guidelines Page 35
G. Critical Lane Volume Analysis
At the intersections identified by Transportation Planning staff, the existing, background, and
site-generated traffic is to be related to the adequacy of the intersection by using the critical lane
volume method (see Section J). The methodology and assumptions shall be updated to maintain
consistency with revisions to the Highway Capacity Manual published by the TRB. The analysis
should be carried out for the peak hour of both the weekday morning and evening peak periods
and should use traffic data for non-holiday weekdays.
H. Traffic Data
1. Current existing traffic volume data may be available from either Transportation
Planning’s traffic count database, SHA or MCDOT.
2. New traffic counts should be conducted by the applicant if, in the opinion of
Transportation Planning staff, traffic volumes have increased due to some change in the
traffic pattern, such as the completion of a development project after the count was
made.
3. If turning movement data are older than one year when the traffic study is submitted or,
if there are locations for which data are non-existent, it must be acquired by the applicant
using his/her own resources.
4. Intersection traffic counts obtained from public agencies or conducted by the applicant
must be manual turning movement counts of vehicles and pedestrian/bicycle crossing
volumes covering the typical weekday peak periods, i.e., 6:30 a.m. – 9:30 a.m. and 4
p.m. – 7 p.m., or the time period established and agreed to in Section II.A. The data must
be collected in 15-minute intervals to allow selection of the peak hour within the nearest
15 minutes (4:00-5:00, 4:15-5:15, 4:30-5:30, 4:45-5:45, 5:00-6:00, 5:15-6:15, 5:30-
6:30, 5:45-6:45, or 6:00-7:00) as described in Section VII.C. All weekday peak-period
(6:30 a.m. – 9:30 a.m. and 4 p.m. – 7 p.m.) turning movement data are required to be
included with and submitted as part of the applicant’s traffic study. All intersection traffic
counts must be submitted in a digital format provided by staff. The subsequent digital
database will be available upon request to developers, consultants, and others.
5. Traffic counts affected by adverse weather or nearby traffic incidents will not be
accepted.
6. For applicants resubmitting all or portions of their development plans for the Planning
Board’s approval under the expired Expedited Development Approval legislation that
requires LATR, the traffic study must be updated if the traffic counts were collected more
than one year from the date of resubmittal, and must reflect updated background
development.
I. Adequate Accommodation of Traffic
A highway system’s ability to carry traffic is expressed in level of congestion at critical locations,
usually an intersection. Current CLV congestion standards for intersections in each policy are
(Table 1) are based on achieving approximately equivalent total transportation levels of service
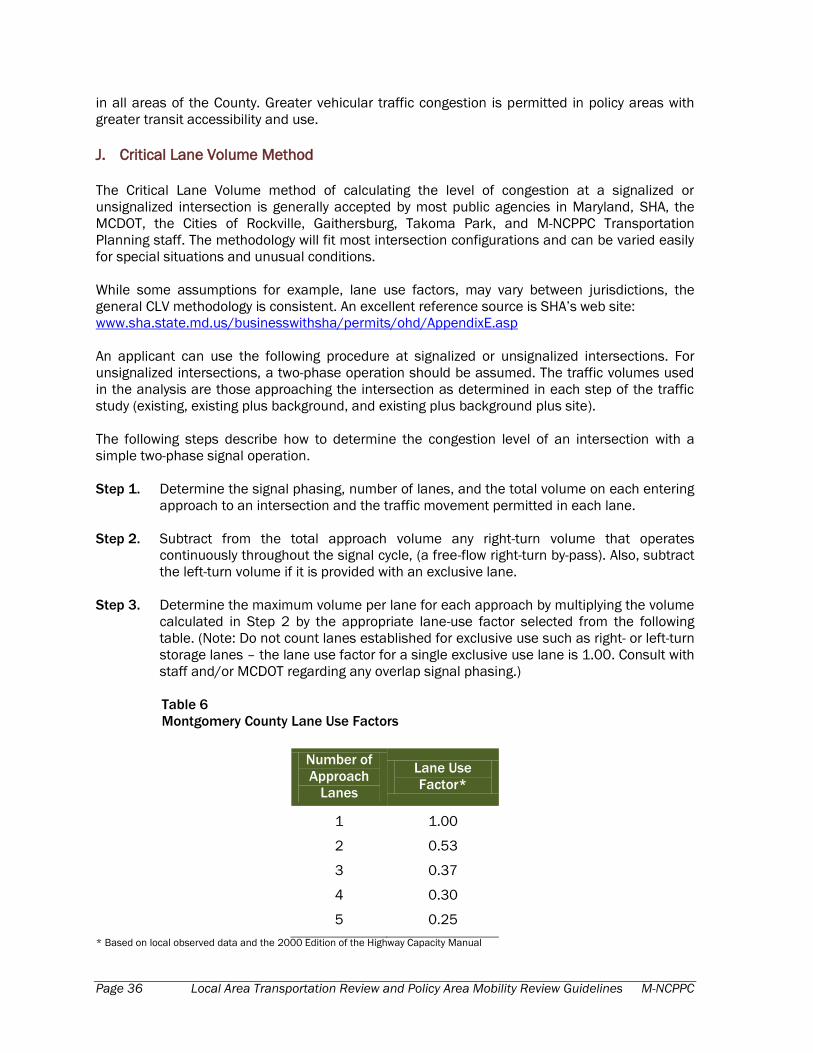
Page 36 Local Area Transportation Review and Policy Area Mobility Review Guidelines M-NCPPC
in all areas of the County. Greater vehicular traffic congestion is permitted in policy areas with
greater transit accessibility and use.
J. Critical Lane Volume Method
The Critical Lane Volume method of calculating the level of congestion at a signalized or
unsignalized intersection is generally accepted by most public agencies in Maryland, SHA, the
MCDOT, the Cities of Rockville, Gaithersburg, Takoma Park, and M-NCPPC Transportation
Planning staff. The methodology will fit most intersection configurations and can be varied easily
for special situations and unusual conditions.
While some assumptions for example, lane use factors, may vary between jurisdictions, the
general CLV methodology is consistent. An excellent reference source is SHA’s web site:
www.sha.state.md.us/businesswithsha/permits/ohd/AppendixE.asp
An applicant can use the following procedure at signalized or unsignalized intersections. For
unsignalized intersections, a two-phase operation should be assumed. The traffic volumes used
in the analysis are those approaching the intersection as determined in each step of the traffic
study (existing, existing plus background, and existing plus background plus site).
The following steps describe how to determine the congestion level of an intersection with a
simple two-phase signal operation.
Step 1. Determine the signal phasing, number of lanes, and the total volume on each entering
approach to an intersection and the traffic movement permitted in each lane.
Step 2. Subtract from the total approach volume any right-turn volume that operates
continuously throughout the signal cycle, (a free-flow right-turn by-pass). Also, subtract
the left-turn volume if it is provided with an exclusive lane.
Step 3. Determine the maximum volume per lane for each approach by multiplying the volume
calculated in Step 2 by the appropriate lane-use factor selected from the following
table. (Note: Do not count lanes established for exclusive use such as right- or left-turn
storage lanes – the lane use factor for a single exclusive use lane is 1.00. Consult with
staff and/or MCDOT regarding any overlap signal phasing.)
Table 6
Montgomery County Lane Use Factors
Number of
Approach
Lanes
Lane Use
Factor*
1
2
3
4
5
1.00
0.53
0.37
0.30
0.25
* Based on local observed data and the 2000 Edition of the Highway Capacity Manual
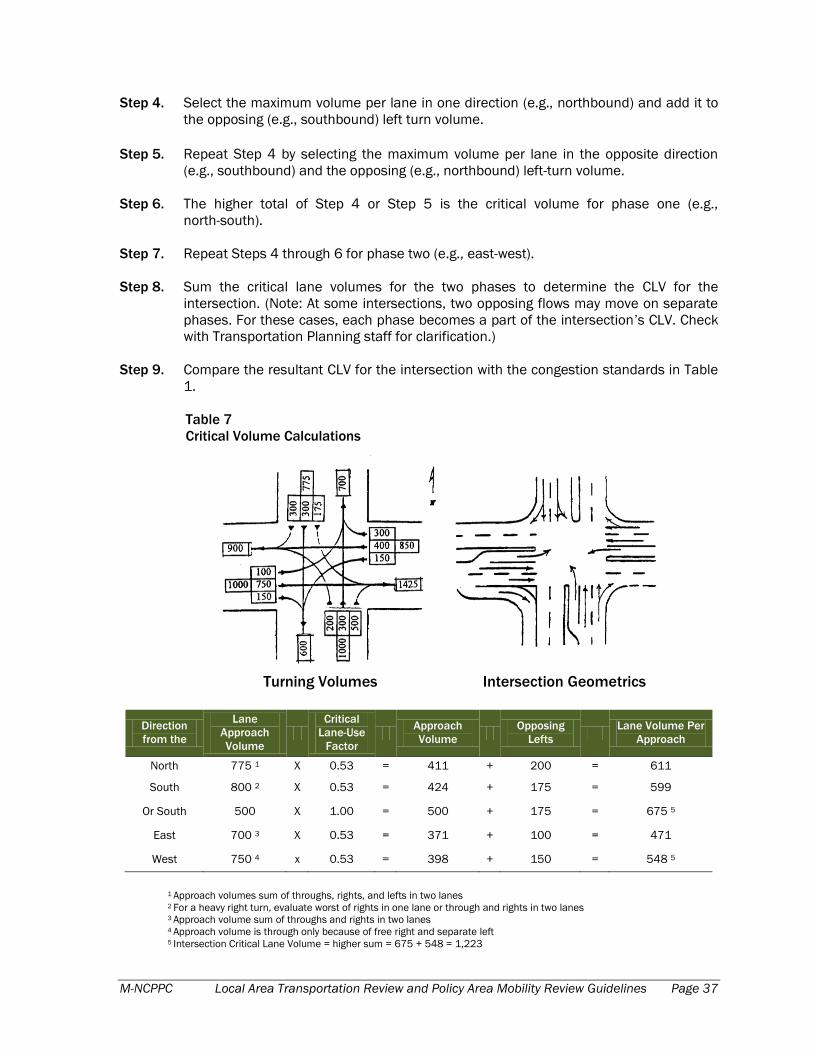
M-NCPPC Local Area Transportation Review and Policy Area Mobility Review Guidelines Page 37
Step 4. Select the maximum volume per lane in one direction (e.g., northbound) and add it to
the opposing (e.g., southbound) left turn volume.
Step 5. Repeat Step 4 by selecting the maximum volume per lane in the opposite direction
(e.g., southbound) and the opposing (e.g., northbound) left-turn volume.
Step 6. The higher total of Step 4 or Step 5 is the critical volume for phase one (e.g.,
north-south).
Step 7. Repeat Steps 4 through 6 for phase two (e.g., east-west).
Step 8. Sum the critical lane volumes for the two phases to determine the CLV for the
intersection. (Note: At some intersections, two opposing flows may move on separate
phases. For these cases, each phase becomes a part of the intersection’s CLV. Check
with Transportation Planning staff for clarification.)
Step 9. Compare the resultant CLV for the intersection with the congestion standards in Table
1.
Table 7
Critical Volume Calculations
Turning Volumes Intersection Geometrics
Direction
from the
Lane
Approach
Volume
Critical
Lane-Use
Factor
Approach
Volume
Opposing
Lefts
Lane Volume Per
Approach
North 775 1 X 0.53 = 411 + 200 = 611
South 800 2 X 0.53 = 424 + 175 = 599
Or South 500 X 1.00 = 500 + 175 = 675 5
East 700 3 X 0.53 = 371 + 100 = 471
West 750 4 x 0.53 = 398 + 150 = 548 5
1 Approach volumes sum of throughs, rights, and lefts in two lanes
2 For a heavy right turn, evaluate worst of rights in one lane or through and rights in two lanes 3 Approach volume sum of throughs and rights in two lanes 4 Approach volume is through only because of free right and separate left 5 Intersection Critical Lane Volume = higher sum = 675 + 548 = 1,223
Page 38 Local Area Transportation Review and Policy Area Mobility Review Guidelines M-NCPPC
The following conditions should be observed where applicable:
Right turn overlaps can be assumed where an exclusive right turn lane exists.
The CLV for five leg intersections should be addressed according to the individual signal
phases identified in the field.
In cases where pedestrian crossing time criteria are not met, the applicant must inform
MCDOT and request that they revise the signal timing.
The CLV calculation for roundabouts should calculate the sum of the approach flow and
circulating flows, as defined by the Highway Capacity Manual, for each approach and
comparing the highest sum to the LATR standards.
K. Required Traffic Study Submittals to Satisfy Local Area Transportation Review
Two copies of the traffic study must be submitted with the development application. Once
Transportation Planning staff confirms that the traffic study is complete, 10 copies must be
submitted within five working days of notification.
In an effort to standardize the information included with a traffic study, the following items must
be submitted before the application is considered complete.
1. A site or area map showing existing roads that serve the site.
2. The location on the site map of any CIP or CTP programmed transportation improvements
that affect traffic at the critical intersections.
3. Name and contact information of the licensed or certified professional submitting the
traffic study. Any traffic study required for LATR must be submitted by a registered
Professional Engineer (PE), Certified Professional Traffic Operations Engineer (PTOE), or
Certified Professional Transportation Planner (PTP). This requirement will be effective for
studies submitted after July 1, 2008.
4. Existing weekday morning and evening peak period vehicle and pedestrian/bicycle traffic
count summaries for the critical intersections identified by Transportation Planning staff.
It will include a qualitative statement regarding the observed traffic conditions if, during
the time period that the counts were obtained, any queuing from downstream locations
or other operational issues were observed.
5. Nearby approved but unbuilt developments and associated improvements that would
affect traffic at the critical intersections with their location shown on the area map. (This
information is provided by staff and included as part of the traffic study.)
6. A table showing the weekday morning and evening peak hour trips generated by each of
the nearby approved but unbuilt developments, including the source of the generation
rates/equations for each type of development.
7. The trip distribution patterns, as percentages, for nearby approved but unbuilt
developments during the weekday morning and evening peak hours, with the pattern
being shown on an area map.
8. Weekday morning and evening peak hour trips entering and leaving the site, generated
by the proposed development, including the site driveways.
M-NCPPC Local Area Transportation Review and Policy Area Mobility Review Guidelines Page 39
9. The trip distribution patterns, as percentages, for the proposed development
during the weekday morning and evening peak hours, with the pattern being
shown on an area map.
10. Maps that show separately and in combination:
a. Existing weekday morning and evening peak hour traffic volumes using the
affected highway system, including turning movements at the critical
intersections.
b. Projected weekday morning and evening peak hour trips assigned to the
affected highway system for all nearby approved developments, included as
part of the background.
c. The traffic volumes derived by adding trips from approved development to
existing traffic.
d. Projected weekday morning and evening peak hour trips assigned to the
affected highway system for the proposed development.
e. The traffic volumes derived by adding site trips to the sum of existing plus
background traffic.
11. Any study performed to help determine how to assign recorded or proposed
development trips, such as a license plate study or special turning movement
counts.
12. Copies of all critical lane volume analyses, showing calculations for each
approach.
13. A list of all transportation improvements, if any, that the applicant agrees to
provide and a scaled drawing of each improvement showing available or needed
right-of-way, proposed roadway widening, and area available for sidewalks, bike
path, landscaping, as required.
14. Electronic copies of all vehicle, pedestrian, and bicycle traffic counts in
approved digital format submitted to [email protected]. Traffic
counts affected by adverse weather or nearby traffic incidents will not be
accepted.
15. Once accepted, a copy of the traffic study as a PDF will be submitted to staff
for inclusion in the application file and available for public view via the web site’s
Development Activity Information Center or FTP.

Page 40 Local Area Transportation Review and Policy Area Mobility Review Guidelines M-NCPPC
VIII. Policy Area Mobility Review
A. Background
There are two components to PAMR—Relative Arterial Mobility and Relative Transit Mobility for
each policy area.
Relative Arterial Mobility measures congestion on the County’s arterial roadway network. It is
based on the urban street delay level of service in the 2000 Highway Capacity Manual,
published by the TRB. Congestion is measured by comparing modeled (congested) speeds to
free-flow speeds on arterial roadways and then assigning letter grades to the various levels of
roadway congestion. A indicates the best level of service and F indicates the worst levels. For a
trip along an urban street that has a free-flow speed (generally akin to posted speed) of 40 mph,
LOS A conditions exist when the actual travel speed is at least 34 mph, including delays
experienced at traffic signals. At the other end of the spectrum, LOS F conditions exist when the
actual travel speed is below 10 mph.
Table 8
Relative Arterial Mobility and Arterial LOS
If the actual urban street travel speed is PAMR Arterial LOS is
At least 85% of the free-flow speed A
At least 70% of the highway speed B
At least 55% of the highway speed C
At least 40% of the highway speed D
At least 25% of the highway speed E
Less than 25% of the highway speed F
Any policy area with an actual urban street travel speed equal to or less than 40 percent of the
highway speed must be considered acceptable only with full mitigation for transportation.
The PAMR evaluates conditions only on the arterial roadway network. Freeway level of service is
not directly measured because County development contributes a relatively modest proportion of
freeway trips and because the County has limited influence over the design and operations of
the freeway system. However, because arterial travel substitutes for some freeway travel, PAMR
indirectly measures freeway congestion to the extent that travelers choose local roadways over
congested freeways.
Relative Transit Mobility is based on the Transit/Auto Travel Time level of service concept in the
1999 Transit Capacity and Quality of Service Manual published by the TRB. It is defined as the
relative speed by which journey to work trips can be made by transit as opposed to by auto. This
concept assigns letter grades to various levels of transit service, so that LOS A conditions exist
when a trip can be made more quickly by transit (including walk-access/drive-access and wait
times) than by single-occupant auto. An LOS A condition exists in the Washington region for
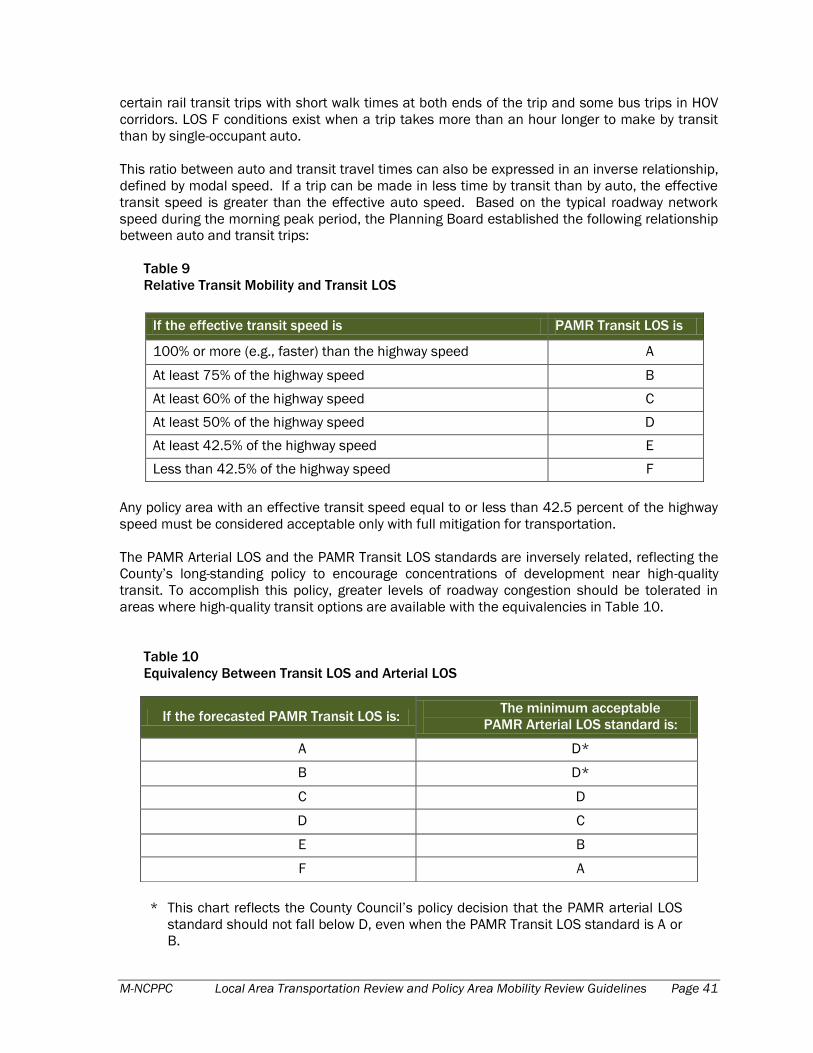
M-NCPPC Local Area Transportation Review and Policy Area Mobility Review Guidelines Page 41
certain rail transit trips with short walk times at both ends of the trip and some bus trips in HOV
corridors. LOS F conditions exist when a trip takes more than an hour longer to make by transit
than by single-occupant auto.
This ratio between auto and transit travel times can also be expressed in an inverse relationship,
defined by modal speed. If a trip can be made in less time by transit than by auto, the effective
transit speed is greater than the effective auto speed. Based on the typical roadway network
speed during the morning peak period, the Planning Board established the following relationship
between auto and transit trips:
Table 9
Relative Transit Mobility and Transit LOS
If the effective transit speed is PAMR Transit LOS is
100% or more (e.g., faster) than the highway speed A
At least 75% of the highway speed B
At least 60% of the highway speed C
At least 50% of the highway speed D
At least 42.5% of the highway speed E
Less than 42.5% of the highway speed F
Any policy area with an effective transit speed equal to or less than 42.5 percent of the highway
speed must be considered acceptable only with full mitigation for transportation.
The PAMR Arterial LOS and the PAMR Transit LOS standards are inversely related, reflecting the
County’s long-standing policy to encourage concentrations of development near high-quality
transit. To accomplish this policy, greater levels of roadway congestion should be tolerated in
areas where high-quality transit options are available with the equivalencies in Table 10.
Table 10
Equivalency Between Transit LOS and Arterial LOS
* This chart reflects the County Council’s policy decision that the PAMR arterial LOS
standard should not fall below D, even when the PAMR Transit LOS standard is A or
B.
If the forecasted PAMR Transit LOS is: The minimum acceptable
PAMR Arterial LOS standard is:
A D*
B D*
C D
D C
E B
F A
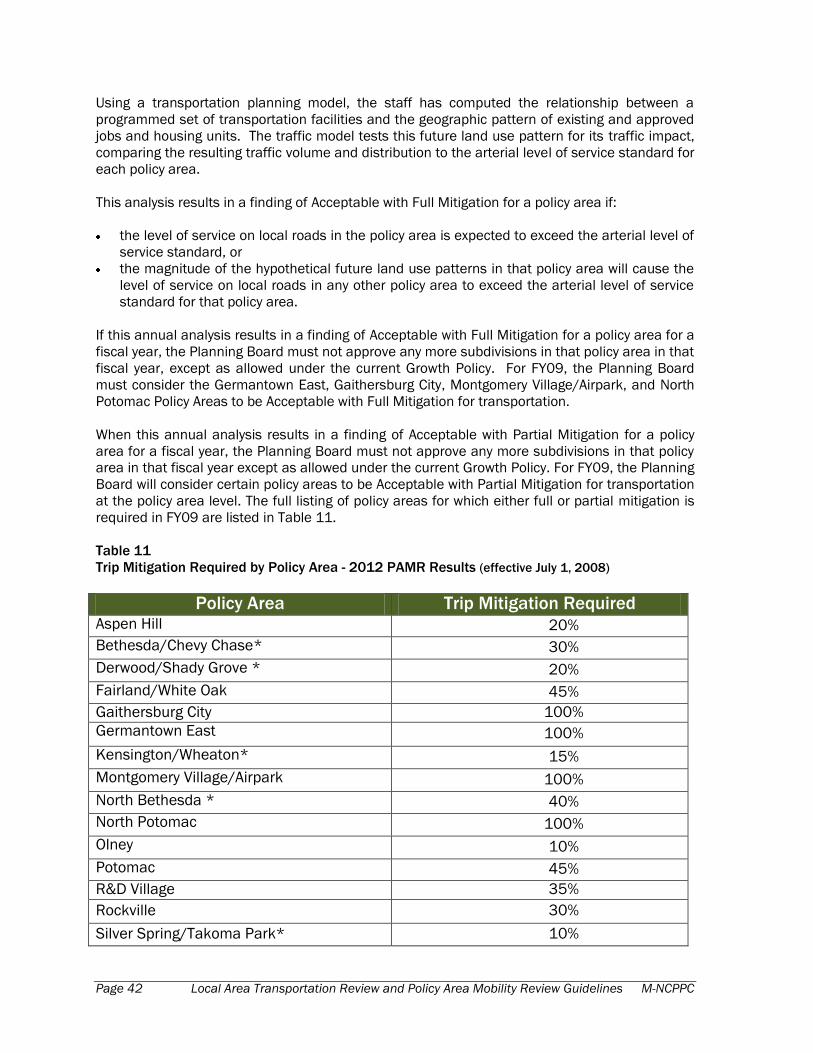
Page 42 Local Area Transportation Review and Policy Area Mobility Review Guidelines M-NCPPC
Using a transportation planning model, the staff has computed the relationship between a
programmed set of transportation facilities and the geographic pattern of existing and approved
jobs and housing units. The traffic model tests this future land use pattern for its traffic impact, comparing the resulting traffic volume and distribution to the arterial level of service standard for
each policy area.
This analysis results in a finding of Acceptable with Full Mitigation for a policy area if:
the level of service on local roads in the policy area is expected to exceed the arterial level of
service standard, or
the magnitude of the hypothetical future land use patterns in that policy area will cause the
level of service on local roads in any other policy area to exceed the arterial level of service
standard for that policy area.
If this annual analysis results in a finding of Acceptable with Full Mitigation for a policy area for a
fiscal year, the Planning Board must not approve any more subdivisions in that policy area in that
fiscal year, except as allowed under the current Growth Policy. For FY09, the Planning Board
must consider the Germantown East, Gaithersburg City, Montgomery Village/Airpark, and North
Potomac Policy Areas to be Acceptable with Full Mitigation for transportation.
When this annual analysis results in a finding of Acceptable with Partial Mitigation for a policy
area for a fiscal year, the Planning Board must not approve any more subdivisions in that policy
area in that fiscal year except as allowed under the current Growth Policy. For FY09, the Planning
Board will consider certain policy areas to be Acceptable with Partial Mitigation for transportation
at the policy area level. The full listing of policy areas for which either full or partial mitigation is
required in FY09 are listed in Table 11.
Table 11
Trip Mitigation Required by Policy Area - 2012 PAMR Results (effective July 1, 2008)
Policy Area Trip Mitigation Required Aspen Hill 20%
Bethesda/Chevy Chase* 30%
Derwood/Shady Grove * 20%
Fairland/White Oak 45%
Gaithersburg City 100%
Germantown East 100%
Kensington/Wheaton* 15%
Montgomery Village/Airpark 100%
North Bethesda * 40%
North Potomac 100%
Olney 10%
Potomac 45%
R&D Village 35%
Rockville 30%
Silver Spring/Takoma Park* 10%
M-NCPPC Local Area Transportation Review and Policy Area Mobility Review Guidelines Page 43
The trip mitigation also applies to the MSPAs as indicated with an asterisk in the table above and
itemized below:
The Bethesda/Chevy Chase Policy Area includes the Bethesda CBD and Friendship Heights
CBD Policy Areas
The Derwood Policy Area includes the Shady Grove Policy Area
The Kensington/Wheaton Policy Area includes the Glenmont and Wheaton CBD Policy Areas
The North Bethesda Policy Area includes the Grosvenor, Twinbrook, and White Flint Policy
Areas
The Silver Spring/Takoma Park Policy Area includes the Silver Spring CBD Policy Area.
An applicant for a preliminary plan of subdivision need not take any mitigating action under
PAMR if the Planning Board finds that the proposed development will generate three or fewer
peak hour trips. For retail uses, mitigation applies to primary trips, but not pass-by or diverted
trips.
The Planning Board, after considering recommendations of the County Executive, may approve a
preliminary plan application in a policy area found by PAMR to be Acceptable with Full Mitigation
or Acceptable with Partial Mitigation, as provided in this section. In approving plans in Acceptable
with Full Mitigation policy areas, the Board should ensure that the average level of service for the
relevant policy area is not adversely affected. Except as otherwise expressly stated in the
Development District Participation section of the Growth Policy, the same level of service criteria
must be used in evaluating an application under this section.
B. PAMR Trip Reduction/Mitigation
The following options to mitigate the traffic impacts of development approved in a preliminary
plan may be used, individually or in combination:
Trip Mitigation
An applicant may sign a binding Traffic Mitigation Agreement (TMAg) under which up to 100
percent of the projected peak hour vehicle trips would be removed from the roadway by using
Transportation Demand Management techniques to reduce trips generated by the applicant’s
development or by other sites, so that an applicant could still generate a certain number of trips
if the mitigation program removes an equal number of trips from other sites in the same policy
area. Note that traffic mitigation (TMAgs) apply to both LATR and PAMR.
Trip Reduction by Providing Non-Auto Facilities
An applicant may mitigate roadway congestion impacts to a limited extent by providing non-auto
transportation facilities that will enhance pedestrian safety or increase the attractiveness of
alternative modes of travel. The allowable facilities and their corresponding vehicle trip credits
are shown in Table 5. These facilities can be provided in exchange for vehicle trip credits; both
the credit value and maximum potential trip reduction credit (from 60 to 120 peak hour vehicle
trips) will depend on the congestion standard for the policy area.
An applicant may mitigate a limited number of trips by providing non-auto facilities that will make
alternative modes of transit, walking, and bicycling safer and more attractive. The allowable
actions and number of trips associated with them, as well as the maximum number of trip
Page 44 Local Area Transportation Review and Policy Area Mobility Review Guidelines M-NCPPC
credits allowable with these actions, which will depend in part on the congestion standards for
the policy area they are applied to, will be adopted by the Planning Board in these Guidelines.
Adding Roadway Capacity
An applicant may mitigate trips by building link-based roadway network capacity. The conversion
rate between vehicle trips and lane miles of roadway is shown in Table 12. The values in that
table are derived from regional estimates of vehicle trip length by trip purposes and uniform per-
lane capacities for roadway functional classes that should be applied county wide. Several
conditions apply:
The number of lane miles in Table 12 reflects total capacity provided, so that if an
applicant widens a roadway by one lane in each direction, the total minimum project
length would be half the length listed in the table.
The roadway construction or widening must have logical termini, for instance connecting
two intersections.
The roadway construction must occur in the same policy area as the proposed
development.
The roadway construction must be recommended in a master plan.
Adding Transit Capacity
An applicant may mitigate inadequate PAMR conditions by buying 40-foot long hybrid electric
fleet vehicles for the Ride On system, and guaranteeing 12 years of operations funding, at the
rate of 30 peak hour vehicle-trips per fleet vehicle. To qualify as mitigation, any bus must be an
addition to the size of the Ride On fleet and not a replacement for a bus taken out of service.
Payment instead of construction
The Planning Board may accept payment to the County of a fee commensurate with the cost of a
required improvement if the applicant has made a good faith effort to implement an acceptable
improvement, and the Board finds that a desirable improvement cannot feasibly be implemented
by the applicant but the same improvement or an acceptable alternative can be implemented by
a public agency within four years after the subdivision is approved.
For development applications that require PAMR mitigation of fewer than 30 peak hour vehicle
trips, the Planning Board may accept payment to the County in lieu of identification or
construction of any specific improvement. For FY09, the payment is established at $11,000 per
new peak hour vehicle trip and will escalate according to construction costs for each new fiscal
year in which a new value is not established.
In general, each mitigation measure or combination of measures must be scheduled for
completion or otherwise be operational at the same time or before the proposed development is
scheduled to be completed, and prior to use and occupancy permits being released. The nature,
design, and scale of any additional facility or program must receive prior approval from any
government agency that would construct or maintain the facility or program, and the applicant
and the public agency must execute an appropriate public works agreement before the Board
approves a record plat. The application must also be approved under LATR.
Both the subdivision plan and all necessary mitigation measures must be consistent with an
adopted master plan or other relevant land use policy statement. For the Planning Board to
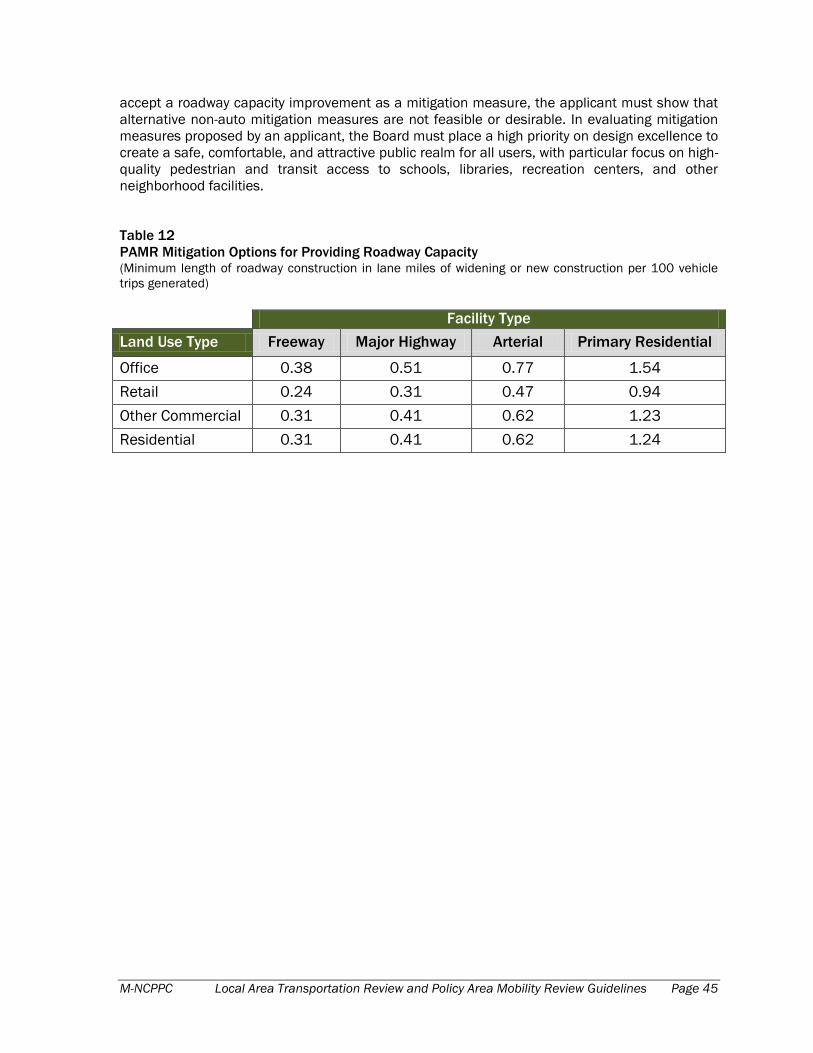
M-NCPPC Local Area Transportation Review and Policy Area Mobility Review Guidelines Page 45
accept a roadway capacity improvement as a mitigation measure, the applicant must show that
alternative non-auto mitigation measures are not feasible or desirable. In evaluating mitigation
measures proposed by an applicant, the Board must place a high priority on design excellence to
create a safe, comfortable, and attractive public realm for all users, with particular focus on high-
quality pedestrian and transit access to schools, libraries, recreation centers, and other
neighborhood facilities.
Table 12
PAMR Mitigation Options for Providing Roadway Capacity (Minimum length of roadway construction in lane miles of widening or new construction per 100 vehicle
trips generated)
Facility Type
Land Use Type Freeway Major Highway Arterial Primary Residential
Office 0.38 0.51 0.77 1.54
Retail 0.24 0.31 0.47 0.94
Other Commercial 0.31 0.41 0.62 1.23
Residential 0.31 0.41 0.62 1.24
Page 46 Local Area Transportation Review and Policy Area Mobility Review Guidelines M-NCPPC
Appendix A Weekday Peak Hour Trip Generation Formulas and
Rates for Local Area Transportation Review
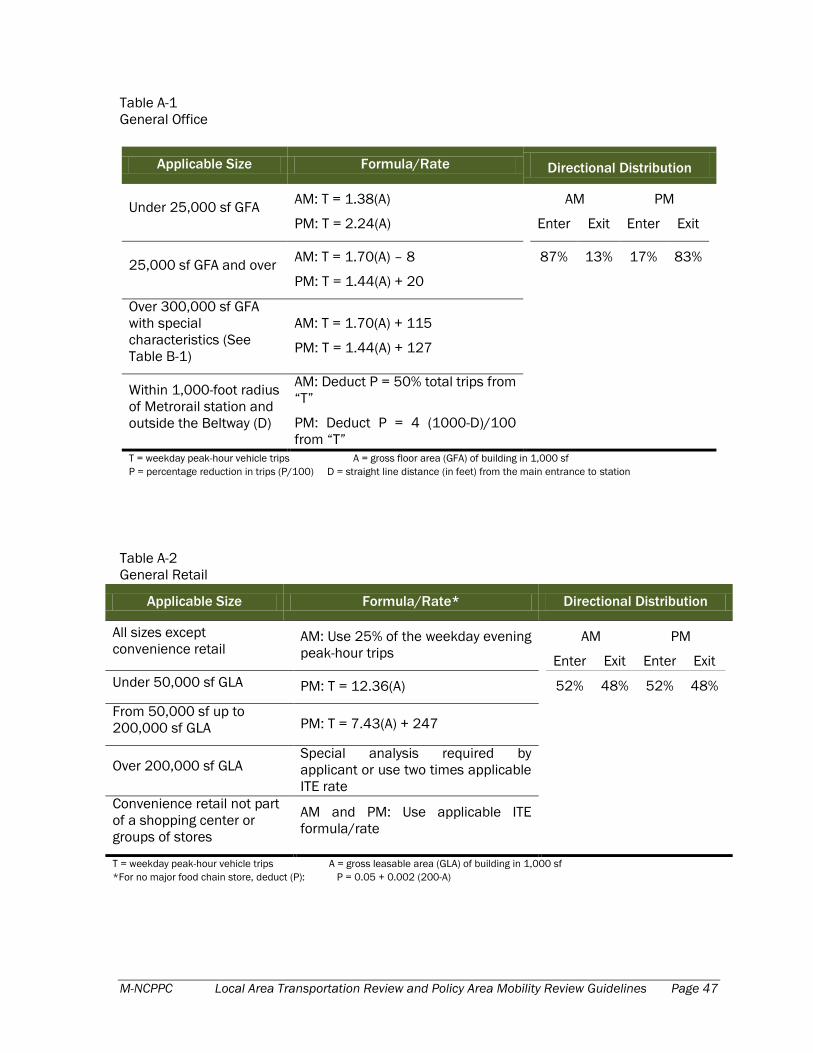
M-NCPPC Local Area Transportation Review and Policy Area Mobility Review Guidelines Page 47
Table A-1
General Office
Applicable Size Formula/Rate Directional Distribution
Under 25,000 sf GFA AM: T = 1.38(A)
PM: T = 2.24(A)
AM PM
Enter Exit Enter Exit
87% 13% 17% 83% 25,000 sf GFA and over
AM: T = 1.70(A) – 8
PM: T = 1.44(A) + 20
Over 300,000 sf GFA
with special
characteristics (See
Table B-1)
AM: T = 1.70(A) + 115
PM: T = 1.44(A) + 127
Within 1,000-foot radius
of Metrorail station and
outside the Beltway (D)
AM: Deduct P = 50% total trips from
―T‖
PM: Deduct P = 4 (1000-D)/100
from ―T‖ T = weekday peak-hour vehicle trips A = gross floor area (GFA) of building in 1,000 sf
P = percentage reduction in trips (P/100) D = straight line distance (in feet) from the main entrance to station
Table A-2
General Retail
Applicable Size Formula/Rate* Directional Distribution
All sizes except
convenience retail AM: Use 25% of the weekday evening
peak-hour trips
AM PM
Enter Exit Enter Exit
52% 48% 52% 48%
Under 50,000 sf GLA PM: T = 12.36(A)
From 50,000 sf up to
200,000 sf GLA PM: T = 7.43(A) + 247
Over 200,000 sf GLA Special analysis required by
applicant or use two times applicable
ITE rate
Convenience retail not part
of a shopping center or
groups of stores
AM and PM: Use applicable ITE
formula/rate
T = weekday peak-hour vehicle trips A = gross leasable area (GLA) of building in 1,000 sf
*For no major food chain store, deduct (P): P = 0.05 + 0.002 (200-A)
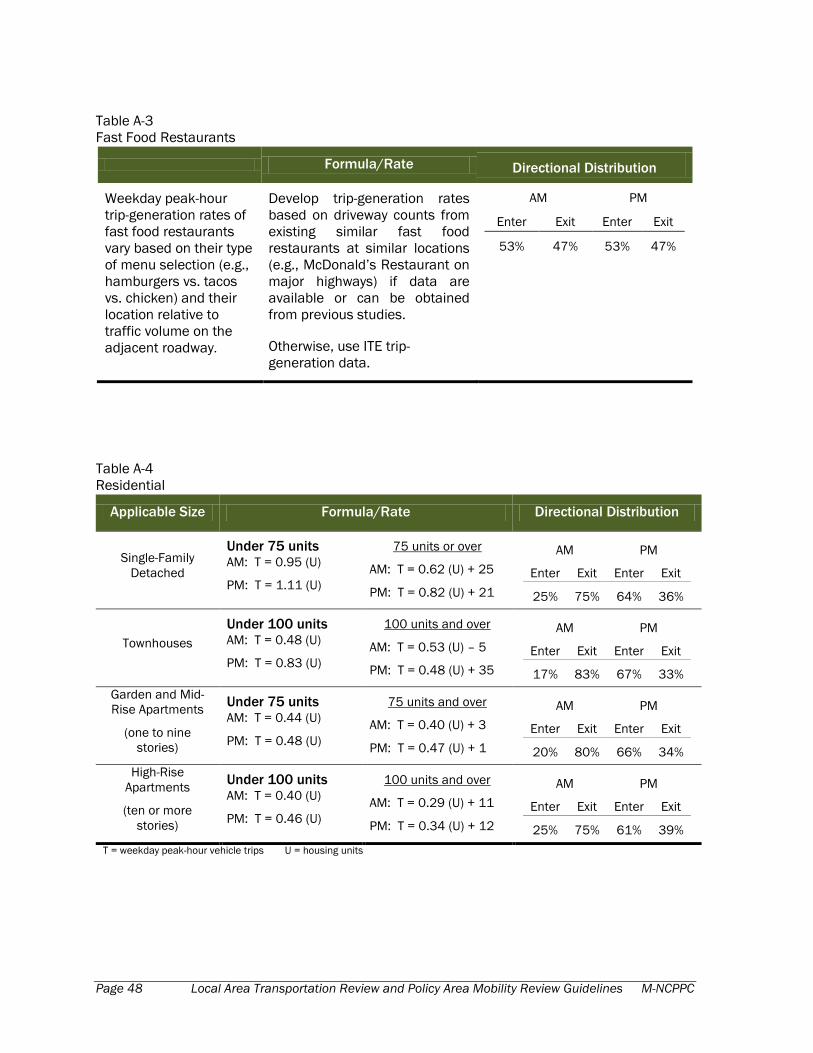
Page 48 Local Area Transportation Review and Policy Area Mobility Review Guidelines M-NCPPC
Table A-3
Fast Food Restaurants
Formula/Rate Directional Distribution
Weekday peak-hour
trip-generation rates of
fast food restaurants
vary based on their type
of menu selection (e.g.,
hamburgers vs. tacos
vs. chicken) and their
location relative to
traffic volume on the
adjacent roadway.
Develop trip-generation rates
based on driveway counts from
existing similar fast food
restaurants at similar locations
(e.g., McDonald’s Restaurant on
major highways) if data are
available or can be obtained
from previous studies.
Otherwise, use ITE trip-
generation data.
AM PM
Enter Exit Enter Exit
53% 47% 53% 47%
Table A-4
Residential
Applicable Size Formula/Rate Directional Distribution
Single-Family
Detached
Under 75 units AM: T = 0.95 (U)
PM: T = 1.11 (U)
75 units or over
AM: T = 0.62 (U) + 25
PM: T = 0.82 (U) + 21
AM PM
Enter Exit Enter Exit
25% 75% 64% 36%
Townhouses
Under 100 units AM: T = 0.48 (U)
PM: T = 0.83 (U)
100 units and over
AM: T = 0.53 (U) – 5
PM: T = 0.48 (U) + 35
AM PM
Enter Exit Enter Exit
17% 83% 67% 33%
Garden and Mid-
Rise Apartments
(one to nine
stories)
Under 75 units AM: T = 0.44 (U)
PM: T = 0.48 (U)
75 units and over
AM: T = 0.40 (U) + 3
PM: T = 0.47 (U) + 1
AM PM
Enter Exit Enter Exit
20% 80% 66% 34%
High-Rise
Apartments
(ten or more
stories)
Under 100 units AM: T = 0.40 (U)
PM: T = 0.46 (U)
100 units and over
AM: T = 0.29 (U) + 11
PM: T = 0.34 (U) + 12
AM PM
Enter Exit Enter Exit
25% 75% 61% 39%
T = weekday peak-hour vehicle trips U = housing units
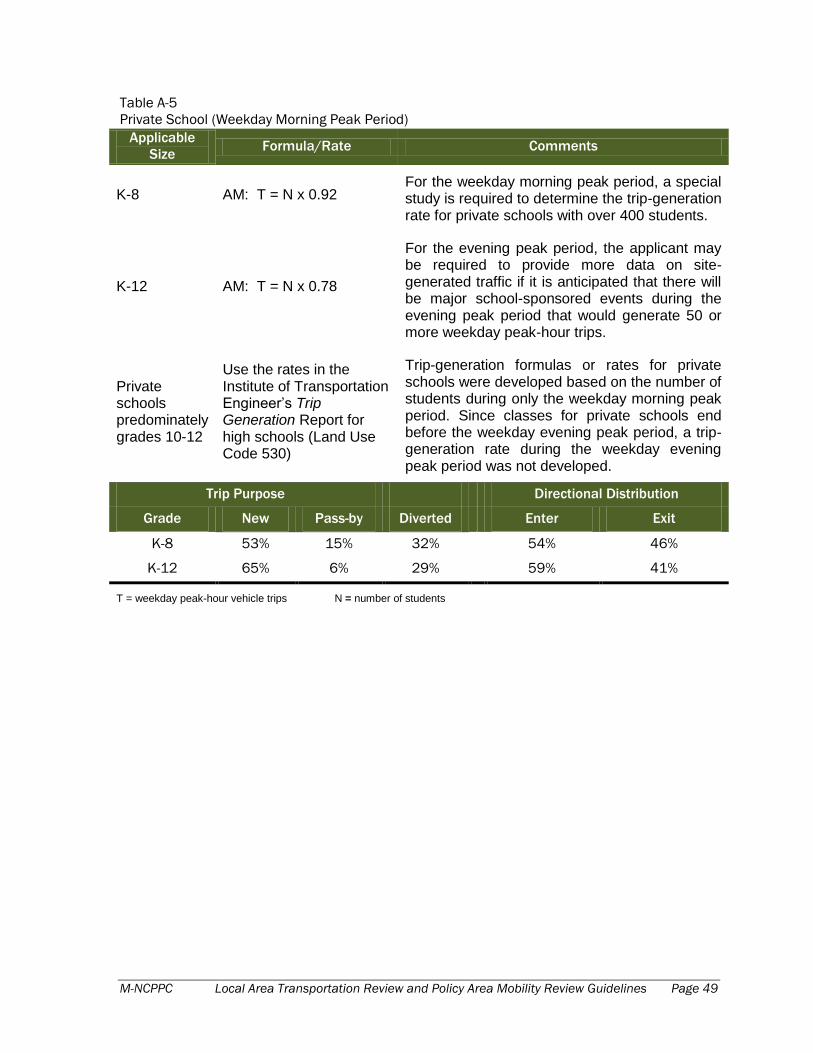
M-NCPPC Local Area Transportation Review and Policy Area Mobility Review Guidelines Page 49
Table A-5
Private School (Weekday Morning Peak Period)
Applicable
Size Formula/Rate Comments
K-8 AM: T = N x 0.92 For the weekday morning peak period, a special study is required to determine the trip-generation rate for private schools with over 400 students.
K-12 AM: T = N x 0.78
For the evening peak period, the applicant may be required to provide more data on site-generated traffic if it is anticipated that there will be major school-sponsored events during the evening peak period that would generate 50 or more weekday peak-hour trips.
Private schools predominately grades 10-12
Use the rates in the Institute of Transportation Engineer’s Trip Generation Report for high schools (Land Use Code 530)
Trip-generation formulas or rates for private schools were developed based on the number of students during only the weekday morning peak period. Since classes for private schools end before the weekday evening peak period, a trip-generation rate during the weekday evening peak period was not developed.
Trip Purpose Directional Distribution
Grade New Pass-by Diverted Enter Exit
K-8 53% 15% 32% 54% 46%
K-12 65% 6% 29% 59% 41%
T = weekday peak-hour vehicle trips N = number of students
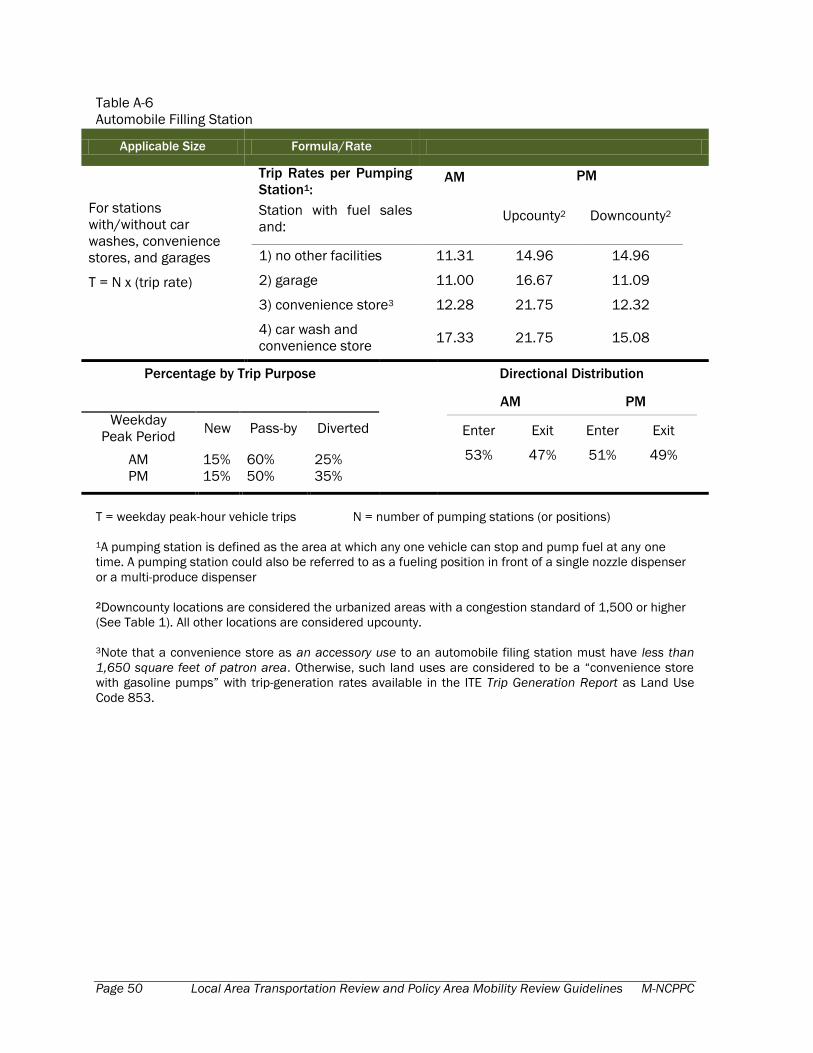
Page 50 Local Area Transportation Review and Policy Area Mobility Review Guidelines M-NCPPC
Table A-6
Automobile Filling Station
Applicable Size Formula/Rate
For stations
with/without car
washes, convenience
stores, and garages
T = N x (trip rate)
Trip Rates per Pumping
Station1:
Station with fuel sales
and:
AM PM
Upcounty2 Downcounty2
1) no other facilities 11.31 14.96 14.96
2) garage 11.00 16.67 11.09
3) convenience store3 12.28 21.75 12.32
4) car wash and
convenience store 17.33 21.75 15.08
Percentage by Trip Purpose
Directional Distribution
AM PM
Enter Exit Enter Exit
53% 47% 51% 49%
Weekday
Peak Period New Pass-by Diverted
AM
PM
15%
15%
60%
50%
25%
35%
T = weekday peak-hour vehicle trips N = number of pumping stations (or positions)
1A pumping station is defined as the area at which any one vehicle can stop and pump fuel at any one
time. A pumping station could also be referred to as a fueling position in front of a single nozzle dispenser
or a multi-produce dispenser
2Downcounty locations are considered the urbanized areas with a congestion standard of 1,500 or higher
(See Table 1). All other locations are considered upcounty.
3Note that a convenience store as an accessory use to an automobile filing station must have less than
1,650 square feet of patron area. Otherwise, such land uses are considered to be a ―convenience store
with gasoline pumps‖ with trip-generation rates available in the ITE Trip Generation Report as Land Use
Code 853.
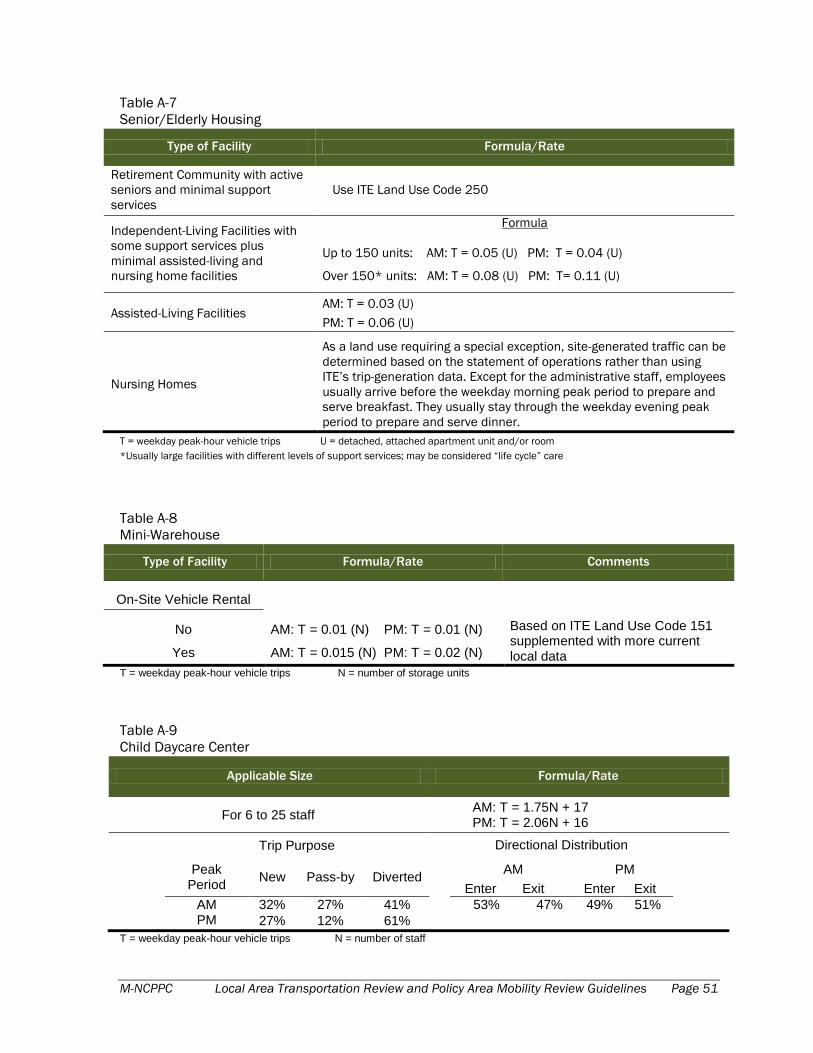
M-NCPPC Local Area Transportation Review and Policy Area Mobility Review Guidelines Page 51
Table A-7
Senior/Elderly Housing
Type of Facility Formula/Rate
Retirement Community with active
seniors and minimal support
services
Use ITE Land Use Code 250
Independent-Living Facilities with
some support services plus
minimal assisted-living and
nursing home facilities
Formula
Up to 150 units: AM: T = 0.05 (U) PM: T = 0.04 (U)
Over 150* units: AM: T = 0.08 (U) PM: T= 0.11 (U)
Assisted-Living Facilities AM: T = 0.03 (U)
PM: T = 0.06 (U)
Nursing Homes
As a land use requiring a special exception, site-generated traffic can be
determined based on the statement of operations rather than using
ITE’s trip-generation data. Except for the administrative staff, employees
usually arrive before the weekday morning peak period to prepare and
serve breakfast. They usually stay through the weekday evening peak
period to prepare and serve dinner.
T = weekday peak-hour vehicle trips U = detached, attached apartment unit and/or room
*Usually large facilities with different levels of support services; may be considered ―life cycle‖ care
Table A-8
Mini-Warehouse
Type of Facility Formula/Rate Comments
On-Site Vehicle Rental
No
Yes
AM: T = 0.01 (N) PM: T = 0.01 (N)
AM: T = 0.015 (N) PM: T = 0.02 (N)
Based on ITE Land Use Code 151 supplemented with more current local data
T = weekday peak-hour vehicle trips N = number of storage units
Table A-9
Child Daycare Center
Applicable Size Formula/Rate
For 6 to 25 staff AM: T = 1.75N + 17 PM: T = 2.06N + 16
Trip Purpose Directional Distribution
Peak Period
New Pass-by Diverted AM
Enter Exit
PM
Enter Exit
AM 32% 27% 41% 53% 47% 49% 51% PM 27% 12% 61%
T = weekday peak-hour vehicle trips N = number of staff

Page 52 Local Area Transportation Review and Policy Area Mobility Review Guidelines M-NCPPC
Appendix B Weekday Peak Hour Trips Generated by Land Uses
for Local Area Transportation Review
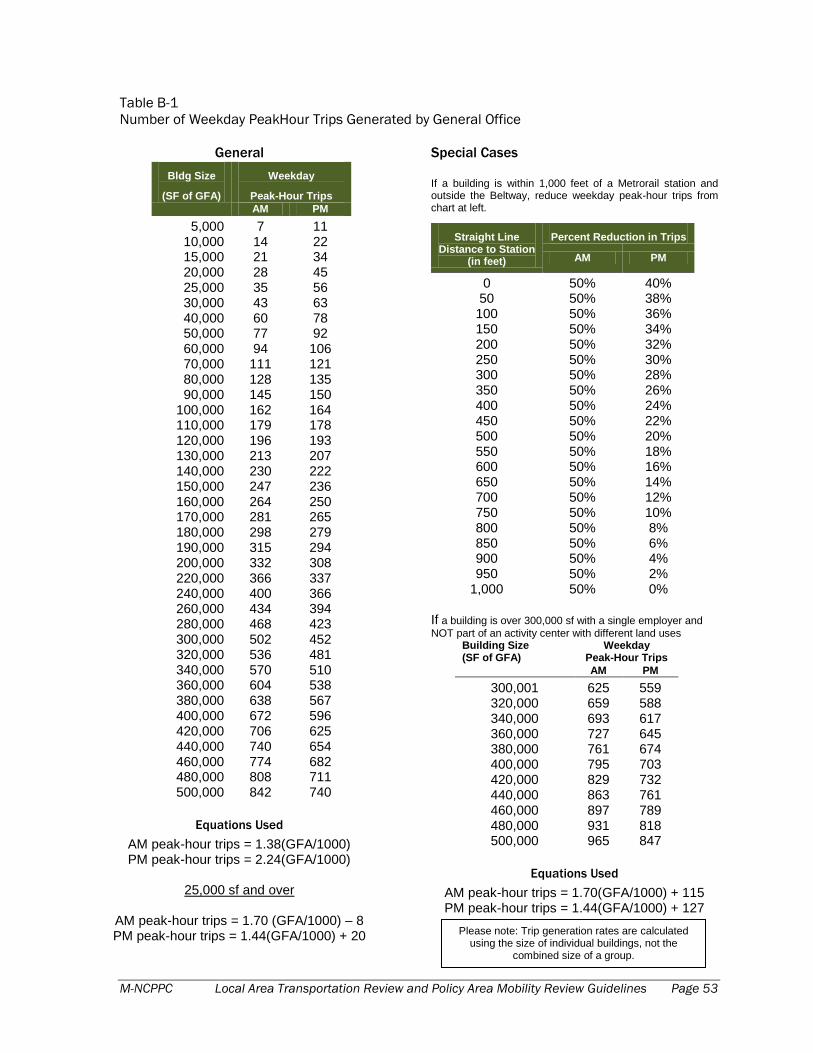
M-NCPPC Local Area Transportation Review and Policy Area Mobility Review Guidelines Page 53
Table B-1
Number of Weekday PeakHour Trips Generated by General Office
General
Bldg Size
(SF of GFA)
Weekday
Peak-Hour Trips
AM PM
5,000 7 11 10,000 14 22 15,000 21 34 20,000 28 45 25,000 35 56 30,000 43 63 40,000 60 78 50,000 77 92 60,000 94 106 70,000 111 121 80,000 128 135 90,000 145 150
100,000 162 164 110,000 179 178 120,000 196 193 130,000 213 207 140,000 230 222 150,000 247 236 160,000 264 250 170,000 281 265 180,000 298 279 190,000 315 294 200,000 332 308 220,000 366 337 240,000 400 366 260,000 434 394 280,000 468 423 300,000 502 452 320,000 536 481 340,000 570 510 360,000 604 538 380,000 638 567 400,000 672 596 420,000 706 625 440,000 740 654 460,000 774 682 480,000 808 711 500,000 842 740
Equations Used
AM peak-hour trips = 1.38(GFA/1000) PM peak-hour trips = 2.24(GFA/1000)
25,000 sf and over
AM peak-hour trips = 1.70 (GFA/1000) – 8 PM peak-hour trips = 1.44(GFA/1000) + 20
Special Cases
If a building is within 1,000 feet of a Metrorail station and outside the Beltway, reduce weekday peak-hour trips from chart at left.
Straight Line Distance to Station
(in feet)
Percent Reduction in Trips
AM PM
0 50% 40% 50 50% 38% 100 50% 36% 150 50% 34% 200 50% 32% 250 50% 30% 300 50% 28% 350 50% 26% 400 50% 24% 450 50% 22% 500 50% 20% 550 50% 18% 600 50% 16% 650 50% 14% 700 50% 12% 750 50% 10% 800 50% 8% 850 50% 6% 900 50% 4% 950 50% 2%
1,000 50% 0% If a building is over 300,000 sf with a single employer and
NOT part of an activity center with different land uses Building Size (SF of GFA)
Weekday Peak-Hour Trips
AM PM
300,001 625 559 320,000 659 588 340,000 693 617 360,000 727 645 380,000 761 674 400,000 795 703 420,000 829 732 440,000 863 761 460,000 897 789 480,000 931 818 500,000 965 847
Equations Used
AM peak-hour trips = 1.70(GFA/1000) + 115 PM peak-hour trips = 1.44(GFA/1000) + 127
Please note: Trip generation rates are calculated
using the size of individual buildings, not the combined size of a group.
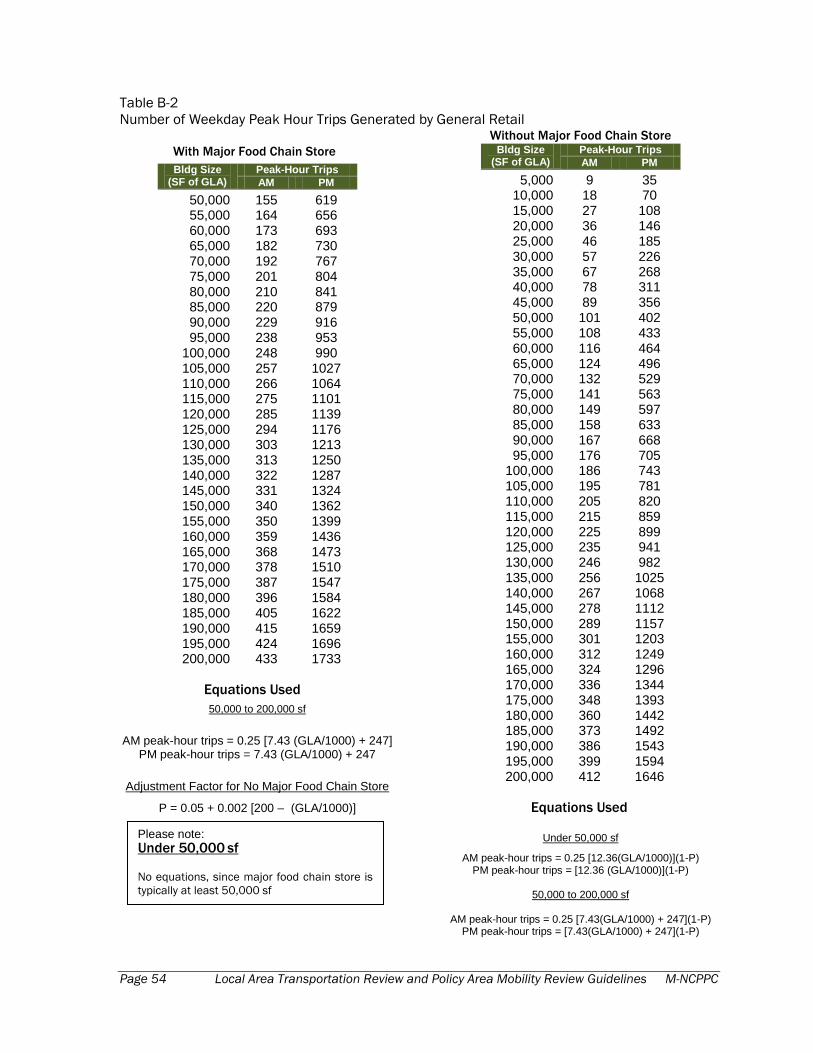
Page 54 Local Area Transportation Review and Policy Area Mobility Review Guidelines M-NCPPC
Table B-2
Number of Weekday Peak Hour Trips Generated by General Retail
With Major Food Chain Store
Bldg Size (SF of GLA)
Peak-Hour Trips
AM PM
50,000 155 619 55,000 164 656 60,000 173 693 65,000 182 730 70,000 192 767 75,000 201 804 80,000 210 841 85,000 220 879 90,000 229 916 95,000 238 953
100,000 248 990 105,000 257 1027 110,000 266 1064 115,000 275 1101 120,000 285 1139 125,000 294 1176 130,000 303 1213 135,000 313 1250 140,000 322 1287 145,000 331 1324 150,000 340 1362 155,000 350 1399 160,000 359 1436 165,000 368 1473 170,000 378 1510 175,000 387 1547 180,000 396 1584 185,000 405 1622 190,000 415 1659 195,000 424 1696 200,000 433 1733
Equations Used
50,000 to 200,000 sf
AM peak-hour trips = 0.25 [7.43 (GLA/1000) + 247]
PM peak-hour trips = 7.43 (GLA/1000) + 247 Adjustment Factor for No Major Food Chain Store
P = 0.05 + 0.002 [200 – (GLA/1000)]
Without Major Food Chain Store Bldg Size
(SF of GLA) Peak-Hour Trips
AM PM
5,000 9 35 10,000 18 70 15,000 27 108 20,000 36 146 25,000 46 185 30,000 57 226 35,000 67 268 40,000 78 311 45,000 89 356 50,000 101 402 55,000 108 433 60,000 116 464 65,000 124 496 70,000 132 529 75,000 141 563 80,000 149 597 85,000 158 633 90,000 167 668 95,000 176 705
100,000 186 743 105,000 195 781 110,000 205 820 115,000 215 859 120,000 225 899 125,000 235 941 130,000 246 982 135,000 256 1025 140,000 267 1068 145,000 278 1112 150,000 289 1157 155,000 301 1203 160,000 312 1249 165,000 324 1296 170,000 336 1344 175,000 348 1393 180,000 360 1442 185,000 373 1492 190,000 386 1543 195,000 399 1594 200,000 412 1646
Equations Used
Under 50,000 sf
AM peak-hour trips = 0.25 [12.36(GLA/1000)](1-P) PM peak-hour trips = [12.36 (GLA/1000)](1-P)
50,000 to 200,000 sf
AM peak-hour trips = 0.25 [7.43(GLA/1000) + 247](1-P)
PM peak-hour trips = [7.43(GLA/1000) + 247](1-P)
Please note:
Under 50,000 sf
No equations, since major food chain store is
typically at least 50,000 sf
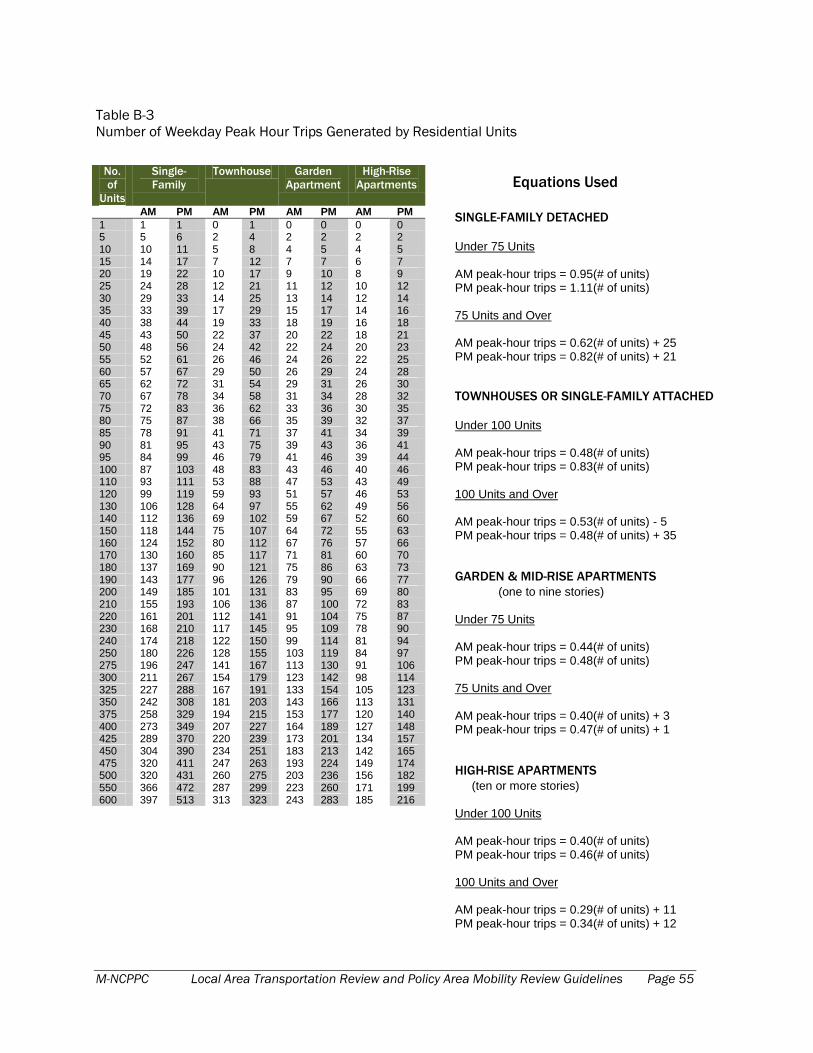
M-NCPPC Local Area Transportation Review and Policy Area Mobility Review Guidelines Page 55
Table B-3
Number of Weekday Peak Hour Trips Generated by Residential Units
No.
of
Units
Single-
Family
Townhouse Garden
Apartment
High-Rise
Apartments
AM PM AM PM AM PM AM PM
1 1 1 0 1 0 0 0 0 5 5 6 2 4 2 2 2 2 10 10 11 5 8 4 5 4 5 15 14 17 7 12 7 7 6 7 20 19 22 10 17 9 10 8 9 25 24 28 12 21 11 12 10 12 30 29 33 14 25 13 14 12 14 35 33 39 17 29 15 17 14 16 40 38 44 19 33 18 19 16 18 45 43 50 22 37 20 22 18 21 50 48 56 24 42 22 24 20 23 55 52 61 26 46 24 26 22 25 60 57 67 29 50 26 29 24 28 65 62 72 31 54 29 31 26 30 70 67 78 34 58 31 34 28 32 75 72 83 36 62 33 36 30 35 80 75 87 38 66 35 39 32 37 85 78 91 41 71 37 41 34 39 90 81 95 43 75 39 43 36 41 95 84 99 46 79 41 46 39 44 100 87 103 48 83 43 46 40 46 110 93 111 53 88 47 53 43 49 120 99 119 59 93 51 57 46 53 130 106 128 64 97 55 62 49 56 140 112 136 69 102 59 67 52 60 150 118 144 75 107 64 72 55 63 160 124 152 80 112 67 76 57 66 170 130 160 85 117 71 81 60 70 180 137 169 90 121 75 86 63 73 190 143 177 96 126 79 90 66 77 200 149 185 101 131 83 95 69 80 210 155 193 106 136 87 100 72 83 220 161 201 112 141 91 104 75 87 230 168 210 117 145 95 109 78 90 240 174 218 122 150 99 114 81 94 250 180 226 128 155 103 119 84 97 275 196 247 141 167 113 130 91 106 300 211 267 154 179 123 142 98 114 325 227 288 167 191 133 154 105 123 350 242 308 181 203 143 166 113 131 375 258 329 194 215 153 177 120 140 400 273 349 207 227 164 189 127 148 425 289 370 220 239 173 201 134 157 450 304 390 234 251 183 213 142 165 475 320 411 247 263 193 224 149 174 500 320 431 260 275 203 236 156 182 550 366 472 287 299 223 260 171 199 600 397 513 313 323 243 283 185 216
Equations Used
SINGLE-FAMILY DETACHED
Under 75 Units AM peak-hour trips = 0.95(# of units) PM peak-hour trips = 1.11(# of units) 75 Units and Over AM peak-hour trips = 0.62(# of units) + 25 PM peak-hour trips = 0.82(# of units) + 21
TOWNHOUSES OR SINGLE-FAMILY ATTACHED
Under 100 Units AM peak-hour trips = 0.48(# of units) PM peak-hour trips = 0.83(# of units) 100 Units and Over AM peak-hour trips = 0.53(# of units) - 5 PM peak-hour trips = 0.48(# of units) + 35 GARDEN & MID-RISE APARTMENTS
(one to nine stories) Under 75 Units AM peak-hour trips = 0.44(# of units) PM peak-hour trips = 0.48(# of units) 75 Units and Over AM peak-hour trips = 0.40(# of units) + 3 PM peak-hour trips = 0.47(# of units) + 1
HIGH-RISE APARTMENTS
(ten or more stories) Under 100 Units AM peak-hour trips = 0.40(# of units) PM peak-hour trips = 0.46(# of units) 100 Units and Over AM peak-hour trips = 0.29(# of units) + 11 PM peak-hour trips = 0.34(# of units) + 12
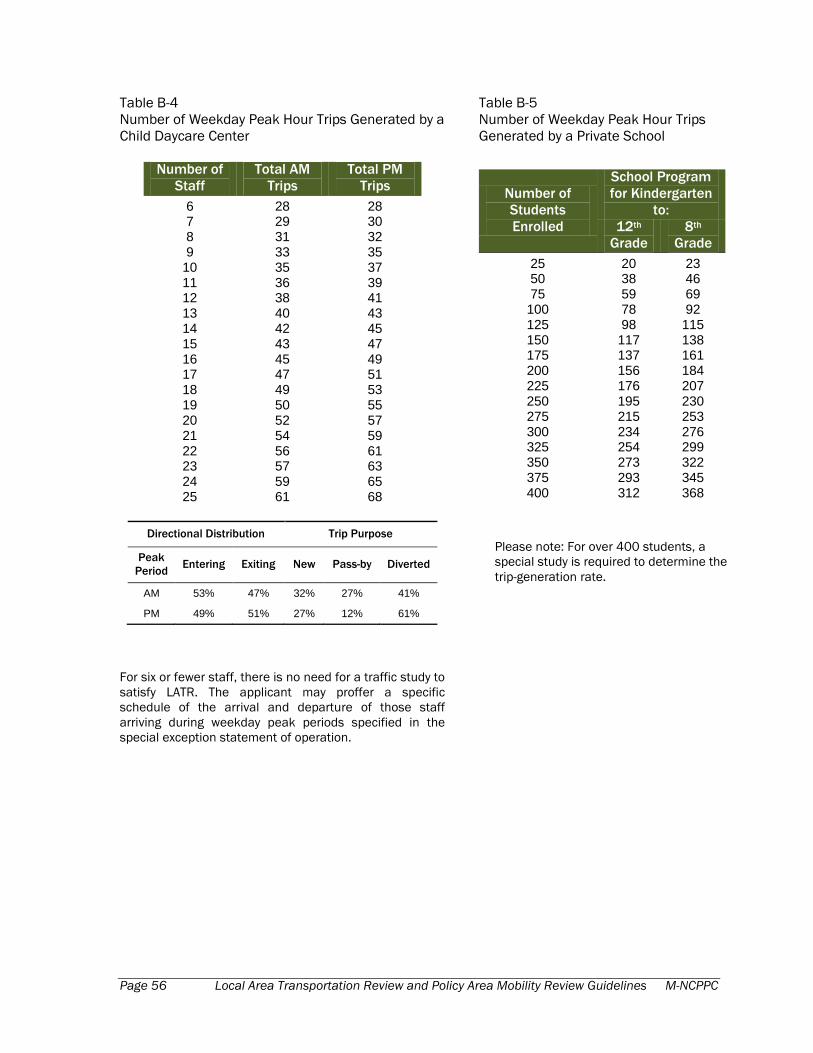
Page 56 Local Area Transportation Review and Policy Area Mobility Review Guidelines M-NCPPC
Table B-4
Number of Weekday Peak Hour Trips Generated by a
Child Daycare Center
Number of
Staff
Total AM
Trips
Total PM
Trips
6 28 28 7 29 30 8 31 32 9 33 35
10 35 37 11 36 39 12 38 41 13 40 43 14 42 45 15 43 47 16 45 49 17 47 51 18 49 53 19 50 55 20 52 57 21 54 59 22 56 61 23 57 63 24 59 65 25 61 68
Directional Distribution Trip Purpose
Peak
Period Entering Exiting New Pass-by Diverted
AM 53% 47% 32% 27% 41%
PM 49% 51% 27% 12% 61%
For six or fewer staff, there is no need for a traffic study to
satisfy LATR. The applicant may proffer a specific
schedule of the arrival and departure of those staff
arriving during weekday peak periods specified in the
special exception statement of operation.
Table B-5
Number of Weekday Peak Hour Trips
Generated by a Private School
Number of
Students
Enrolled
School Program
for Kindergarten
to:
12th
Grade
8th
Grade
25 20 23 50 38 46 75 59 69 100 78 92 125 98 115 150 117 138 175 137 161 200 156 184 225 176 207 250 195 230 275 215 253 300 234 276 325 254 299 350 273 322 375 293 345 400 312 368
Please note: For over 400 students, a
special study is required to determine the
trip-generation rate.
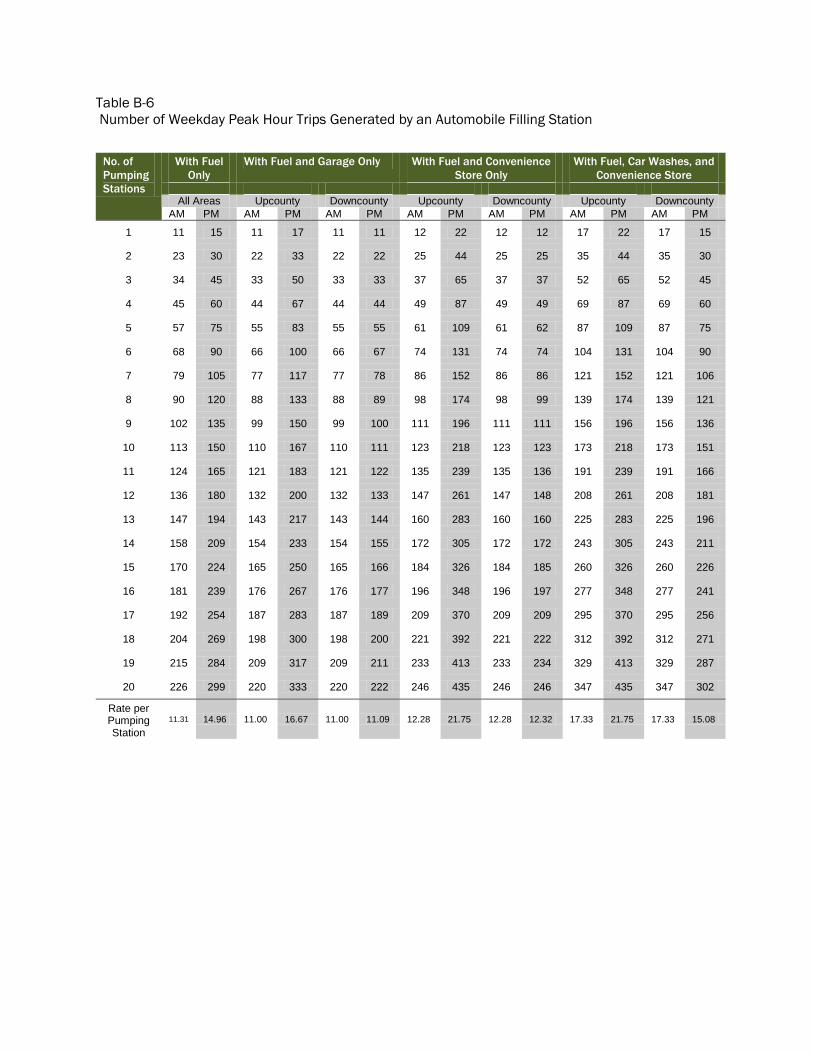
Table B-6
Number of Weekday Peak Hour Trips Generated by an Automobile Filling Station
No. of
Pumping
Stations
With Fuel
Only
With Fuel and Garage Only With Fuel and Convenience
Store Only
With Fuel, Car Washes, and
Convenience Store
All Areas Upcounty Downcounty Upcounty Downcounty Upcounty Downcounty
AM PM AM PM AM PM AM PM AM PM AM PM AM PM
1 11 15 11 17 11 11 12 22 12 12 17 22 17 15
2 23 30 22 33 22 22 25 44 25 25 35 44 35 30
3 34 45 33 50 33 33 37 65 37 37 52 65 52 45
4 45 60 44 67 44 44 49 87 49 49 69 87 69 60
5 57 75 55 83 55 55 61 109 61 62 87 109 87 75
6 68 90 66 100 66 67 74 131 74 74 104 131 104 90
7 79 105 77 117 77 78 86 152 86 86 121 152 121 106
8 90 120 88 133 88 89 98 174 98 99 139 174 139 121
9 102 135 99 150 99 100 111 196 111 111 156 196 156 136
10 113 150 110 167 110 111 123 218 123 123 173 218 173 151
11 124 165 121 183 121 122 135 239 135 136 191 239 191 166
12 136 180 132 200 132 133 147 261 147 148 208 261 208 181
13 147 194 143 217 143 144 160 283 160 160 225 283 225 196
14 158 209 154 233 154 155 172 305 172 172 243 305 243 211
15 170 224 165 250 165 166 184 326 184 185 260 326 260 226
16 181 239 176 267 176 177 196 348 196 197 277 348 277 241
17 192 254 187 283 187 189 209 370 209 209 295 370 295 256
18 204 269 198 300 198 200 221 392 221 222 312 392 312 271
19 215 284 209 317 209 211 233 413 233 234 329 413 329 287
20 226 299 220 333 220 222 246 435 246 246 347 435 347 302
Rate per Pumping Station
11.31 14.96 11.00 16.67 11.00 11.09 12.28 21.75 12.28 12.32 17.33 21.75 17.33 15.08

Page 58 Local Area Transportation Review and Policy Area Mobility Review Guidelines M-NCPPC
Appendix C Weekday Peak Hour Trip Generation Rates and Directional Splits for
the Bethesda, Friendship Heights, and Silver Spring CBDs
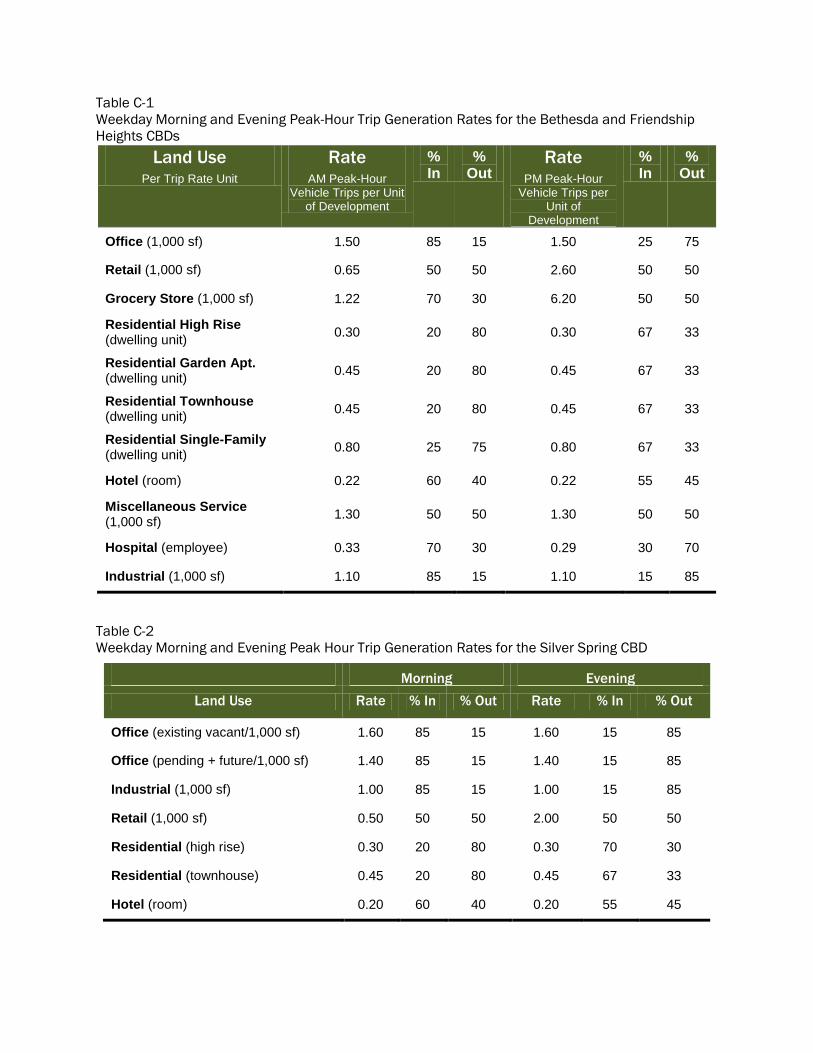
Table C-1
Weekday Morning and Evening Peak-Hour Trip Generation Rates for the Bethesda and Friendship
Heights CBDs
Land Use Per Trip Rate Unit
Rate AM Peak-Hour
Vehicle Trips per Unit of Development
% In
% Out
Rate PM Peak-Hour
Vehicle Trips per Unit of
Development
% In
% Out
Office (1,000 sf) 1.50 85 15 1.50 25 75
Retail (1,000 sf) 0.65 50 50 2.60 50 50
Grocery Store (1,000 sf) 1.22 70 30 6.20 50 50
Residential High Rise (dwelling unit)
0.30 20 80 0.30 67 33
Residential Garden Apt. (dwelling unit)
0.45 20 80 0.45 67 33
Residential Townhouse (dwelling unit)
0.45 20 80 0.45 67 33
Residential Single-Family (dwelling unit)
0.80 25 75 0.80 67 33
Hotel (room) 0.22 60 40 0.22 55 45
Miscellaneous Service (1,000 sf)
1.30 50 50 1.30 50 50
Hospital (employee) 0.33 70 30 0.29 30 70
Industrial (1,000 sf) 1.10 85 15 1.10 15 85
Table C-2
Weekday Morning and Evening Peak Hour Trip Generation Rates for the Silver Spring CBD
Morning Evening
Land Use Rate % In % Out Rate % In % Out
Office (existing vacant/1,000 sf) 1.60 85 15 1.60 15 85
Office (pending + future/1,000 sf) 1.40 85 15 1.40 15 85
Industrial (1,000 sf) 1.00 85 15 1.00 15 85
Retail (1,000 sf) 0.50 50 50 2.00 50 50
Residential (high rise) 0.30 20 80 0.30 70 30
Residential (townhouse) 0.45 20 80 0.45 67 33
Hotel (room) 0.20 60 40 0.20 55 45
Page 60 Local Area Transportation Review and Policy Area Mobility Review Guidelines M-NCPPC
Appendix D Trip Distribution and Traffic Assignment Guidelines
Introduction
This document provides trip distribution guidance to be used in all traffic studies prepared for
development sites in Montgomery County. Vehicle trip distribution and trip assignment are described
in Sections VII-D and VII-F of the Guidelines. For most development sites, the process is a
combination of trip distribution and traffic assignment.
Definitions
Trip distribution specifies the location where trips that originate at a development site are destined
to, and the origin of trips that are destined to a development site.
Traffic assignment specifies the individual local area intersections used to access (enter and leave) a
development site.
Discussion
The tables in this appendix provide generalized assumptions for trip distribution for both background
development(s) and the development site. For the purpose of reviewing trip distribution,
Transportation Planning staff divided the region into 16 geographic areas, called super districts.
Eleven of these super districts are in Montgomery County, as shown in Figure D-1. The remaining five
super districts represent neighboring jurisdictions.
The trip distribution assumptions are contained in Tables D-1 through D-11 for developments within
each of the eleven super districts in Montgomery County. For each super district, the assumed
distribution of trips for general office development and for residential development is listed. For
instance, 18.1 percent of trips generated by a general office development in Germantown (see Table
D-9) would be expected to travel to or from Frederick County. However, only two percent of trips
generated by a residential development in Germantown would be expected to travel to or from
Frederick County.
The trip distribution assumptions in these tables are based on 1990 census journey-to-work
information, updated to reflect regional housing and employment totals as of 1998. The distribution
for residential development in each super district is based on the reported workplace locations for
1990 census respondents who lived in that super district. Similarly, the distribution for office
development for each super district is based on the distribution of all census households nationwide
that reported a workplace in that super district. Trip distribution for other land uses will be decided
based on consultation with staff and the applicant prior to submission of the traffic study.
The application of the trip distribution information in Tables D-1 through D-11 is straightforward in
cases where a traffic study has a limited number of alternate routes. In other cases, judgment is
required to convert the trip distribution information into traffic assignment information useful for
conducting the Local Area Transportation Review.
Figure D-2 provides an example of how the trip distribution information can be converted to traffic
assignment information for a hypothetical case in the Rockville/North Bethesda super district with
both office and residential components.
The leftmost column of data shows the trip distribution by super-district as found in Table D-4 (used
for development in the Rockville/North Bethesda super district). The information located in the
center of the table (inside the boxes) describes the assumed route, or assignment, taken for trips
Page 62 Local Area Transportation Review and Policy Area Mobility Review Guidelines M-NCPPC
between the site and each super-district. The data inside the boxes must be developed using
judgment and confirmed by Transportation Planning staff. The rightmost portion of the table
multiplies the percent of trips distributed to each super-district by the percent of trips from that
super-district assigned to each route to calculate the percent of total site-generated trips using each
combination of distribution and assignment. The assignment data is then summed to develop an
aggregate trip assignment for the trips generated by the office and residential components of the
site, respectively.
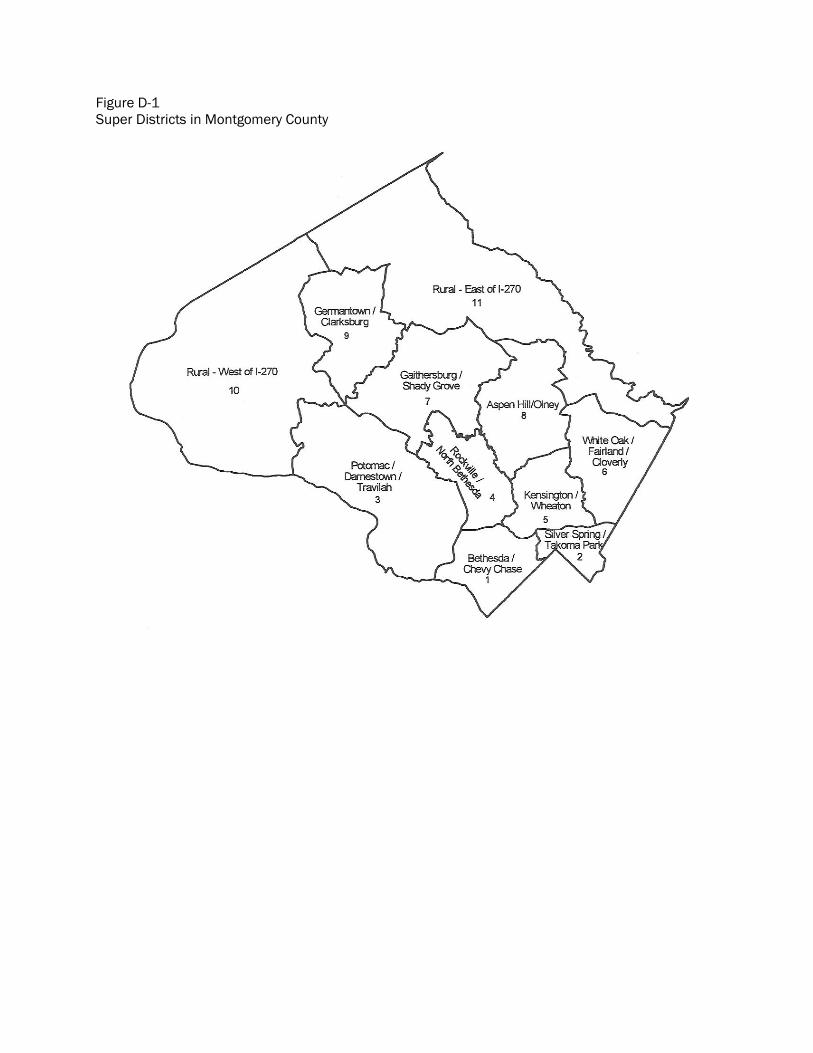
Figure D-1
Super Districts in Montgomery County
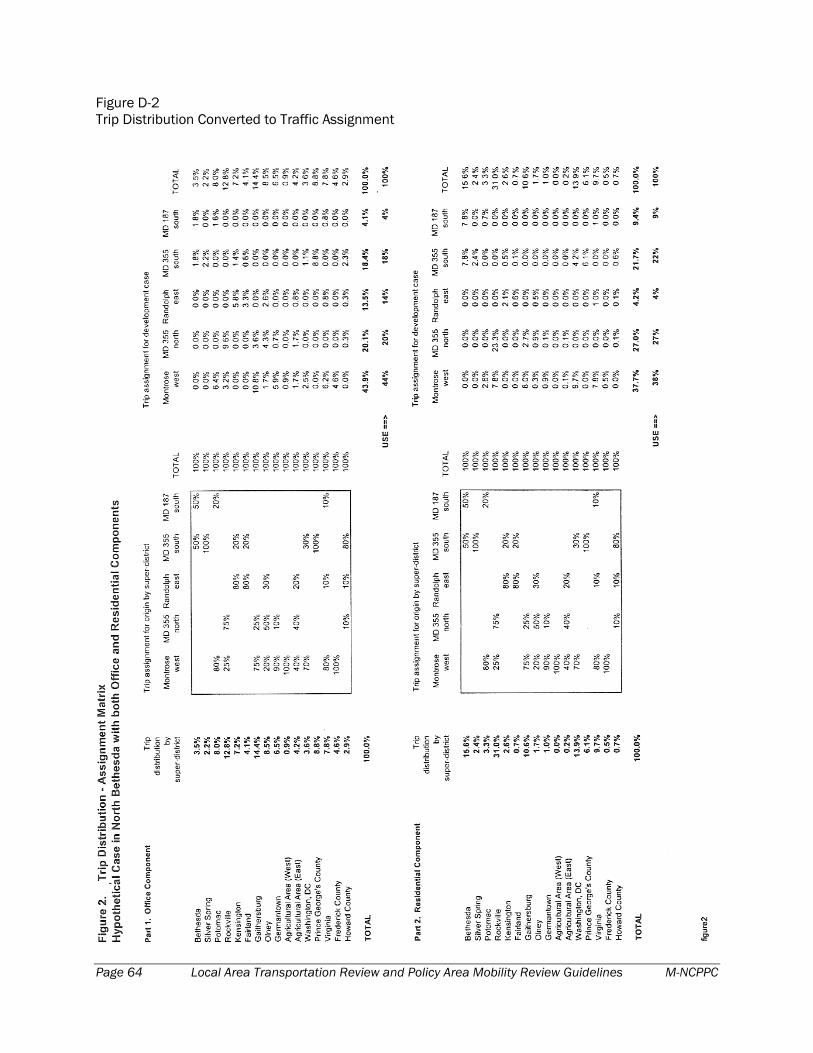
Page 64 Local Area Transportation Review and Policy Area Mobility Review Guidelines M-NCPPC
Figure D-2
Trip Distribution Converted to Traffic Assignment
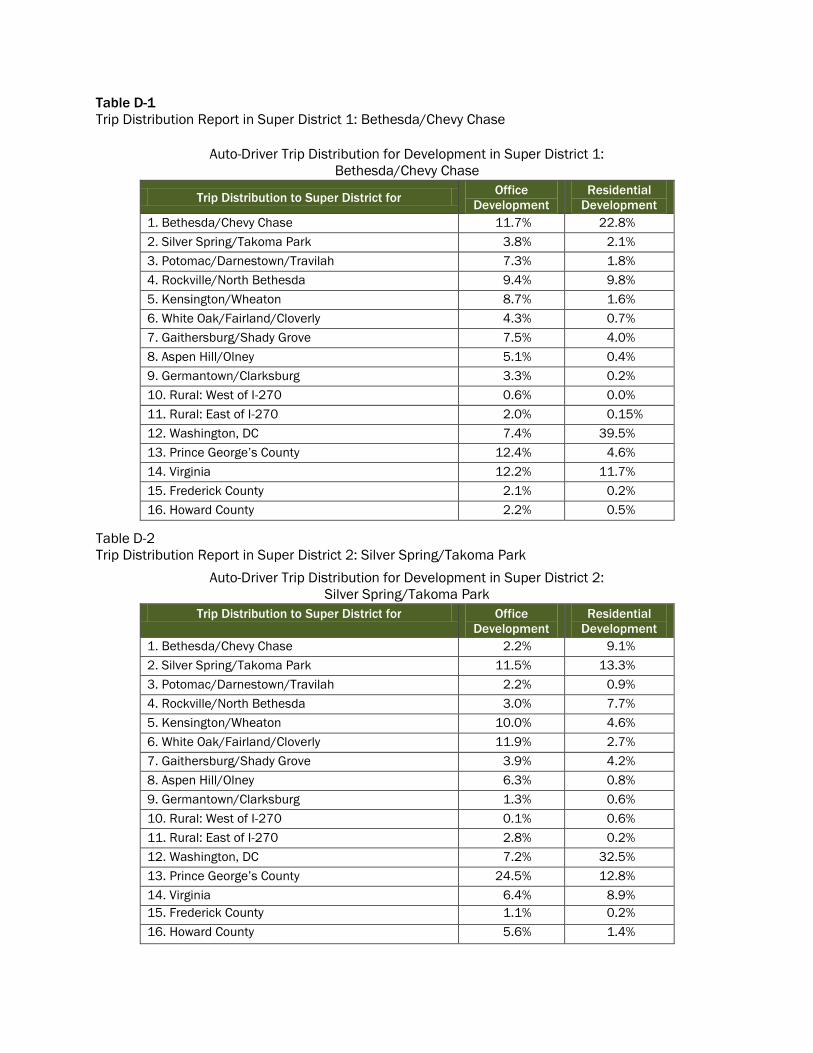
Table D-1 Trip Distribution Report in Super District 1: Bethesda/Chevy Chase
Auto-Driver Trip Distribution for Development in Super District 1:
Bethesda/Chevy Chase
Trip Distribution to Super District for Office
Development
Residential
Development
1. Bethesda/Chevy Chase 11.7% 22.8%
2. Silver Spring/Takoma Park 3.8% 2.1%
3. Potomac/Darnestown/Travilah 7.3% 1.8%
4. Rockville/North Bethesda 9.4% 9.8%
5. Kensington/Wheaton 8.7% 1.6%
6. White Oak/Fairland/Cloverly 4.3% 0.7%
7. Gaithersburg/Shady Grove 7.5% 4.0%
8. Aspen Hill/Olney 5.1% 0.4%
9. Germantown/Clarksburg 3.3% 0.2%
10. Rural: West of I-270 0.6% 0.0%
11. Rural: East of I-270 2.0% 0.15%
12. Washington, DC 7.4% 39.5%
13. Prince George’s County 12.4% 4.6%
14. Virginia 12.2% 11.7%
15. Frederick County 2.1% 0.2%
16. Howard County 2.2% 0.5%
Table D-2
Trip Distribution Report in Super District 2: Silver Spring/Takoma Park
Auto-Driver Trip Distribution for Development in Super District 2:
Silver Spring/Takoma Park
Trip Distribution to Super District for Office
Development
Residential
Development
1. Bethesda/Chevy Chase 2.2% 9.1%
2. Silver Spring/Takoma Park 11.5% 13.3%
3. Potomac/Darnestown/Travilah 2.2% 0.9%
4. Rockville/North Bethesda 3.0% 7.7%
5. Kensington/Wheaton 10.0% 4.6%
6. White Oak/Fairland/Cloverly 11.9% 2.7%
7. Gaithersburg/Shady Grove 3.9% 4.2%
8. Aspen Hill/Olney 6.3% 0.8%
9. Germantown/Clarksburg 1.3% 0.6%
10. Rural: West of I-270 0.1% 0.6%
11. Rural: East of I-270 2.8% 0.2%
12. Washington, DC 7.2% 32.5%
13. Prince George’s County 24.5% 12.8%
14. Virginia 6.4% 8.9%
15. Frederick County 1.1% 0.2%
16. Howard County 5.6% 1.4%
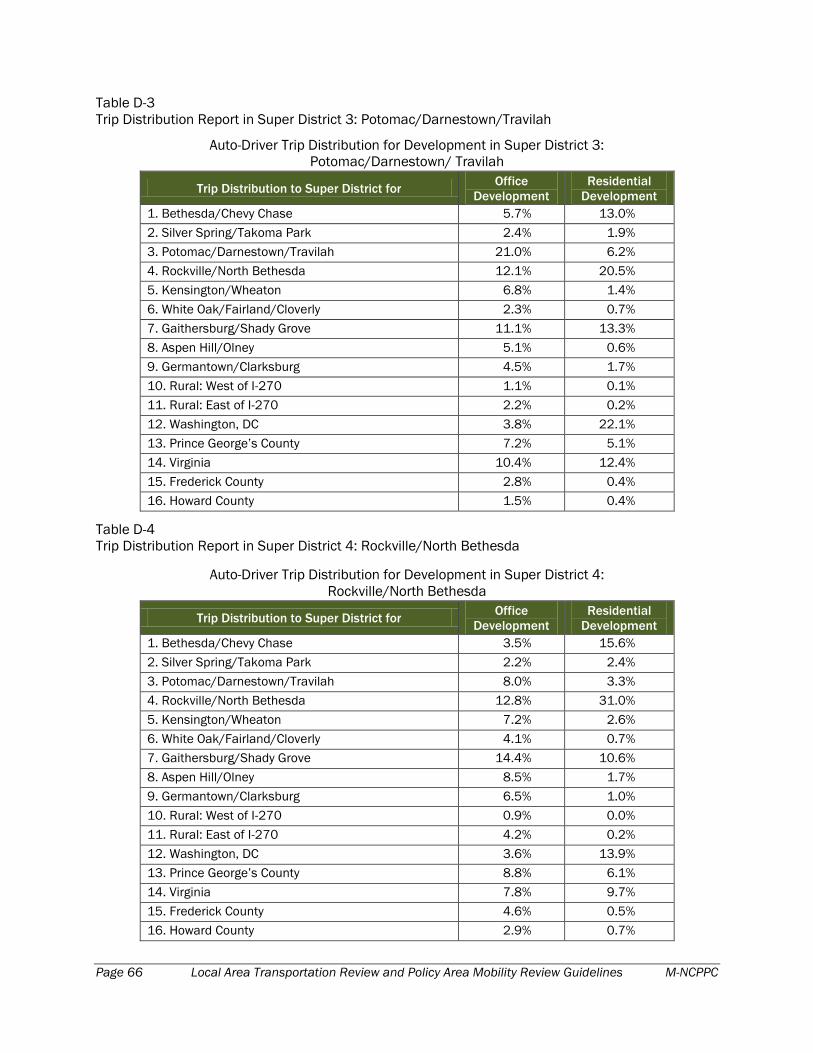
Page 66 Local Area Transportation Review and Policy Area Mobility Review Guidelines M-NCPPC
Table D-3
Trip Distribution Report in Super District 3: Potomac/Darnestown/Travilah
Auto-Driver Trip Distribution for Development in Super District 3:
Potomac/Darnestown/ Travilah
Trip Distribution to Super District for Office
Development
Residential
Development
1. Bethesda/Chevy Chase 5.7% 13.0%
2. Silver Spring/Takoma Park 2.4% 1.9%
3. Potomac/Darnestown/Travilah 21.0% 6.2%
4. Rockville/North Bethesda 12.1% 20.5%
5. Kensington/Wheaton 6.8% 1.4%
6. White Oak/Fairland/Cloverly 2.3% 0.7%
7. Gaithersburg/Shady Grove 11.1% 13.3%
8. Aspen Hill/Olney 5.1% 0.6%
9. Germantown/Clarksburg 4.5% 1.7%
10. Rural: West of I-270 1.1% 0.1%
11. Rural: East of I-270 2.2% 0.2%
12. Washington, DC 3.8% 22.1%
13. Prince George’s County 7.2% 5.1%
14. Virginia 10.4% 12.4%
15. Frederick County 2.8% 0.4%
16. Howard County 1.5% 0.4%
Table D-4
Trip Distribution Report in Super District 4: Rockville/North Bethesda
Auto-Driver Trip Distribution for Development in Super District 4:
Rockville/North Bethesda
Trip Distribution to Super District for Office
Development
Residential
Development
1. Bethesda/Chevy Chase 3.5% 15.6%
2. Silver Spring/Takoma Park 2.2% 2.4%
3. Potomac/Darnestown/Travilah 8.0% 3.3%
4. Rockville/North Bethesda 12.8% 31.0%
5. Kensington/Wheaton 7.2% 2.6%
6. White Oak/Fairland/Cloverly 4.1% 0.7%
7. Gaithersburg/Shady Grove 14.4% 10.6%
8. Aspen Hill/Olney 8.5% 1.7%
9. Germantown/Clarksburg 6.5% 1.0%
10. Rural: West of I-270 0.9% 0.0%
11. Rural: East of I-270 4.2% 0.2%
12. Washington, DC 3.6% 13.9%
13. Prince George’s County 8.8% 6.1%
14. Virginia 7.8% 9.7%
15. Frederick County 4.6% 0.5%
16. Howard County 2.9% 0.7%

Table D-5
Trip Distribution Report in Super District 5: Kensington/Wheaton
Auto-Driver Trip Distribution for Development in Super District 5:
Kensington/Wheaton
Trip Distribution to Super District for Office
Development
Residential
Development
1. Bethesda/Chevy Chase 2.7% 12.3%
2. Silver Spring/Takoma Park 6.2% 6.9%
3. Potomac/Darnestown/Travilah 2.6% 1.6%
4. Rockville/North Bethesda 5.1% 14.8%
5. Kensington/Wheaton 26.0% 11.1%
6. White Oak/Fairland/Cloverly 10.6% 2.2%
7. Gaithersburg/Shady Grove 5.5% 6.0%
8. Aspen Hill/Olney 10.3% 2.0%
9. Germantown/Clarksburg 2.1% 0.6%
10. Rural: West of I-270 0.2% 0.0%
11. Rural: East of I-270 4.3% 0.4%
12. Washington, DC 3.7% 22.6%
13. Prince George’s County 11.9% 9.5%
14. Virginia 4.1% 8.2%
15. Frederick County 1.5% 0.2%
16. Howard County 3.2% 1.5%
Table D-6
Trip Distribution Report in Super District 6: White Oak/Fairland/Cloverly
Auto-Driver Trip Distribution for Development in Super District 6:
White Oak/Fairland/ Cloverly
Trip Distribution to Super District for Office
Development
Residential
Development
1. Bethesda/Chevy Chase 1.3% 6.8%
2. Silver Spring/Takoma Park 4.5% 9.0%
3. Potomac/Darnestown/Travilah 1.7% 0.6%
4. Rockville/North Bethesda 1.7% 9.3%
5. Kensington/Wheaton 6.1% 5.0%
6. White Oak/Fairland/Cloverly 23.5% 9.3%
7. Gaithersburg/Shady Grove 3.2% 3.8%
8. Aspen Hill/Olney 6.2% 1.4%
9. Germantown/Clarksburg 0.4% 0.4%
10. Rural: West of I-270 0.1% 0.0%
11. Rural: East of I-270 2.8% 1.1%
12. Washington, DC 3.7% 23.4%
13. Prince George’s County 26.4% 20.1%
14. Virginia 3.4% 7.1%
15. Frederick County 1.6% 0.0%
16. Howard County 13.4% 2.7%
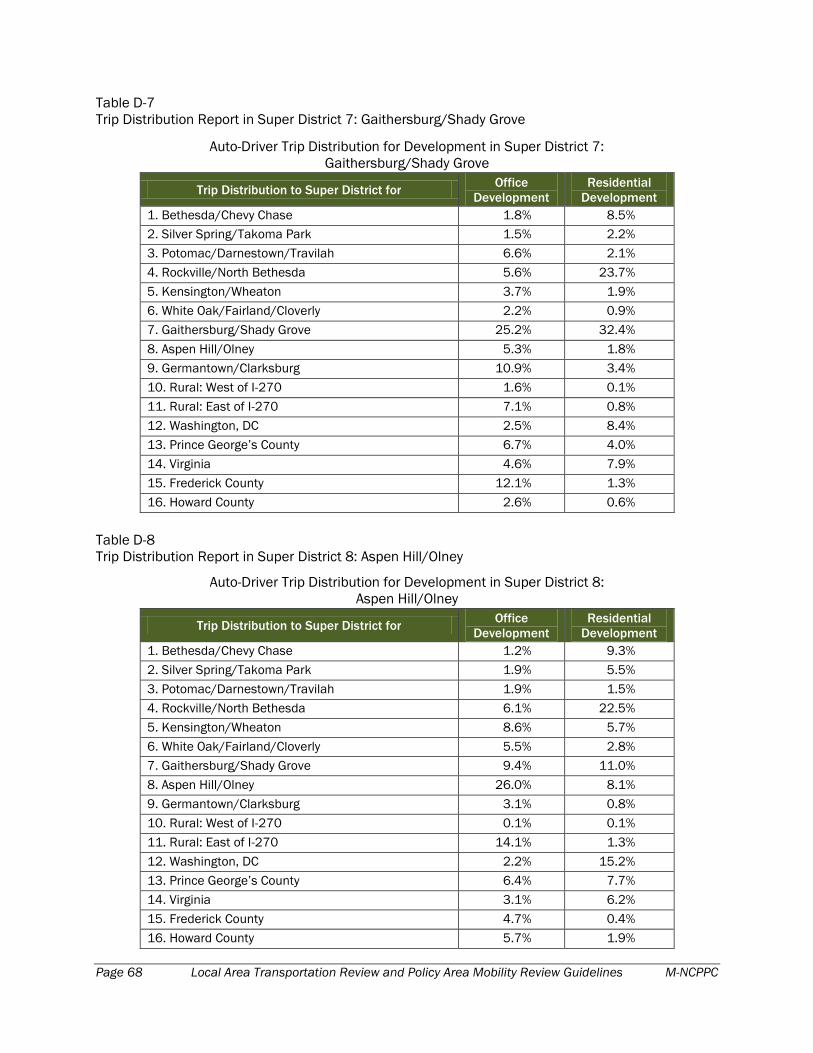
Page 68 Local Area Transportation Review and Policy Area Mobility Review Guidelines M-NCPPC
Table D-7
Trip Distribution Report in Super District 7: Gaithersburg/Shady Grove
Auto-Driver Trip Distribution for Development in Super District 7:
Gaithersburg/Shady Grove
Trip Distribution to Super District for Office
Development
Residential
Development
1. Bethesda/Chevy Chase 1.8% 8.5%
2. Silver Spring/Takoma Park 1.5% 2.2%
3. Potomac/Darnestown/Travilah 6.6% 2.1%
4. Rockville/North Bethesda 5.6% 23.7%
5. Kensington/Wheaton 3.7% 1.9%
6. White Oak/Fairland/Cloverly 2.2% 0.9%
7. Gaithersburg/Shady Grove 25.2% 32.4%
8. Aspen Hill/Olney 5.3% 1.8%
9. Germantown/Clarksburg 10.9% 3.4%
10. Rural: West of I-270 1.6% 0.1%
11. Rural: East of I-270 7.1% 0.8%
12. Washington, DC 2.5% 8.4%
13. Prince George’s County 6.7% 4.0%
14. Virginia 4.6% 7.9%
15. Frederick County 12.1% 1.3%
16. Howard County 2.6% 0.6%
Table D-8
Trip Distribution Report in Super District 8: Aspen Hill/Olney
Auto-Driver Trip Distribution for Development in Super District 8:
Aspen Hill/Olney
Trip Distribution to Super District for Office
Development
Residential
Development
1. Bethesda/Chevy Chase 1.2% 9.3%
2. Silver Spring/Takoma Park 1.9% 5.5%
3. Potomac/Darnestown/Travilah 1.9% 1.5%
4. Rockville/North Bethesda 6.1% 22.5%
5. Kensington/Wheaton 8.6% 5.7%
6. White Oak/Fairland/Cloverly 5.5% 2.8%
7. Gaithersburg/Shady Grove 9.4% 11.0%
8. Aspen Hill/Olney 26.0% 8.1%
9. Germantown/Clarksburg 3.1% 0.8%
10. Rural: West of I-270 0.1% 0.1%
11. Rural: East of I-270 14.1% 1.3%
12. Washington, DC 2.2% 15.2%
13. Prince George’s County 6.4% 7.7%
14. Virginia 3.1% 6.2%
15. Frederick County 4.7% 0.4%
16. Howard County 5.7% 1.9%

Table D-9
Trip Distribution Report in Super District 9: Germantown/Clarksburg
Auto-Driver Trip Distribution for Development in Super District 9:
Germantown/ Clarksburg
Trip Distribution to Super District for Office
Development
Residential
Development
1. Bethesda/Chevy Chase 0.6% 8.1%
2. Silver Spring/Takoma Park 1.4% 1.6%
3. Potomac/Darnestown/Travilah 5.5% 1.8%
4. Rockville/North Bethesda 3.5% 22.9%
5. Kensington/Wheaton 2.3% 1.6%
6. White Oak/Fairland/Cloverly 1.6% 0.2%
7. Gaithersburg/Shady Grove 17.2% 30.2%
8. Aspen Hill/Olney 2.5% 1.3%
9. Germantown/Clarksburg 25.2% 10.5%
10. Rural: West of I-270 2.6% 0.1%
11. Rural: East of I-270 8.0% 1.0%
12. Washington, DC 0.7% 7.0%
13. Prince George’s County 5.8% 3.8%
14. Virginia 3.0% 7.4%
15. Frederick County 18.1% 2.0%
16. Howard County 2.1% 0.5%
Table D-10
Trip Distribution Report in Super District 10: Rural – West of I-270
Auto-Driver Trip Distribution for Development in Super District 10:
Rural – West of I-270
Trip Distribution to Super District for Office
Development
Residential
Development
1. Bethesda/Chevy Chase 0.8% 9.7%
2. Silver Spring/Takoma Park 2.7% 0.7%
3. Potomac/Darnestown/Travilah 4.3% 2.9%
4. Rockville/North Bethesda 2.1% 20.1%
5. Kensington/Wheaton 0.8% 1.2%
6. White Oak/Fairland/Cloverly 0.0% 0.4%
7. Gaithersburg/Shady Grove 7.0% 30.0%
8. Aspen Hill/Olney 3.0% 0.4%
9. Germantown/Clarksburg 4.1% 7.1%
10. Rural: West of I-270 47.7% 9.1%
11. Rural: East of I-270 1.7% 0.5%
12. Washington, DC 0.0% 7.4%
13. Prince George’s County 2.1% 1.7%
14. Virginia 4.8% 4.5%
15. Frederick County 18.9% 3.8%
16. Howard County 0.0% 0.5%
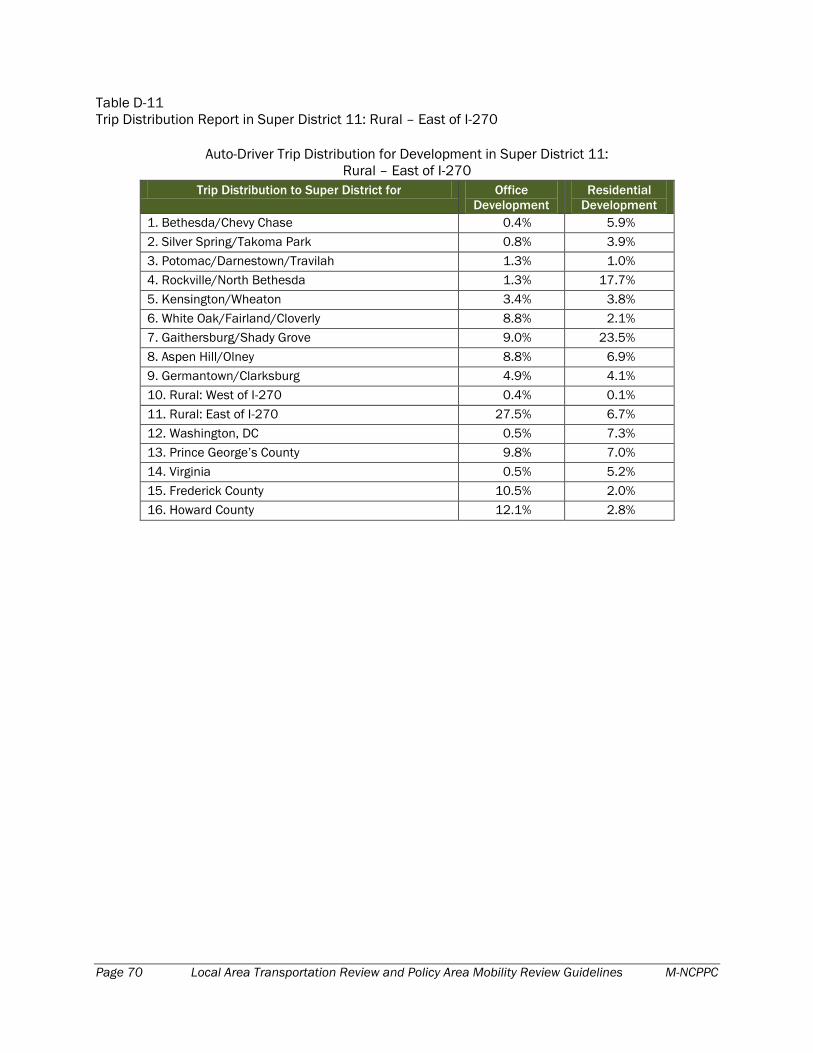
Page 70 Local Area Transportation Review and Policy Area Mobility Review Guidelines M-NCPPC
Table D-11
Trip Distribution Report in Super District 11: Rural – East of I-270
Auto-Driver Trip Distribution for Development in Super District 11:
Rural – East of I-270
Trip Distribution to Super District for Office
Development
Residential
Development
1. Bethesda/Chevy Chase 0.4% 5.9%
2. Silver Spring/Takoma Park 0.8% 3.9%
3. Potomac/Darnestown/Travilah 1.3% 1.0%
4. Rockville/North Bethesda 1.3% 17.7%
5. Kensington/Wheaton 3.4% 3.8%
6. White Oak/Fairland/Cloverly 8.8% 2.1%
7. Gaithersburg/Shady Grove 9.0% 23.5%
8. Aspen Hill/Olney 8.8% 6.9%
9. Germantown/Clarksburg 4.9% 4.1%
10. Rural: West of I-270 0.4% 0.1%
11. Rural: East of I-270 27.5% 6.7%
12. Washington, DC 0.5% 7.3%
13. Prince George’s County 9.8% 7.0%
14. Virginia 0.5% 5.2%
15. Frederick County 10.5% 2.0%
16. Howard County 12.1% 2.8%
Appendix E Procedures Delegating Certain APF Findings under Chapter 8
to Staff at Time of Building Permit
A. For a building permit where the PAMR and LATR tests are not needed, or when the tests are
conducted and a finding of no mitigation is required, a Transportation Planning supervisor can
make a finding that public facilities will be adequate to support the proposed development, set
the validity period for the APF approval and authorize release of the building permit.
B. For a building permit where the PAMR test requires mitigation between one and four trips, a
Transportation Supervisor may authorize release of the building permit by letter if:
1. The supervisor finds that the public facilities will be adequate for the proposed development
with the proposed trip mitigation and sets the validity period for the APF approval; AND
2. MCDOT, the Superintendent of the Montgomery County Public School System, County Fire
and Rescue Services, the Department of Police, and DPS have been notified of the method
of mitigation, and have not explicitly objected; AND
3. Interested parties and the applicant have been given notice of the pending case, and have
not objected to the proposed mitigation (see below, Noticing); AND
4. A copy of a permit for construction within the ROW for the mitigation item has been received
from DPS by the building permit coordinator.
C. For cases requiring mitigation of more than four vehicle trips, the item will be scheduled for an
APF finding at a public hearing before the Planning Board after 1), 2) and 4) above are met. If no
objections are raised by any interested parties or any of the agencies listed in 2) above, the case
may be scheduled as a consent item before the Planning Board.
D. If an Applicant requests a hearing before the Planning Board or if any interested party or agency
listed in 2) or 3) above objects to the proposed mitigation, the item will be scheduled for an APF
finding at a public hearing before the Planning Board.
Noticing
Applicant must notice all confronting and adjacent property owners, and community and
homeowners associations (following the procedure in the Development Review Manual) of the
application for APF approval as well as any proposed mitigation measures. The notice must also
state that anyone objecting to the proposal must do so in writing within 14 days to Transportation
Planning and provide the appropriate contact information.
Monthly Report
The Chief of Transportation Planning will provide a monthly report to the Planning Board indicating
each case approved by staff under this procedure in the previous month, and provide a copy of the
report to the Office of General Counsel.
Details on the DPS Public ROW Permit application process are found online at:
http://permittingservices.montgomerycountymd.gov/dpstmpl.asp?url=/permitting/r/nfdp.asp
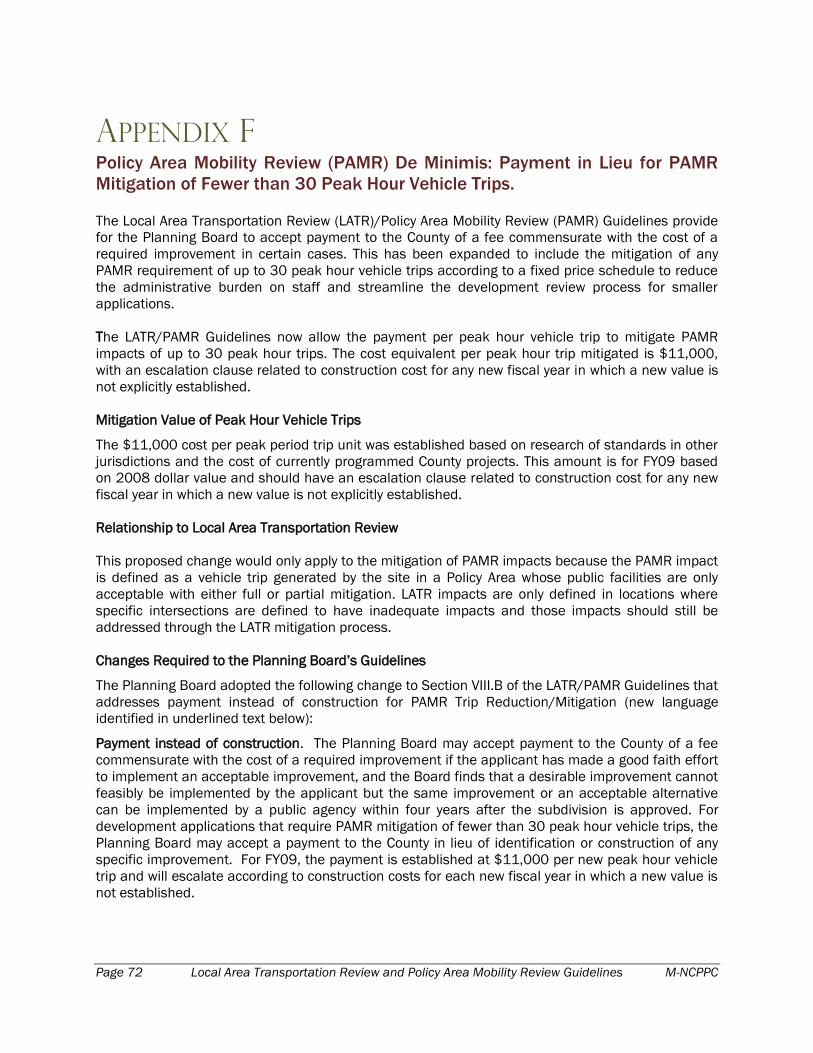
Page 72 Local Area Transportation Review and Policy Area Mobility Review Guidelines M-NCPPC
Appendix F Policy Area Mobility Review (PAMR) De Minimis: Payment in Lieu for PAMR
Mitigation of Fewer than 30 Peak Hour Vehicle Trips. The Local Area Transportation Review (LATR)/Policy Area Mobility Review (PAMR) Guidelines provide
for the Planning Board to accept payment to the County of a fee commensurate with the cost of a
required improvement in certain cases. This has been expanded to include the mitigation of any
PAMR requirement of up to 30 peak hour vehicle trips according to a fixed price schedule to reduce
the administrative burden on staff and streamline the development review process for smaller
applications.
The LATR/PAMR Guidelines now allow the payment per peak hour vehicle trip to mitigate PAMR
impacts of up to 30 peak hour trips. The cost equivalent per peak hour trip mitigated is $11,000,
with an escalation clause related to construction cost for any new fiscal year in which a new value is
not explicitly established.
Mitigation Value of Peak Hour Vehicle Trips The $11,000 cost per peak period trip unit was established based on research of standards in other
jurisdictions and the cost of currently programmed County projects. This amount is for FY09 based
on 2008 dollar value and should have an escalation clause related to construction cost for any new
fiscal year in which a new value is not explicitly established.
Relationship to Local Area Transportation Review
This proposed change would only apply to the mitigation of PAMR impacts because the PAMR impact
is defined as a vehicle trip generated by the site in a Policy Area whose public facilities are only
acceptable with either full or partial mitigation. LATR impacts are only defined in locations where
specific intersections are defined to have inadequate impacts and those impacts should still be
addressed through the LATR mitigation process. Changes Required to the Planning Board’s Guidelines The Planning Board adopted the following change to Section VIII.B of the LATR/PAMR Guidelines that
addresses payment instead of construction for PAMR Trip Reduction/Mitigation (new language
identified in underlined text below): Payment instead of construction. The Planning Board may accept payment to the County of a fee
commensurate with the cost of a required improvement if the applicant has made a good faith effort
to implement an acceptable improvement, and the Board finds that a desirable improvement cannot
feasibly be implemented by the applicant but the same improvement or an acceptable alternative
can be implemented by a public agency within four years after the subdivision is approved. For
development applications that require PAMR mitigation of fewer than 30 peak hour vehicle trips, the
Planning Board may accept a payment to the County in lieu of identification or construction of any
specific improvement. For FY09, the payment is established at $11,000 per new peak hour vehicle
trip and will escalate according to construction costs for each new fiscal year in which a new value is
not established.
Staff Acknowledgement
SENIOR MANAGEMENT
Rollin Stanley, Director
Montgomery County Planning Department
Dan Hardy, P.E., Acting Chief
Transportation Planning
PROJECT LEAD
David Paine, PTP
Transportation Planning
CONTRIBUTING STAFF
Shahriar Etemadi
Chuck Kines
Ed Axler
TECHNICAL STAFF
Fiona Thomas
Tiffany Celey

Page 74 Local Area Transportation Review and Policy Area Mobility Review Guidelines M-NCPPC
On the Web: http://www.mc-mncppc.org
THE MARYLAND-NATIONAL CAPITAL PARK AND PLANNING COMMISSION Montgomery County Planning Department 8787 Georgia Avenue Silver Spring, MD 20910-3760