Embed Size (px)
Citation preview

r_
(NAqA- 1-P-3u?_
t
Loads Analysis and Testingof Flight ConfigurationSolid Rocket Motor .............Outer Boot Ring Segments
Rafiq Ahmed
LOA_ A_ALY--SIS AN_ TESTIN_ Nqo-2q_. 6
I
_F FLIGNT C_NFIGURATiON
JUT_R BOOT RING SegMENTSS_7_LIL)ROCKET MOTOR
{NASA} '_7 pCSCL 20K Unclas =
HI/J9 0791048 1 1
https://ntrs.nasa.gov/search.jsp?R=19900016050 2020-01-13T06:42:25+00:00Z

I
e

NASATechnicalPaper3028
1990
National Aeronautics andSpace Administration
Office of ManagementScientific and TechnicalInformation Division
Loads Analysis and Testingof Flight ConfigurationSolid Rocket Motor
Outer Boot Ring Segments
Rafiq Ahmed
George C. Marshall Space Flight Center
Marshall Space Flight Center, Alabama

lp o
TABLE OF CONTENTS
Page
I. INTRODUCTION ...................................................................................... l
A. Purpose .............................................................................................. I
B. Summary ............................................................................................. I
II. BOOTRING BEAM TESTS .......................................................................... 2
A. Test Specimens ..................................................................................... 2B. Test Fixture .......................................................................................... 2
C. Instrumentation ..................................................................................... 2
D. Procedure ............................................................................................ 2
E. Results ................................................................................................ 3
III. MATHEMATICAL MODELS OF OBR BEAM SEGMENT .................................... 3
A. Hand Analysis ...................................................................................... 3
B. Finite Element Analysis ........................................................................... 4
IV. DISCUSSION ........................................................................................... 4
\. Failure Loads ........................................................................................ 4
B. Load Versus Strain and Deflection ............................................................... 4
C. Comparison of Test and Hand Analysis ......................................................... 5
D. Comparison of Test and Finite Element Analysis .............................................. 5
V. CONCLUSIONS ........................................................................................ 6
BIBLIOGRAPHY ............................................................................................. 8
APPENDIX ..................................................................................................... 9
iii
PRECEDING PAGE BLANK NOT FILMED

Figure
I.
2.
3.
4.
5.
6.
7.
,
,
10.
II.
12.
13.
14.
15.
16.
LIST OF ILLUSTRATIONS
Title
MSFC fabricated OBR beam segment configuration ...........................................
Boot ring beam test setup ...........................................................................
Boot ring beam shear diagram .....................................................................
Boot ring beam bending moment diagram .......................................................
OBR beam stress-strain profiles through thickness .............................................
Finite element representation of boot ring beam ................................................
Boot ring beam test No. I, backup-up 3/9/89, load versus deflection,
specimen No. 1 ......................................................................................
Boot ring beam test No. !, backup-up 3/9/89, load versus maximum
tension strain, specimen No. 1.....................................................................
Boot nng beam test No. l, backup-up 3/9/89, load versus maximum
transverse strain, specimen No. 1 .................................................................
Boot ring beam test No. 2, backup-up 3/9/89, load versus deflection,
specimen No. 1 ......................................................................................
Boot ring beam test No. 2, backup-up 3/9/89, load versus maximum
tension strain, specimen No. 1.....................................................................
Boot ring beam test No. 2, backup-up 3/9/89, load versus maximum
transverse strain, specimen No. 1 .................................................................
Boot ring beam test No. 3, backup-up 3/9/89, load versus deflection,
specimen No. I ......................................................................................
Boot nng beam test No. 3, backup-up 3/9/89, load versus maximum
tension strain, specimen No. ! .....................................................................
Boot nng beam test No. 3, backup-up 3/9/89, load versus maximum
transverse strain, specimen No. 1 ...........................................................
Boot ring beam test No. 1, backup-down 3/9/89, load versus deflection,
specimen No. 1 ......................................................................................
Page
15
16
17
17
18
18
19
19
20
20
21
21
_m
22
23
23
iv

LIST OF ILLUSTRATIONS (Continued)
Figure Title Page
17. Boot ring beam test No. l, backup-down 3/9/89, load versus maximum
tension strain, specimen No. ! ..................................................................... 24
18. Boot ring beam test No. I, backup-down 3/9/89, load versus maximum
transverse strain, specimen No. l ................................................................. 24
19. Boot ring beam test No. 2, backup-down 3/9/89, load versus deflection,
specimen No. I ...................................................................................... 25
20. Boot ring beam test No. 2, backup-down 3/9/89, load versus maximum
tension strain, specimen No. 1..................................................................... 25
21. Boot ring beam test No. 2, backup-down 3/9/89, load versus maximum
transverse strain, specimen No. I ................................................................. 26
22. Boot ring beam test No. 3, backup-down 3/9/89, load versus deflection,
specimen No. 1 ...................................................................................... 26
23. Boot ring beam test No. 3, backup-down 3/9/89, load versus maximum
tension strain, specimen No. 1 ..................................................................... 27
24. Boot ring beam test No. 3, backup-down 3/9/89, load versus maximum
transverse strain, specimen No. I ................................................................. 27
25. Boot ring beam ultimate test, backup-up 3/9/89, load versus maximum
tension strain, specimen No. 1..................................................................... 28
26. Boot nng beam ultimate test, backup-up 3/9/89, load versus maximum
transverse strain, specimen No. 1 ................................................................. 28
27. Boot nng beam ultimate test, backup-up 3/9/89, load versus deflection,
specimen No. 1 ...................................................................................... 29
28. Boot nng beam test No. 1, backup-up 5/10/89, load versus deflection,
specimen No. 2 ...................................................................................... 29
29. Boot nng beam test No. l, backup-up 5/10/89, load versus maximum
tension strain, specimen No. 2 ..................................................................... 3O
30. Boot nng beam test No. 1, backup-up 5/10/89, load versus maximum
transverse strain, specimen No. 2 ................................................................. 3O
V

LIST OF ILLUSTRATIONS (Continued)
Figure
31.
32.
33.
34.
35.
36.
37.
38.
39.
40.
41.
42.
43.
Title
Boot ring beam test No. 1, backup-down 5/10/89, load versus deflection,
specimen No. 2 ......................................................................................
Boot ring beam test No. 1, backup-down 5/10/89, load versus maximum
tension strain, specimen No. 2 .....................................................................
Boot ring beam test No. 1, backup-down 5/10/89, load versus maximum
transverse strain, specimen No. 2 ............................................................
Boot ring beam test No. 2, backup-up 5/10/89, load versus deflection,
specimen No. 2 ......................................................................................
Boot ring beam test No. 2, backup-up 5/10/89, load versus maximum
tension strain, Specimen No. 2 .....................................................
Boot ring beam test No. 2, backup-up 5/10/89, load versus maximum
transverse strain, specimen No. 2 .................................................................
Boot ring beam test No. 2, backup-down 5/10/89, load versus deflection,
specimen No. 2 ......................................................................................
Boot ring beam test No. 2, backup-down 5/10/89, load versus maximum
tension strain, specimen No. 2 .....................................................................
Boot ring beam test No. 2, backup-down 5/10/89, load versus maximum
transverse strain, specimen No. 2 .................................................................
Boot ring beam test No. 3, backup-up 5/10/89, load versus deflection,
specimen No. 2 ......................................................................................
Boot ring beam test No. 3, backup-up 5/10/89, load versus maximum
tension strain, specimen No. 2 ...................................................................
Boot ring beam test No. 3, backup-up 5/10/89, load versus maximum
transverse strain, specimen No. 2 .................................................................
Boot ring beam test No. 3, backup-down 5/10/89, load versus deflection,
specimen No. 2 ......................................................................................
Page
31
31
32
32
33
33
34
34
35
35
36
36
37
vi

LIST OF ILLUSTRATIONS (Concluded)
Figure
44.
45.
46.
47.
48.
Title Page
Boot ring beam test No. 3, backup-down 5/10/89, load versus maximum
tension strain, specimen No. 2 .....................................................................
Boot ring beam test No. 3, backup-down 5/10/89, load versus maximum
transverse strain, specimen No. 2 .................................................................
Boot ring beam ultimate test, backup-down 5/10/89, load versus deflection,
specimen No. 2 ......................................................................................
Boot ring beam ultimate test, backup-down 5/10/89, load versus
maximum tension strain, specimen No. 2 ........................................................
Boot ring beam ultimate test, backup-down 5/10/89, load versus
maximum transverse strain, specimen No. 2 ....................................................
37
38
38
39
39
LIST OF TABLES
Table
1.
2.
3.
4.
Title Page
Load, deflection, strain at maximum load during ultimate tests .............................. 13
Elastic slopes of load versus strain, deflection curves .......................................... 13
Plastic slopes of load versus strain, deflection curves .......................................... 14
Load and deflection finite element model predictions .......................................... 14
vii

S

TECHNICAL PAPER
LOADS ANALYSIS AND TESTING OF FLIGHT CONFIGURATION SOLID ROCKET
MOTOR OUTER BOOT RING SEGMENTS
I. INTRODUCTION
After the Development Motor-9 (DM-9) involute carbon phenolic outer boot ring (OBR) failed
during the test firing, NASA decided to commence post-Challenger shuttle flights with the DM-8 con-
figuration "structural backup" OBR. This OBR configuration has proved satisfactory and is currently
being used in the redesigned solid rocket motor (RSRM). In order to study the structural behavior and
strength of this ring configuration, a series of four-point bending tests were initiated at MSFC using flat
beams to closely simulate the ring"s geometry. The radius of the boot ring is large enough to allow the
use of flat beams (of the same cross section) to simulate a section of the boot ring.
A. Purpose
The objectives of the OBR load tests were as follows:
I. Assess the bending strength of the OBR segment.
2. Assess the load/stress versus strain relationships during bending for a linear elastic loading
condition.
3. Determine what effect, if any, the position of the structural backup had on tension and
compression load/stress versus strain relationships (i.e., backup side up versus backup side down).
4. Compare test results with analytical and finite element analyses accounting for anisotropy, ply
angles, backup orientation, etc.
B. Summary
This report discusses the boot ring beam tests and presents the recorded test data in graphic form.
The results of the two specimens used are compared with each other and with the analytical and finite
element predictions. Assessments of the strength of the beams, the effect of the backup, stiffness, and
agreement with predictions are given.
The tests were conducted between March 1, 1989, and May 15, ! 989, at the MSFC Test Labora-
tory (ET52, now ED72). Strain gauges and electrodisplacement indicators (EDI's) were placed at
various locations on each segment in order to record the load, strains, and displacements encountered.
Analysis and data review were performed by the MSFC Structures and Dynamics Laboratory.

II. BOOT RING BEAM TESTS
The boot ring beam tests were conducted under the supervision of the MSFC Test Laboratory
(ET52).
A. Test Specimens
Each of tile two specimens was a 48-in long straight beam segment using the same construction as
the current SRM OBR. This consists of a section of 35-degree carbon phenolic plies bonded to a "struc-
tural backup" section of 0-degree carbon phenolic plies. To simulate the OBR during mid-burn to end-of-
burn conditions, a beam of rectangular cross section was designed with a 0.55-in thick 0-degree struc-
tural backup component bonded to a 1.20-in thick 35-degree section. The width of the beams was 6.5 in
(Fig. !).
B. Test Fixture
The test fixture consisted of a 50,000-1b load cell with a hydraulic actuator and all the appropriate
hardware needed to load the specimen in four-point bending. The specimen was mounted with fixtures
spaced 42-in apart and configured such that it could move in its longitudinal direction. Essential to a
successful test was the proper application of the four-point bending loads to the segment. This was
accomplished by using Teflon pads to distribute the load and minimize friction (thereby insuring a point
load application) between load applicator and segment. A load point was applied 12-in from each mount-
ing fixture (Fig.2).
C. Instrumentation
Each segment was instrumented by the Test Laboratory at MSFC with uniaxial and triaxial strain
gauges. All gauges were placed at various positions in the middle of each specimen (Fig. t). The uniaxial
gauges measured tensile and compressive outer fiber strains as well as strains across the thickness. The
triaxial gauges measured strains in the outer fiber and cross-width directions.
D. Procedure
Load was applied to the 48-in specimen via a singIe actuator and distributed to two loading pads,
producing four-point bending. Two specimens were tested, each being loaded several times to half the
expected ultimate strain (with the structural backup oriented both upward and downward) to simulate an
elastic load case. The first segment was loaded three times elastically with the backup side up, three
times elastically with the backup side down, and then loaded to failure with the structural backup oriented
upward. The second specimen was also loaded elastically three times for each backup orientation, but
was subsequently loaded to failure with the backup facing downward. Load, deflection, and strains were
measured and recorded every 250 to 500 milliseconds during each of these tests. All tests were conducted
at room temperature (approximately 70 °F).
L

E. Results
The deflections and strains at maximum load are shown in Table !. The slopes of the elastic and
"plastic" load versus longitudinal strain, load versus deflection, and load versus transverse strain plots
are shown in Tables 2 and 3. Elastic and plastic slopes of these curves were computed using the linear
regression routine in the Lotus I-2-3 IBM-PC software. Figures 7 through 48 show the actual load versus
deflection and load versus strain plots. Finally, the finite element model data are shown in Table 4.
III. MATHEMATICAL MODELS OF OBR BEAM SEGMENT
Hand analysis and finite element models were constructed to predict the behavior for the com-
posite carbon phenolic material under the applied four-point bending load. Each is described below.
A. Hand Analysis
The hand analysis was based on treating the segment as a beam of constant cross section loaded in
four-point bending with the following simplifying assumptions:
I. Since the elastic moduli in all three orthogonal directions are very similar, the carbon phenolic
material was assumed to be isotropic. The material orientations were also ignored and simple beam
theory was applied. Also ignored was the fact that the cross-ply material strength is significantly lower
than the warp or fill strengths.
2. Shear coupling is assumed to be nonexistent (i.e., shear stresses are independent of normal
stresses). The stress-strain relationships for normal tensors are independent from the shear stress-strain
relationships.
3. Since the material is almost isotropic, no effective difference between the backup and 35-
degree ply components of the beam is assumed.
4. Failure is conservatively assumed to occur as soon as the outermost fibers of the beam reach
the nominal ultimate strength of the material.
5. The strains are assumed to be a linear function of distance from both tension and compression
sides of the neutral axis. The stresses, on the other hand, are assumed to be linear as a function of dis-
tance on the compression side of the neutral axis and bilinear on the tension side of the neutral axis.
6. The deflection was calculated using the elastic deflection equation for four-point bending.
This is not entirely accurate because the material undergoes plasticity before failure occurs; this method
was used in the absence of relations describing the deflections of plastic beams.
Figure 1 shows the simply supported beam situation used to model the OBR beam test. Figures 3
and 4 show the shear and bending moment diagrams, respectively. Figure 5 exhibits the strain versus
thickness and stress versus thickness diagrams assumed for the beam.
3

The calculation predicted the failure load to be 11,376 lb with a maximum deflection of 3.647 in.
The details of how this analysis was derived are illustrated in the appendix.
B. Finite Element Analysis
The finite element representation of the beam was constructed using the FANTASTIC code
developed by Failure Analysis Associates, Palo Alto, CA. FANTASTIC is designed for use in nozzle
and nozzle component analysis and is well suited to model the 45-degree warp-fill bias commonly found
in carbon and glass composite nozzle parts. The specimen was modeled in two dimensions and used a
plane strain linear elastic solution scheme to simulate the elastic test runs. Since FANTASTIC's non-
linear capability was not fully developed at the time of this writing, predictions of the plastic behavior of
the beam could not be made. The model is shown in Figure 6.
The results of the two-dimensional finite element analysis are shown in Table 4, having given
predictions for strain along the longitudinal axis of the beam and deflections perpendicular to the beam
longitudinal axis.
IV. DISCUSSION
A. Failure Loads
This section compares the failure load for the backup-up specimen with that of the backup-down
specimen. As shown in Table 1, the backup-up specimen and backup-down specimen exhibited approxi-
mately the same failure loads and deflections, although the backup-up specimen failed at a slightly higher
load. This showed that the backup orientation had a little but noticeable effect on the final failure load of
the beam. It should be noted that the backup comprised only about 31 percent of the beam's volume. The
rest of the beam consisted of plies oriented at 35 degrees to the beam's longitudinal direction, which
cause more cross-ply failures during loading. The cross-ply strength of carbon phenolics is much less
than the warp and fiil strengths.
B. Load Versus Strain and Deflection
As seen in metallic materials, the load versus strain and load versus deflection curves were linear
in the elastic range with a decrease in slope as higher loads were reached. The decrease in slope happened
over a small range of abscissa (strain or deflection) values, thus making the curves essentially bilinear.
This is a valuable observation for hand and finite element analysis assumptions.
The elastic stiffnesses are essentially similar for both backup-up and backup-down beams. How-
ever, the bilinear transition point (the location on the curve where the material behavior changes marked-
ly from elastic to plastic) is different between the two beams. This point occurs sooner on the backup-
down specimen than on the backup-up specimen. This was attributed to the 0-degree plies being in ten-
sion on the backup-up specimen. Since these plies are oriented in the longitudinal direction (the direction
of thehighestbendingstresses),theywill beginyieldingat a higherloadthanthe 35-degreepliesof thebackup-downsection(whichhaveacross-plystresscomponentwith respectto the longitudinalbendingstress).
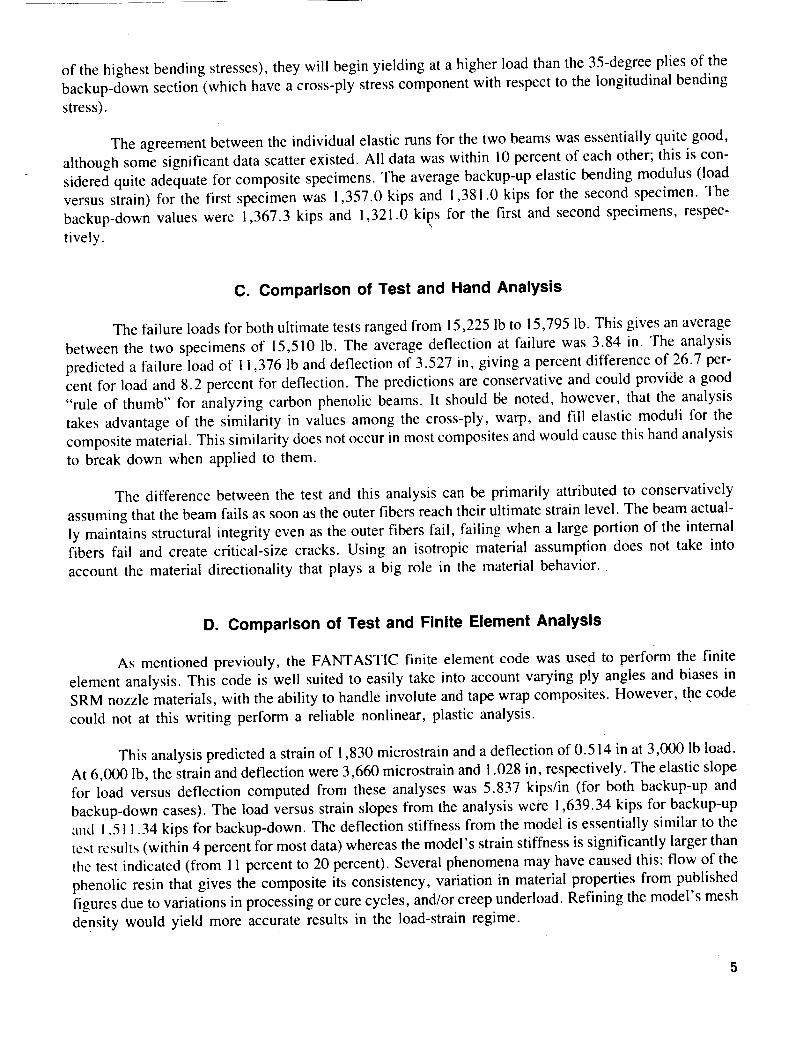
Theagreementbetweentheindividualelasticrunsfor thetwo beamswasessentiallyquitegood,althoughsomesignificantdatascatterexisted.All datawaswithin l0 percentof eachother; this is con-sideredquite adequatefor compositespecimens.Theaveragebackup-upelasticbendingmodulus(loadversusstrain) for the first specimenwas 1,357.0kips and 1,381.0kips for the secondspecimen.Thebackup-downvalueswere 1,367.3kips and !,321.0 kips for the first and secondspecimens,respec-tively.
C. Comparison of Test and Hand Analysis
The failure loads for both ultimate tests ranged from 15,225 lb to 15,795 lb. This gives an average
between the two specimens of I5,510 lb. The average deflection at failure was 3.84 in. The analysis
predicted a failure load of 11,376 lb and deflection of 3.527 in, giving a percent difference of 26.7 per-
cent for load and 8.2 percent for deflection. The predictions are conservative and couId provide a good
"rule of thumb" for analyzing carbon phenolic beams. It should be noted, however, that the analysis
takes advantage of the similarity in values among the cross-ply, warp, and fill elastic moduli for the
composite material. This similarity does not occur in most composites and would cause this hand analysis
to break down when applied to them.
The difference between the test and this analysis can be primarily attributed to conservatively
assuming that the beam fails as soon as the outer fibers reach their ultimate strain level. The beam actual-
ly maintains structural integrity even as the outer fibers fail, failing when a large portion of the internal
fibers fail and create critical-size cracks. Using an isotropic material assumption does not take into
account the material directionality that plays a big role in the material behavior.
D. Comparison of Test and Finite Element Analysis
As mentioned previouly, the FANTASTIC finite element code was used to perform the finite
element analysis. This code is well suited to easily take into account varying ply angles and biases in
SRM nozzle materials, with the ability to handle involute and tape wrap composites. However, the code
could not at this writing perform a reliable nonlinear, plastic analysis.
This analysis predicted a strain of 1,830 microstrain and a deflection of 0.514 in at 3,000 Ib load.
At 6,000 lb, the strain and deflection were 3,660 microstrain and 1.028 in, respectively. The elastic slope
for load versus deflection computed from these analyses was 5.837 kips/in (for both backup-up and
backup-down cases). The load versus strain slopes from the analysis were 1,639.34 kips for backup-up
and 1,511.34 kips for backup-down. The deflection stiffness from the model is essentially similar to the
tcst results (within 4 percent for most data) whereas the model's strain stiffness is significantly larger than
the test indicated (from I 1 percent to 20 percent). Several phenomena may have caused this: flow of the
phenolic resin that gives the composite its consistency, variation in material properties from published
figures due to variations in processing or cure cycles, and/or creep underload. Refining the model's mesh
density would yield more accurate results in the load-strain regime.

Note that, as expected, the model shows a larger stiffness for the backup-up case than for the
backup-down case. This results from the added stiffness of the backup section in tension. Since the
compressive strength is much greater in absolute value than the tensile strength (be it yield strength or
ultimate strength), the higher modulus of the backup section results in a higher effective bending stiffness
when it is in the tension position. The 35-degree nonbackup section has a lower effective stiffness due to
the longitudinal ending stress being partially resisted in the low-modulus cross-ply direction. Such an
effect is noticeable from the test data, but is much less than predicted by the analysis; this is also possibly
due to creep or flow of the phenolic resin under load, which would cause more strain in the phenolic than
expected. More tests should be made to more closely evaluate the viscoelastic behavior of carbon
phenolic and other composite materials used in industry.
As finite element codes are further developed for use in the SRM nozzle industry, their nonlinear
capability should improve. It would then be instructive to make nonlinear runs of these boot ring test
configurations and compare them with the test results. Such phenomena as the bilinear transition region
of the stress-strain curve (discussed earlier) could then be compared to the analysis.
Also important is that the material properties used in the finite element model are not well defined
for composite materials. Differing processes in fabrication, layup, and cure cycles among batches of
carbon phenolics can cause much greater scatter in material properties than is normal or acceptable formetallic materials. This would subsequently create inaccuracies between model and test data.
V. CONCLUSIONS
The bending strength of the beam is derived from the ultimate test load as described in the
appendix and is found to be 14.47 kip-in/in with the backup side up and 13.95 kip-in/in with the backupside down.
In general, the finite element analysis and test results compared favorably in the linear elastic
stress-strain region. Using a finer mesh would most likely have yielded even closer agreement, since
coarse finite element models are generally too "stiff." Further development of the nonlinear composite
analysis capability is needed to analyze the full loading spectrum, exhibiting the bilinear materialbehavior more accurately.
The analytical hand solution employed for these carbon phenolic beams gave conservative results
and can be used to arrive at quick design solutions for carbon phenolic beams without creating a finite
element model. However, it must be emphasized that this can only be used for carbon phenolic materials
which have similar elastic moduli in the three orthogonal coordinate directions. Most other composite
materials do not fit into this category.
As expected, the bending strength of the beam is greatest when the backup is oriented upward; the
maximum strength in bending is realized when the material fibers are oriented parallel to the longitudinal
stresses on the tension side. It is important to note that the tension side of the beam is the primary driver
in the failure mechanism; the tensile strength is normally much lower than the compressive strength for atypical composite material.
6

The bilinear transition point is a quantity unique to the bending of composite materials in that it
depends on the orientation of the backup. This transition between the elastic and plastic portion of the
load-strain and load-deflection curves occurs at a higher strain for the backup-up case than with the
backup-down. This can be important when deciding how to orient the beam during the design process.
Further investigation of tension, compression, bending, buckling, viscoelasticity and other physi-
cal processes are necessary to better understand composite material behavior and to develop better design
criteria for composite structures. The series of tests described in this report only utilized two beam
specimens. More specimens need to be fabricated and tested to gather more and different types of data.
The scope of a complete test program would include all of the aforementioned physical phenomena.
7

BIBLIOGRAPHY
I. Bee), F., and Johnston, E." "Mechanics of Materials." McGraw-Hill, 1981.
2. Tirnoshenko, S., and Goodier, J.: "'Theory of Elasticity." McGraw-Hill, 1951.
3. Dally, J., and Riley, W.: "Experimental Stress Analysis." McGraw-Hill, 1965.
4. Bolieau, D.J., et al: "'RSRM Nozzle Stress Report." TWR-16975, Morton-Thiokol Wasatch Divi-
sion, November 25, 1987.
5. Rebello, C.J., et al: "Space Shuttle RSRM Nozzle Materials Data Book." TWR-15995, Morton-Thiokol Wasatch Division, November 25, 1987.
6. Gutierrez-Lemini, D., et al: "RSRM Structural Material Properties Data Book." TWR-18011,
Morton-Thioko] Wasatch Operations, April, 1988.
7. "'FANTASTIC/FAST Structural Analysis Module, Version 1.3, User's Manual "" Failure Analysis
Associates, June 1989.
8. "'FANTASTIC/PATRAN Translators, Version 1.3, User's Manual." Failure Analysis Associates,June 1989.
=
z
Z
r

APPENDIX
DERIVATION OF FAILURE LOAD FOR DM8 OUTER BOOT RING SPECIMENS IN
FOUR-POINT BENDING
The following assumptions were made in order to analyze this situation:
I. The carbon phenolic material is assumed to be isotropic at room temperature since all three
elastic moduli are approximately the same.
2. Shear coupling terms are neglected (i.e., shear stresses are independent of the normal
stresses).
3. There is no effective difference between backup and nonbackup parts of beam.
4. Failure is assumed to occur as soon as outer fiber reaches ultimate stress.
The following stress and strain profiles are exhibited through the thickness of the beam when
looking at a longitudinal cross section of the beam:
etu stu
ec \ sc
neutral axis
Note that a linear strain distribution is assumed as a function of distance from either side of the
neutral axis of the beam. The tension stress-strain curve is assumed bilinear and the compression curve is
assumed linear with the ultimate compression strength having a higher absolute value than the tension
yield strength. These assumptions agree well with previous experimental data. Therefore, the neutral axis
of the beam shifts toward the compression side of the beam. The beam is assumed to have the same
material properties all through its thickness. The following material properties are used:
stL, = ultimate tensile strength = 16,000 psi
s_y -- yield tensile stress = 8,000 psi
e_o = ultimate tensile strain = 0.012

e_y= yield tensile strain = 0.003
s,:u= ultimate compressivestress= 42,600 psi
e,.u= ultimate compressivestrain = 0.0168
h = height = 1.75 in
f = location in beamthicknessdirectionwherefibers first start to yield
j = neutralaxis location
1. First, the locationof the neutralaxis. j, is found using similar triangles:
f/e,y = (h:i)/e., = j/e,:
Rearrangingthis yields,
f = (ely/e.,)(h-j)
Integratingthe stress-straincurvegives:
TI = Sl, (f/2) = (sty/2)(eiy/e.,)(h-j)
T2 = [(s.,+ %)/21 (h-j-0 = [(sis+ s.,)/21(h-j) (1 - ety/etu)
C = (s,:/2)j = (scu/e,:u)[e.,j/(h-j)] (j/2)
NotingthatTI + T2 - C = 0 by equilibriumandsubstitutingtheappropriatevaluesgivenaboveinto theseequationsgivesthe following:
j2 + 6,712j- 5.873 = 0
SoMng the quadraticequationgivesj = 0.784 in. -
Solving for T I, T2, and C yields:
T1 = 966,47lb/in
10

T2 = 8,697.6 lb/in
C = 9,666.82 Ib/in
2. Now themomentsaresummedabouttheneutralaxis to obtainthetotal bendingmomentact-ing on the beam:
m = -C(j/3) = Tl(j+0.666f) + T2Ij+ f+ (h-j-f)/2]
wherez
f = etv/etdh-j) = 0.25 (1.75-0.787) = 0.242 in
h-j-f = 0.725 in
Substituting the given values into this equation yields m = 10,774.73 lb-in/in
M =mb = 70,574.47 lb-in since b = 6.55 in = width of the beam.
3. Now the four-point bending relation that equates force with the total moment is used to
determine the load at each pad:
M = (P/2)a
where a = the distance from a beam support to the nearest load pad = 12 in
P/2 = M/12 = 5,881.2 lb
The total load is P = 11,762.4 lb predicted to cause failure in the outermost tension fibers.
4. To calculate the deflection, the four-point bending deflection equation is used as an approxi-
mation (this assumes that the beam is elastic at failure):
y,,,,,,, = (Pa/24EI) (3L e-4a 2) = 3.647 in ,
11

where
a = 12 in , L = 42 in , E = 2.6 Msi , I = 2.925 in4
To summarize,the predictedfailure load is II,762,4 lb with a deflectionat failure of 3.647 in.
12
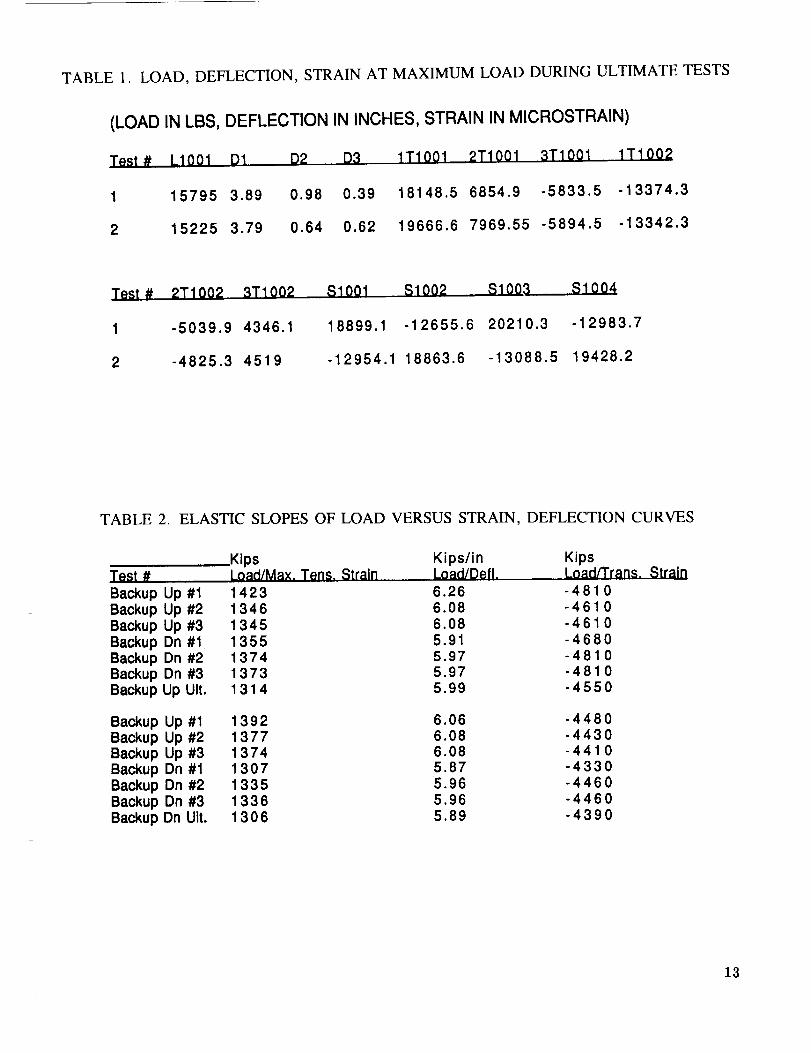
TABLE 1. LOAD, DEFLECTION, STRAIN AT MAXIMUM LOAD DURING ULTIMATE TESTS
(LOAD IN LBS, DEFLECTION IN INCHES, STRAIN IN MICROSTRAIN)
Test# L1001 D1 D2 D3 1T1001 2T1001 3T1001
1 15795 3.89 0.98 0.39 18148.5 6854.9 -5833.5
2 15225 3.79 0.64 0.62 19666.6 7969.55 -5894.5
1T1002
-13374.3
-13342.3
Test# 2T1002 3T1002 $1001 $1002 $1003 $1004
1 -5039.9 4346.1 18899.1 -12655.6 20210.3 -12983.7
2 -4825.3 4519 -12954.1 18863.6 -13088.5 19428.2
TABLE 2. ELASTIC SLOPES OF LOAD VERSUS STRAIN, DEFLECTION CURVES
.Kips Kips/in KipsTest # Load/Max. Tens. Strain Load/Deft. Load/Trans. Strain
Backup Up #1 1423 6.26 -481 0Backup Up #2 1346 6.08 -461 0Backup Up #3 1345 6.08 - 4 61 0Backup Dn #1 1355 5.91 -4680Backup Dn #2 1374 5.97 - 481 0Backup Dn #3 1373 5.97 - 4810Backup Up Ult. 1314 5.99 -4550
Backup Up #1 1392 6.06 -4480Backup Up #2 1377 6.08 -4430Backup Up#3 1374 6.08 -4410Backup Dn #1 1307 5.87 -4330Backup Dn #2 1335 5.96 -4460Backup Dn #3 1336 5.96 -4460Backup Dn UIt. 1306 5.89 -4390
13

TABLE 3. PLASTIC SLOPES OF LOAD VERSUS STRAIN, DEFLECTION CURVES
Kips Kips/in KipsTest # Load/Max.Tens. Strain Load/Deft. Load/Trans. Straiq
Spec.#1 UIt. 462 2.68 -1460(backup up)
Spec.#2 UIt. 506 3.01 - 1 570(backup dn)
TABLE 4. LOAD AND DEFLECTION FINITE ELEMENT MODEL PREDICTIONS
Test
Backup Up
Backup Down
Kips inLoad Deflection
microstralnMax. Lena. Tension Strain
0 0 03 0.514 18306 1 .O28 366O9 1.542 55001 2 2.O56 73301 5 2.570 9160
0 0 03 0.514 19906 1.028 39709 1.542 59601 2 2.O56 795O1 5 2.570 9930
14

7-6.55"
LS1005(S1006)
[.-;]
48.0"
r-- .172-_lsl ool(s1002)
[--]TlOO1(T10021
rTLT.sloo3(s,o04)
$1007(S1008)
EL]
._--- 19" ---_
0 ° pliess_o13(slo14) 17 i
SlO15(slo1,)EZ]-,_- !
35 ° plies
0.25"
r-_ $101 !($1012)
r] $1009_$1010)
NOTE: Label numbers in parantheses represent gauges on opposite surface
Figure 1. MSFC fabricated OBR beam segment configuration.
15

ORIGINAL PAGE
BLACK AND WHITE PHOTOGRAPH
E
JD
,!
OO
_J$..
.M
L[.
16 ORIGINAL PAGE IS
OF POOR QUALITY

Load : 6000 Ib
E0
D I=
.12
m_
2oo0
t.ou. 0
JD
-2OOO
-4OOO
40O00
3OOO0
200OO
lO0OO
'o ' ' o1 20 30 4
x (In)
Figure 3. Boot ring beam shear diagram.
Load = 6000 Ib
5o
_ , . o | J
10 20 30 40 50
x (In)
Figure 4. Boot ring beam bending moment diagram.
Shear
Bending Momenl
17

etu stu
neutral axis
stu = ultimate tensile strength = 16,000 psisty = yield tensile stress = 8,000 psietu = ultimate tensile strain = 0.012
ety = yield tensile strain = 0.003scu = ultimate compressive stress = 42,600 psiecu = ultimate compressive strain = 0.0168h = height = 1.70 inf = location in beam thickness direction where fibers first start
to yieldj = neutral axis location
Figure 5. OBR beam stress-strain profiles through thickness.
I,,i
Figure 6. Finite element representation of boot ring beam.
18

rlV
,,¢O_J
8
7
6
5
4
3
2
1
0-1.5
I I I I I I I I I I I I I-1.3 -1.1 -0.9 -0.7 -0.5 -0.3
DEFLECTION, INCHES
-0.1
Figure 7. Boot ring beam test No. i, backup-up 3/9/89, load versus deflection, specimen No. I.
9
et
O,,.I
8
7
6
5
4
3
2
1
0I I I J I !
0 2 4 6
MICROSTRAIN (Thousands)
Figure 8. Boot ring beam test No. 1, backup-up 3/9/89, load versus maximum tension strain,
specimen No. I.
19
ca0o.v
O.,A
9
8-
7-
6-
5-
4-
3-
2-
1-
0-ol .9
I I I I I I I I I I I I I I I I I-1.7 -1.5 -1.3 -1.1 -0.9 -0.7 -0.5 -0.3
MICROSTRAIN (Thousands)
-0.1
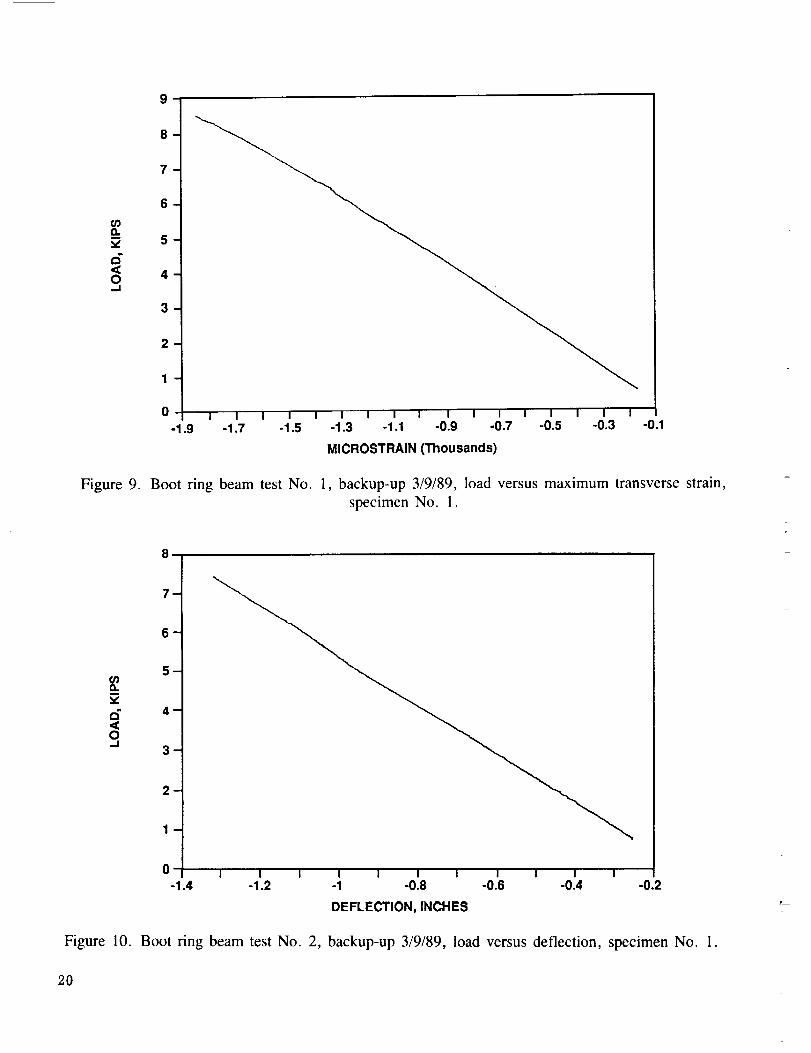
Figure 9. Boot ring beam test No. 1, backup-up 3/9/89, load versus maximum transverse strain,
specimen No. l.
8
I1,
=d
7 m
m
m
4 m
w
w
0-1.4
I I I I I I ! I I I I-1.2 -1 -0.8 -0.6 -0.4
DEFLECTION, INCHES
-0.2
Figure 10. Boot ring beam test No. 2, backup-up 3/9/89, load versus deflection, specimen No. 1.
2O
8
_
_
¢/)ta. 5-
v
< 4-0_1
m
m
0-- I I I I I
0 2 4 6
MICROSTRAIN (Thousands)
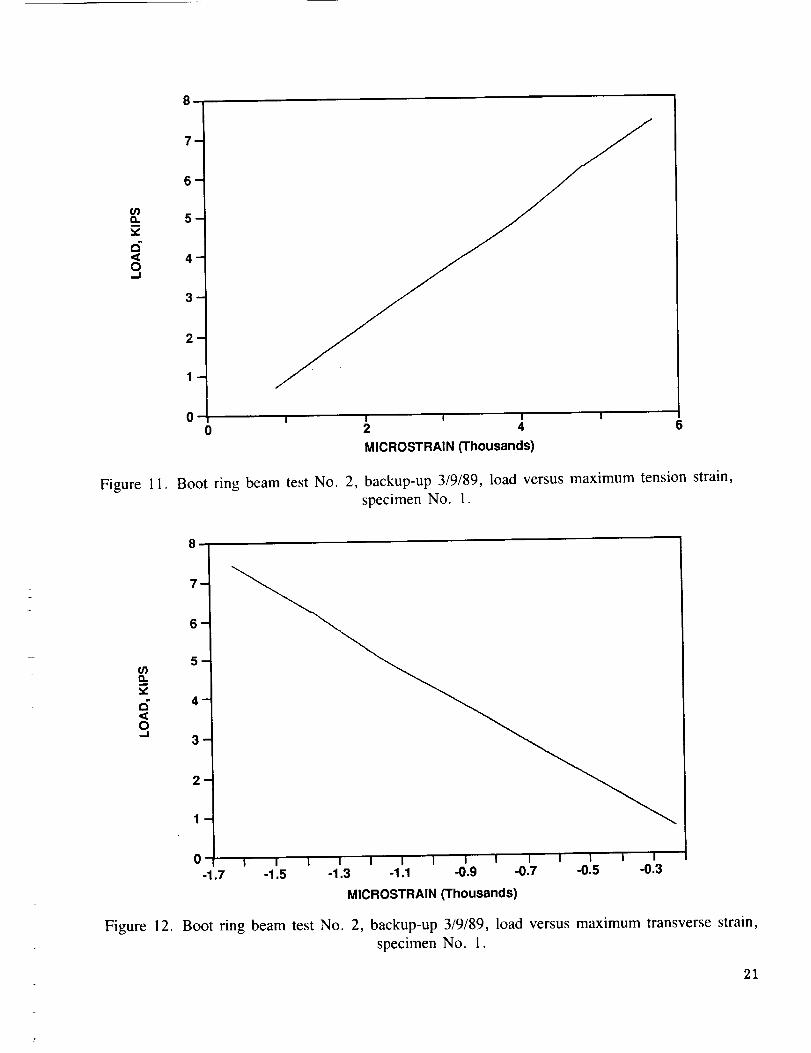
Figure 11. Boot ring beam test No. 2, backup-up 3/9/89, load versus maximum tension strain,
specimen No. 1.
t.nD..
O_J
Figure !2.
_
n
5 m
1
N
_
0"_ I I I I I I I I I I I I I I
-1.7 -1.5 -1.3 -1.1 -0.9 -0.7 -0.5 -0.3
MICROSTRAIN (Thousands)
Boot ring beam test No. 2, backup-up 3/9/89, load versus maximum transverse strain,
specimen No. 1.
21

¢/)e_
6
O.J
_
_
_
4 -
_
_
1 -
_
.o
I I I I I I I I I I•3 -1.1 -0.9 -0.7 -0.5 -0.3
DEFLECTION, INCHES
Figure 13. Boot ring beam test No. 3, backup-up 3/9/89, load versus deflection, specimen No. 1.
22
la.
d
o_J
7-
_
m
4 u
u
m
00.5
I I I I I I I I I I1,5 2.5 3.5 4.5 5.5
MICROSTRAIN (Thousands)
Figure 14. Boot ring beam test No. 3, backup-up 3/9/89, load versus maximum tension strain,
specimen No. 1.

e_w
v
a"
o,,A
m
_
m
4 m
m
w
!
1
_
-1.4 -1.2 -1 -0.8 -0.6 -0.4 -0.2
MICROSTRAIN (Thousands)
Figure 15. Boot ring beam test No. 3, backup-up 3/9/89, load versus maximum transverse strain,
specimen No. 1.
¢/)e_m
a-<O
u
m
_
4 m
_
w
1 u
w
.4I I I _ I I I I I I I I
-1.2 -1 -0.8 -0.6 -0.4 -0.2
DEFLECTION, INCHES
Figure 16. Boot ring beam test No. l, backup-down 3/9/89, load versus deflection, specimen No. l.
23

03D.
<O.J
u
4 m
m
m
_0- I I I i I"-0 2 4 6
MICROSTRAIN (Thousands)
Figure 17. Boot ring beam test No. 1, backup-down 3/9/89, load versus maximum tension strain,
specimen No. 1.
7_
6-
5-¢/)o.
3-
2-
1-
O-- I I I I I I I I I I I I I I
-1.6 -1.4 -1.2 -1 -0.8 -0.6 -0.4 -0.2
MICROSTRAIN (Thousands)
Figure 18. Boot ring beam test No. l, backup-down 3/9/89, load versus maximum transverse strain,
specimen No. 1.
24

lxv
m-
O==1
_
_
_
m
m
m
m
l
-1.4
I I i I I I I I I I I I-1.2 -1 -0.8 _.6 -0.4 -0.2
DEFLECTION, INCHES
Figure 19. Boot ring beam test No. 2, backup-down 3/9/89, load versus deflection, specimen No. 1.
8
_
_
s-a-
..I
m
m
1 m
0-- I I I I I
0 2 4 6
MICROSTRAIN (Thousands)
Figure 20. Boot ring beam test No. 2, backup-down 3/9/89, load versus maximum tension strain,
specimen No. I.
25

¢D
m
m-<O_1
Figure 21.
m
6-
5-
4-
3-
2-
1-
O- i i i _ I _ _ _ _ _ _ _ _ _ j-1.6 ,1.4 -I .2 -1 -0.8 -0.6 -0.4 -0.2 0
MICROSTRAIN (Thousands)
Boot ring beam test No. 2, backup-down 3/9/89, load versus maximum transverse strain,
specimen No. 1.
u)
O,=J
m
u
_
4_
_
m
1 m
_
-1.4I I I I I I I I I I I I
-1.2 -1 -0.8 -0.6 -0.4 -0.2
DEFLECTION, INCHES
Figure 22. Boot ring beam test No. 3, backup-down 3/9/89, load versus deflection, specimen No. 1.
26

Ixm
a-
o_1
1
m
m
!0 ,,,,,d
0I I I ! |
2 4 6
MICROSTRAIN (Thousands)
Figure 23. Boot ring beam test No. 3, backup-down 3/9/89, load versus maximum tension strain,
specimen No. 1.
O,,d
_
_
_
4 m
m
m
R
m
-1.6 0I I I I I I I 1 I I I I I I I
-1.4 -1.2 -1 -0.8 -0.6 -0.4 -0.2
MICROSTRAIN (Thousands)
Figure 24. Boot ring beam test No. 3, backup-down 3/9/89, load versus maximum transverse strain,
specimen No. 1.
27

16
15-
14-
13-
12-
11-10-
lff
O- I I I I I I I I I I I I I I I I I I I I
0 2 4 6 8 10 12 i4 i 6 18 20
MICROSTRAIN (Thousands)
Figure 25. Boot ring beam ultimate test, backup-up 3/9/89, load versus maximum tension strain,specimen No. 1.
16
15
14
13
12
11
10
i- , , , , ,-6 -4 -2 0
MICROSTRAIN (Thousands)
Figure 26. Boot ring beam ultimate test, backup-up 319/89, load versus maximum transverse strain,
specimen No. 1.
_.8

a.
6
o.J
16
15-
14-
13-
12-
11-10-
9-
8-
_
6-
.._
3-2-
1-
O- I I I I I I I-4 -3 -2 -1 0
DEFLECTION, INCHES
Figure 27. Boot ring beam ultimate test, backup-up 3/9/89, load versus deflection, specimen No. 1.
8
n
ta
_
_
_
_
m
_,
-1.4I I I I I I I I I I I I
-1.2 -1 4.8 4.6 4.4 4.2
MICROSTRAIN (Thousands)
Figure 28. Boot ring beam test No. 1, backup-up 5/10/89, load versus deflection, specimen No. 2.
29

r.Ld_ _, ql,% T, _,AI;h, , 1hiReport Documentation Page
1. I-:leporl No.
NASA TP- 3028
4- Tiile and Subdtle
2. Government Accession No.
Loads Analysis and Testing of Flight Configuration Solid
Rocket Motor Outer Boot Ring Segments
3. Recipient's Catalog No.
5. Report Date
June 1990
6. Performing Organization Code
7 Author(s)
Rafiq Ahmed
9. Performing Organization Name and Address
8. Performing Organization Report No.
10. Work Unit No.
M-634
George C. Marshall Space Flight Center
Marshall Space Flight Center, AL 35812
12. Sponso-r_ng Agency Name and Address
National Aeronautics and Space Administration
Washington, D.C. 20546
11, Contract or Grant No.
13. Type of Report and Period Covered
Technical Paper
14. Sponsoring Agency Code
Prepared by Structures and Dynamics Laboratory, Science and Engineering Directorate.
16. Absrrai:l
This report details/he ]()ads testing on in-house-fabricated flight configuration SRM_outer
boot ring segments. The tests determined the bending strength and bending stiffness of these beams
and showed that they compared well with the hand analysis. The bending stiffness test results
compared very well with the finite element data.
17. Key Words (Suggested by Author(s))
Composite Materials, CarbonPhenolic Materials, Outer Boot
Ring, Solid Rocket Motor
..... I26_
19. Security Classif. (0fi'his report)
Unclassified
18. Distribution Statement
Security Classif. (of this page)
Unclassified
Unclassified - Unlimited
Subject Category 39
2t. No. of pages
48,
22. Price
A03
NASA FORM 1626 OCT 86
For sale by the National Technical Information Service, Springfield, VA 22161-2171