Embed Size (px)
Citation preview
NASA/TM- 1999-206569
Flight Test of an Adaptive Configuration
Optimization System for TransportAircraft
Glenn B. Gilyard, Jennifer Georgie,
and Joseph S. BarnickiDryden Flight Research Center
Edwards, California
National Aeronautics and
Space Administration
Dryden Flight Research CenterEdwards, California 93523-0273
January 1999
https://ntrs.nasa.gov/search.jsp?R=19990019435 2020-04-08T13:11:48+00:00Z

NOTICE
Use of trade names or names of manufacturers in this document dot',s not constitute an official endorsement
of such products or manufacturers, either expressed or impli _d, by the National Aeronautics and
Space Administration.
Available from the followin,_:
NASA Center for AeroSpace Information (CASI)712 i Standard Drive
Hanover, MD 21076-1320
(301) 621-0390
National Technical Information Service (NTIS)
5285 Port Royal Road
Springfield, VA 22161-2171
(703) 487-4650
FLIGHT TEST OF AN ADAPTIVE CONFIGURATION OPTIMIZATION
SYSTEM FOR TRANSPORT AIRCRAFT"
Glenn B. Gilyard,* Jennifer Georgie, _ and Joseph S. Barnicki §
NASA Dryden Flight Research CenterP.O. Box 273
Edwards, California 93523-0273
Abstract Nomenclature
A NASA Dryden Flight Research Center program APt
explores the practical application of real-time adaptive CLconfiguration optimization for enhanced transport
performance on an L-1011 aircraft. This approach is C D
based on calculation of incremental drag from forced- CLresponse, symmetric, outboard aileron maneuvers. In @minCD
real-time operation, the symmetric outboard aileron CDhdeflection is directly optimized, and the horizontalstabilator and angle of attack are indirectly optimized. A CDM
flight experiment has been conducted from an onboard CD,,2research engineering test station, and flight research
M
results are presented herein. The optimization system "D O
has demonstrated the capability of determining the GPS
minimum drag configuration of the aircraft in real time.h
The drag-minimization algorithm is capable of
identifying drag to approximately a one-drag-count INS
level. Optimizing the symmetric outboard aileronposition realizes a drag reduction of 2-3 drag counts KI' K2
(approximately 1 percent). Algorithm analysis of Mmaneuvers indicate that two-sided raised-cosine
RBNBmaneuvers improve definition of the symmetric
outboard aileron drag effect, thereby improving analysis RETS
results and consistency. Ramp maneuvers provide at
more even distribution of data collection as a function of
excitation deflection than raised-cosine maneuvers _aoptprovide. A commercial operational system would
require airdata calculations and normal output of currentinertial navigation systems; engine pressure ratio _aoptcmd
measurements would be optional.
8asym
A
(I*Patent pending.*GlennB. Gilyard, Aerospace Engineer, (805) 258-3724.eJennifer Georgie, Student Trainee, Engineering, Texas
A&M University.§Joseph S. Barnicki, Computer Specialist.Copyright © 1998 by the American Institute of Aeronautics and
Astronautics, Inc. No copyright is asserted in the United States underTitle 17, U.S. Code. The U.S. Government has a royalty-free licenseto exercise all rights under the copyright claimed herein for Govern-mental purposes. All other rights are reserved by the copyright owner.
adaptive performance optimization
coefficient of lift
coefficient of drag
C L at minimum CD
coefficient of drag due to altitude
coefficient of drag due to Mach
coefficient of drag due to Mach 2
zero-lift drag coefficient
global positioning system
altitude, ft
inertial navigation system
drag equation coefficients
Mach number
Ring Buffered Network Bus TM
research engineering test station
time, sec
optimal (minimum drag) symmetric
outboard aileron position, deg
commanded optimal symmetric outboard
aileron position, deg
symmetric outboard aileron position, deg
change
root mean square
Introduction
Aircraft efficiency is an important factor for aircraft
manufacturers and airline operators. For manufacturers,
operating costs are an important element in maintaining
and increasing market share of aircraft sales. For
airlines, operating costs relate directly to profit. Fuel
1
American Instituteof Aeronautics and Astronautics
costscanapproach50percentof theoperatingexpensefor sometypesof modern,wide-body,long-rangetransports,tl A l-percentreductionoffuelconsumptioncanproducesavingsofasmuchas$140,000eachyearforeachaircraft.
Inadditiontothesedirectsavings,foraircraftthatareatmaximumtakeoffweight,lessfuelattakeoffallowsadditionalpayload.Revenuefrom1Ibmof payloadisworthasmuchas30timesmorethanthecostof 1Ibmof fuel;thus,benefitsof a l-percentdragreductionforeachaircraftcanbe$4,000,000ormoreeachyear.Foraircraftthat are at maximumfuel but lessthanmaximumtakeoffweight,approximately3 Ibm ofpayloadcanbeaddedfor every1 Ibmof fuelnotrequired.Theadditionalrevenuesfromthisscenarioareasmuchas90timesmorethanthecostof fuel;thus,benefitsof a l-percentdragreductionforeachaircraftcanbe $12,000,000or moreeachyear.Increasedrevenuebenefitscanlikelyexceedthebenefitofreducedfuelcostforthewide-bodyfleetsofsomeairlines.Thereducedfuel consumptionalsoproducesequivalentreductionsin atmosphericgasemissions,whichisbecomingan increasinglyimportantenvironmentalissue.
Significantpotentialexistsfor improvingaircraftefficiencythroughtheuseof variablegeometryand,morespecificallyfortransportaircraft,variablecamber.The F-111 Mission AdaptiveWing programdemonstratedthebenefitsof applyingvariable-cambergeometryto optimizevariousflight conditionsforfighterconfigurations,includingcruiseperformance.2Designworkisongoingforimplementationofvariablecamberintofuturetransportaircraft.3
All currenttransportaircrafthavelatentpotentialforvaryingdegreesofvariable-cambercontrol.Forfly-by-wireaircraft,thepotentialcanbe realizedrelativelyeasilywithsoftwaremodifications;whereasforaircraftwithmechanicalcontrols,modificationsin theflightcontrolsystemhardwarearealsorequired.Themostobviouscontrolsurfacesthatcanbeusedtoimplementvariablecamberontransportaircraftincludeoutboardandinboardailerons,flaps,thehorizontalstabilizer,andtheelevator.
TheNASADrydenFlightResearchCenter(Edwards,California)is involvedin an adaptiveperformanceoptimization(APO) researchprogramto developconceptsandvalidatetechnologiesfordragreductionon
transportai'craft.TheAPOprogramapproachis toadaptivelyoptimizeavailable,redundant,variablegeometryt_ minimizethenetaircraftdrag.Forthecurrentresearchprogram,symmetricoutboardailerondeflections;_reusedinavariable-camber-typemodetooptimallyrtcamberthewingto minimizedragfor allaircraftconfigurationsandflightconditions.Realizingsmall perf_rmancebenefits(0.5-2.0percent)ischallengingTheproposeddrag-minimizationalgorithmuses measurement-basedoptimal control forperformanccimprovementusingvariablegeometryofthewing.
Themodificationsrequiredto supportthe APOprogramincludedtheadditionof anactuatoroneachwing.Theseactuatorsdrivethe outboardaileronssymmetricallyto providesome variable-cambercapability.
A reviewofrelatedvariable-camberandoptimizationtechnologyissuesandsimulationevaluationsof theproposedoptimizationalgorithmhaspreviouslybeenpresented.4Detailsof themodificationstotheL-1011testbedarcraftanda proposedapproachfor anoperationalimplementationoftheoptimizationsystemhavealsobeenpublished.5
Thispap_:rsummarizestheresultsof threeresearchflights.Twoflights(baseline)collecteddatafromforced-responsemaneuversforpostflightanalysisanddevelopmertof a real-timeadaptiveconfigurationoptimizatiolalgorithm.The third flight (real-time)demonstrattd thefirst-everoperationof an in-flightadaptivecanfigurationoptimizationalgorithmforperformance,"improvement.Backgroundmaterialandabriefovervewof theresearchflightsystemsarealsogiven.Thediscussionincludesdataanalysisissuesregardingthe low signal-to-noiseratio of smallincrementaldragestimates.Variousmaneuversandvariationsill parametersdefiningthemaneuversarealsodiscussed,i_,epresentativemaneuversandoptimizationresultsareI resented.
Useoftr:_denamesornamesofmanufacturersin thisdocumentdoesnotconstituteanofficialendorsementofsuchprodvctsor manufacturers,eitherexpressedorimplied,b¢ the NationalAeronauticsand SpaceAdministraion.
Background: Transport
Performance Optimization
IThis cost does not include fleet ownershipand overheadexpenses,which together are nearly equal to the operating expenses.
Current ;ubsonic transport design for cruise flight
results in a point-design aerodynamic configuration. By
2American Institute of Aeronautics and Asu onautics
necessity, the final configuration is a major compromise
among a multitude of design considerations.
Additionally, the final design provides near-optimal
performance for specifically defined flight profiles andresults in the aircraft flying at its best performance
design condition very seldom or only by chance. In the
cruise configuration, no additional configuration
changes are available to optimize performance for the
vast range of constraints. Such operational and externalconstraints include air-traffic-control directives (speed
and altitude), loading (cargo and fuel), center of gravity,
flight length, variations in manufacturing, aging, and
asymmetries.
No aircraft currently has an adaptive configuration
optimization system. However, manual configuration
optimization is attempted on all transport aircraft during
takeoff, approach, and landing situations when flaps areused to improve, or "optimize," low-speed lift
requirements. Adaptive configuration optimization is thenatural extension for drag reduction at cruise flight of
what is currently done manually to improve lift
characteristics during low-speed flight.
Aircraft currently use the flight management system
as the main tool to obtain some degree of in-flight
performance "optimization." The term "optimization" is
used widely and loosely, and, in a discussion of this
nature, consistency and the ability to distinguish the
different types of optimization are important. The
above-mentioned flight management system
"optimization" is more accurately referred to as"trajectory optimization" (generally optimizing altitude
at a fixed Mach number) and is based on models of
predicted and flight characteristics for one specificaircraft generated early in the flight test program.
The differences among models and the actual aircraftshould be small, but because of inaccuracies in
aerodynamic and engine models and actual aircraft
changes over time, differences between the flightmanagement system model and the actual aircraft could
be significant. If the actual performance-related
characteristics of a specific aircraft can be determined in
flight, that information can be used to obtain actual, true
trajectory optimization, which is better than benefits
available with a preprogrammed flight management
system. These trajectory optimization benefits are
separate from configuration optimization benefits
(although not independent); however, the two
optimization processes are complementary.
Many issues enter into the subject of configuration
optimization for performance enhancement of subsonic
transport aircraft. Foremost, the potential for
optimization must exist, which implies redundant
control effector capability (for instance, more than onemeans of trimming the forces and moments to obtain a
steady-state flight condition). Most aircraft have latent
capability in this area, although taking advantage of this
capability from hardware and software aspects can be
complex. The range of controls or variables includeelevator, horizontal stabilizer, outboard aileron, inboard
aileron, rudder, center of gravity, and thrust modulation;the benefits have previously been discussed. 4
In addition, performing optimization from a condition
that is already fine-tuned (based on wind-tunnel and
flight testing) requires high-quality instrumentation and
comprehensive analytical techniques to enableestimation of small drag changes in an unsteadyenvironment. Instrumentation available on modern
transports should be adequate for performing adaptive
optimization.
Test Bed Aircraft Description
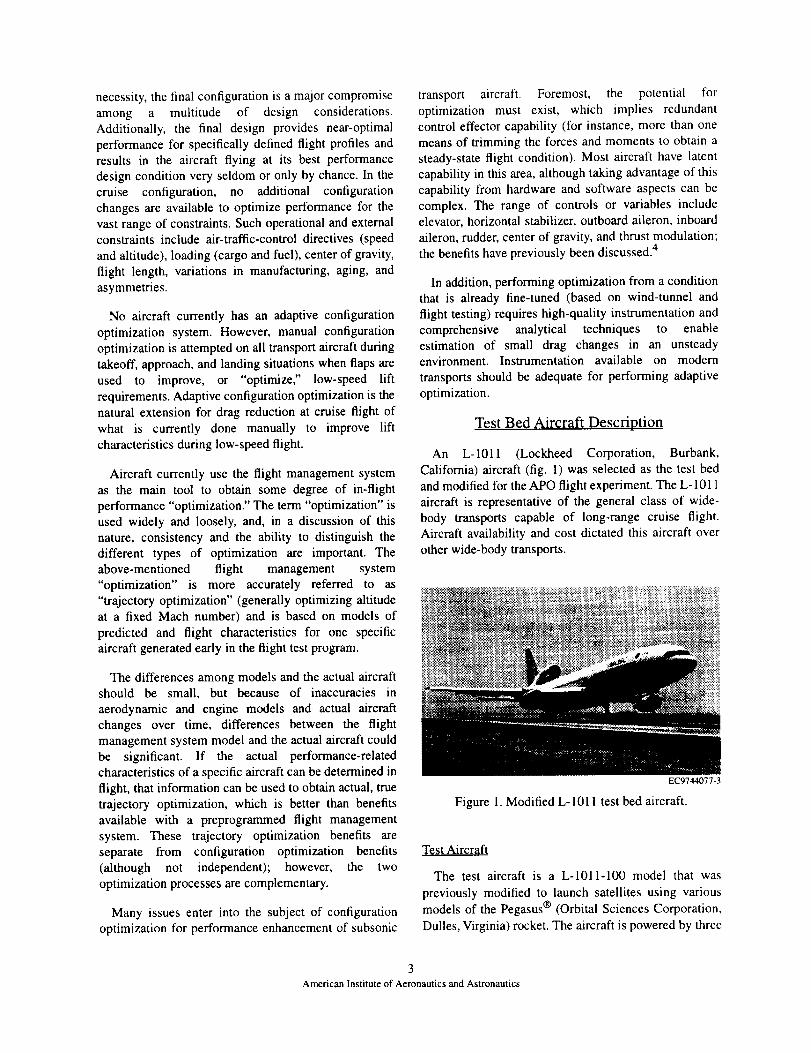
An L-1011 (Lockheed Corporation, Burbank,
California) aircraft (fig. 1) was selected as the test bed
and modified for the APO flight experiment. The L- 1011
aircraft is representative of the general class of wide-
body transports capable of long-range cruise flight.
Aircraft availability and cost dictated this aircraft over
other wide-body transports.
EC9744077-3
Figure 1. Modified L-1011 test bed aircraft.
Test Aircraft
The test aircraft is a L-1011-100 model that was
previously modified to launch satellites using various
models of the Pegasus ® (Orbital Sciences Corporation,
Dulles, Virginia) rocket. The aircraft is powered by three
3American Institute of Aeronautics and Astronautics
RB-211-22B (Rolls Royce, Inc., Derby, England) high-
bypass turbofan engines. The empty weight and
maximum gross takeoff weight of the modified aircraft
(without the Pegasus ®) are 220,000 and 474,000 Ibm,
respectively. The aircraft has a cruise range of
approximately 4000 mi at Mach 0.84 and a maximum
operating Mach of 0.90. The research flights were
supported and flown by Orbital Sciences Corporationunder contract to NASA.
Test Bed Modifications
Aircraft modifications necessary to support the APO
experiment consisted of the following:
• the addition of a research engineering test station
(RETS).
• the addition of an actuator, one on each wing, to
drive the outboard ailerons symmetrically.
• the addition of a trailing-cone system to obtain true
static pressure.
• a connection into the basic data system of the ship
to obtain engine, control surface, and othermeasurements.
• the addition of an embedded global positioning
system/inertial navigation system (GPS/INS).
• the addition of a state-of-the-art airdata computer.
Although the INS was embedded with a GPS, the
additional GPS-related parameters are not a requirement
for APO. Only the RETS and aileron actuation systems
will be discussed; details on other modifications have
previously been presented. 5
Research Engineering Test Station
The RETS was designed to be a very flexible research
tool and has many capabilities, including the following:
• generation of forced-excitation signals to drive theoutboard ailerons.
• position control for the outboard aileron actuators.
• data calibration, collection, and storage.
• data and analysis displays.
• real-time analysis.
• display of variables and calculated parameters.
• automatic feedback control and optimization of theoutboard ailerons.
• monitoring system health.
• commu aications with the pilot station.
The forced- ;xcitation set consists of steps, ramps, sinewaves, and laised-cosine waves.
Symmetric Outboard Aileron Actuation
The L-1011-100 aileron control system is fully
mechanical; the outboard aileron is commanded from
the inboard aileron using pushrods and cables. The
approach taken to provide symmetric control to the
outboard ailerons was to modify the rod coming out ofthe inboard aileron that drives the outboard aileron. The
modification consisted of replacing the rod with a low-
bandwidth, constant-speed, electric actuator with end
fittings ideatical to the rod being replaced. This
modification provides for an adjustable rod length, thus
permitting independent commands to be summed foreach outboard aileron. The control of the actuator
position requires position feedback control and isperformed by software.
The output position of the modified rod is thus the
sum of inboard aileron position (of which the pilot has
full command) plus the RETS command sent to the
modified actuator rod. In the research application, the
option of h_tving the outboard aileron follow a desiredexcitation command and not contain or be
"contaminated" by the inboard aileron command is
available. T,'fis availability is achieved by measuring the
inboard aileron position and subtracting this signal from
the desired excitation signal. This signal, when summedwith the inboard aileron position, is equal to the desiredexcitation o _mmand.
Re_tl-Time Flight Test Operations
Forced e_citation is required to identify incremental
drag effects The requirement for forced excitation mustbe consistent with the additional requirement that
neither hal dling nor ride qualities are noticeably
impacted, x_hich in turn dictates the range of excitation
frequencies and amplitudes.
The AP(I flight experiment only considered the
explicit control of the outboard ailerons; the stabilatorand angle-c,f-attack changes are implicitly controlled
through the: altitude-hold autopiiot. When the pilot
applies pow _r to the APO system, the test conductor has
control ove_ the actual surface position of the outboard
ailerons, q-he experimental APO system has the
following lest setup and actuator feedback controlcapabilities:
4American Instituteof Aeronautics and Astr )nautics
• A bias can be added to either or both outboard
ailerons to control them symmetrically,
independent of either pilot or autopilot inputs. Inthe case where either pilot or autopilot inputs are
required for roll axis control, the deflections of theinboard ailerons will be increased as required toaccount for the "loss" of outboard aileron control in
the roll axis.
• Step, ramp, sine, or raised-cosine excitationcommands are available. The magnitude,
frequency, and maneuver duration is selectable as
required.
• The maximum commandable actuator position andrate limit sent to the outboard aileron is selectable
and controlled by software.
• The relay hysteresis characteristics that control thedrive commands sent to the actuator for position
feedback control of the actuator are selectable by
software. Hardware-in-the-loop tuning of the
actuator feedback control loop was required to
minimize actuator activity.
Flight Experiment Operation
The test conductor selects the test setup options
described in the previous section. The desired flight
condition is stabilized by the pilot and autopilot.
Altitude is controlled by the altitude-hold mode of the
autopilot. Ideally, an autothrottle mode would be used tocontrol Mach number, but because the test bed aircraft
does not have that mode, Mach number can be allowed
to vary or can be controlled by the pilot. Any Mach-
number variations are compensated for in the analysis.
When the test conductor determines flight conditions
have stabilized, the excitation function is commanded.
The outboard aileron movement causes small drag
changes. These drag changes are desired to be on bothsides of the minimum to ensure identification of the
minimum drag condition (to be discussed in the next
section).
For the baseline flights, data were collected onboard
and analyzed postffight. For the real-time flights, data
were collected throughout the maneuver and the drag-
minimization analysis was performed in parallel. When
the minimum-drag geometry is identified, the outboard
ailerons are then commanded to that optimal position.
The most obvious way to take advantage of the drag
reduction is to continue flying at the same desired flightconditions but at reduced fuel flows. An alternate use of
the reduced drag is to increase the cruise speed at the
same fuel flow setting. Other variations on how the
benefits of reduced drag can be utilized also exist.
Drag-Minimization Algorithm
To provide an effective optimization algorithm,estimation of incremental drag changes of 1 percent or
less are required. Although absolute drag measurementsof this accuracy are only obtainable with very detailed
analysis and precise engine modeling, incremental drag
values in this range are readily achievable.
The postflight and real-time optimization algorithm isbased on identification of unknown drag equation
coefficients from a smooth, low-frequency forced-
response maneuver. The analysis assumes steady-stateflight; therefore, the forced-excitation maneuver must be
sufficiently slow so that quasi-equilibrium is alwaysmaintained and no significant dynamic effects exist.
The analysis requires accurate linear and angular
displacement, velocity, and acceleration measurements
(such as from an INS) and accurate airdata information.
Angle-of-attack estimations are calculated from inertial
measurements and airdata. Thrust is estimated from a
representative steady-state engine model as a function of
engine pressure ratio, Mach number, and altitude. The
lift and drag equations are then used to calculate the
coefficient of lift, CL , and the coefficient of drag, CD ,as a function of time. 5
The following equation is an expansion of C D 5 that is
a function of available parameters (C D, C L, 8asv, n,AM, AM 2, and Ah ) and unknown drag coefficients
(CDo, K I, CL@minC D, K 2 , _aop t' CD M' CDM2,
and CDh ) that includes a quadratic representation of
drag due to symmetric outboard aileron deflection.
= + KI[C L- C L@minCD ]2CD CD o
2
+ K2(_asy m - _aopt ) + CDM AM
+ CDM2 AM 2 + COb Ah
(1)
This equation results in a set of equations (equal in size
to the number of data samples collected) that are then
solved using regression analysis.
The C D formulation is not unique; the importantelement is that the first-order effects of aileron-induced
5American Instituteof Aeronautics and Astronautics
dragberepresentedin theC D equation in a plausiblemanner. Care should be taken not to over-parameterize
the problem; independence of the various estimates
must be maintained to provide meaningful results.
Simulation results 4 confirm that the analysis
procedure is insensitive to a wide range of algorithm
variables such as a priori estimates of aircraft C L as a
function of C D, measurement bias and resolutioneffects, and thrust model accuracy.
Flight Results
Four flights have been conducted to date: one flight to
check out the research systems functionality, two
research flights to collect baseline data for postflight
analysis and algorithm development, and one research
flight for demonstration of a real-time adaptive
configuration optimization algorithm. The functional
flight demonstrated and verified proper operation of all
the experiment-related command and control functions
and the instrumentation system. The two baseline flights
encountered significant turbulence; few data were
collected in smooth atmospheric conditions. The real-
time research flight primarily experienced smooth
atmospheric conditions and had only very infrequent
low levels of turbulence. The three research flights each
lasted approximately 8 hr.
Baseline Postflight Analysis
The two baseline research flights consisted of
collecting aircraft response data to forced-excitation
maneuvers. The objectives of the postflight analysiswere to refine the analysis algorithm; 5 evaluate the
parameters of the excitation maneuver (for example,
amplitude and frequency); evaluate various maneuver
types; and demonstrate algorithm results.
The identification process, which determines the
unknowns in the expanded C D equation such as theoptimal symmetric aileron setting, consists of a set of
static equations. Because any arbitrary control surface
motion will introduce dynamics, the maneuver should
be very slow so as to minimize dynamic response. The
slow maneuver is also intended to minimize any
coupling between the maneuver excitation and thecontrol surface commands of altitude- and Mach-hold
autopilot modes used to constrain deviations in altitudeand Mach number.
The aircraft response characteristics during the
maneuver should be nearly indistinguishable from
normal cruise flight. A raised-cosine maneuver satisfies
the requirem-_nts stated above and appears to be an idealmaneuver be :ause of the smooth characteristics of it and
its derivative s. Simulation studies indicated that a periodof a minilaum 300 sec would meet the above
requirement.
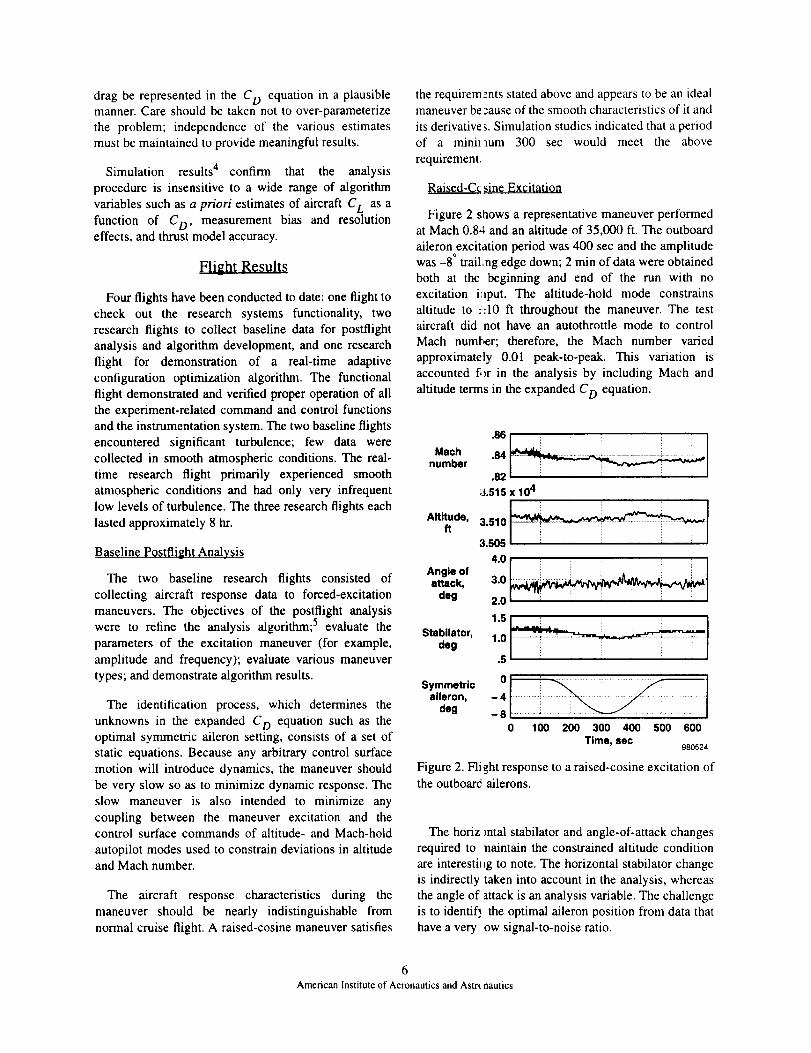
Raised-Ccsine Excitation
Figure 2 shows a representative maneuver performedat Mach 0.84 and an altitude of 35,000 ft. The outboard
aileron excitation period was 400 sec and the amplitudewas -8 ° traihng edge down; 2 min of data were obtained
both at the beginning and end of the run with no
excitation i_lput. The altitude-hold mode constrains
altitude to ._:10 ft throughout the maneuver. The testaircraft did not have an autothrottle mode to control
Mach number; therefore, the Mach number varied
approximately 0.01 peak-to-peak. This variation is
accounted fi_r in the analysis by including Mach and
altitude terms in the expanded C D equation.
Math _ i i.54 _-_....... ....... _.........._...........
number82
3.515 x 10⁴
Altitude, 3.510 _1ft 3.505 1 i
4.0 i
Angle ofattack, 3.0 ......................................................... ...........!.......................
deg 2 0
1.5 _ i
Stabilator,deg.5
Symmetric i Iaileron, - ........•deg _ .................................................
0 100 200 300 400 500 600Time, sec
980524
Figure 2. Flight response to a raised-cosine excitation ofthe outboard ailerons.
The horiz total stabilator and angle-of-attack changesrequired to nalntain the constrained altitude condition
are interesti_Lg to note. The horizontal stabilator change
is indirectly taken into account in the analysis, whereas
the angle of attack is an analysis variable. The challenge
is to identi_ the optimal aileron position from data that
have a very ow signal-to-noise ratio.
6American Institute of Aeronautics and Astrt nautics
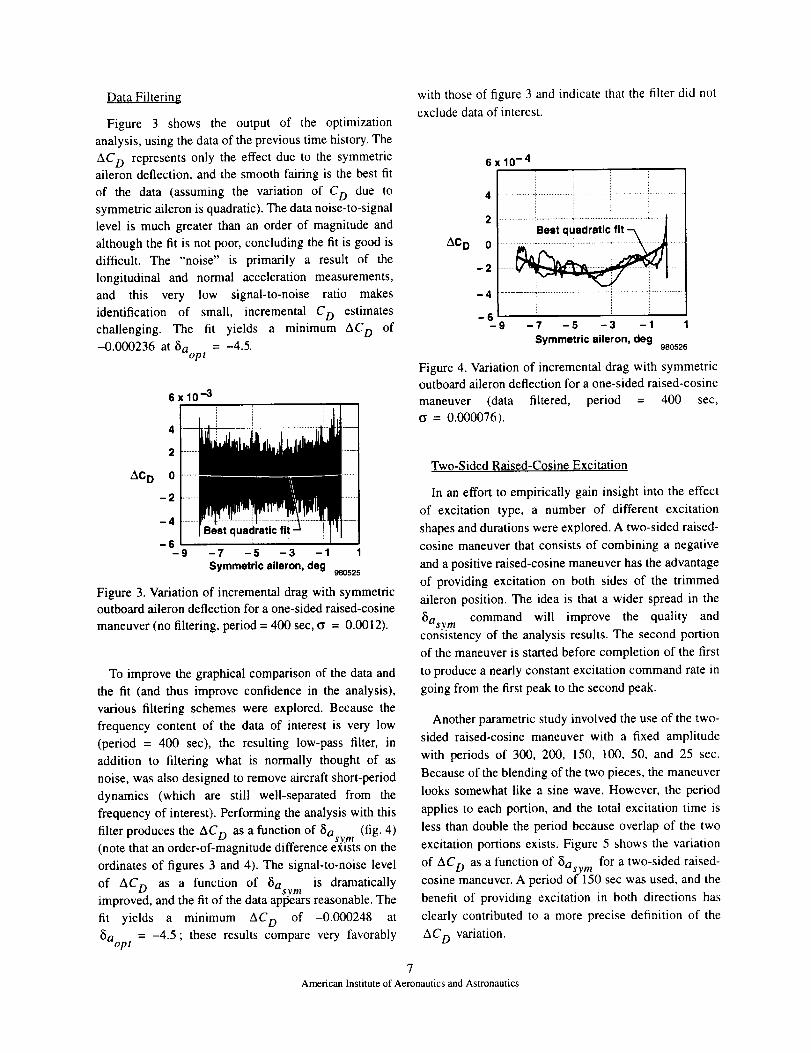
Data Filtering
Figure 3 shows the output of the optimization
analysis, using the data of the previous time history. The
AC D represents only the effect due to the symmetricaileron deflection, and the smooth fairing is the best fit
of the data (assuming the variation of C D due to
symmetric aileron is quadratic). The data noise-to-signal
level is much greater than an order of magnitude and
although the fit is not poor, concluding the fit is good is
difficult. The "noise" is primarily a result of the
longitudinal and normal acceleration measurements,
and this very low signal-to-noise ratio makes
identification of small, incremental C D estimates
challenging. The fit yields a minimum AC D of
-0.000236 at 8aopt = -4.5.
6xi0 -3
4
2
ACD 0
-2
-4
-6-9
Best q_
-7 -5 -3 -1 1
Symmetric aileron, deg 9ao525
Figure 3. Variation of incremental drag with symmetricoutboard aileron deflection for a one-sided raised-cosine
maneuver (no filtering, period = 400 sec, o = 0.0012).
To improve the graphical comparison of the data and
the fit (and thus improve confidence in the analysis),
various filtering schemes were explored. Because the
frequency content of the data of interest is very low
(period = 400 sec), the resulting low-pass filter, in
addition to filtering what is normally thought of as
noise, was also designed to remove aircraft short-period
dynamics (which are still well-separated from the
frequency of interest). Performing the analysis with this
filter produces the AC D as a function of _Sa (fig. 4)sym(note that an order-of-magnitude difference exists on the
ordinates of figures 3 and 4). The signal-to-noise level
of AC D as a function of 15a is dramaticallySV//!
improved, and the fit of the data aplrears reasonable. The
fit yields a minimum AC D of -0.000248 at
_aopt = -4.5; these results compare very favorably
with those of figure 3 and indicate that the filter did not
exclude data of interest.
6x10 -4
4
=...................... j.......
-9 -7 -5 -3 -1Symmetric aileron, deg
980526
Figure 4. Variation of incremental drag with symmetricoutboard aileron deflection for a one-sided raised-cosine
maneuver (data filtered, period = 400 sec,
o = 0.000076).
Two-Sided Raised-Cosine Excitation
In an effort to empirically gain insight into the effect
of excitation type, a number of different excitation
shapes and durations were explored. A two-sided raised-
cosine maneuver that consists of combining a negative
and a positive raised-cosine maneuver has the advantage
of providing excitation on both sides of the trimmed
aileron position. The idea is that a wider spread in the
_)asvm command will improve the quality andconsistency of the analysis results. The second portion
of the maneuver is started before completion of the first
to produce a nearly constant excitation command rate in
going from the first peak to the second peak.
Another parametric study involved the use of the two-
sided raised-cosine maneuver with a fixed amplitude
with periods of 300, 200, 150, 100, 50, and 25 sec.
Because of the blending of the two pieces, the maneuver
looks somewhat like a sine wave. However, the period
applies to each portion, and the total excitation time is
less than double the period because overlap of the two
excitation portions exists. Figure 5 shows the variation
of AC D as a function of _)asvm for a two-sided raised-cosine maneuver. A period of 150 sec was used, and the
benefit of providing excitation in both directions has
clearly contributed to a more precise definition of the
AC D variation.
American Institute of Aeronautics and Astronautics
15x10 -4
10 ......BI i__'-/li __._i,...._! i ..............AcD ......................................_....................................................
5 quadrati__i t ....................
-5-10 -6 -2 2 6 10
Symmetricaileron, deg 980527
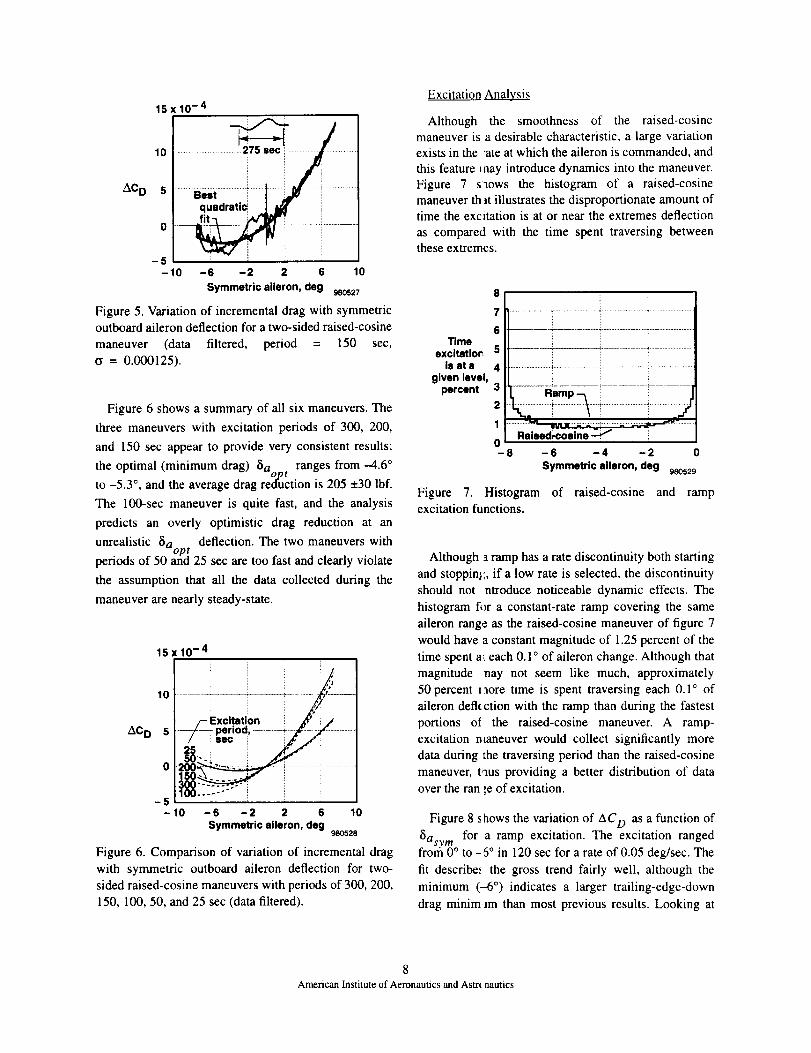
Figure 5. Variation of incremental drag with symmetricoutboard aileron deflection for a two-sided raised-cosine
maneuver (data filtered, period = 150 sec,
(_ = 0.000125).
Figure 6 shows a summary of all six maneuvers. The
three maneuvers with excitation periods of 300, 200,
and 150 sec appear to provide very consistent results;
the optimal (minimum drag) _ao t ranges from -4.6 °to -5.3 °, and the average drag re_lPuction is 205 ±30 lbf.
The 100-see maneuver is quite fast, and the analysis
predicts an overly optimistic drag reduction at an
unrealistic _)aopt deflection. The two maneuvers withperiods of 50 and 25 sec are too fast and clearly violate
the assumption that all the data collected during the
maneuver are nearly steady-state.
15x10 -4
/-- ExcitationACD 5 ----/L--t period,............_--F--_,"r---
l i sec _, IF.,/25_--i _ i
0 200_ ...............................
-5-I0 -6 -2 2 6 10
Symmetricaileron, deg980528
Figure 6. Comparison of variation of incremental drag
with symmetric outboard aileron deflection for two-
sided raised-cosine maneuvers with periods of 3t30, 200,
150, 100, 50, and 25 sec (data filtered).
Excitation Anal s.¥._
Although the smoothness of the raised-cosinemaneuver is a desirable characteristic, a large variationexists in the "ate at which the aileron is commanded, and
this feature may introduce dynamics into the maneuver.
Figure 7 saows the histogram of a raised-cosine
maneuver th at illustrates the disproportionate amount oftime the excitation is at or near the extremes deflection
as compared with the time spent traversing betweenthese extremes.
8
7 ...................... _ .......................... • ........................... • ..................
Timeexcitatlo_ 5 ....... i.............................
is at a 4 ..........................i.................................................................................given level,
percent 3 _--_amp _ ............. i......... J
2 11 .....Raised,cosine i ...........................:!.........0-8 -6 -4 -2 0
Symmetric aileron, deg 980529
Figure 7. Histogram of raised-cosine and rampexcitation functions.
Although a ramp has a rate discontinuity both starting
and stoppin;,,, if a low rate is selected, the discontinuity
should not ntroduce noticeable dynamic effects. The
histogram fi)r a constant-rate ramp covering the same
aileron range as the raised-cosine maneuver of figure 7
would have a constant magnitude of 1.25 percent of the
time spent a: each 0.1 ° of aileron change. Although that
magnitude nay not seem like much, approximately
50 percent t aore time is spent traversing each 0.1 ° of
aileron deft(ction with the ramp than during the fastest
portions ot the raised-cosine maneuver. A ramp-
excitation ntaneuver would collect significantly more
data during the traversing period than the raised-cosine
maneuver, taus providing a better distribution of data
over the ran ;e of excitation.
Figure 8 shows the variation of AC D as a function of
8asy m for a ramp excitation. The excitation rangedfrom 0° to -5° in 120 sec for a rate of 0.05 deg/sec. The
fit describe., the gross trend fairly well, although the
minimum (--6 °) indicates a larger trailing-edge-down
drag minim Jm than most previous results. Looking at
8American Institute of Aeronautics and Astn nautics
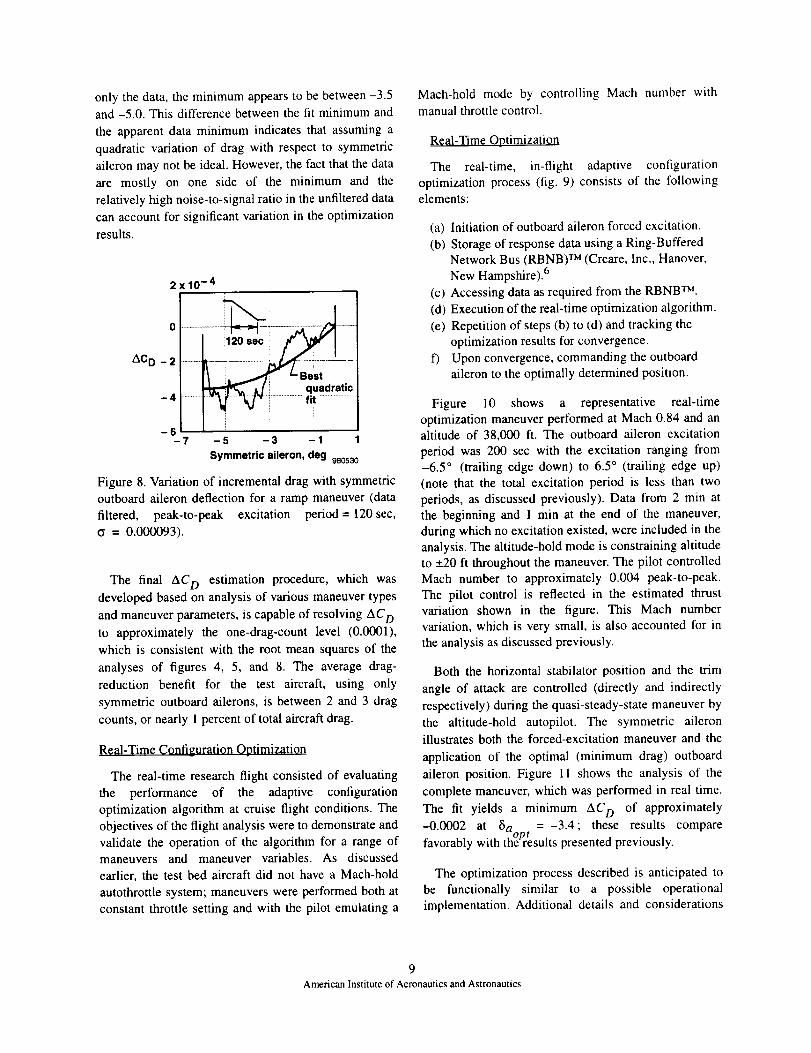
onlythedata,theminimumappearstobebetween-3.5and-5.0.Thisdifferencebetweenthefit minimumandtheapparentdataminimumindicatesthatassumingaquadraticvariationof dragwithrespectto symmetricaileronmaynotbeideal.However,thefactthatthedataaremostlyon onesideof theminimumandtherelativelyhighnoise-to-signalratiointheunfiltereddatacanaccountforsignificantvariationintheoptimizationresults.
2x10 -4
ACD-2 .... r_ i _.,,_ L_Rest -
-4 "........... ,-6 i
-7 -5 -3 -1
Symmetric aileron, deg 9eo53o
Figure 8. Variation of incremental drag with symmetric
outboard aileron deflection for a ramp maneuver (data
filtered, peak-to-peak excitation period = 120 sec,
o = 0.000093).
The final AC D estimation procedure, which was
developed based on analysis of various maneuver types
and maneuver parameters, is capable of resolving AC D
to approximately the one-drag-count level (0.0001),
which is consistent with the root mean squares of the
analyses of figures 4, 5, and 8. The average drag-
reduction benefit for the test aircraft, using only
symmetric outboard ailerons, is between 2 and 3 drag
counts, or nearly 1 percent of total aircraft drag.
Real-Time Configuration Optimization
The real-time research flight consisted of evaluating
the performance of the adaptive configuration
optimization algorithm at cruise flight conditions. The
objectives of the flight analysis were to demonstrate and
validate the operation of the algorithm for a range ofmaneuvers and maneuver variables. As discussed
earlier, the test bed aircraft did not have a Mach-hold
autothrottle system; maneuvers were performed both at
constant throttle setting and with the pilot emulating a
Mach-hold mode by controlling Mach number with
manual throttle control.
Real-Time Optimization
The real-time, in-flight adaptive configuration
optimization process (fig. 9) consists of the followingelements:
(a) Initiation of outboard aileron forced excitation.
(b) Storage of response data using a Ring-BufferedNetwork Bus (RBNB) TM (Creare, Inc., Hanover,
New Hampshire). 6
(c) Accessing data as required from the RBNB TM.
(d) Execution of the real-time optimization algorithm.
(e) Repetition of steps (b) to (d) and tracking the
optimization results for convergence.
f) Upon convergence, commanding the outboardaileron to the optimally determined position.
Figure 10 shows a representative real-time
optimization maneuver performed at Mach 0.84 and analtitude of 38,000 ft. The outboard aileron excitation
period was 200 sec with the excitation ranging from
-6.5 ° (trailing edge down) to 6.5 ° (trailing edge up)(note that the total excitation period is less than two
periods, as discussed previously). Data from 2 min at
the beginning and 1 min at the end of the maneuver,
during which no excitation existed, were included in the
analysis. The altitude-hold mode is constraining altitudeto +_20 ft throughout the maneuver. The pilot controlled
Mach number to approximately 0.004 peak-to-peak.
The pilot control is reflected in the estimated thrustvariation shown in the figure. This Mach number
variation, which is very small, is also accounted for in
the analysis as discussed previously.
Both the horizontal stabilator position and the trim
angle of attack are controlled (directly and indirectly
respectively) during the quasi-steady-state maneuver by
the altitude-hold autopilot. The symmetric aileron
illustrates both the forced-excitation maneuver and the
application of the optimal (minimum drag) outboard
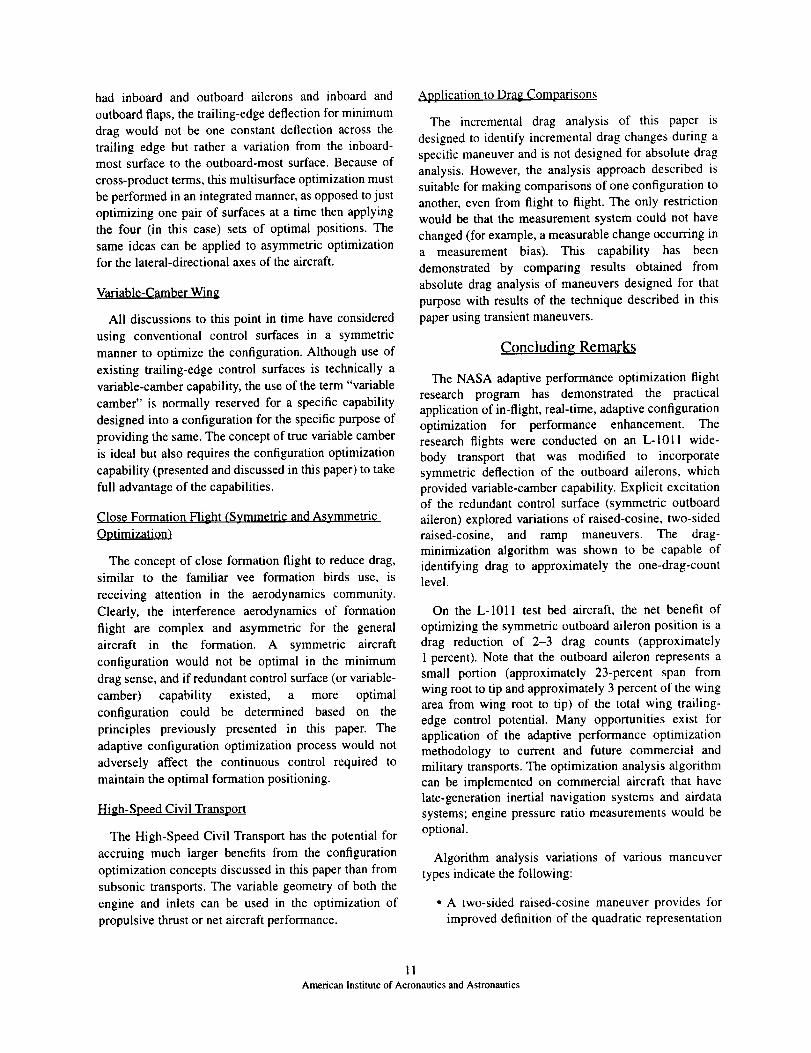
aileron position. Figure 11 shows the analysis of the
complete maneuver, which was performed in real time.
The fit yields a minimum AC D of approximately
-0.0002 at 5a t = -3.4; these results comparefavorably with th_Presults presented previously.
The optimization process described is anticipated to
be functionally similar to a possible operational
implementation. Additional details and considerations
9American Instituteof Aeronautics and Astronautics
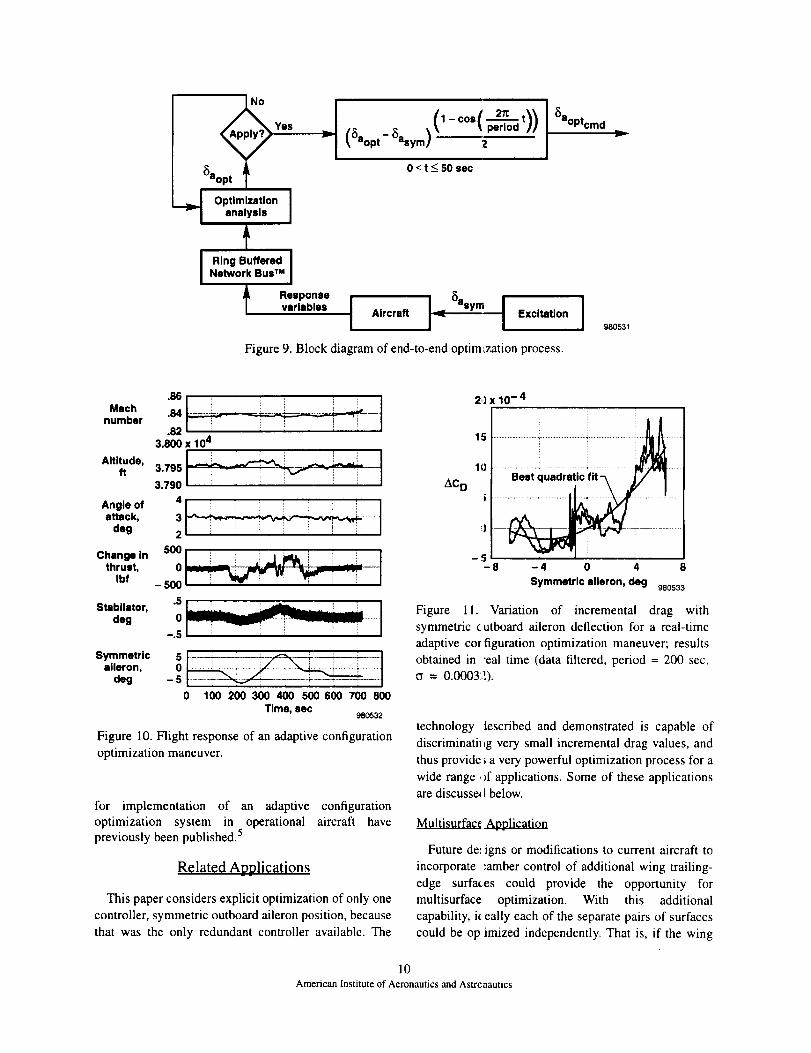
No
8aopt
___ OptlmlzsUonanalysis ]
(,-cosf period //> (6aopt- (_asym) 2
0 < t _<50 sac
(SaOptcmd
I Ring Buffered ]Network Bus TM
Responsevariables I "'rcr' IEx°"t'°nI .831Figure 9. Block diagram of end-to-end optim ization process.
Machnumber
Altitude,ft
Angle ofattack,
deg
Change Inthrust,
Ibf
Stabilator,deg
3.800 x 10⁴
3.795 _3.790
500
0
- 500
.5
oi
Symmetric 5aileron, 0
deg - 5
0 100 200 300 400 500 600 700 800
Tlma, sac980532
Figure 10. Flight response of an adaptive configuration
optimization maneuver.
for implementation of an adaptive configuration
optimization system in operational aircraft have
previously been published. 5
Related Applications
This paper considers explicit optimization of only one
controller, symmetric outboard aileron position, because
that was the only redundant controller available. The
20x10 -4
10 ..................
z_CDi
-5-8 -4 0 4 8
Symmetric slleron, deg 980533
Figure 11. Variation of incremental drag with
symmetric cutboard aileron deflection for a real-time
adaptive cot figuration optimization maneuver; results
obtained in "eal time (data filtered, period = 200 sec,
= 0.00032).
technology iescribed and demonstrated is capable of
discriminatilkg very small incremental drag values, and
thus provide ; a very powerful optimization process for a
wide range ,)f applications. Some of these applications
are discusse_[ below.
Multisurfac_ Application
Future de: igns or modifications to current aircraft to
incorporate :amber control of additional wing trailing-
edge surfaces could provide the opportunity for
multisurface optimization. With this additional
capability, i( eally each of the separate pairs of surfaces
could be op imized independently. That is, if the wing
10
American Institute of Aeronautics and Astrcnautics
had inboard and outboard ailerons and inboard and
outboard flaps, the trailing-edge deflection for minimum
drag would not be one constant deflection across the
trailing edge but rather a variation from the inboard-most surface to the outboard-most surface. Because of
cross-product terms, this multisurface optimization must
be performed in an integrated manner, as opposed to just
optimizing one pair of surfaces at a time then applying
the four (in this case) sets of optimal positions. The
same ideas can be applied to asymmetric optimization
for the lateral-directional axes of the aircraft.
Variable-Camber Wing
All discussions to this point in time have considered
using conventional control surfaces in a symmetric
manner to optimize the configuration. Although use of
existing trailing-edge control surfaces is technically a
variable-camber capability, the use of the term "variable
camber" is normally reserved for a specific capability
designed into a configuration for the specific purpose of
providing the same. The concept of true variable camber
is ideal but also requires the configuration optimization
capability (presented and discussed in this paper) to take
full advantage of the capabilities.
Close Formation Hight (Symmetric and Asymmetric
Optimization)
The concept of close formation flight to reduce drag,
similar to the familiar vee formation birds use, is
receiving attention in the aerodynamics community.
Clearly, the interference aerodynamics of formation
flight are complex and asymmetric for the general
aircraft in the formation. A symmetric aircraft
configuration would not be optimal in the minimum
drag sense, and if redundant control surface (or variable-
camber) capability existed, a more optimal
configuration could be determined based on the
principles previously presented in this paper. The
adaptive configuration optimization process would not
adversely affect the continuous control required to
maintain the optimal formation positioning.
High-Speed Civil Transport
The High-Speed Civil Transport has the potential for
accruing much larger benefits from the configuration
optimization concepts discussed in this paper than from
subsonic transports. The variable geometry of both the
engine and inlets can be used in the optimization of
propulsive thrust or net aircraft performance.
Application to Drag Comparisons
The incremental drag analysis of this paper is
designed to identify incremental drag changes during a
specific maneuver and is not designed for absolute drag
analysis. However, the analysis approach described is
suitable for making comparisons of one configuration to
another, even from flight to flight. The only restriction
would be that the measurement system could not have
changed (for example, a measurable change occurring in
a measurement bias). This capability has been
demonstrated by comparing results obtained from
absolute drag analysis of maneuvers designed for that
purpose with results of the technique described in this
paper using transient maneuvers.
Concluding Remarks
The NASA adaptive performance optimization flight
research program has demonstrated the practical
application of in-flight, real-time, adaptive configuration
optimization for performance enhancement. Theresearch flights were conducted on an L-1011 wide-
body transport that was modified to incorporate
symmetric deflection of the outboard ailerons, which
provided variable-camber capability. Explicit excitationof the redundant control surface (symmetric outboard
aileron) explored variations of raised-cosine, two-sided
raised-cosine, and ramp maneuvers. The drag-minimization algorithm was shown to be capable of
identifying drag to approximately the one-drag-countlevel.
On the L-1011 test bed aircraft, the net benefit of
optimizing the symmetric outboard aileron position is adrag reduction of 2-3 drag counts (approximately
1 percent). Note that the outboard aileron represents a
small portion (approximately 23-percent span from
wing root to tip and approximately 3 percent of the wingarea from wing root to tip) of the total wing trailing-
edge control potential. Many opportunities exist for
application of the adaptive performance optimizationmethodology to current and future commercial and
military transports. The optimization analysis algorithm
can be implemented on commercial aircraft that havelate-generation inertial navigation systems and airdata
systems; engine pressure ratio measurements would be
optional.
Algorithm analysis variations of various maneuver
types indicate the following:
• A two-sided raised-cosine maneuver provides for
improved definition of the quadratic representation
11American Institute of Aeronautics and Astronautics
of drag due to symmetricoutboardailerondeflectionin the optimizationanalysisand,therefore,providesmoreconsistentresultsthanone-sidedraised-cosinemaneuvers.
• Thetwo-sidedraised-cosinemaneuverallowsforawiderangein maneuverperiodswhileproducingsatisfactoryresults.
• Rampmaneuvershavethefavorableattributeofprovidingmoreevendistributionofdatacollectionasa functionof excitationdeflectionthaneithertypeofraised-cosinemaneuver.
• Although low-pass data filtering is required to
produce visually acceptable results, the filteringdoes not noticeably affect the optimization
algorithm results.
References
IGallagher, Thomas J., "Aircraft Finance and Airline
Financial Analysis in the Fifth Cycle of the Jet Age,"
Handbook of Airline Economics, 1995, pp. 223- 234.
2Advance, ! Fighter Technology httegration F- 111
Mission Adtptive Wing, NASA CP-3055, 1990 (ITAR
restricted do zument).
3Bauer, Caus, et al., "A New Structural Approach to
Variable Camber Wing Technology of Transport
Aircraft," AIAA-98-1756, 1998.
4Gilyard, Glenn, Development of a Real-Time
Transport Performance Optimization Methodology,
NASA TM-,:730, 1996.
5Gilyard, Glenn, In-Flight Transport Performance
Optimization: An Experimental Flight Research
Program and an Operational Scenario, NASA
TM-97-206229, 1997.
6Miller, Matthew J., et al., "On-Line Test and
Measureme_at in a Distributed Collaborative
Environmert" Proceedings of the Society for
Experiment:21 Mechanics, Inc., vol. 2, 1998,
pp. 1313-1319.
12American Instituteof Aeronautics and Astronautics