Embed Size (px)
Citation preview
LOADING ON ALUMINIUM RIVET JOINT
MUHAMMAD FIKRI BIN MD NAZIAR
Report submitted in fulfillment of requirements for award of the Degree of Mechanical
Engineering
Faculty of Mechanical Engineering
UNIVERSITI MALAYSIA PAHANG
JUNE 2012
vii
ABSTRACT
Joint is combining two or more component for an application. Rivet joint is a method to
joint two components in real world. Nowadays, rivet joint commonly used in
manufacturing industry, automobile industry and also in aerospace industry due to the good
clam-up, lightweight and good in corrosion resistance. This thesis deal with the loading for
a group of aluminium AA5052 blind rivet pop with the steel plate AISI1006. This
assessment have two objectives which first to investigate the shear stress on a group of
aluminium rivet and second to determine whether centroid of joint influence the strength of
joint. Six different geometry of riveted joint was design to achieve the objectives. Three
from six design were used to design in variable rivet distance from centroid but constant in
angle from centroid meanwhile the other three were designs with constant rivet distance
from centroid and different in angle from centroid. The experiment was used the Shimadzu
Tensile Test Machine for testing the design in axial force. Result obtained from experiment
will be compared to the simulation by using Algor Fempro. From the result, the farthest
distance rivets from centroid hold the highest load and the centroid influence the strength of
joint. The best position will hold the highest load, highest stress and highest shear is at
position of rivet 21mm distance from centroid and angle 51°.
viii
ABSTRAK
Penyambungan adalah persambungan antara dua atau lebih komponen dalam satu aplikasi.
Penyambungan menggunakan rivet adalah salah satu cara yang digunakan dalam bidang
kejuruteraan. Masa kini, teknik penyambungan rivet telah banyak digunakan dalam bidang
industri pembuatan, industri permotoran dan industri perkapalan. Laporan ini mengisahkan
daya tahan sekumpulan aluminium rivet pop jenis AA5052 dengan plat besi. Laporan ini
mempunyai dua objektif. Objektif yang pertama adalah untuk mengkaji kekuatan rivet pada
penyambungan plat besi melalui ujian tegangan dan yang kedua adalah untuk mengkaji
samada titik tengah penyambungan plat besi mempengaruhi kekuatan penyambungan rivet.
Enam berlainan kedudukan rivet digunakan untuk mengkaji dan mencapai objektif. Tiga
daripada enam rekabentuk direka dengan berlainan jarak rivet daripada titik tengah
penyambungan tetapi sudut antara rivet dan titik tengah penyambungan ditetapkan
manakala lebihan tiga rekabentuk direka dengan berlainan sudut dari titik tengah
penyambungan tetapi jarak antara rivet dari titik tengah penyambungan ditetapkan.
Keputusan eksperimen akan dibandingkan dengan keputusan simulasi menggunakan Algor
Fempro. Daripada hasil keputusan, jarak rivet yang jauh dari titik tengah akan menanggung
berat yang paling tinggi, tekanan yang tinggi dan daya ricih yang tinggi pada kedudukan
rivet dari titik tengah penyambungan ialah 21mm dan bersudut 51° dari titik tengah
penyambungan.
ix
TABLE OF CONTENTS
Page
SUPERVISOR’S DECLARATION ii
SECOND REVIEWER’S DECLRARATION iii
STUDENT’S DECLARATION iv
DEDICATION v
ACKNOWLEDGEMENTS vi
ABSTRACT vii
ABSTRAK viii
TABLE OF CONTENTS ix
LIST OF TABLES xii
LIST OF FIGURES xiii
LIST OF ABBREVIATIONS xvii
LIST OF SYMBOLS xviii
CHAPTER 1 INTRODUCTION
1.1 Project Background 1
1.2 Problem Statement 2
1.3 Project Objectives 3
1.4 Project Scopes 3
CHAPTER 2 LITERATURE REVIEW
2.1 Introduction 4
2.2 Background of study 4
2.3 Type of rivet 16
2.3.1 Blind rivet 16
2.3.2 Cold rivet 17
2.3.3 Hot rivet 17
2.4 Blind rivet description 18
2.5 Advantages of Blind Rivet 20
x
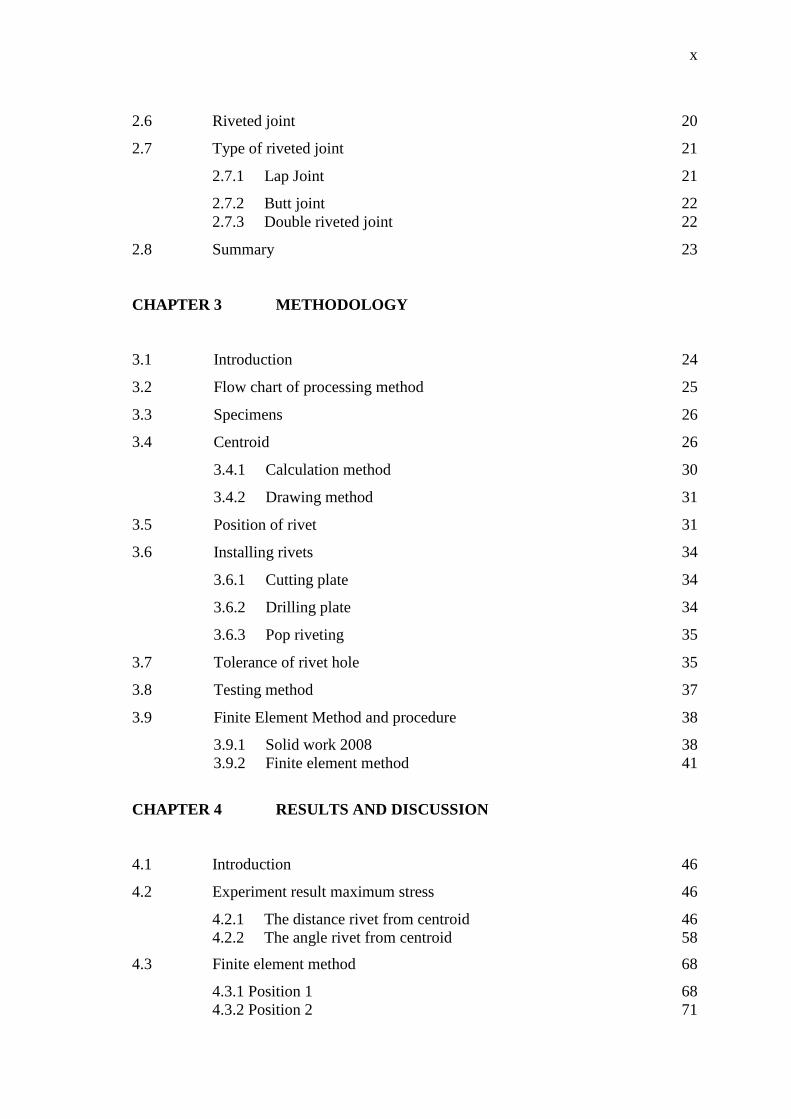
2.6 Riveted joint 20
2.7 Type of riveted joint 21
2.7.1 Lap Joint 21
2.7.2 Butt joint 22
2.7.3 Double riveted joint 22
2.8 Summary 23
CHAPTER 3 METHODOLOGY
3.1 Introduction 24
3.2 Flow chart of processing method 25
3.3 Specimens 26
3.4 Centroid 26
3.4.1 Calculation method 30
3.4.2 Drawing method 31
3.5 Position of rivet 31
3.6 Installing rivets 34
3.6.1 Cutting plate 34
3.6.2 Drilling plate 34
3.6.3 Pop riveting 35
3.7 Tolerance of rivet hole 35
3.8 Testing method 37
3.9 Finite Element Method and procedure 38
3.9.1 Solid work 2008 38
3.9.2 Finite element method 41
CHAPTER 4 RESULTS AND DISCUSSION
4.1 Introduction 46
4.2 Experiment result maximum stress 46
4.2.1 The distance rivet from centroid 46
4.2.2 The angle rivet from centroid 58
4.3 Finite element method 68
4.3.1 Position 1 68
4.3.2 Position 2 71
xi
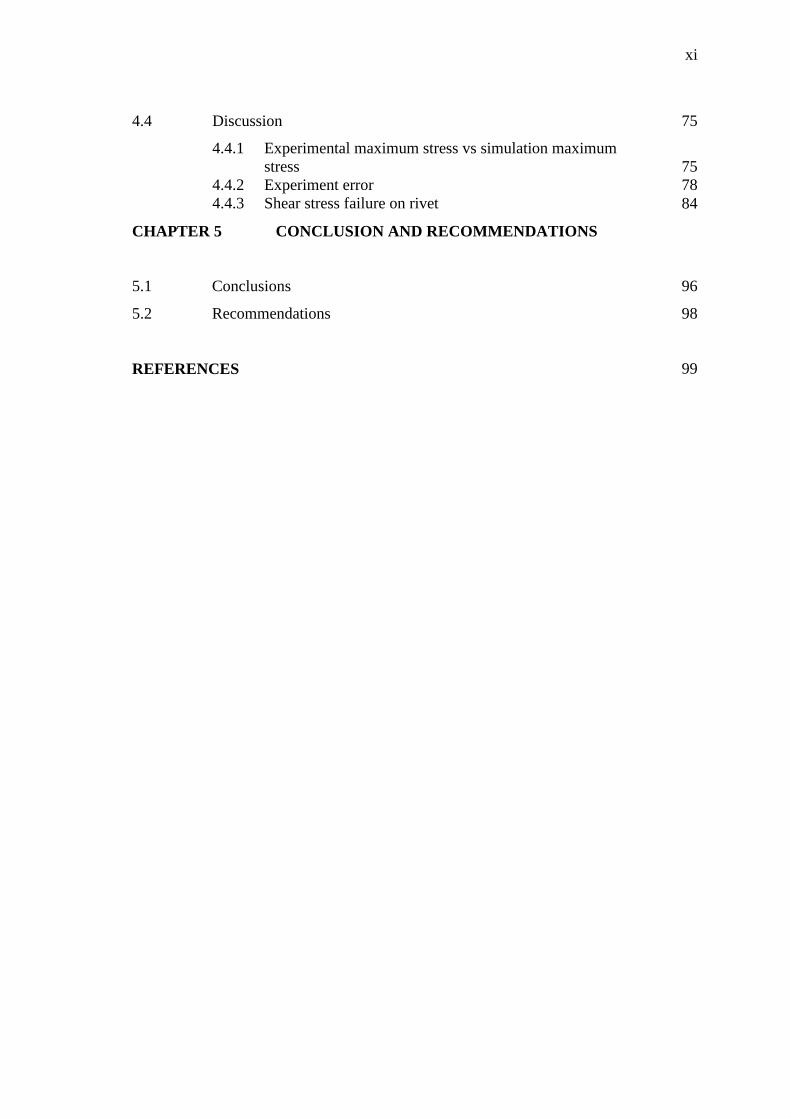
4.4 Discussion 75
4.4.1 Experimental maximum stress vs simulation maximum
stress
75
4.4.2 Experiment error 78
4.4.3 Shear stress failure on rivet 84
CHAPTER 5 CONCLUSION AND RECOMMENDATIONS
5.1 Conclusions 96
5.2 Recommendations 98
REFERENCES 99
xii
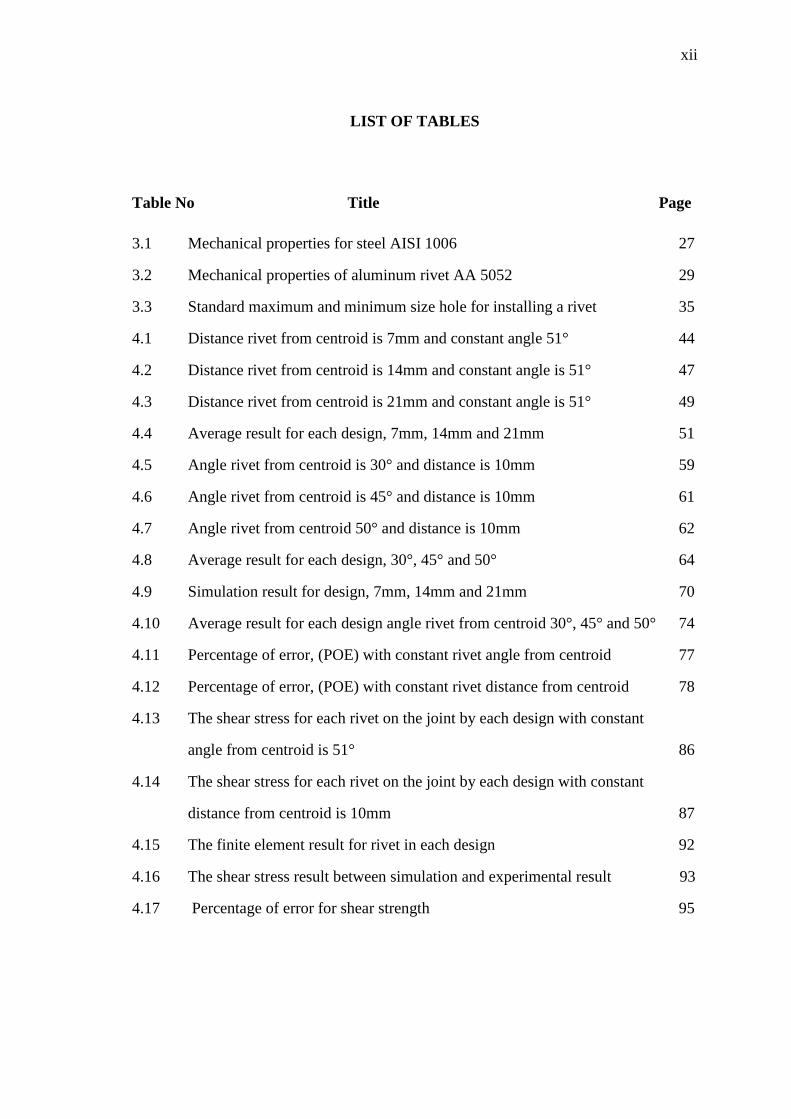
LIST OF TABLES
Table No Title Page
3.1 Mechanical properties for steel AISI 1006 27
3.2 Mechanical properties of aluminum rivet AA 5052 29
3.3 Standard maximum and minimum size hole for installing a rivet 35
4.1 Distance rivet from centroid is 7mm and constant angle 51° 44
4.2 Distance rivet from centroid is 14mm and constant angle is 51° 47
4.3 Distance rivet from centroid is 21mm and constant angle is 51° 49
4.4 Average result for each design, 7mm, 14mm and 21mm 51
4.5 Angle rivet from centroid is 30° and distance is 10mm 59
4.6 Angle rivet from centroid is 45° and distance is 10mm 61
4.7 Angle rivet from centroid 50° and distance is 10mm 62
4.8 Average result for each design, 30°, 45° and 50° 64
4.9 Simulation result for design, 7mm, 14mm and 21mm 70
4.10 Average result for each design angle rivet from centroid 30°, 45° and 50° 74
4.11 Percentage of error, (POE) with constant rivet angle from centroid 77
4.12 Percentage of error, (POE) with constant rivet distance from centroid 78
4.13 The shear stress for each rivet on the joint by each design with constant
angle from centroid is 51° 86
4.14 The shear stress for each rivet on the joint by each design with constant
distance from centroid is 10mm 87
4.15 The finite element result for rivet in each design 92
4.16 The shear stress result between simulation and experimental result 93
4.17 Percentage of error for shear strength 95
xiii
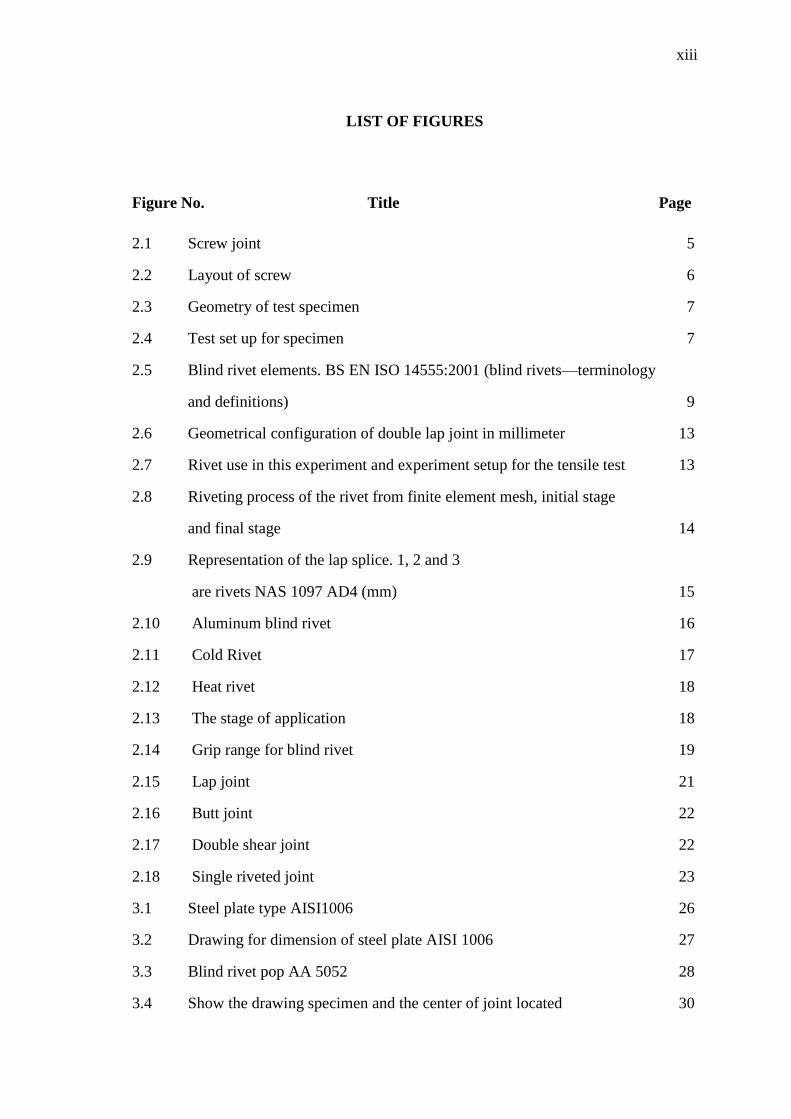
LIST OF FIGURES
Figure No. Title Page
2.1 Screw joint 5
2.2 Layout of screw 6
2.3 Geometry of test specimen 7
2.4 Test set up for specimen 7
2.5 Blind rivet elements. BS EN ISO 14555:2001 (blind rivets—terminology
and definitions) 9
2.6 Geometrical configuration of double lap joint in millimeter 13
2.7 Rivet use in this experiment and experiment setup for the tensile test 13
2.8 Riveting process of the rivet from finite element mesh, initial stage
and final stage 14
2.9 Representation of the lap splice. 1, 2 and 3
are rivets NAS 1097 AD4 (mm) 15
2.10 Aluminum blind rivet 16
2.11 Cold Rivet 17
2.12 Heat rivet 18
2.13 The stage of application 18
2.14 Grip range for blind rivet 19
2.15 Lap joint 21
2.16 Butt joint 22
2.17 Double shear joint 22
2.18 Single riveted joint 23
3.1 Steel plate type AISI1006 26
3.2 Drawing for dimension of steel plate AISI 1006 27
3.3 Blind rivet pop AA 5052 28
3.4 Show the drawing specimen and the center of joint located 30
xiv
3.5 Drawing method to find the centroid of joint 31
3.6 Show the position of the rivets with constant angle θ=51° 32
3.7 The rivets position with the constant diameter, 10mm from centroid 33
3.8 Good formed head resting and fill the hole 36
3.9 Complete rivet joint for tensile test 36
3.10 Tensile test Shimadzu AG-X series 37
3.11 Rivet by using Solid Work 2008 40
3.12 Plate by using Solid Work 2008 40
3.13 Plate and rivet assemble by using Solid Work 2008 41
3.14 Sample design for generating mesh 43
3.15 Sample design for finite element analysis 43
4.1 Graph of maximum stress for three of the specimens (first design) with
constant angle 51° and rivet distance from centroid is 7mm 45
4.2 Graph shown on standard deviation and mean value for maximum stress 47
4.3 Graph of maximum stress for three of the specimen (second design) with
constant angle 51° and rivet distance from centroid is 14mm 48
4.4 Graph shown on standard deviation and mean value for maximum stress 49
4.5 Graph of maximum stress for three of the specimen (third design) with
constant angle 51° and rivet distance from centroid is 14mm 50
4.6 Graph shown on standard deviation and mean value for maximum stress 51
4.7 Graph of average result of maximum stress (N/mm²) for each design with
constant angle 51° 52
4.8 Show the three of different distance among the rivets 53
4.9 Show the mesh model for design 1 with 7mm distance from centroid
and constant angle is 51° 54
4.10 The mesh model for rivet distance 14mm from centroid with constant
angle is 51° 56
4.11 The mesh model for rivet distance 21mm from centroid with constant
angle is 51° 58
xv
4.12 Graph of maximum stress for three of the specimens with angle rivet
from centroid is 30° and constant rivet distance from centroid is 10mm 59
4.13 Graph shown on standard deviation and mean value for maximum stress 60
4.14 Graph of maximum stress for three of the specimens with angle rivet
from centroid is 45° and constant rivet distance from centroid is 10mm 61
4.15 Graph shown on standard deviation and mean value for maximum stress 62
4.16 Graph of maximum stress for three of the specimens with angle rivet from
centroid is 50° and constant rivet distance from centroid is 10mm 63
4.17 Graph shown on standard deviation and mean value for maximum stress 64
4.18 Graph of average result of maximum stress (N/mm²) for each design 65
4.19 The position of rivet joint 66
4.20 Show the position of rivet by using Solid Work software 67
4.21 Finite Element Analysis which distance rivet from centroid is 7mm 69
4.22 Finite Element Analysis which distance rivet from centroid is 14mm 69
4.23 Finite Element Analysis which distance rivet from centroid is 21mm 70
4.24 Graph result of maximum stress (N/mm²) for 7mm, 14mm and 21mm
distance rivet from centroid in simulation 71
4.25 Finite Element Analysis angle rivet from centroid 30° 72
4.26 Finite Element Analysis angle rivet from centroid 45° 73
4.27 Finite Element Analysis angle rivet from centroid 50° 73
4.28 The result in simulation on the maximum stress of joint 30°, 45°,
50° angle rivet from centroid 75
4.29 Graph of Maximum Shear Stress vs Distance rivet from centroid 76
4.30 Graph of Maximum shear stress vs Angle rivet from centroid 77
4.31 Alignment of grips and specimen (Pictorial view) 80
4.32 Alignment of grips and specimen (Side view) 80
4.33 Precaution error to minimize offset of alignment 81
4.34 The parallel alignment between the straight line with wedge grip 82
xvi
4.35 Drilled hole are not straight 83
4.36 The rivet is not in unsymmetrical 84
4.37 Failure of shear stress on rivet 85
4.38 Rivet break by the shear failure 85
4.39 x-x show the critical position of rivet where it failed 88
4.40 Finite Element for rivet with the distance from centroid is 7mm 89
4.41 Finite Element for rivet with the distance from centroid is 14mm 89
4.42 Finite Element for rivet with the distance from centroid is 21mm 90
4.43 Finite Element for rivet with the angle from centroid is 30° 90
4.44 Finite Element for rivet with the angle from centroid is 45° 91
4.45 Finite Element for rivet with the rivet angle from centroid is 50° 92
4.46 Graph shear stress for simulation and experimental for constant rivet
angle is 51° from centroid 93
4.47 Graph shear stress for simulation and experimental for constant rivet
distance from centroid is 10mm 94
xvii
LIST OF SYMBOLS
σ Standard Deviation
N Number of specimen
Observe value of specimen
Mean Value
xviii
LIST OF ABBREVIATIONS
DLJ Double Lap Joint
DIC Digital Image Correlation
FEA Finite Element Analysis
FEM Finite Element Method
PEO Percentage of Error
AA Aluminum Alloy
Al Aluminium
CHAPTER 1
INTRODUCTION AND GENERAL INFORMATION
1.1 PROJECT BACKGROUND
Rivets are considered to be permanent fasteners. Riveted joints are therefore
similar to welded and adhesive joints. When considering the strength of riveted joints
similar calculations are used as for bolted joints. Rivets have been used in many large
scales applications including shipbuilding, boilers, pressure vessels, bridges and
buildings. In recent years there has been a progressive move from riveted joints to
welded, bonded and even bolted joints A riveted joint, in larger quantities is sometimes
cheaper than the other options but it requires higher skill levels and more access to both
sides of the joint. Rivets for mechanical and structural applications are normally made
from ductile (low carbon) steel or wrought iron. For applications where weight,
corrosion, or material constraints apply, rivets can be made from copper aluminum.
Nowadays, there are a lot of application is applying rivet joint to assemble. Rivet
is used for joining two members of any structure and is used for developing the
permanent joint which is by method something between bolting and welding. In fact
rivets are bolt like items with heads but without threads which are inserted in the holes
made in members from one end for jointing and since there are no threads on the body
of rivets for mounting the nuts and tightening the members those ends are instead
flattened by hammering manually or by electrical/pneumatic hammers to develop the
grips so that the members are joined. These rivet joint is very good solution to resist any
load like tensile load but without good design of joint, it can give trouble or in other
words is dangerous for users. Without good design of joint, it can easily got failure from
2
rivet even though only for small load. If properly design with a good experiment, rivet
joint can hold a larger load for the structure.
In a rivet joint with tensile loading, the rivets are sharing the load in shear,
bearing in the rivet, bearing in the member, and shear in the rivet. When one rivet is
failed, another rivet will begins to carry the load until all the rivets will fail. The right
position of rivet need to correctly design to make all rivets is shared same load when
they are subjected with load. Two rivets with close distance shared higher load than one
rivet alone or far from another rivets.
In this project, it needs to investigate the shear joint failure owing to tensile
loading for a group of aluminum rivets. In designing of semi-permanent joints of two
plates under tensile loading, the position of the rivets will be essential to ensure load is
well distributed on the joints (rivets). Most of the available methods have been
developed to estimate the loading capacity using side-edge distance but not the best
position of pin group under tensile loads based on the assumptions of angle and distance
from centroid. The investigation use aluminum rivets as connector to joint two plates
made of steel. It will be tested with rivets located at various positions and tested until at
least one pin failed. The primary investigations have to be simulated using ALGOR for
the optimum positions. The analysis is used to find the lowest stress from four pins and
first pin that failed. In this experiment, the expected result to be is the closer distance of
aluminum rivet to the centroid axis the higher load the rivet can support.
1.2 PROBLEM STATEMENT
Basically, there is less research about fastener joints that focusing on centroid of
joining plate. It more research on the layout of fastener, diameter and material of
fastener. In this experiment, it needs to investigate the shear joint failure for a group of
aluminum rivet. For that, it needs to be design the best position of aluminum rivets joint
for steel plate. From the design, it can be supported any load subjected and from that
analyze on shear joint failure on the aluminum rivets. From this, it can be consume that
if designing a rivet joint is worse, it can be dangerous for any life of using the joint such
as in aircraft industry or construction. Take aircraft as example, if the rivet joint are not
3
in good position to carry the load, it can give risk to passengers while flying even
dangerous while taking off. From this case, the right position with a best designing for
aluminum rivets are very important to support highest load and overcome the failure.
1.3 PROJECT OBJECTIVES
i. To investigate the shear joint failure to tensile loading for a group of
aluminums rivet.
ii. To investigate whether centroid of joint influence the strength of
aluminum rivets joint.
1.4 PROJECT SCOPE
i. The tensile load and size of specimen will be governed by the mounting
on the Universal Testing Machine (Shimadzu Autograph AG-X Series,
Max load 100kN).
ii. Aluminum rivets (AA5052) are use on steel base plate (AISI1006).
iii. Variation will be distance between rivets, 7mm, 14mm, 21mm and
angles 30ᵒ, 45ᵒ, 50ᵒ using centroid as reference.
iv. Standard rivet size is used= Rivet size diameter 3mm and length is
nominal length 9.5mm
CHAPTER 2
LITERATURE REVIEW
2.1 INTRODUCTION
Determine the shear stress for aluminum rivet is one of experiment objective. A
research about these element have done and it primarily covered deformation of rivets,
load distribution failure and damage tolerances design of rivet joint, tensile strength,
shear strength and effective stress for rivet and steel plate. From this research, a few
rivet has been use for investigating its structure and behavior in term of strength and
structure. Besides that, one research for modeling of steel adhesive joints reinforced by
rivets have been done by T. Sadowski, M. Knec and P. Golewski from Lublin
University of Technology at Poland on March 2010. From this, it can be explain on how
the rivet deformation and also stress concentration in different parts of the joint. A few
factor need to take noted for design layout for rivet joint. It needs to be focus in terms of
distance of rivet with the end and edge, the spacing between rivet, ultimate load of rivet
and also its strength. Extensive research has been done in the past to study the fastener
lap joint such as rivet, pin and bolt joints. Literature review present with preview of the
past studies on fastener joint. Various experimental and finite element analysis
conducted on the fastener joints are available in this review.
2.2 BACKGROUND OF STUDY
(Miqual Casafont, January 2006) has developed an experimental testing of joint
for seismic design of lightweight structures of screw joints in straps. For this paper, it is
deal with seismic response of lightweight steel structure. It will discuss about design
guide for engineers including method analysis and rule about detailing that are
5
contribute in industry nowadays. This guidance must take into account that mass and
stiffness are quite different from conventional steel structure. For any type of structure,
two basic seismic requirements are enough lateral stiffness to resist seismic loads
without significant structural damage and energy dissipation mechanisms is through
plastic deformation. Fasteners working as shear connections are the most effective
mechanism of force transfer due to their good behavior in terms of stiffness, strength
and deformation capacity. There have several different types of fasteners can be used
such as rivets, bolts, screw and pins. The objective of this experiment is to obtain
parameters such as the initial stiffness, yield load, ultimate load and maximum
displacement. Second objective is to complete force-displacement curve, needed for the
finite element modeling of x-braced frames and lastly is to identify the various failure
modes. For this experiment, it will be analyze result in order to classify the various
failure modes in terms of their seismic strength and ductility.
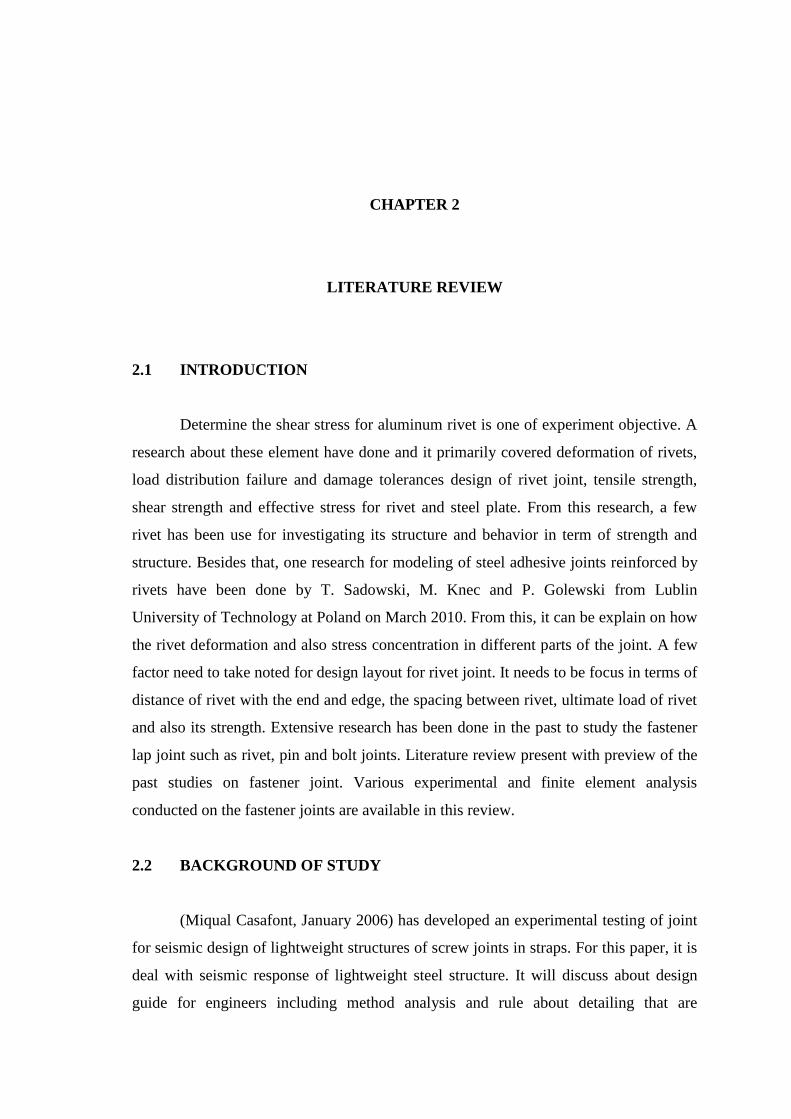
Figure 2.1: Screw joint
Source: Miqual Casafont (2006)
In this experiment, it uses two different diameters were used to connect the straps: 4.8
and 6.3mm. The shaft length of the 4.8 mm diameter screws was always 10 mm for
threaded part and they could have either flat and square heads or hexagonal heads. The
shaft of the 6.3 diameter screws, whose head was always hexagonal, could be 10 or 30
6
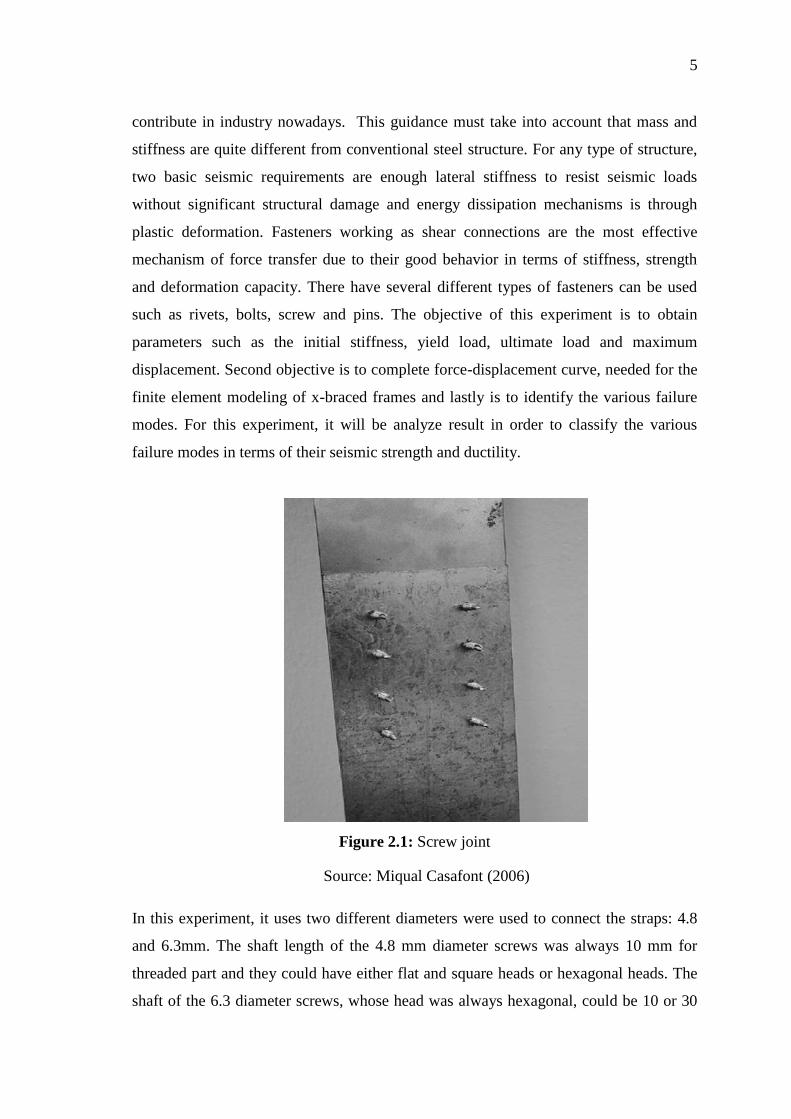
mm long for threaded part. The length of the steel straps ranged between 350 and 475
mm, depending on the number of screws of the joint. Their thickness was also variable
from 0.85 to 3 mm, but their width was always the same, 100 mm. For the layout design
for this experiment as be shown by the picture below. The picture shows the position of
the screws: the spacing and the longitudinal and transverse edge distances. The joint
layout was identical for all the specimens.
Figure 2.2: Layout of screw
Source: Miqual Casafont (2006)
This experiment investigation performed on the behavior of screwed
connections has allowed distinguishing two types of joints depending on the mode of
failure. For the first result there are those joints that fail in a combination of tilting,
bearing and pull out or sometimes it goes for pull through. For the second result there is
a second group of joints whose failure mode is basically a combination of tilting and net
section failure. By analyzing the result, the distinction between these groups is very
important. It is because the joint have enough strength to allow the cyclic yielding of the
diagonals. There can be dissipative action, which takes place in the load interval
between the yielding load of the strap gross cross-section and the ultimate load of joint.
the displacements corresponding to experimental strengths range from about 5 to 7 mm,
depending on the number of screw columns. The collapse of the joint takes place later
than expected and also for higher loads.
(Hitoshi Kuwamura, March 2007) has using finite element method to modeling
of bolted connection in thin wall stainless steel plate under static shear. In this study,
7
based on the existing test data for calibration and parametric study, finite element (FE)
model with three-dimensional solid elements using ABAQUS program is established to
investigate the structural behavior of bolted shear connections with thin-walled stainless
steel plate. Non-linear material and non-geometric analysis is carried out in order to
predict the load–displacement curves of bolted connections. Experimental research
regarding two types of bolted connections: single shear and double shear connections,
fabricated from thin-walled stainless steel using 1.5 or 3.0mm thick plate and 12
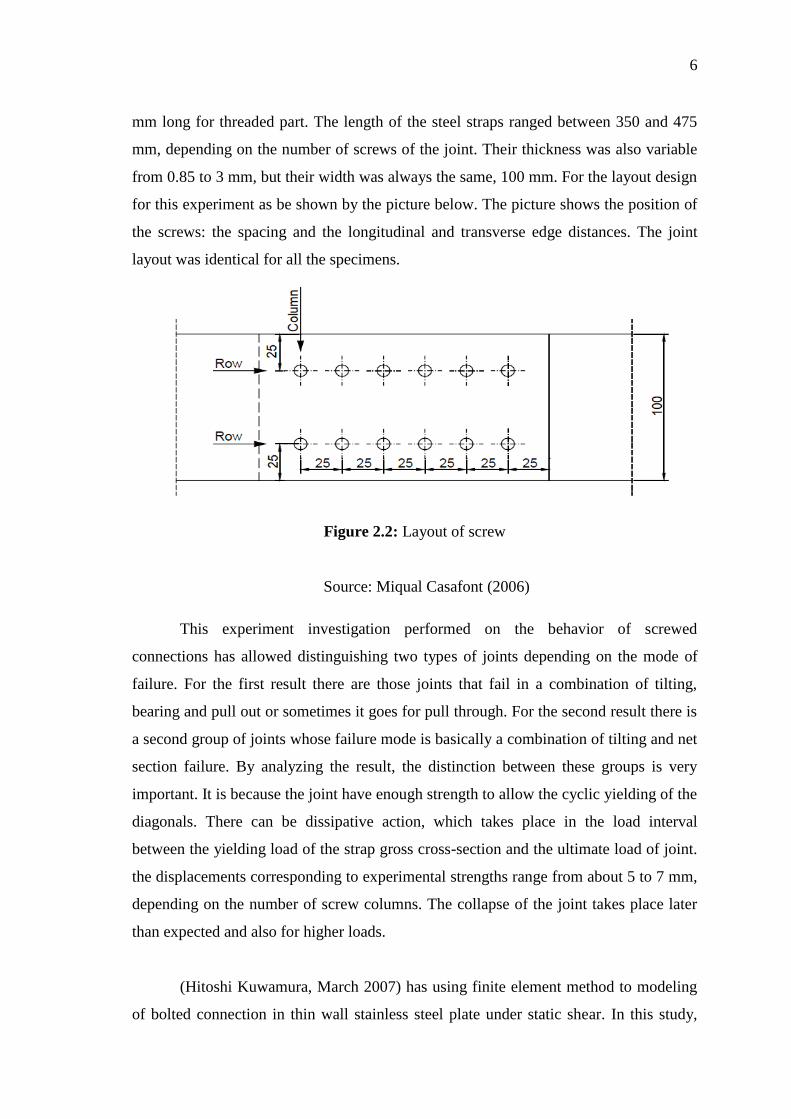
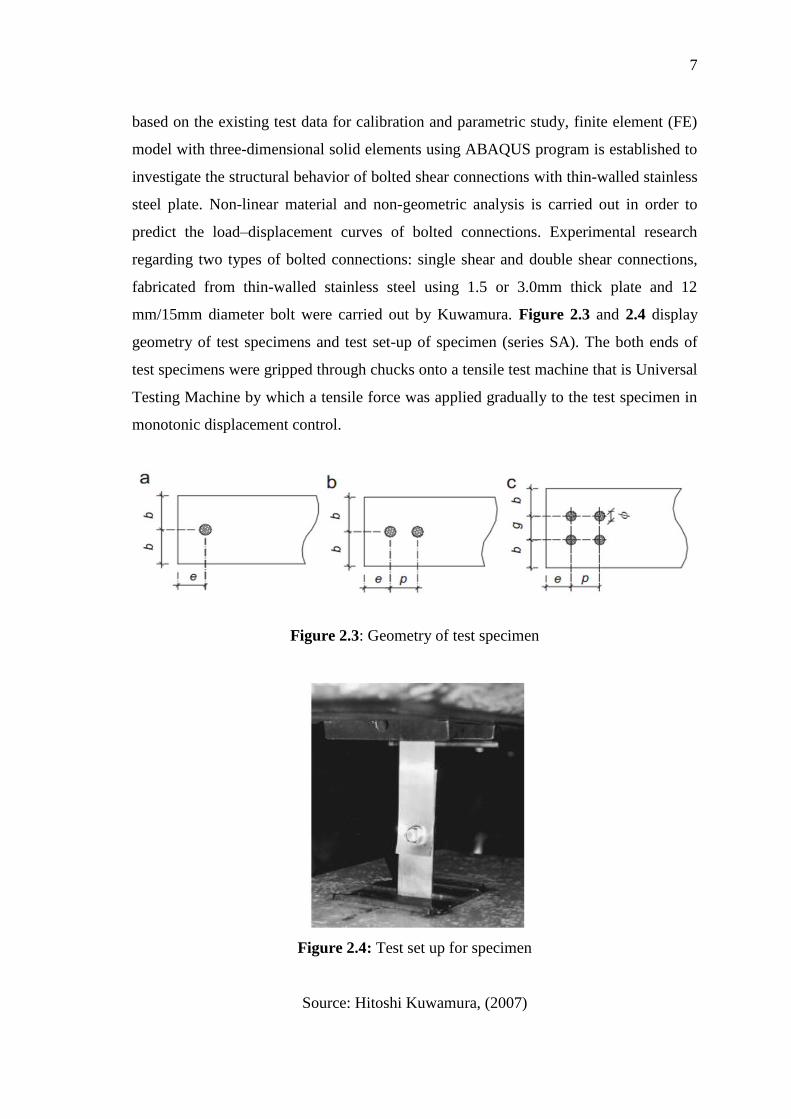
mm/15mm diameter bolt were carried out by Kuwamura. Figure 2.3 and 2.4 display
geometry of test specimens and test set-up of specimen (series SA). The both ends of
test specimens were gripped through chucks onto a tensile test machine that is Universal
Testing Machine by which a tensile force was applied gradually to the test specimen in
monotonic displacement control.
Figure 2.3: Geometry of test specimen
Figure 2.4: Test set up for specimen
Source: Hitoshi Kuwamura, (2007)
8
The objective of Finite Element Method analysis is not to describe reality as
accurately as possible, but to find the simplest model resulting in a sufficiently accurate
description of reality. For the experimental results, the purpose of this research is to
predict the ultimate behaviors such as failure mode, ultimate strength and the
occurrence of curling for thin-walled stainless steel bolted connections through the FE
analysis. Test results of eight specimens with two kinds of plate thickness and three
types of bolt arrangements were used to calibrate the FE models. The FE model
predicted accurately the curling of bolted connections, which was occurred in the
experimental results and could also trace the entire load–displacement path. In addition,
with the Finite Element analysis results, the yield patterns, deformed shapes and
stress/strain distributions in bolted connections were possible to be scrutinized in detail
at specified displacement level. A variety of parametric studies were performed in order
to investigate the influence of the curling (out of plane deformation) on the ultimate
strength of bolted connections. From this experiment, Kuwara has noted that if curling
is occurred in the Finite Element model after the ultimate strength is reached, the
curling has negligible influence on the ultimate strength of bolted connections.
(Billy Kelly, 2004) is using FEA modeling of setting and mechanical testing of
blind rivets. His paper describes simulation of the setting of a blind rivet, using an
axisymmetric model in the MSC.MARC/Mentat FEA package. Mechanical fastener
joints, including blind rivets, are widely used in industry including the aerospace
industries. In general there are two types of failure observed in mechanical fasteners:
shear failure and tensile failure. Other failure modes such as tension, shear-out,
bearing, cleavage and pull-out may be observed in the structures being joined. The
finite element technology has grown from an academic arena into the industrial world
and has dramatically changed the way in which components are designed and made.
Due to the complexity of the material and geometry non-linearity involved, metal
forming has attracted great attention from researchers. The ability to accurately model
mechanical fasteners is fundamental to understanding the failure mechanisms involved.
Modeling of the failure mechanisms of fasteners in shear and tensile failure may be
modeled using 3D finite element modeling. To simplify the rivet model detail and
reduce processing time, 2D-axisymmetric modeling of the setting process and tensile
failure mode may be used. The blind rivet components, mandrel and rivet; can be seen
9
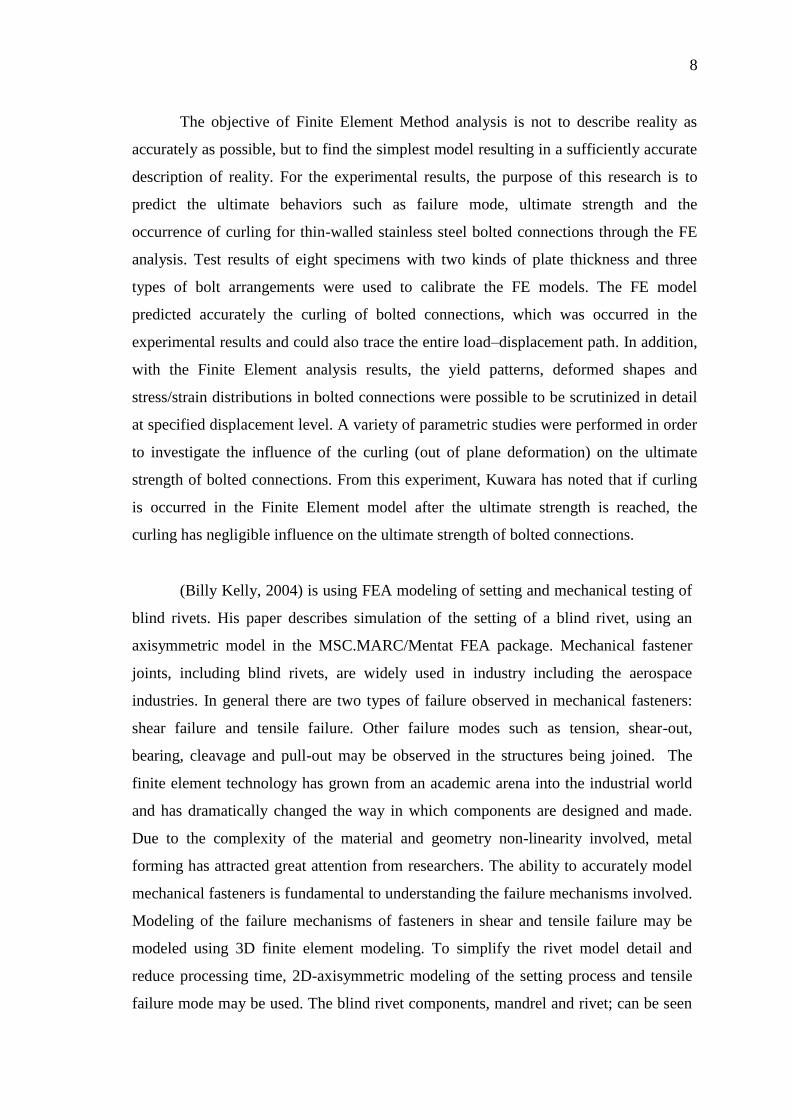
in Figure 2.5.
Figure 2.5: Blind rivet elements. BS EN ISO 14555:2001 (blind rivets—
terminology and definitions.
Source: Billy Kelly (2004)
The model must accurately deal with contact friction, separation issues, and
computational expense of the model and accurate geometrical definition of the
components. The analysis of forming force on the head of the mandrel from both
mechanical testing and modeling can be compared. The formed shape of the set rivet
can be compared to that predicted by the FE analysis. The final stage of the analysis
deals with the forces involved, in physical and simulated tensile failure. The
mechanical testing of the blind rivets was pre-formed in two ways. The first is the
analysis of setting forces in the rivet and secondly is the tensile testing of the set rivet.
The more symmetric the rivet body remains during forming, the lower the initial
forming forces are. For non-symmetric rivets the force increases more rapidly over the
distance travelled, and the mandrel breaks at an earlier position to that of the symmetric
shaped rivets. In this experiment, Billy has made up a conclusion that is simulation of
the setting of a blind rivet accurately predicts actual deformed shape and the location of
failure in the rivet under a tensile load can also be seen. Secondly is the FE model
developed accurately predicts the forces involved in the forming of the rivet in
comparison to the physical results and the model however does not accurately predict
the failure of the rivet in tension. Last conclusion is the axisymmetric FE models
cannot predict non-symmetric behavior in the setting of blind rivets. The development
10
of full 3D-models is required for this. The degree of instability within the forming of
the rivet can be seen to directly affect setting force.
(MD Aniello, November 2010) has develop experiment to investigate on shear
behavior of riveted connection in steel structure. In this paper, the experimental
investigation allowed the influence of various parameters on the response of the
connections to be assessed, such as load eccentricity, variation in net area, plate width
and number of rivets. The experimental results and predicted shear strengths were
compared in order to evaluate the reliability of the provisions of EN 1993:1-8. On the
basis of the results obtained, modifications are proposed to the design equations given
by EN 1993:1-8 for the rivet shear strength and the ultimate resistance of the net cross-
section. The technique used to perforate the plates may also affect the connection
strength and fatigue life of riveted structures. In old metal structures, holes were
obtained by techniques such as: drilling, punching, sub-drilling and reaming, punching
and reaming. Their effects on shear connections are important when splices fail in
tension on the net section. Indeed, early tests showed that splices made of plates with
drilled holes exhibited a large deformation with high necking, while in the case of
punched holes the failure occurred in a brittle manner without evident necking. To
analyze the influence of different parameters on the shear capacity of typical lap shear
connections representative of historic structural typologies as example of roofing
structures, low-rise buildings and bridges in terms of structural verification according
to the modern codes, a wide experimental investigation was carried out within the
framework.
From the result, Aniello was highlighted that the shear behavior is strictly
dependant on the geometry of the joint and the loading conditions. In the case of
unsymmetrical specimens the load eccentricity induced a secondary bending moment,
showing significant out-of-plane displacements, which tend to lift off one plate from
the adjacent one at each connection. Tests showed that the effects of bending are
mainly confined to the regions where plate discontinuities occur. As the joint length
increases so bending will become less pronounced and the influence on the behavior of
the connection should decrease. In other hand, all specimens which failed in tension on
11
the net section exhibited ultimate tensile strengths of perforated plates higher than
those found in the unaxial coupon tests. This effect has also been found by other
researchers and it is known as the ‘‘net efficiency’’. This phenomenon may be
attributed to the fact that the presence of the hole also gives rise to transverse stresses
generating a sort of multiple-stress effect, emphasized by the presence of clamping
force in the rivets, which avoid free lateral contractions in their vicinity. For result of
plate width, it is show that plate width is another parameter which influences the net
efficiency.
This can be proved by observing for specimen, which failed in tension in the
net area, where two different plate widths were investigated for the same geometric
parameters. By this observation, indeed, increasing the plate width increased the
ultimate strength of the connection. For the result of effect of joint length, tests showed
that joint length is an important parameter that influences the ultimate strength of the
joint, especially for single lap shear connections. Although the present study did not
explicitly aim to investigate the influence of pitch on shear capacity and specific
parametric tests were not performed, tests showed that the examined range of spacing
did not appreciably influence the shear strength. From all the result, Aniello has made
of conclusion. The experimental results highlighted that a considerable amount of out-
of-plane deformation occurred in unsymmetrical joints. It is clear that the effects of
bending were mainly confined to the regions where plate discontinuities occurred.
Obviously, as the joint length increased, bending was less pronounced, and its
influence on the behavior of the connection decreased.
The influence of bending was most pronounced in the splice with only a single
fastener in the direction of the applied load. In such a joint the fastener was not only
subjected to single shear, but a secondary tensile component may also be present.
Furthermore, the plate’s material in the direct vicinity of the splice was subjected to
high bending stresses due to the eccentricity of the load. Hence, the bending tended to
slightly decrease the ultimate strength of short connections. The shear strength of
longer unsymmetrical joints seemed to be less affected by the effects of bending. The
experimental over-strength in the bearing failure mode may be due to the contribution