Embed Size (px)
Citation preview
SOLUTION BRIEF: SLCM R12.7 PERFORMANCE TEST RESULTS | JANUARY, 2012
Load Test Results
for Submit and
Approval Phases of
Request Life Cycle

Copyright © 2011 CA. All rights reserved. All trademarks, trade names, service marks and logos referenced herein belong to their respective companies.
CA Service Catalog Release 12.7 Submit/Approval Load Test Results
PAGE 2 OF 20
Table of Contents
Executive Summary 3
Test Environment 4 Server Topology 4
CA Service Catalog Settings 5
Database Settings 5 Transaction volume 6
Test Scenarios 7 Requester Scenario 7
Approver Scenario 7
Refresher Scenario 8
Test Results 9 Transaction Statistics 9
Request placed & approved statistics 9
Percentile Chart 10 CPU Usage 12
Transaction Rate over Time 13
Throughput Rate 14 Response Times 15 Custom Response Times 17
Transaction Completion Time 19
Conclusion 20
Copyright © 2011 CA. All rights reserved. All trademarks, trade names, service marks and logos referenced herein belong to their respective companies.
CA Service Catalog Release 12.7 Submit/Approval Load Test Results
PAGE 3 OF 20
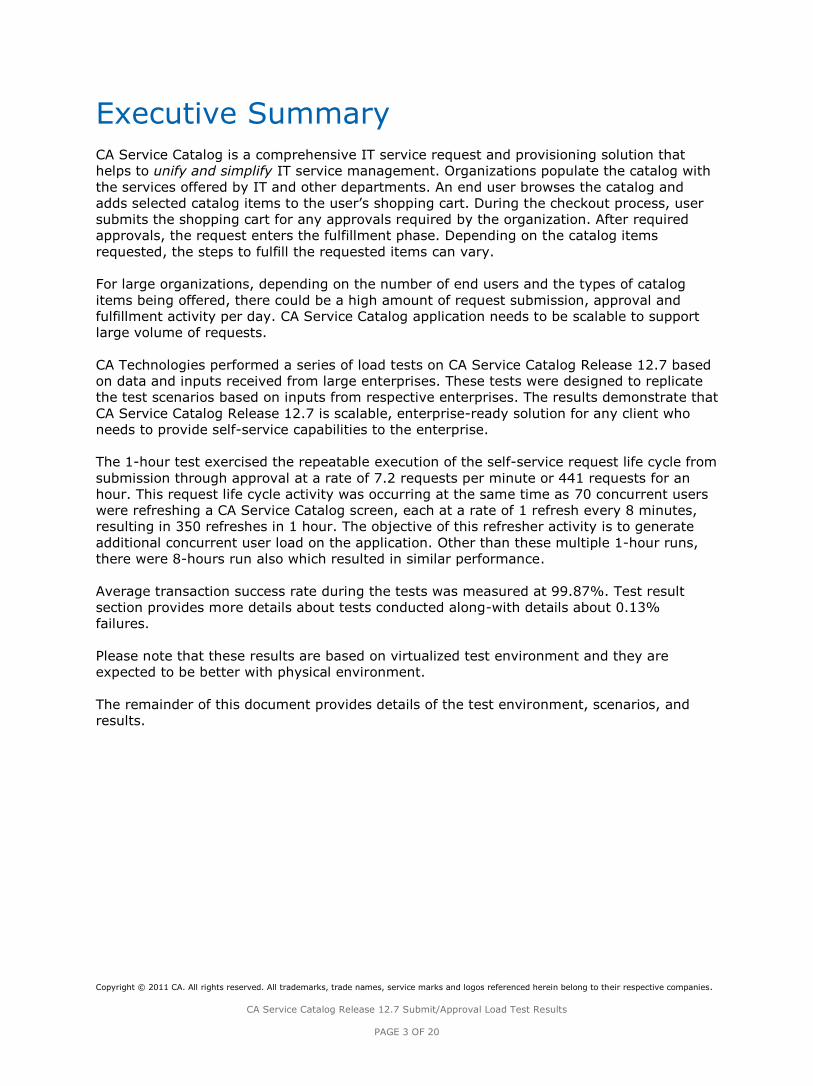
Executive Summary
CA Service Catalog is a comprehensive IT service request and provisioning solution that
helps to unify and simplify IT service management. Organizations populate the catalog with
the services offered by IT and other departments. An end user browses the catalog and
adds selected catalog items to the user’s shopping cart. During the checkout process, user
submits the shopping cart for any approvals required by the organization. After required
approvals, the request enters the fulfillment phase. Depending on the catalog items
requested, the steps to fulfill the requested items can vary.
For large organizations, depending on the number of end users and the types of catalog
items being offered, there could be a high amount of request submission, approval and
fulfillment activity per day. CA Service Catalog application needs to be scalable to support
large volume of requests.
CA Technologies performed a series of load tests on CA Service Catalog Release 12.7 based
on data and inputs received from large enterprises. These tests were designed to replicate
the test scenarios based on inputs from respective enterprises. The results demonstrate that
CA Service Catalog Release 12.7 is scalable, enterprise-ready solution for any client who
needs to provide self-service capabilities to the enterprise.
The 1-hour test exercised the repeatable execution of the self-service request life cycle from
submission through approval at a rate of 7.2 requests per minute or 441 requests for an
hour. This request life cycle activity was occurring at the same time as 70 concurrent users
were refreshing a CA Service Catalog screen, each at a rate of 1 refresh every 8 minutes,
resulting in 350 refreshes in 1 hour. The objective of this refresher activity is to generate
additional concurrent user load on the application. Other than these multiple 1-hour runs,
there were 8-hours run also which resulted in similar performance.
Average transaction success rate during the tests was measured at 99.87%. Test result
section provides more details about tests conducted along-with details about 0.13%
failures.
Please note that these results are based on virtualized test environment and they are
expected to be better with physical environment.
The remainder of this document provides details of the test environment, scenarios, and
results.
Copyright © 2011 CA. All rights reserved. All trademarks, trade names, service marks and logos referenced herein belong to their respective companies.
CA Service Catalog Release 12.7 Submit/Approval Load Test Results
PAGE 4 OF 20
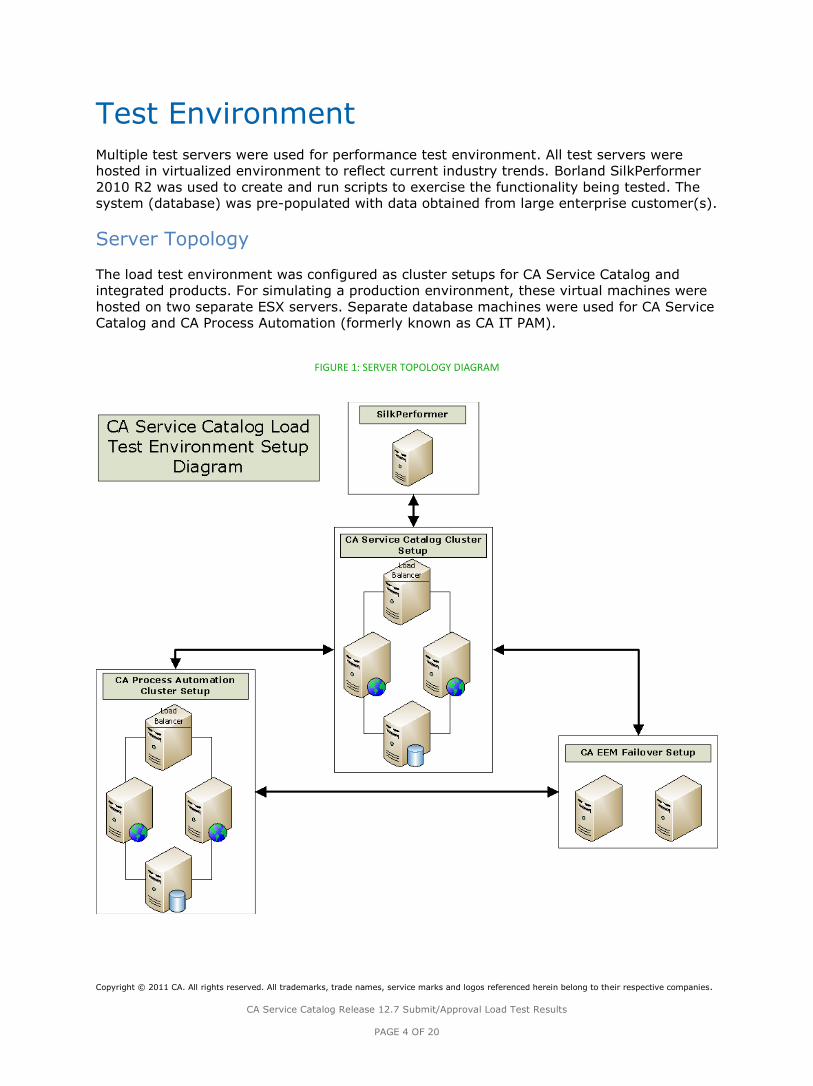
Test Environment
Multiple test servers were used for performance test environment. All test servers were
hosted in virtualized environment to reflect current industry trends. Borland SilkPerformer
2010 R2 was used to create and run scripts to exercise the functionality being tested. The
system (database) was pre-populated with data obtained from large enterprise customer(s).
Server Topology
The load test environment was configured as cluster setups for CA Service Catalog and
integrated products. For simulating a production environment, these virtual machines were
hosted on two separate ESX servers. Separate database machines were used for CA Service
Catalog and CA Process Automation (formerly known as CA IT PAM).
FIGURE 1: SERVER TOPOLOGY DIAGRAM

Copyright © 2011 CA. All rights reserved. All trademarks, trade names, service marks and logos referenced herein belong to their respective companies.
CA Service Catalog Release 12.7 Submit/Approval Load Test Results
PAGE 5 OF 20
There were total 11 virtual machines in the performance test environment all having
following configuration:
Intel(R) Xeon(R) CPU [email protected] – Dual Core
4096 MB RAM
Microsoft Windows Server 2008 R2 Enterprise edition (64-bit)
Server Software ESX Server Provisioned
Space
Service View (Primary), CA
Service Catalog and CA
Service Accounting
CA Service
Catalog Release
12.7
ESX Server 1 122.08 GB
Service View (Secondary)
CA Service
Catalog Release
12.7
ESX Server 2 121.27 GB
CA Service Catalog Load
Balancer
Apache
Webserver 2.2 ESX Server 1 124.00 GB
Database (MDB) MS SQL Server
2008 ESX Server 1 240.64 GB
CA Process Automation
Load Balancer
Apache
Webserver 2.2 ESX Server 2 124.07 GB
CA Process Automation
Node 1 CA PAM R3.1 ESX Server 2 124.47 GB
CA Process Automation
Node 2 CA PAM R3.1 ESX Server 1 125.56 GB
CA Process Automation
Database
MS SQL Server
2008 ESX Server 2 124.00 GB
Primary CA EEM CA EEM R8.4 ESX Server 1 120.00 GB
Secondary CA EEM CA EEM R8.4 ESX Server 2 120.00 GB
SilkPerformer controller SilkPerformer
2010 R2 ESX Server 1 204.00 GB
CA Service Catalog Settings
The following CA Service Catalog configuration settings were adjusted to promote optimal
performance.
Item Setting Unit
Tomcat threads 800 number
Tomcat connection timeout 1000000 milliseconds
Java initial heap size 512 MB
Java maximum heap size 1025 MB
Max database connection pool size 200 number
Database Settings
No changes were made to the default settings. Transaction log for MS SQL Server was set at
Full mode (the default).
Copyright © 2011 CA. All rights reserved. All trademarks, trade names, service marks and logos referenced herein belong to their respective companies.
CA Service Catalog Release 12.7 Submit/Approval Load Test Results
PAGE 6 OF 20
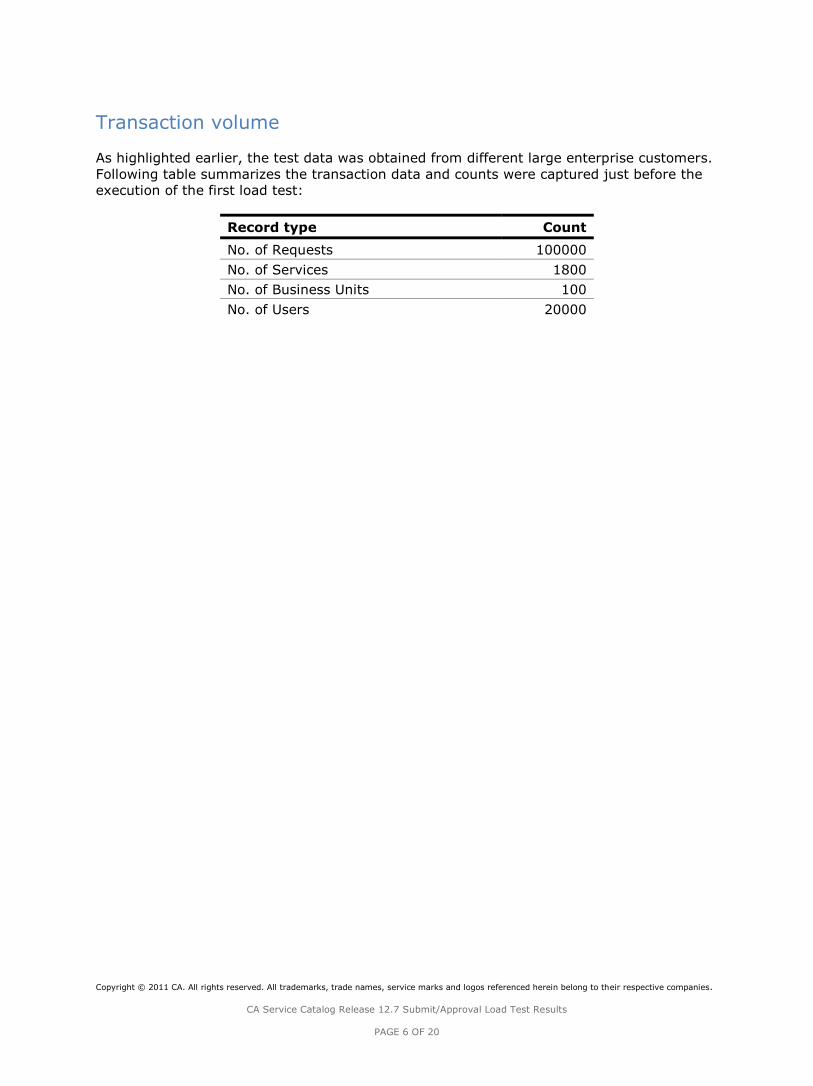
Transaction volume
As highlighted earlier, the test data was obtained from different large enterprise customers.
Following table summarizes the transaction data and counts were captured just before the
execution of the first load test:
Record type Count
No. of Requests 100000
No. of Services 1800
No. of Business Units 100
No. of Users 20000

Copyright © 2011 CA. All rights reserved. All trademarks, trade names, service marks and logos referenced herein belong to their respective companies.
CA Service Catalog Release 12.7 Submit/Approval Load Test Results
PAGE 7 OF 20
Test Scenarios
The test scripts simulated submit and approval process of the CA Service Catalog request
life cycle. In addition, the test scripts simulated additional CA Service Catalog activity of
refreshing logged in users’ profile. This activity is unrelated to the request life cycle;
however, it generates application load.
The details of the performance test scripts are given below. For all scripts, to simulate users’
“think” time, there was a pause of two seconds for each page displayed and a pause of five
seconds between user logout and subsequent login.
The service used for the test was the predefined Access Security service which is available
out of the box.
Requester Scenario
In the requester scenario, a user in the Catalog End User role logs in to CA Service Catalog,
selects a service to add to his cart, submits his request for approval, and logs out of CA
Service Catalog. This test simulates the catalog entry selection and request submission
phases of the CA Service Catalog request life cycle. This script results in average of 441
requests created over a 1-hour time period.
The steps in the script are as follows
1 15 requesters log in to CA Service Catalog at an interval of 5 seconds each, ramping
up load on the application.
2 Each of these 15 users; selects a service from the CA Service Catalog to add to its
cart.
3 User completes the fields on the form associated with selected service.
4 The shopping cart is displayed and user submits the cart.
5 The user logs out.
When the user submits the cart, CA Service Catalog causes an associated CA Process
Automation process to initiate. The process instance determines the manager of the
requester and assigns an approval task to that manager (the approver).
Approver Scenario The approver scenario tests the condition where a user in the Catalog User role logs into CA
Service Catalog, refreshes his pending actions list until a request for approval appears,
selects a request from the displayed list; approves it and logs out of CA Service Catalog.
This test simulates the approval phase of the CA Service Catalog request life cycle. The steps in the script are as follows.
1 15 approvers log in to Service Catalog at an interval of 5 seconds.
2 These 15 users each look for greater than 0 pending actions else waits for 5 seconds
before they log out.
3 Go to pending action page and select a request for approval and open the approval
page for the same.
4 The approval page displays for the selected request.
5 The request is approved.
6 The user logs out.
Copyright © 2011 CA. All rights reserved. All trademarks, trade names, service marks and logos referenced herein belong to their respective companies.
CA Service Catalog Release 12.7 Submit/Approval Load Test Results
PAGE 8 OF 20
Performance test suite was configured to have a lag of 5 minutes for approver scripts so
that requests are placed before approver scripts starts. When approver approves the
request, CA Service Catalog causes an associated CA IT PAM process to start which changes
the status of the request to Pending Fulfillment.
Refresher Scenario In the refresher scenario, a user with the Catalog End User role is logged into CA Service
Catalog and continually refreshes the User Profile page. This test simulates random CA
Service Catalog activity while the primary request life cycle test is being conducted.
The steps in the script are as follows.
1 All 70 refreshers are logged in to CA Service Catalog at the rate of 5 users every 10
seconds.
2 Each of these 70 refreshers re-load the User Profile page once every 8 minutes.
3 The user logs out from CA Service Catalog.
This is repeated for the entire duration of the test to have a consistent load of 100 virtual
users.

Copyright © 2011 CA. All rights reserved. All trademarks, trade names, service marks and logos referenced herein belong to their respective companies.
CA Service Catalog Release 12.7 Submit/Approval Load Test Results
PAGE 9 OF 20
Test Results
Transaction Statistics
Performance test results have been obtained as an average of 3 runs (1hour each) and
following table represents the same:
Test # Successful
Transactions
# Failed
Transactions
Success Rate
Test 1 1301 2 99.84%
Test 2 1278 3 99.76%
Test 3 1094 - 100.0%
Average transaction success rate for 3 tests was 99.87% and 0.13% failure was due to 5
failed transactions. These failed transactions were analyzed and following paragraph shares
outcome of same:
All of these 5 transactions failed due to error 500: Internal Server Error. When this error
occurred there were no errors found in application logs and it appeared to be a temporary
issues with test environment as it didn’t halt other virtual users and subsequent requests
were successful.
Request placed & approved statistics
Test Requests
Placed
Requests
Approved
Requests
processed per
minute
Test 1 460 445 7.41
Test 2 435 429 7.15
Test 3 428 422 7.03
Note: Difference in number of requests placed and requests approved was due to the fact
that performance test was configured to be aborted exactly after 1 hour of execution. Due
to this requests placed at the very end of this period couldn’t be approved by the time test
ended.

Copyright © 2011 CA. All rights reserved. All trademarks, trade names, service marks and logos referenced herein belong to their respective companies.
CA Service Catalog Release 12.7 Submit/Approval Load Test Results
PAGE 10 OF 20
Percentile Chart
Percentile chart shows the transaction times sorted in an ascending order. The X-axis shows
the percentiles and y-axis shows response time for transactions in seconds for respective
percentile. An intersection of percentile and response time conveys the response time taken
for that percentile of users.
Test 1
Requestor
Approver
Test 2
Requestor
Approver

Copyright © 2011 CA. All rights reserved. All trademarks, trade names, service marks and logos referenced herein belong to their respective companies.
CA Service Catalog Release 12.7 Submit/Approval Load Test Results
PAGE 11 OF 20
Test 3
Requestor
Approver
Copyright © 2011 CA. All rights reserved. All trademarks, trade names, service marks and logos referenced herein belong to their respective companies.
CA Service Catalog Release 12.7 Submit/Approval Load Test Results
PAGE 12 OF 20
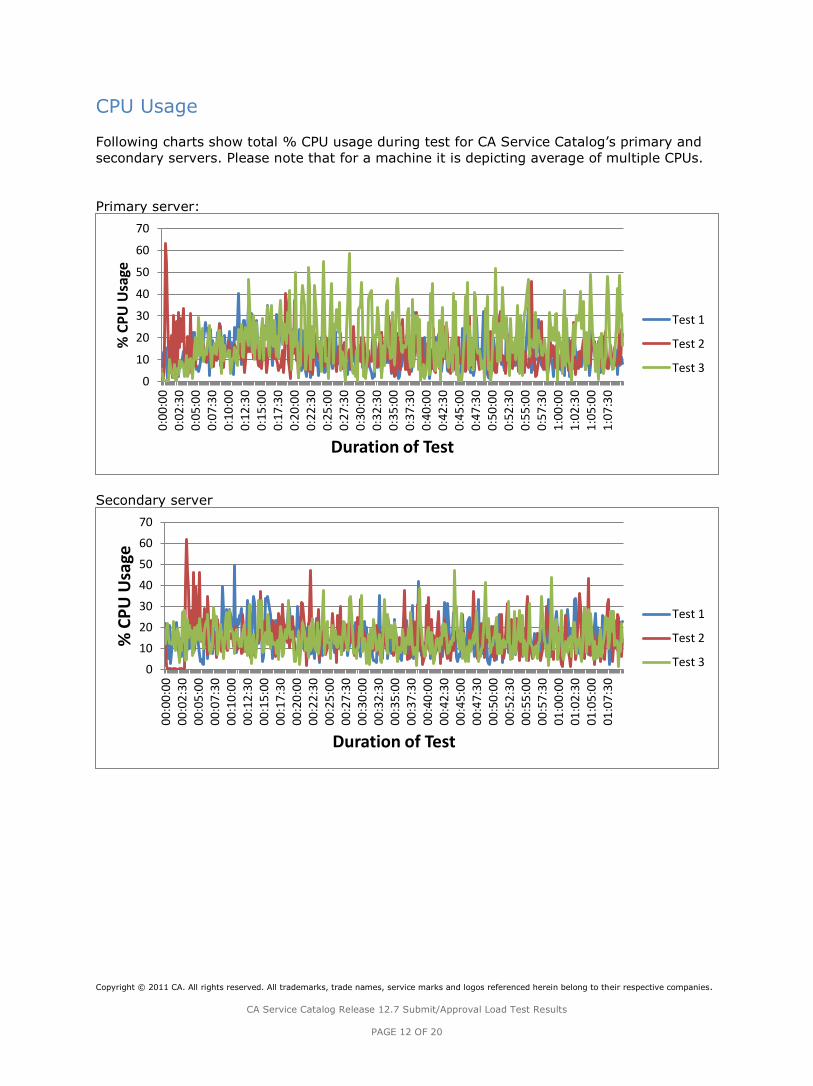
CPU Usage
Following charts show total % CPU usage during test for CA Service Catalog’s primary and
secondary servers. Please note that for a machine it is depicting average of multiple CPUs.
Primary server:
Secondary server
0
10
20
30
40
50
60
70
0:0
0:0
00
:02
:30
0:0
5:0
00
:07
:30
0:1
0:0
00
:12
:30
0:1
5:0
00
:17
:30
0:2
0:0
00
:22
:30
0:2
5:0
00
:27
:30
0:3
0:0
00
:32
:30
0:3
5:0
00
:37
:30
0:4
0:0
00
:42
:30
0:4
5:0
00
:47
:30
0:5
0:0
00
:52
:30
0:5
5:0
00
:57
:30
1:0
0:0
01
:02
:30
1:0
5:0
01
:07
:30
% C
PU
Usa
ge
Duration of Test
Test 1
Test 2
Test 3
0
10
20
30
40
50
60
70
00
:00
:00
00
:02
:30
00
:05
:00
00
:07
:30
00
:10
:00
00
:12
:30
00
:15
:00
00
:17
:30
00
:20
:00
00
:22
:30
00
:25
:00
00
:27
:30
00
:30
:00
00
:32
:30
00
:35
:00
00
:37
:30
00
:40
:00
00
:42
:30
00
:45
:00
00
:47
:30
00
:50
:00
00
:52
:30
00
:55
:00
00
:57
:30
01
:00
:00
01
:02
:30
01
:05
:00
01
:07
:30
% C
PU
Usa
ge
Duration of Test
Test 1
Test 2
Test 3
Copyright © 2011 CA. All rights reserved. All trademarks, trade names, service marks and logos referenced herein belong to their respective companies.
CA Service Catalog Release 12.7 Submit/Approval Load Test Results
PAGE 13 OF 20
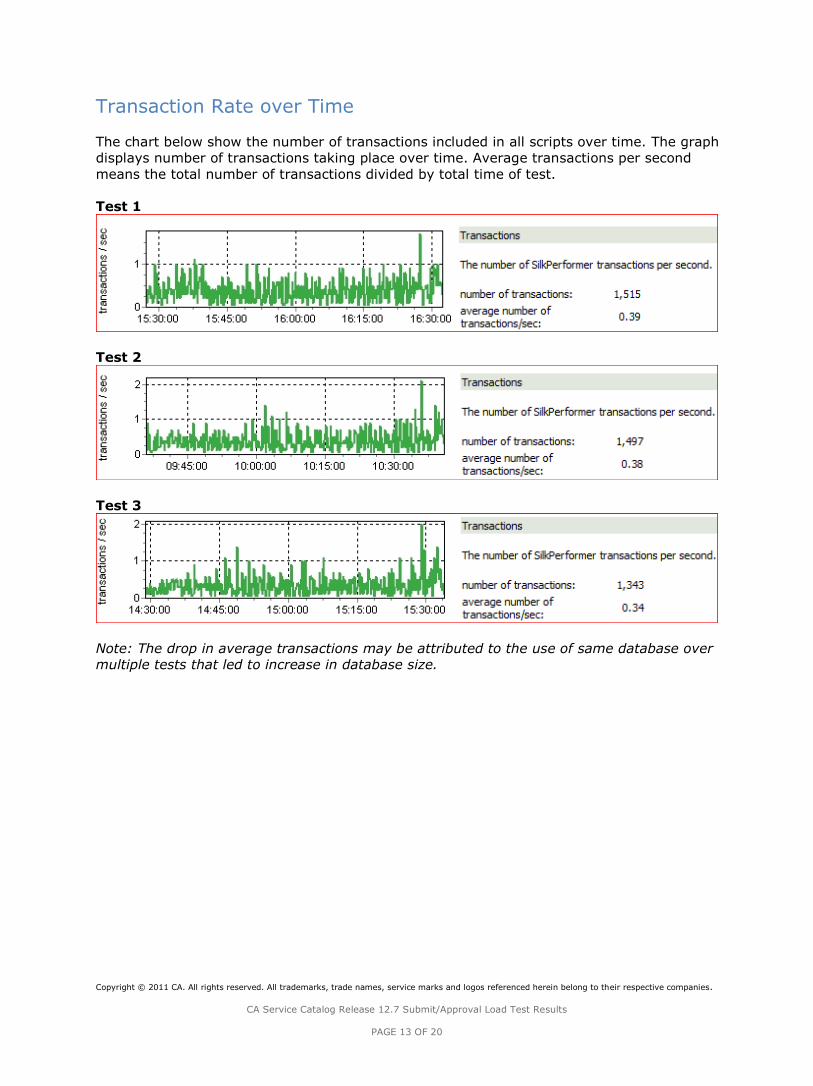
Transaction Rate over Time
The chart below show the number of transactions included in all scripts over time. The graph
displays number of transactions taking place over time. Average transactions per second
means the total number of transactions divided by total time of test.
Test 1
Test 2
Test 3
Note: The drop in average transactions may be attributed to the use of same database over
multiple tests that led to increase in database size.

Copyright © 2011 CA. All rights reserved. All trademarks, trade names, service marks and logos referenced herein belong to their respective companies.
CA Service Catalog Release 12.7 Submit/Approval Load Test Results
PAGE 14 OF 20
Throughput Rate
The charts below show the throughput from all scripts over time for the test. The high
values of the throughput* are indicators that application is scalable to handle large volume
of data transactions.
During load testing of CA Service Catalog r12.7 average throughput* was recorded as
640.20 KB/sec as compared to average throughput of 119.64 KB/sec during previous load
test conducted for CA Service Catalog r12.5.
Note:
* Throughput and Average Throughput for a performance test, is a measures for
total data transferred between Server and SilkPerformer agent(s). The amount of
data sent to and received from the server; this includes header and body content
information, all TCP/IP-related traffic (HTTP, native TCP/IP, IIOP, POP3, SMTP, FTP,
LDAP and WAP), and secure traffic over SSL/TLS. This measurement does not include
data overhead caused by SSL/TLS encryption and WTLS encryption in case of WAP.
Note: The drop in average transactions may be attributed to the use of same
database over multiple tests that led to increase in database size.
10
20
30
Test 1 Test 2 Test 3
Kilo
Byt
es[
kB]
x 1
00
00
0
Throughput
Throughput[kB]
0
400
800
Test 1 Test 2 Test 3
[kB
]/se
c
Average Throughput
AverageThroughput[kB]/sec

Copyright © 2011 CA. All rights reserved. All trademarks, trade names, service marks and logos referenced herein belong to their respective companies.
CA Service Catalog Release 12.7 Submit/Approval Load Test Results
PAGE 15 OF 20
Response Times
Timers record the response time from the users’ perspective. SilkPerformer separates timers
into Page Timers and Custom Timers. Page Timers are default counters used by
SilkPerformer for each page whereas custom times are set while recording script based on
important user actions. The Page Timer charts also indicate the server busy time vs. the
page and document download time (network transmission time); a histogram of this data
showing what portion of the total response time was due to server busy and network
transmission time is included. This detailed data is not available for Custom Timers.
The charts below show Page Timer response times included in all scripts over time. In these
graphs minimum, average and maximum page response times are indicated across 3 load
tests. Due to obvious reasons for maximum category page load time is high however that
may be experienced by only few transactions. For data analysis perspective average page
timers can be used along-with standard deviation.
Page Timers
Average Page Timers split into (Document download and server busy)
0
20
40
60
80
minimum[s] average[s] maximum[s] standard deviation[s]
Seco
nd
s Test 1
Test 2
Test 3
0
2
4
6
8
average page time[s]: average documentdownloading time[s]:
average server busy time[s]:
Seco
nd
s
Test 1
Test 2
Test 3

Copyright © 2011 CA. All rights reserved. All trademarks, trade names, service marks and logos referenced herein belong to their respective companies.
CA Service Catalog Release 12.7 Submit/Approval Load Test Results
PAGE 16 OF 20
PAGE TIMER OVERALL RESPONSE TIMES PER SCRIPT
The page timer measurements contain measurements related to web pages that are
downloaded by a virtual user:
Test 1
Requestor
Approver
Test 2
Requestor
Approver
Test 3
Requestor
Approver

Copyright © 2011 CA. All rights reserved. All trademarks, trade names, service marks and logos referenced herein belong to their respective companies.
CA Service Catalog Release 12.7 Submit/Approval Load Test Results
PAGE 17 OF 20
Custom Response Times
The charts below show average response times for custom timers used for various user
actions in performance test scripts. This is average time taken for a virtual user to perform
specified action:
Custom timers are used for these scripts with user interaction steps and following is list of
same: Requestor
Load Login Page
Login
SelectSecurityAccess (Select Service)
Select ID Badges
ClickAddToCartAndCheckOut
ClickSaveAndSubmitCart
Logout
Approver
Load Login Page
Login
MyReqPending (My Pending Requests)
ClickApproveRequest
ClickSave
Logout
Refresher
Load Login Page
Login
View User Profile
ClickDone
Logout
Requestor Script
05
101520253035
Seco
nd
s
Test 1
Test 2
Test 3

Copyright © 2011 CA. All rights reserved. All trademarks, trade names, service marks and logos referenced herein belong to their respective companies.
CA Service Catalog Release 12.7 Submit/Approval Load Test Results
PAGE 18 OF 20
Approver Script
Refresher Script
05
101520253035
Seco
nd
s
Test 1
Test 2
Test 3
0
5
10
15
Seco
nd
s
Test 1
Test 2
Test 3

Copyright © 2011 CA. All rights reserved. All trademarks, trade names, service marks and logos referenced herein belong to their respective companies.
CA Service Catalog Release 12.7 Submit/Approval Load Test Results
PAGE 19 OF 20
Transaction Completion Time
The chart below shows overall average transaction completion time for each script for each
of the three tests. Average transaction time indicates the average time for all the steps in
the script to be completed and reflects on the complexity of the script. The Submit Request
and Approve Request scripts show higher transaction completion times because they are
more complex.
Note: Trans. (busy) ok[s] is the measurement without think time. Think time is time for
which virtual users waits before processing next transaction.
AVERAGE TRANSACTION COMPLETION TIME FOR EACH SCRIPT BY TEST
Requestor Script
Test 1 Test 2 Test 3
Name Avg Min Max Avg Min Max Avg Min Max
Trans. ok[s]
99.618 22.156 162.188 111.66 29.156 157.156 111.673 24.344 166.734
Trans.(busy) ok[s]
85.614 8.156 148.172 97.656 15.156 143.156 97.657 10.328 152.734
Approver Script
Test 1 Test 1 Test 1
Name Avg Min Max Avg Min Max Avg Min Max
Trans. ok[s] 84.909 8.578 170.110 94.278 8.828 171.297 80.186 8.735 168.781
Trans. failed[s] 105.844 100.609 111.079 107.672 97.219 121.172 N/A N/A N/A
Trans.(busy) ok[s] 73.555 0.578 158.110 83.057 0.859 159.297 69.317 0.766 156.766
Trans.(busy) failed[s]
93.844 88.609 99.079 95.672 85.219 109.172 N/A N/A N/A
Refresher Script
Test 1 Test 2 Test 3
Name Avg Min Max Avg Min Max Avg Min Max
Trans. ok[s] 22.553 1.500 34.812 24.575 3.188 34.985 26.261 3.063 42.515
Trans.(busy) ok[s]
22.553 1.500 34.812 24.575 3.188 34.985 26.261 3.063 42.515
Note: Please note that aforementioned load test results are captured using SilkPerformer
and results may vary slightly with other load test tools.

Copyright © 2011 CA. All rights reserved. All trademarks, trade names, service marks and logos referenced herein belong to their respective companies.
CA Service Catalog Release 12.7 Submit/Approval Load Test Results
PAGE 20 OF 20
Conclusion
Load testing of CA Service Catalog Release 12.7 was successfully conducted covering 3
scenarios (requester, approval and refresher) at 100VU load at a test environment primed
with a predefined record volume. During these load tests average transaction success rate
of 99.87% and average throughput was recorded as 640.20 KB/sec.
Average throughput of this release is observed better than earlier release, CA Service
Catalog Release 12.5, which was measured as 119.64 KB/sec. It should also be noted that
load test environment used for earlier release was a non-clustered & physical environment.
Please note that these results are based on virtualized test environment and they are
expected to be better with physical environment.
These load tests results provide reliable supporting facts that CA Service Catalog Release
12.7 can be used for providing the enterprise with a self-service request capability that
meets the high standards of reliability, availability and throughput that large enterprises
require.