Embed Size (px)
Citation preview
© POTEN & PARTNERS 2008 CONFIDENTIAL
LNG Supply and Demand Outlook: With special focus on Southeast Asia 3rd LNG Supply, Storage & Transportation Philippines Forum 2016 13-14 October, 2016
Sophie Tan Business Intelligence Poten & Partners
MONTH 2009
© POTEN & PARTNERS 2009 CONFIDENTIAL
© POTEN & PARTNERS September 2016 Page 2
LNG/Natural Gas LPG Tankers
Other Hydrocarbons Capital Services
Houston
New York London
Guangzhou
Singapore
Perth
Athens
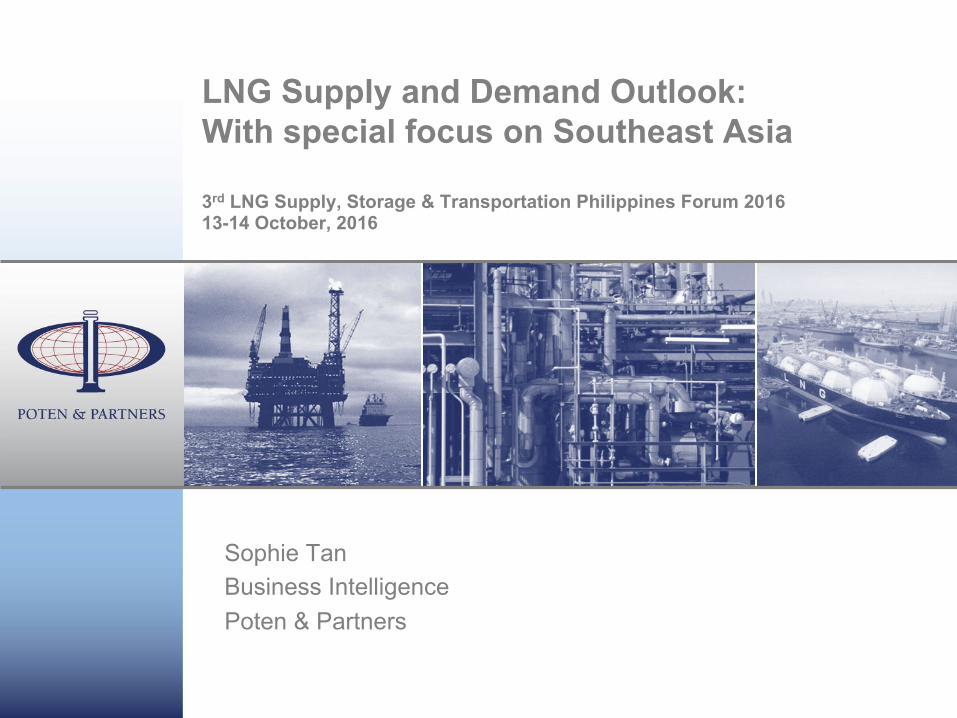
• Poten & Partners is a leader in the energy business with 60+ years of experience. • The largest LNG advisory team in the world covering the full natural gas & LNG value
chain: upstream, LNG plants, technical, marine, markets and commercial issues • Insightful market and industry business intelligence, forecasts and data
Poten & Partners: A global leader in LNG business services
Provides storage and reload services Provides storage and reload services
MONTH 2009
© POTEN & PARTNERS 2009 CONFIDENTIAL
© POTEN & PARTNERS September 2016 Page 3
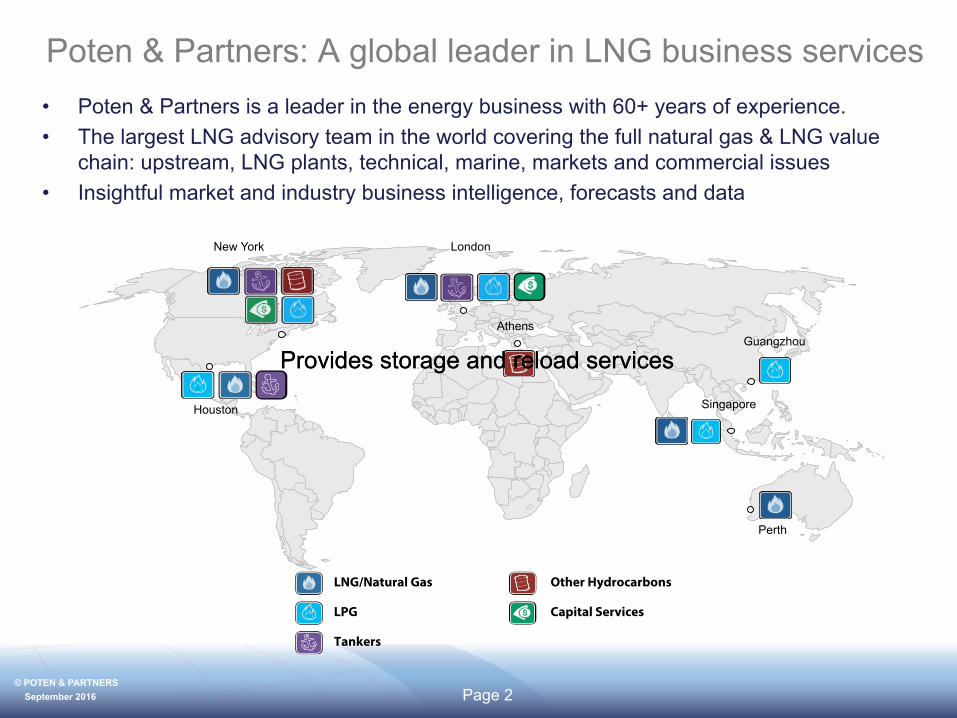
Poten Business Intelligence Services
LNG in World Markets
• The most trusted and reliable sources on the global LNG industry and markets.
• Exclusive information and insightful analysis of developments affecting major projects, markets and contracts.
• Innovative point of view on industry and market evolution.
LNG Finance in World Markets
• The only source of focused, reliable information on LNG finance.
• Unique information on project finance, multilateral and bank lending and LNG shipping finance.
• Annual rankings of project finance lender, export credit agencies and shipping finance.
Global LNG Outlook
• Detailed global supply and demand forecasts going out 10 years.
• Specialized sections on shipping, project developments and EPC.
LNGas Database
• Proprietary database with exclusive information on trade, import and export projects and contracts.
• Exclusive cost-of-service tool allows detailed comparisons of competitiveness of different LNG projects
MONTH 2009
© POTEN & PARTNERS 2009 CONFIDENTIAL
© POTEN & PARTNERS September 2016 Page 4
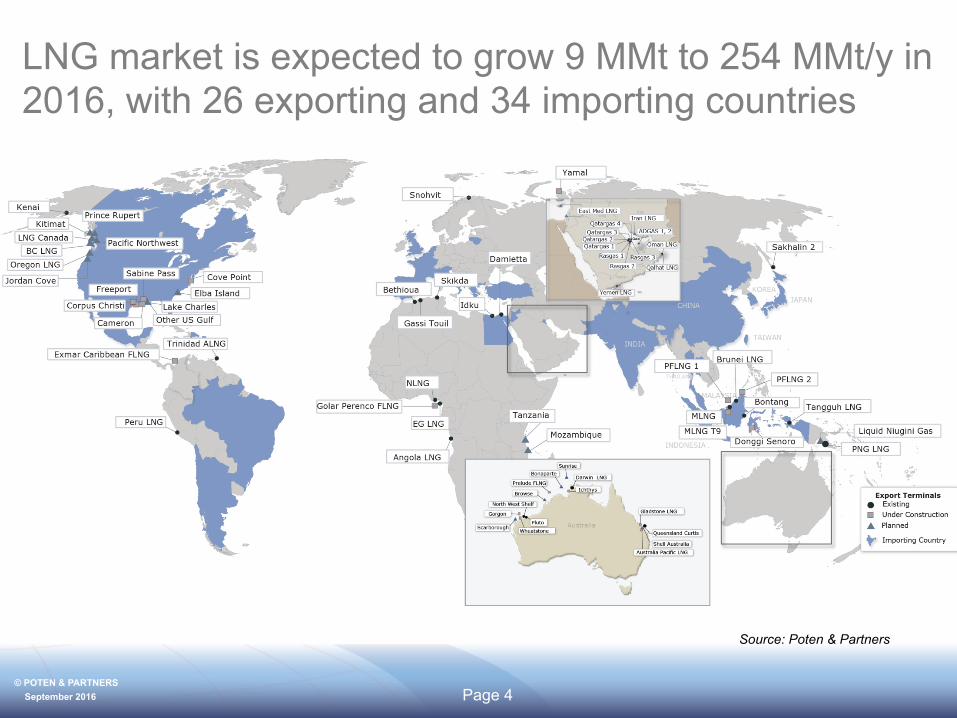
LNG market is expected to grow 9 MMt to 254 MMt/y in 2016, with 26 exporting and 34 importing countries
Source: Poten & Partners
MONTH 2009
© POTEN & PARTNERS 2009 CONFIDENTIAL
© POTEN & PARTNERS September 2016 Page 5
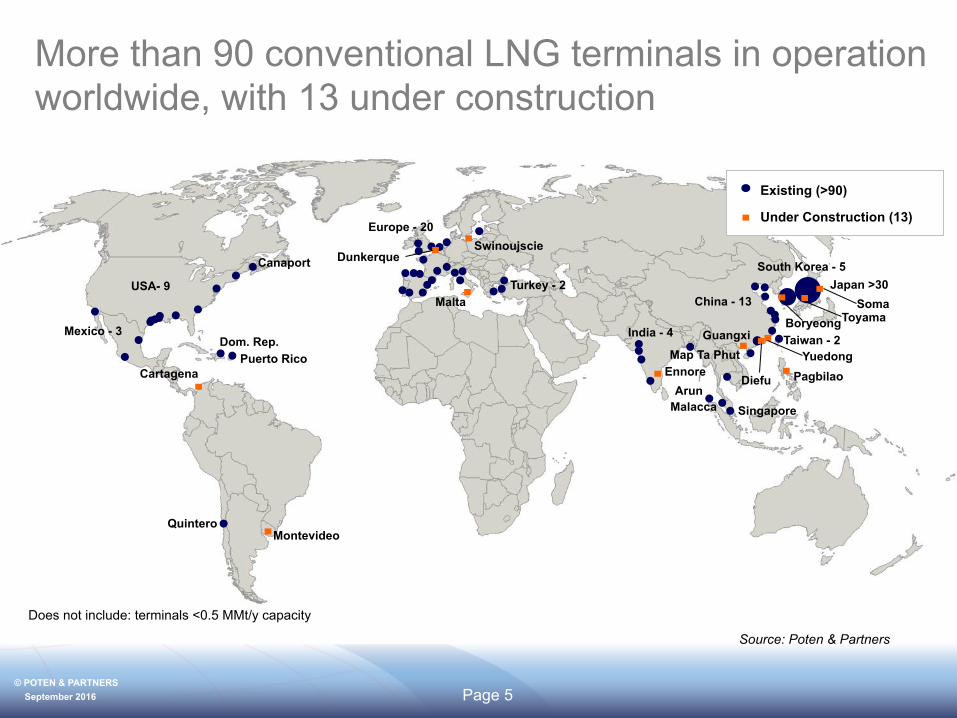
More than 90 conventional LNG terminals in operation worldwide, with 13 under construction
Japan >30 South Korea - 5
Singapore Arun
China - 13
Taiwan - 2
Diefu
Guangxi
Yuedong Map Ta Phut
India - 4
Puerto Rico Dom. Rep.
Mexico - 3
Canaport
USA- 9
Dunkerque Swinoujscie
Does not include: terminals <0.5 MMt/y capacity
Europe - 20
Turkey - 2
Quintero
Ennore
Soma
Pagbilao
Boryeong
Source: Poten & Partners
Cartagena
Montevideo
Malta
Malacca
Existing (>90)
Under Construction (13)
Toyama
MONTH 2009
© POTEN & PARTNERS 2009 CONFIDENTIAL
© POTEN & PARTNERS September 2016 Page 6
0
50
100
150
200
250
300
350
400
450
2005 2010 2015 2020 2025
MMt/y
Americas
Europe
N icheMarkets(Asia&MiddleEast)
C hina&India
J apan,Korea,andTaiwan
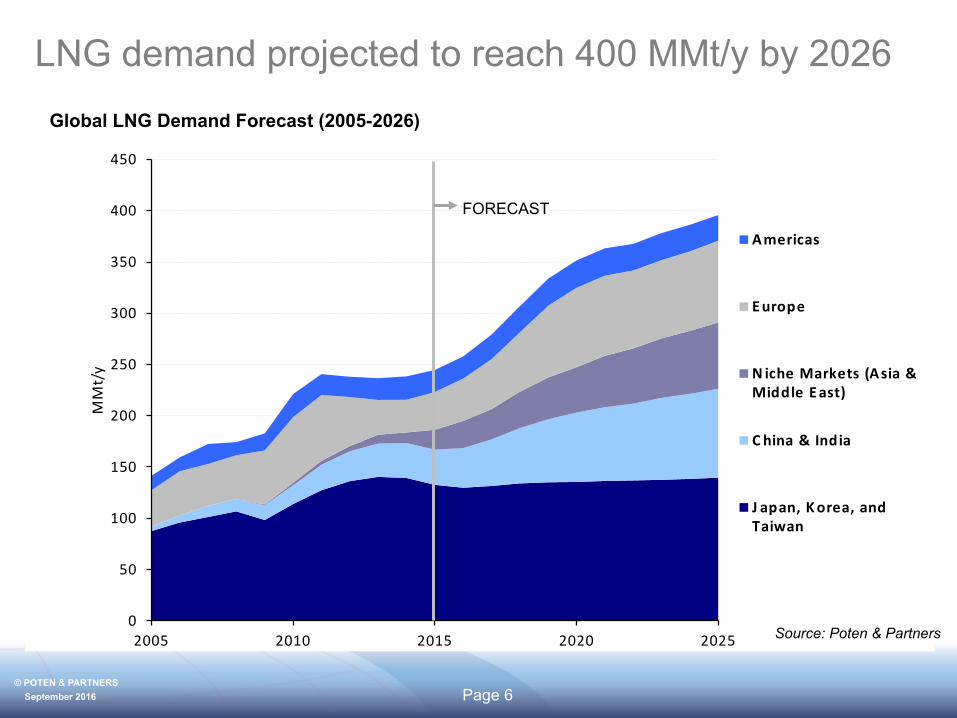
LNG demand projected to reach 400 MMt/y by 2026 Global LNG Demand Forecast (2005-2026)
FORECAST
Source: Poten & Partners
MONTH 2009
© POTEN & PARTNERS 2009 CONFIDENTIAL
© POTEN & PARTNERS September 2016 Page 7
0
50
100
150
200
250
300
350
400
450
2005 2010 2015 2020 2025
MMt/y
EastAfrica
NorthAmerica
Australia
WestA frica
Q atar
NorthA frica
Malaysia&Indonesia
O thers
TotalDemand
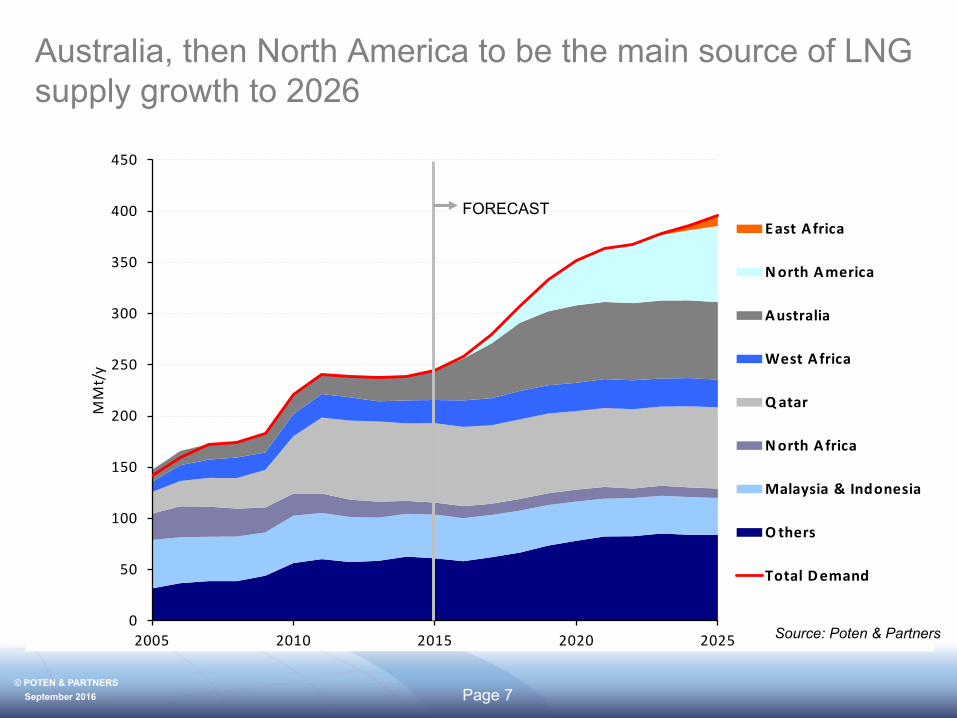
Australia, then North America to be the main source of LNG supply growth to 2026
Source: Poten & Partners
FORECAST
MONTH 2009
© POTEN & PARTNERS 2009 CONFIDENTIAL
© POTEN & PARTNERS September 2016 Page 8
100
150
200
250
300
350
400
450
End2015Demand Rampupofexistingproduction
Productionlossesfromexistingproduction
Productionunderconstruction
O pportunitiesfornewprojects
Marketin2025
MMt/y
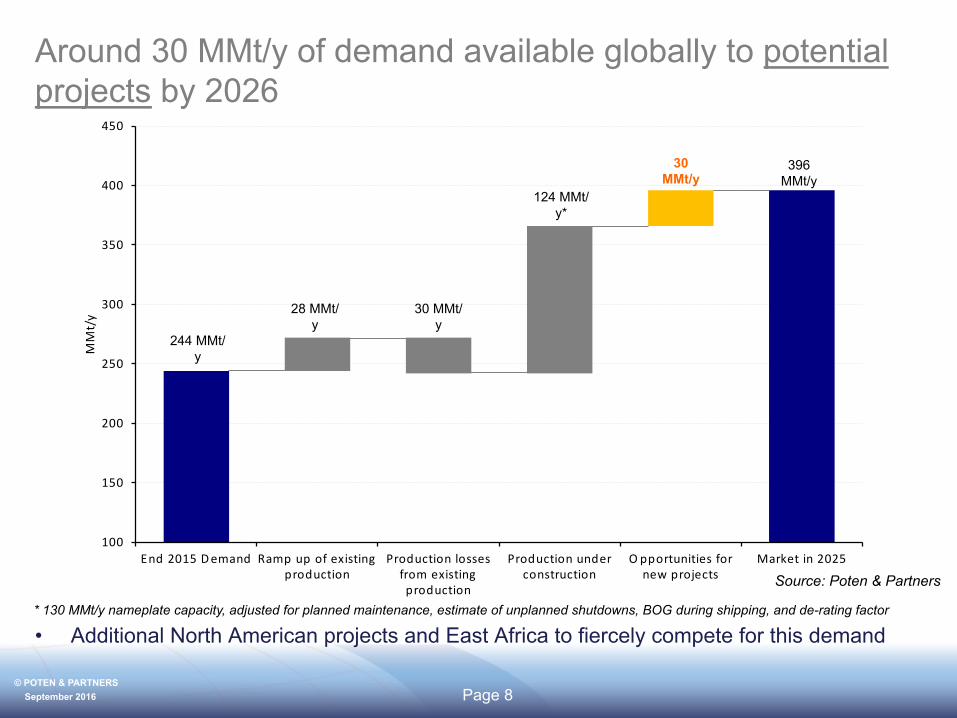
Around 30 MMt/y of demand available globally to potential projects by 2026
• Additional North American projects and East Africa to fiercely compete for this demand * 130 MMt/y nameplate capacity, adjusted for planned maintenance, estimate of unplanned shutdowns, BOG during shipping, and de-rating factor
244 MMt/y
28 MMt/y
124 MMt/y*
30 MMt/y
396 MMt/y
30 MMt/y
Source: Poten & Partners
MONTH 2009
© POTEN & PARTNERS 2009 CONFIDENTIAL
© POTEN & PARTNERS September 2016 Page 9
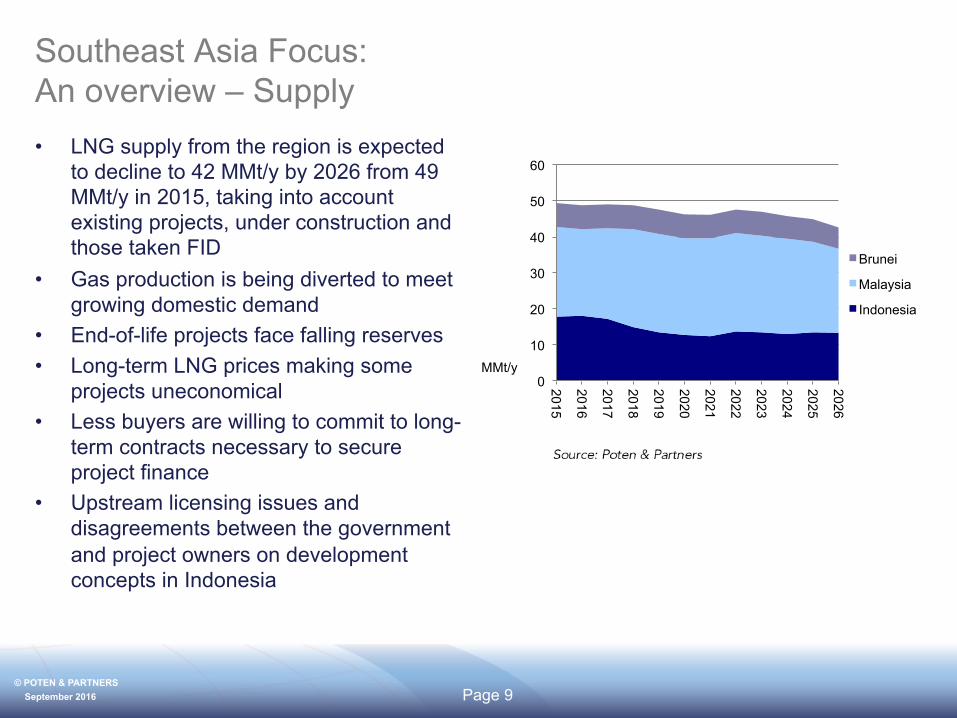
Southeast Asia Focus: An overview – Supply • LNG supply from the region is expected
to decline to 42 MMt/y by 2026 from 49 MMt/y in 2015, taking into account existing projects, under construction and those taken FID
• Gas production is being diverted to meet growing domestic demand
• End-of-life projects face falling reserves • Long-term LNG prices making some
projects uneconomical • Less buyers are willing to commit to long-
term contracts necessary to secure project finance
• Upstream licensing issues and disagreements between the government and project owners on development concepts in Indonesia
0
10
20
30
40
50
60
2015
2016
2017
2018
2019
2020
2021
2022
2023
2024
2025
2026
Brunei
Malaysia
Indonesia
MMt/y
MONTH 2009
© POTEN & PARTNERS 2009 CONFIDENTIAL
© POTEN & PARTNERS September 2016 Page 10
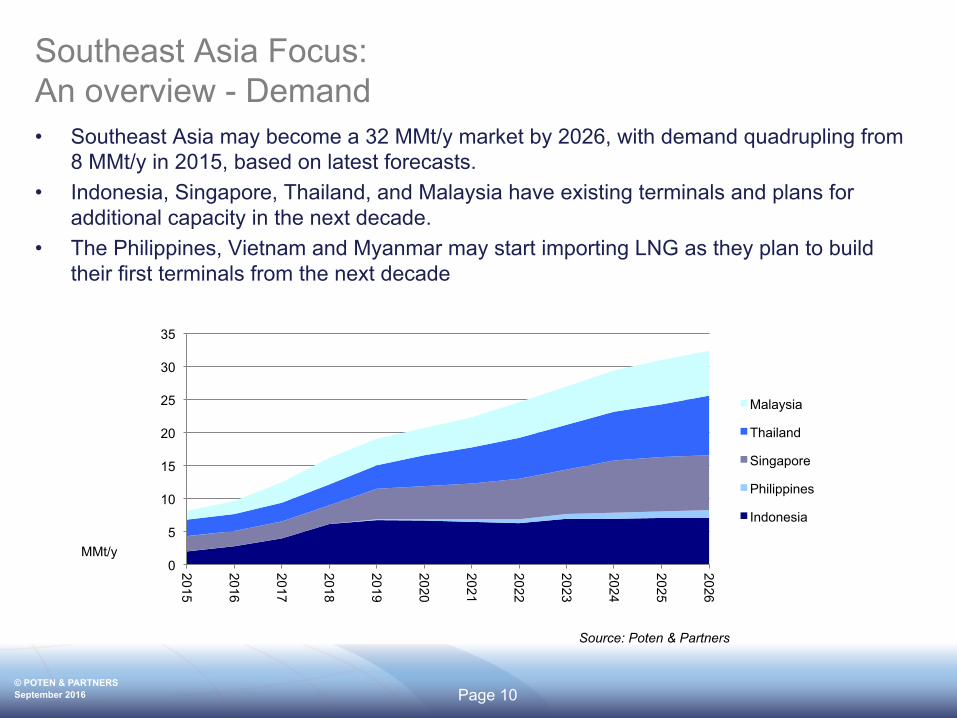
Southeast Asia Focus: An overview - Demand • Southeast Asia may become a 32 MMt/y market by 2026, with demand quadrupling from
8 MMt/y in 2015, based on latest forecasts. • Indonesia, Singapore, Thailand, and Malaysia have existing terminals and plans for
additional capacity in the next decade. • The Philippines, Vietnam and Myanmar may start importing LNG as they plan to build
their first terminals from the next decade
0
5
10
15
20
25
30
35
2015
2016
2017
2018
2019
2020
2021
2022
2023
2024
2025
2026
Malaysia
Thailand
Singapore
Philippines
Indonesia
MMt/y
Source: Poten & Partners
MONTH 2009
© POTEN & PARTNERS 2009 CONFIDENTIAL
© POTEN & PARTNERS September 2016 Page 11
Southeast Asia Focus: The Philippines
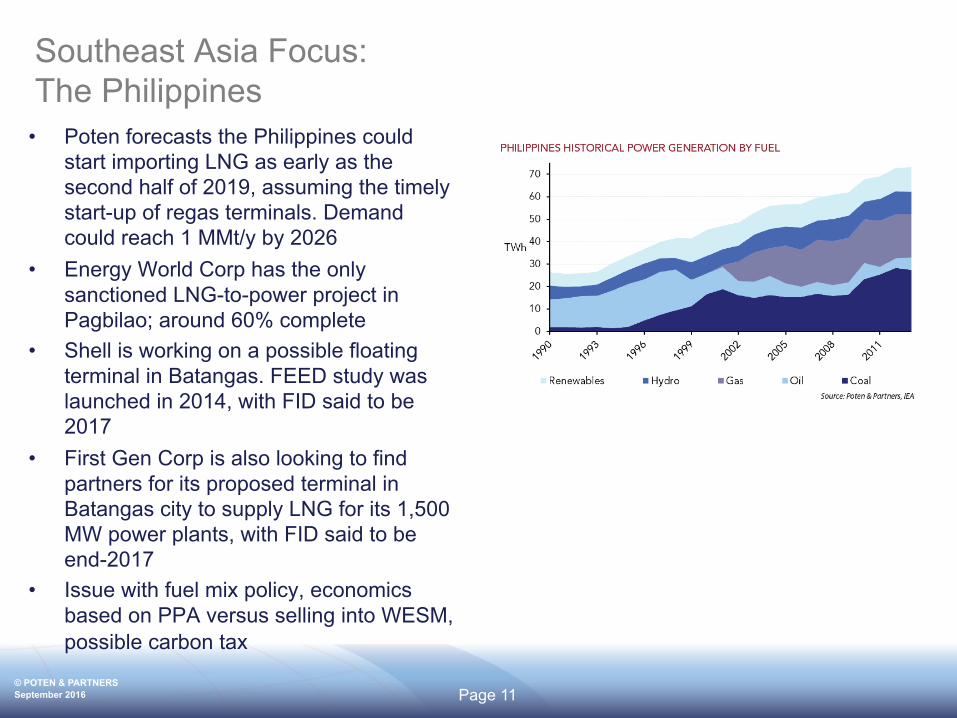
• Poten forecasts the Philippines could start importing LNG as early as the second half of 2019, assuming the timely start-up of regas terminals. Demand could reach 1 MMt/y by 2026
• Energy World Corp has the only sanctioned LNG-to-power project in Pagbilao; around 60% complete
• Shell is working on a possible floating terminal in Batangas. FEED study was launched in 2014, with FID said to be 2017
• First Gen Corp is also looking to find partners for its proposed terminal in Batangas city to supply LNG for its 1,500 MW power plants, with FID said to be end-2017
• Issue with fuel mix policy, economics based on PPA versus selling into WESM, possible carbon tax
MONTH 2009
© POTEN & PARTNERS 2009 CONFIDENTIAL
© POTEN & PARTNERS September 2016 Page 12
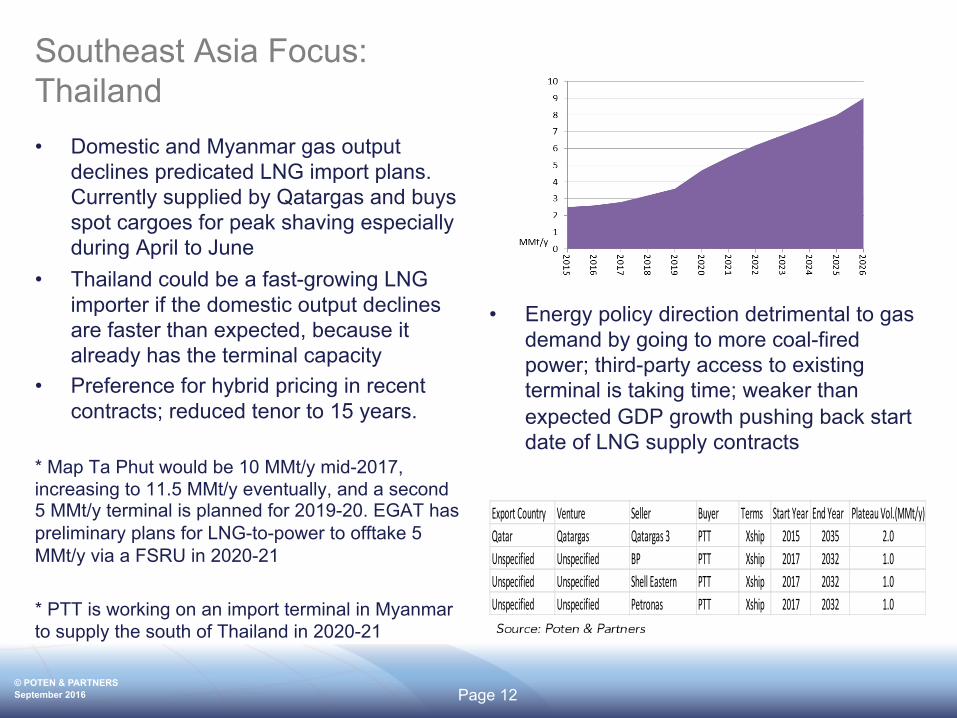
Southeast Asia Focus: Thailand • Domestic and Myanmar gas output
declines predicated LNG import plans. Currently supplied by Qatargas and buys spot cargoes for peak shaving especially during April to June
• Thailand could be a fast-growing LNG importer if the domestic output declines are faster than expected, because it already has the terminal capacity
• Preference for hybrid pricing in recent contracts; reduced tenor to 15 years.
* Map Ta Phut would be 10 MMt/y mid-2017, increasing to 11.5 MMt/y eventually, and a second 5 MMt/y terminal is planned for 2019-20. EGAT has preliminary plans for LNG-to-power to offtake 5 MMt/y via a FSRU in 2020-21 * PTT is working on an import terminal in Myanmar to supply the south of Thailand in 2020-21
• Energy policy direction detrimental to gas demand by going to more coal-fired power; third-party access to existing terminal is taking time; weaker than expected GDP growth pushing back start date of LNG supply contracts
ExportCountry Venture Seller Buyer Terms StartYear EndYear PlateauVol.(MMt/y)Qatar Qatargas Qatargas3 PTT Xship 2015 2035 2.0Unspecified Unspecified BP PTT Xship 2017 2032 1.0Unspecified Unspecified ShellEastern PTT Xship 2017 2032 1.0Unspecified Unspecified Petronas PTT Xship 2017 2032 1.0
MONTH 2009
© POTEN & PARTNERS 2009 CONFIDENTIAL
© POTEN & PARTNERS September 2016 Page 13
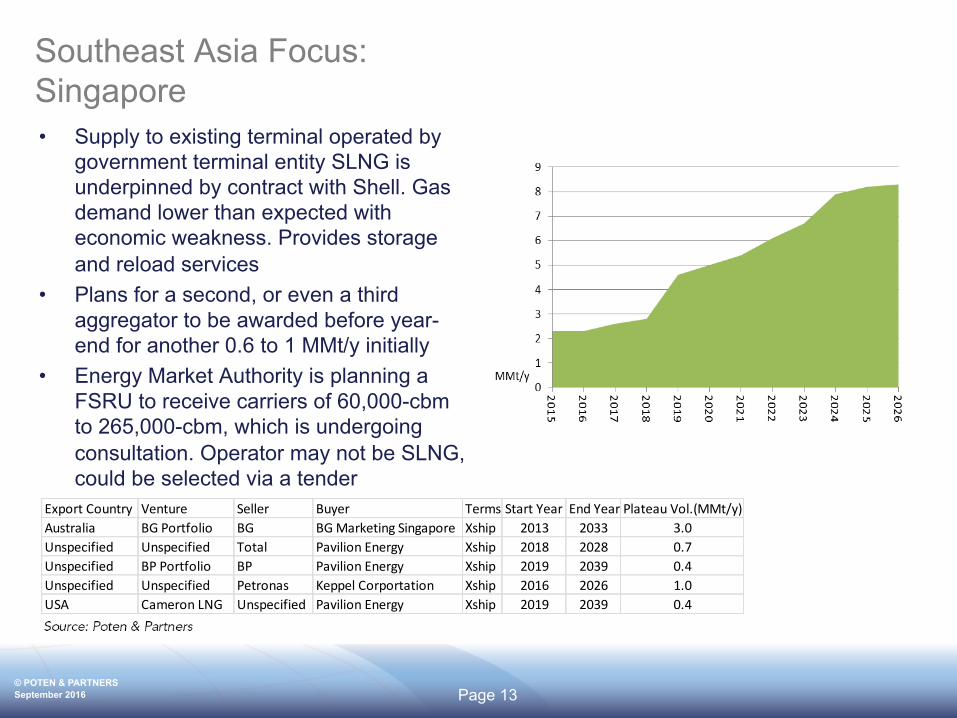
Southeast Asia Focus: Singapore • Supply to existing terminal operated by
government terminal entity SLNG is underpinned by contract with Shell. Gas demand lower than expected with economic weakness. Provides storage and reload services
• Plans for a second, or even a third aggregator to be awarded before year-end for another 0.6 to 1 MMt/y initially
• Energy Market Authority is planning a FSRU to receive carriers of 60,000-cbm to 265,000-cbm, which is undergoing consultation. Operator may not be SLNG, could be selected via a tender
ExportCountry Venture Seller Buyer Terms StartYear EndYear PlateauVol.(MMt/y)Australia BGPortfolio BG BGMarketingSingapore Xship 2013 2033 3.0Unspecified Unspecified Total PavilionEnergy Xship 2018 2028 0.7Unspecified BPPortfolio BP PavilionEnergy Xship 2019 2039 0.4Unspecified Unspecified Petronas KeppelCorportation Xship 2016 2026 1.0USA CameronLNG Unspecified PavilionEnergy Xship 2019 2039 0.4
MONTH 2009
© POTEN & PARTNERS 2009 CONFIDENTIAL
© POTEN & PARTNERS September 2016 Page 14
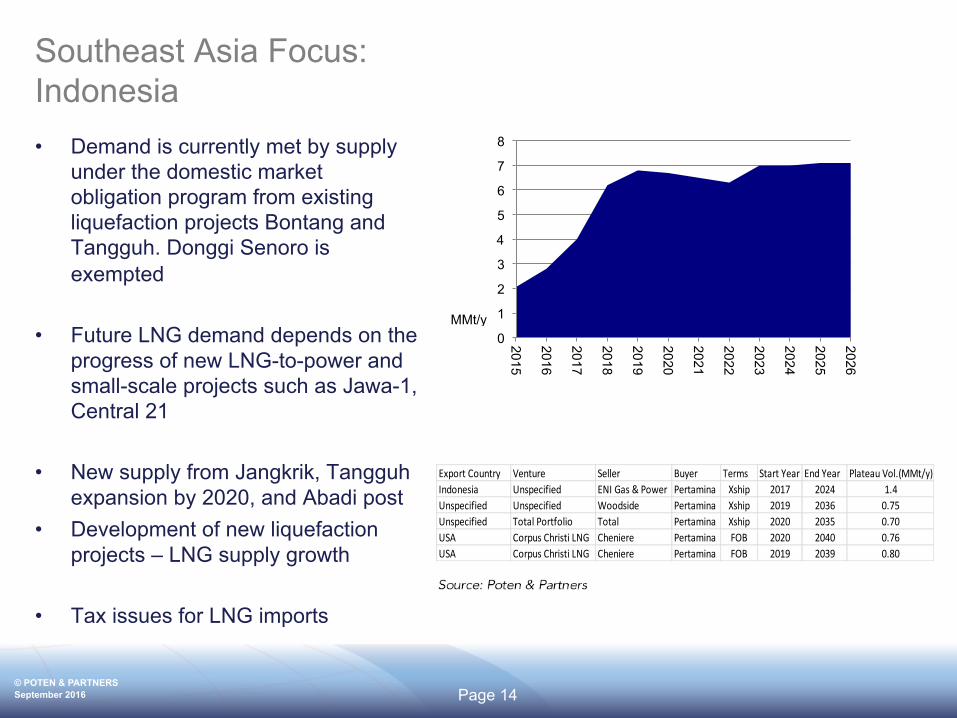
Southeast Asia Focus: Indonesia • Demand is currently met by supply
under the domestic market obligation program from existing liquefaction projects Bontang and Tangguh. Donggi Senoro is exempted
• Future LNG demand depends on the progress of new LNG-to-power and small-scale projects such as Jawa-1, Central 21
• New supply from Jangkrik, Tangguh expansion by 2020, and Abadi post
• Development of new liquefaction projects – LNG supply growth
• Tax issues for LNG imports
0
1
2
3
4
5
6
7
8
2015
2016
2017
2018
2019
2020
2021
2022
2023
2024
2025
2026
MMt/y
ExportCountry Venture Seller Buyer Terms StartYear EndYear PlateauVol.(MMt/y)Indonesia Unspecified ENIGas&Power Pertamina Xship 2017 2024 1.4Unspecified Unspecified Woodside Pertamina Xship 2019 2036 0.75Unspecified TotalPortfolio Total Pertamina Xship 2020 2035 0.70USA CorpusChristiLNG Cheniere Pertamina FOB 2020 2040 0.76USA CorpusChristiLNG Cheniere Pertamina FOB 2019 2039 0.80
MONTH 2009
© POTEN & PARTNERS 2009 CONFIDENTIAL
© POTEN & PARTNERS September 2016 Page 15
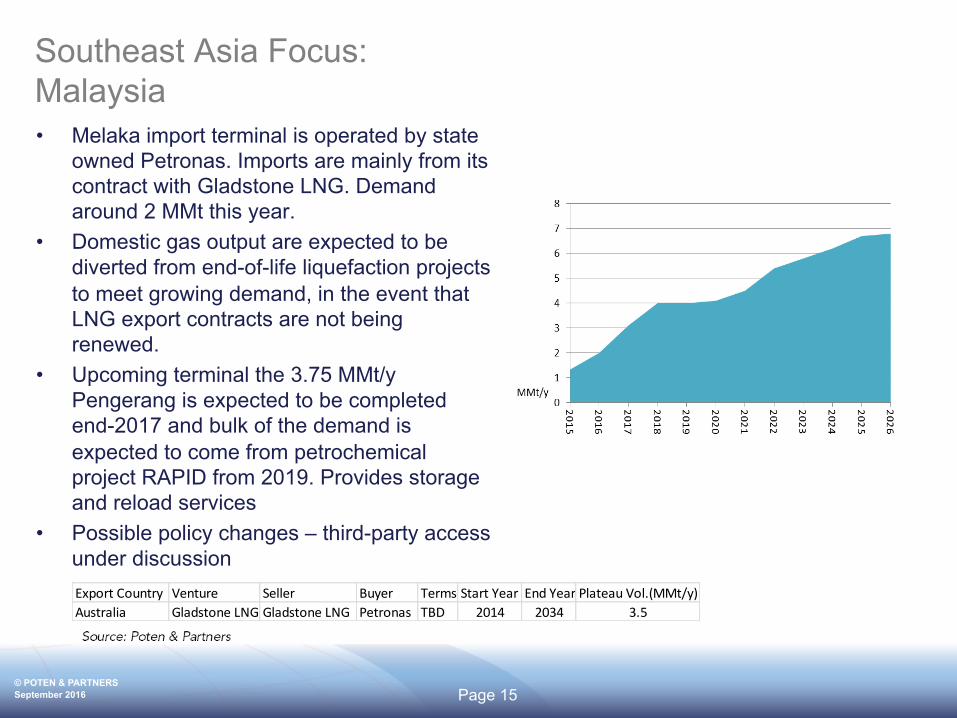
Southeast Asia Focus: Malaysia • Melaka import terminal is operated by state
owned Petronas. Imports are mainly from its contract with Gladstone LNG. Demand around 2 MMt this year.
• Domestic gas output are expected to be diverted from end-of-life liquefaction projects to meet growing demand, in the event that LNG export contracts are not being renewed.
• Upcoming terminal the 3.75 MMt/y Pengerang is expected to be completed end-2017 and bulk of the demand is expected to come from petrochemical project RAPID from 2019. Provides storage and reload services
• Possible policy changes – third-party access under discussion ExportCountry Venture Seller Buyer Terms StartYear EndYear PlateauVol.(MMt/y)Australia GladstoneLNG GladstoneLNG Petronas TBD 2014 2034 3.5
MONTH 2009
© POTEN & PARTNERS 2009 CONFIDENTIAL
© POTEN & PARTNERS September 2016 Page 16
How is market structure changing?
• Contract volumes and durations are falling • A transition between long-term contracts and a more fragmented market is taking place • There will be more contracts overall, but they will be smaller volumes and for shorter terms • Wave of contract expirations will accelerate this process
• Aggregators and others are buying long-term but selling shorter term • Adding to market liquidity (and fragmentation) • Using a wider variety of pricing mechanisms and more flexible terms
• More LNG trading taking place, more to come • Pure traders are taking a more active role • Some end users in Europe and Asia have overcommitted so they are reselling • Aggregators will also sell aggressively into spot markets
• Buyers are acting differently • Building supply portfolios that include spot, short-, medium- and long-term contracts • Seeking more flexibility in volumes, including seasonality • Many are looking at spot markets as a way to gain flexibility if suppliers won’t offer it
MONTH 2009
© POTEN & PARTNERS 2009 CONFIDENTIAL
© POTEN & PARTNERS September 2016 Page 17
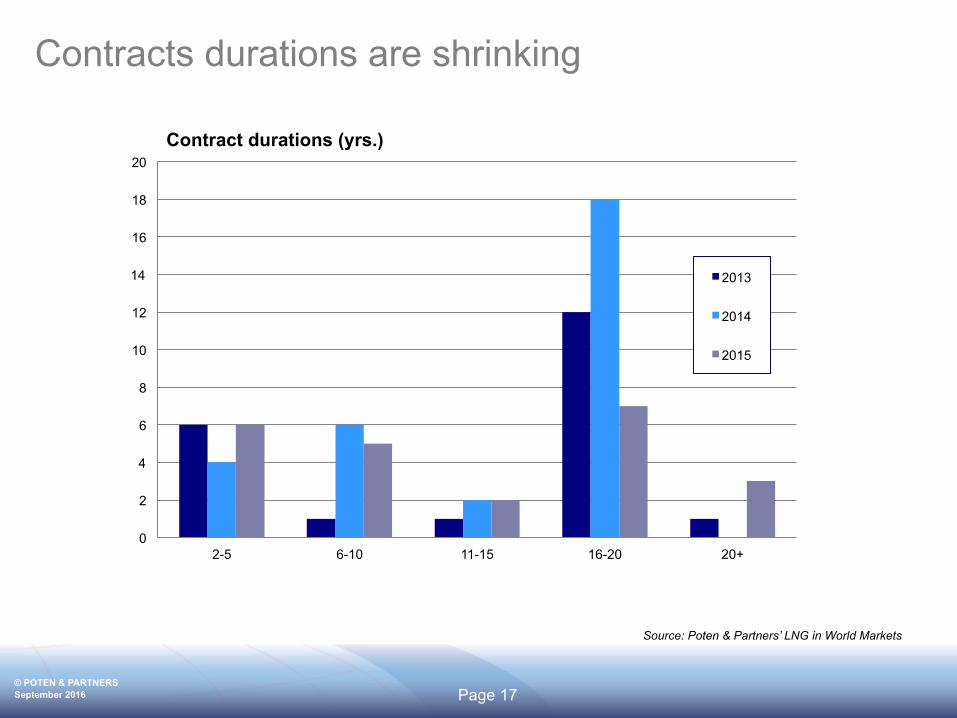
Contracts durations are shrinking
Source: Poten & Partners’ LNG in World Markets
0
2
4
6
8
10
12
14
16
18
20
2-5 6-10 11-15 16-20 20+
Contract durations (yrs.)
2013
2014
2015
MONTH 2009
© POTEN & PARTNERS 2009 CONFIDENTIAL
© POTEN & PARTNERS September 2016 Page 18
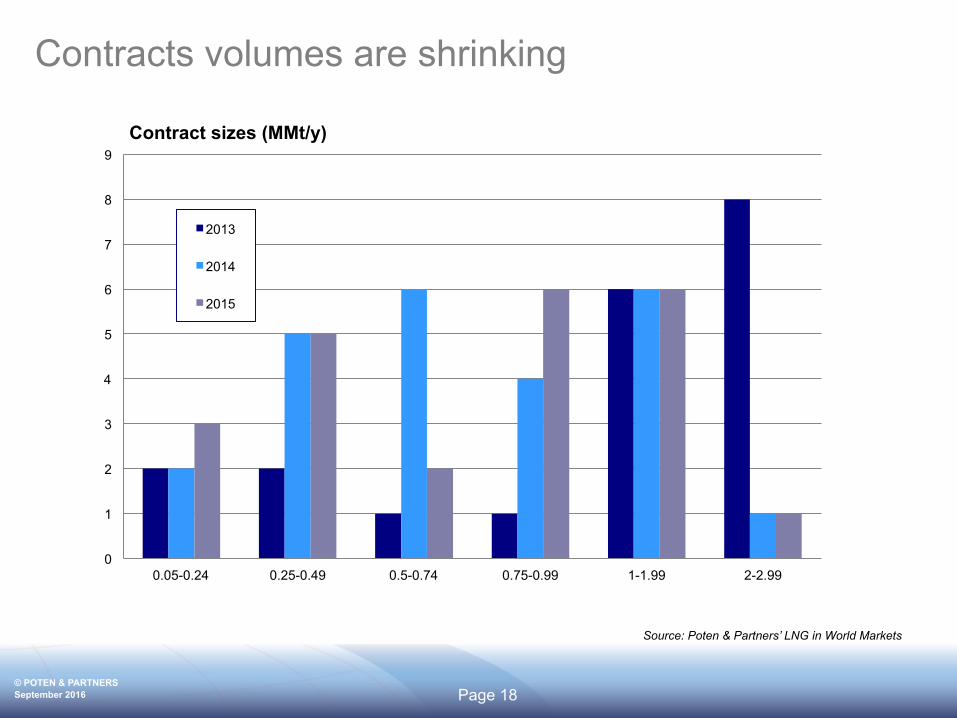
Contracts volumes are shrinking
Source: Poten & Partners’ LNG in World Markets
0
1
2
3
4
5
6
7
8
9
0.05-0.24 0.25-0.49 0.5-0.74 0.75-0.99 1-1.99 2-2.99
Contract sizes (MMt/y)
2013
2014
2015
MONTH 2009
© POTEN & PARTNERS 2009 CONFIDENTIAL
© POTEN & PARTNERS September 2016 Page 19
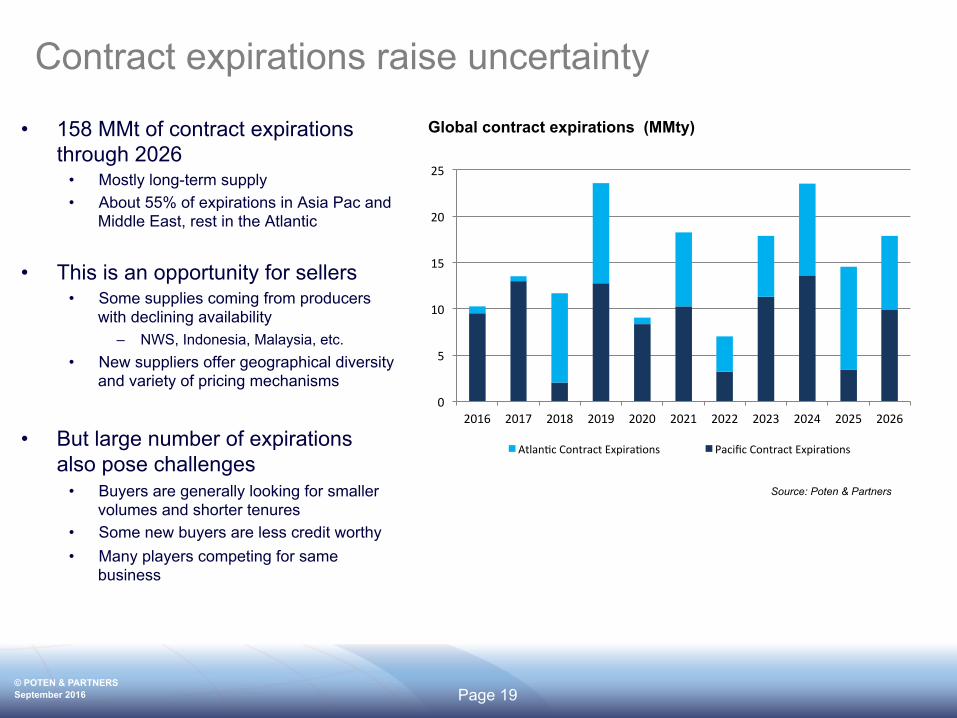
Contract expirations raise uncertainty
• 158 MMt of contract expirations through 2026
• Mostly long-term supply • About 55% of expirations in Asia Pac and
Middle East, rest in the Atlantic
• This is an opportunity for sellers • Some supplies coming from producers
with declining availability – NWS, Indonesia, Malaysia, etc.
• New suppliers offer geographical diversity and variety of pricing mechanisms
• But large number of expirations also pose challenges
• Buyers are generally looking for smaller volumes and shorter tenures
• Some new buyers are less credit worthy • Many players competing for same
business
Global contract expirations (MMty)
Source: Poten & Partners
0
5
10
15
20
25
2016 2017 2018 2019 2020 2021 2022 2023 2024 2025 2026
Atlan1cContractExpira1ons PacificContractExpira1ons
MONTH 2009
© POTEN & PARTNERS 2009 CONFIDENTIAL
© POTEN & PARTNERS September 2016 Page 20
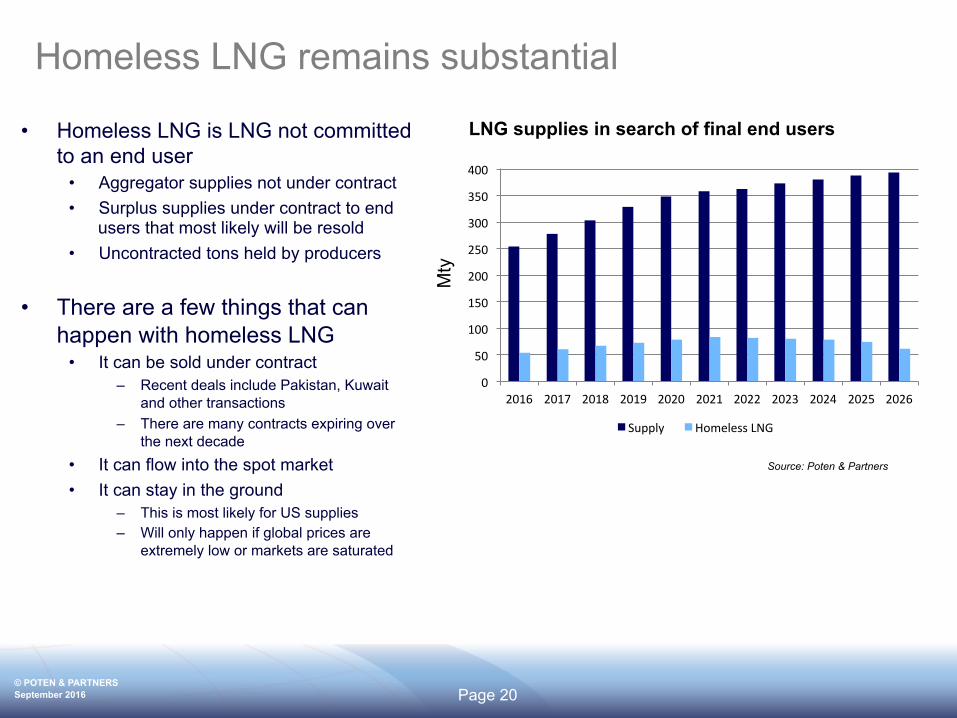
Homeless LNG remains substantial
LNG supplies in search of final end users
Source: Poten & Partners
• Homeless LNG is LNG not committed to an end user
• Aggregator supplies not under contract • Surplus supplies under contract to end
users that most likely will be resold • Uncontracted tons held by producers
• There are a few things that can happen with homeless LNG
• It can be sold under contract – Recent deals include Pakistan, Kuwait
and other transactions – There are many contracts expiring over
the next decade • It can flow into the spot market • It can stay in the ground
– This is most likely for US supplies – Will only happen if global prices are
extremely low or markets are saturated
Mty
0
50
100
150
200
250
300
350
400
2016 2017 2018 2019 2020 2021 2022 2023 2024 2025 2026
Supply HomelessLNG
MONTH 2009
© POTEN & PARTNERS 2009 CONFIDENTIAL
© POTEN & PARTNERS September 2016 Page 21
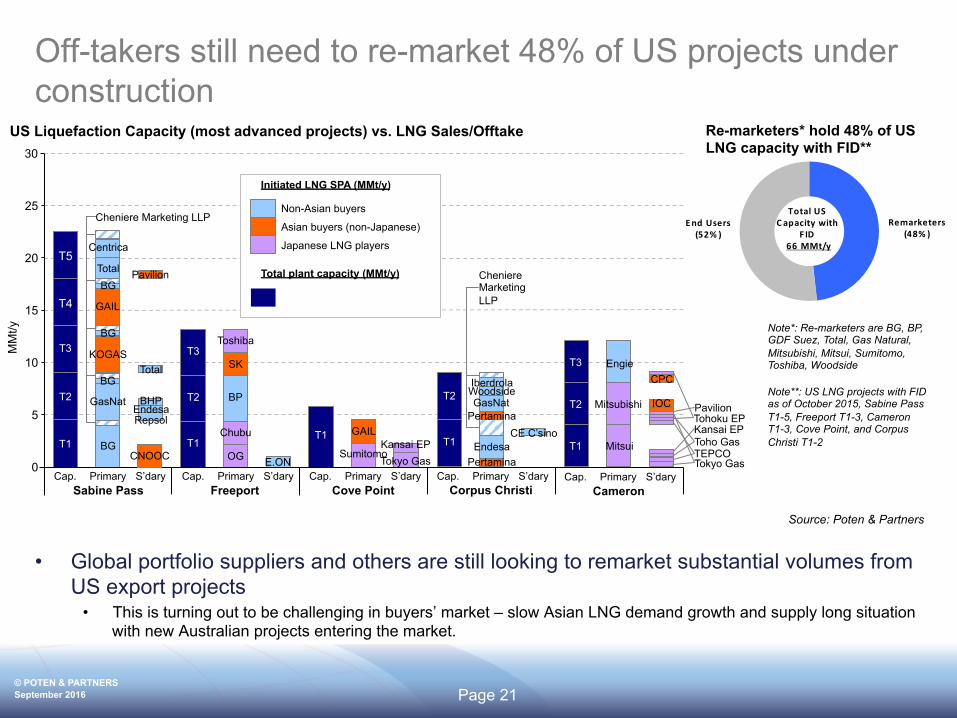
Off-takers still need to re-market 48% of US projects under construction
• Global portfolio suppliers and others are still looking to remarket substantial volumes from US export projects
• This is turning out to be challenging in buyers’ market – slow Asian LNG demand growth and supply long situation with new Australian projects entering the market.
US Liquefaction Capacity (most advanced projects) vs. LNG Sales/Offtake
T1 T1 T1
T2 T2
T3 T3
0
5
10
15
20
25
Sabine Pass Freeport Cove Point
MM
t/y
T4
T5
OG
Chubu
SK
Toshiba
Primary S’dary Cap.
GAIL
Sumitomo E.ON
Primary S’dary Cap. Primary S’dary Cap. Primary S’dary Cap.
Kansai EP Tokyo Gas
T1
T2
T3
Corpus Christi
Mitsui
Mitsubishi
Engie
T1
T2
T3
Cameron Primary S’dary Cap.
CPC
TEPCO Toho Gas Kansai EP Tohoku EP
BP
Asian buyers (non-Japanese)
Japanese LNG players
Non-Asian buyers
Initiated LNG SPA (MMt/y)
Total plant capacity (MMt/y)
30
Cheniere Marketing LLP
Endesa Pertamina
Pertamina GasNat
Woodside Iberdrola
GasNat
KOGAS
GAIL
Total
Centrica
BG
BG
BG
BG
Repsol
Total
Pavilion
Endesa BHP
Cheniere Marketing LLP
CE C’sino
IOC
Tokyo Gas CNOOC
Pavilion
Source: Poten & Partners
Re-marketers*hold48% ofUSLNG capacitywithF ID**
TotalUS C apacitywith
F ID66MMt/y
Remarketers(48% )
EndUsers(52% )
Re-marketers* hold 48% of US LNG capacity with FID**
Note*: Re-marketers are BG, BP, GDF Suez, Total, Gas Natural, Mitsubishi, Mitsui, Sumitomo, Toshiba, Woodside Note**: US LNG projects with FID as of October 2015, Sabine Pass T1-5, Freeport T1-3, Cameron T1-3, Cove Point, and Corpus Christi T1-2
MONTH 2009
© POTEN & PARTNERS 2009 CONFIDENTIAL
© POTEN & PARTNERS September 2016 Page 22
Conclusion: Change is coming to the market
• The decisions buyers and sellers make over the next 5+ years as they work through abundant supply is going to fundamentally change the LNG market
• Short- and medium-term business now commits the market to that model in the future • The long-term market is fragmenting
• Aggregators and majors with their own production will dominate the market
• This is not to say they will make money
• And there will be opportunities for pure traders
• Changes in the market require a new toolkit • Better pricing and risk management tools are needed
• The market changes may force a rethink of how we finance new projects • Aggregators allowed US projects to be financed. Will they the sign more 20-year SPAs if they take a bath over
the next few years?
• Better risk management tools may allow projects to be financed without the same emphasis on long-term SPAs
• It looks increasingly likely that over investment is leading to underinvestment in the future

MONTH 2009
© POTEN & PARTNERS 2009 CONFIDENTIAL
© POTEN & PARTNERS September 2016 Page 23
Business Intelligence and Consulting Contacts
Business Intelligence Contact: Jason Feer
Email: [email protected] Tel: +1 713 344 2367
US Sales Contact: Dana Greer
Email: [email protected] Tel: +713 263-3408
Consulting Contact: Graham Hartnell
Email: [email protected] Tel: +44 20 3747 4820
Europe & Asia Sales Contact: Steve Park
Email: [email protected] Tel: +44 20 3747 4849
Thank You