Embed Size (px)
Citation preview

P. Isokoski and J. Springare (Eds.): EuroHaptics 2012, Part I, LNCS 7282, pp. 613–624, 2012. © Springer-Verlag Berlin Heidelberg 2012
Electrostatic Modulated Friction as Tactile Feedback: Intensity Perception
Dinesh Wijekoon1, Marta E. Cecchinato2, Eve Hoggan1, and Jukka Linjama3
1 Helsinki Institute for Information Technology (HIIT) Department of Computer Science, University of Helsinki, Finland
[email protected] 2 Department of General Psychology, Università degli Studi di Padova, Italy
[email protected] 3 Senseg Ltd Helsinki, Finland
Abstract. We describe the preliminary results from an experiment investigating the perceived intensity of modulated friction created by electrostatic force, or electrovibration. A prototype experimental system was created to evaluate user perception of sinusoidal electrovibration stimuli on a flat surface emulating a touch screen interface. We introduce a fixed 6-point Effect Strength Subjective Index (ESSI) as a measure of generic sensation intensity, and compare it with an open magnitude scale. The results of the experiment indicate that there are significant correlations between intensity perception and signal amplitude, and the highest sensitivity was found at a frequency of 80 Hz. The subjective results show that the users perceived the electrovibration stimuli as pleasant and a use-ful means of feedback for touchscreens.
Keywords: electrovibration, tactile, intensity, perception.
1 Introduction
Touch provides a rich channel through which to communicate and has been the focus of much research [1] [2] [3] [4] [5]. There are several different sub-modalities within touch. Tactile feedback (commonly vibrotactile mechanical stimulation of the skin) is the best understood and most used in HCI. Electrovibration is part of the same sen-sory system but has been relatively underutilized in interactive systems due to the lack of available hardware. However, recent advancements in touchscreen electrovibration technology mean that mainstream usage is now becoming possible. Electrovibration is created using electrostatic friction between a surface and a user’s skin [5]. Passing an electrical charge into the insulated electrode creates a small attractive force when a user’s skin comes into contact with it. By modulating this attractive force a variety of sensations can be generated [6].
The properties of electrovibration are quite different to those of standard vibrotac-tile feedback. In order to use electrovibration feedback effectively in user interfaces, it is important to identify the available design parameters. Tacton and Haptic Icon

614 D. Wijekoon et al.
[7] [8] designers use parameters such as intensity, waveform, rhythm and spatial loca-tions, but the electrovibration domain has not been investigated with such an approach as yet. Given the importance of intensity as a parameter in vibrotactile and other hap-tic research [8], this paper investigates the perceived intensity levels of electrovibra-tion feedback and identifies the most distinguishable levels of intensity.
We report the results of a psychophysical experiment and subjective evaluation of electrovibration intensity with a focus on amplitude and frequency manipulations, and the effects of gender and handedness on perception. The results of this research will aid designers in the creation of electrovibration feedback for touchscreen interaction with perceptually discriminable intensity levels.
2 Related Work
2.1 The History of Electrovibration
In 1950, Mallinckrodt [9] identified that electric flow in brass light sockets generates a different feeling when a current is flowing. Later, through experiments conducted on this phenomenon, he observed that such sensations were created through induced electricity.
Electrocutaneous stimulation has also been studied as a psychophysical phenome-non. But in electrocutaneous stimulation, a real electric current is passed through the body as a nerve-stimulating agent. In Higashiyama’s work [6] they discuss the various combinations of electrode placements to create pleasant feedback (the authors defined the term “pleasant feedback” as a less painful or less uncomfortable feeling).
Following on from this, a micro fabricated electrostatic display was tested by Tang et al. [10]. An electrode array with different resolutions was created where each elec-trode could be controlled separately. The study showed that more than 7.6 mm distance is needed to feel each electrode separately. The same concept was used by Fukushima et al. in their “Palm Touch Panel” [11] [12]. The Panel stimulated the palm of a hand using electrodes with controlled electric shocks instead of electrovibration.
The main focus of electrovibration research is in the usage of haptic feedback for telepresentation interfaces [1] and for visually impaired people, with studies targeted towards finding the thresholds in sensation using different materials [13] [14].
2.2 Current Electrovibration Systems
Parallel to academic research of galvanic electrotactile stimulation, and dedicated isolated electrode arrays for electrovibration, Senseg1 started creating a commercially applicable system solution for utilizing electrovibration in 2007. With advancements in grounding arrangements, display material and structure, and stimulus signal charac-teristics, Senseg was able to bypass lot of the challenges mentioned by [1, 11, 14, 15]. The key emphasis has been in integrating electrovibration feedback with mobile
1 http://www.senseg.com

Electrostatic Modulated Friction as Tactile Feedback: Intensity Perception 615
devices using active surfaces called tixels, the tactile pixel [15]. The experiment reported here makes use of Senseg’s tixel.
In 2009, Disney Research announced “Tesla Touch”, which uses similar kind of mechanism to produce haptic feedback. The key difference is that Tesla Touch im-plemented on an experimental desktop-based multi-touch system while the Senseg implementation works on mobile and handheld devices. Bau et al. [5] have studied the noticeable differences in frequency and amplitude changes in different frequen-cies. 80Hz, 120Hz, 180Hz are reported to have more than 25% of Just Noticeable Difference (JND) and for 270Hz and 400Hz, the JND is less than 15%.
Amberg et al. [4] have presented a tactile input device called STIMTAC which works by changing the friction similar to Senseg and TeslaTouch. But the only differ-ence is that it reduces the friction by creating an air bearing between the finger and surface in addition to the friction. STIMTAC adopted the friction reduction technique from T-PaD designed by Winfield et al., and later introduced a larger area version of T-PaD (LATPaD) in 2010 [16] [17]. One of the main drawbacks of those systems is the lack of transparency; therefore it is not possible to integrate it into any current touchscreen displays. But in 2011 Levesque et al. [2] presented a group of frictional widgets using the same mechanism. There they used a transparent surface on top of a graphic display. Although the implementation focuses on reducing the friction, they concluded that programmable friction could increase the awareness of the system and improve the appreciation of an interface.
Although there are several existing implementations of electrovibration for touch-screen interaction, there have been very few studies into user perception of electrovi-bration stimuli. In studies with vibrotactile stimulation using Eccentric Vibration Mo-tors (ERM) and Linear Resonator Actuators (LRA), it has been shown that 250Hz is the optimum frequency where people feel the vibration with a very low level of dis-placement [18]. The research described here attempts to analyse electrovibration feedback in a similar manner to establish the optimum frequency and amplitude levels that can be used to design electrovibration feedback with different intensity levels for touchscreen interaction.
2.3 Electrovibration Intensity
The perceived intensity of electrovibration depends on many factors. The basic prin-ciple behind electrovibration is the attractive electric Coulomb force between the isolated electrode and the touching finger [9]. It can be conveniently expressed as Maxwell pressure:
ɛ (1)
Where ɛ is dielectric constant, E is electric field E = V/d, V = voltage difference be-tween electrode and conductive tissue in finger, d = effective distance between charges. Distance is comprised of the electrical insulator thickness, and (effective) finger skin thickness. The basic mechanism for electrovibration is thus quadratic with

616 D. Wijekoon et al.
respect to the stimulus voltage. One consequence of this quadratic behavior is that it doubles the frequency of sinusoidal drive signals.
When the attraction force is modulated with a stimulus signal, it vibrates the finger skin and can be felt as a normal vibration. For a finger sliding on the tixel surface, the normal vibration is coupled with the lateral force of kinetic friction between the skin and surface. The resulting modulation of friction force creates a large lateral vibration of the skin. The factors that affect the modulated friction include the friction coeffi-cient (nonlinear) and finger biomechanics, modulation signal shape, and the user’s potential grounding (effective voltage).
These factors are carefully taken into account in the experimental setup design. We used a plastic film that has relatively stable friction properties, and has an even thick-ness profile.
3 Experiment: Evaluating Perceived Intensity
The aim of this experiment was to investigate what levels of frequency and amplitude in electrovibration increase the perceived intensity of the stimuli. This was studied with a magnitude estimation approach, and using a given index scale, ESSI (outlined below). A qualitative survey was also performed to assess the participants’ overall perception of the stimuli.
3.1 Magnitude Estimation
Psychophysical scaling has a history as long as psychophysics. In 1850, Fechner came up with the concept of arithmetical representation of sensations [19]. Each psycho-physical scaling task can be categorized in to one of the following:
(a) Subjects rate the sensation in an ordinal scale; (b) Subjects adjust the stimuli to create equal sensory intervals; (c) Subjects assign a number to represent the magnitude of the sensation (Magni-
tude Estimation).
In 1988, Gescheider [19] pointed out that magnitude estimation is the most used scal-ing mechanism in psychophysical evaluations. According to this method, the user starts rating the sensation by giving an arbitrary value at the starting point of the test. But later the user builds up his/her own scale around the given previous ratings.
3.2 ESSI Rating Scale
Alongside the magnitude estimations, we propose a practical perception strength in-dex scale, Effect Strength Subjective Index (ESSI) for evaluating electrovibration perception. The design of the ESSI rating is based on previous studies with vibration alert perception, where a 4-value strength scale was used [20]. This numerical index makes use of Likert scales, which are widely applied in psychophysics, and in in acoustic and visual research [21].
Electrostatic Modulated Friction as Tactile Feedback: Intensity Perception 617
The ESSI scale is a 6-value discrete scale where 0 represents the non-perceived signals and 5 represents signals that are considered to be ‘too strong’. The value 3 was defined as “Medium” and it is considered to be the optimum value for stimuli.
3.3 Test Hardware
The test system uses a PC as the signal source, an audio amplifier and transformer, and the tixel test surface with conductive and insulating layers. The insulating layer was made from a screen protector film (iPad Screen protector with a thickness of 125 um). Around the test surface, a ground reference surface was arranged (electrostatic matt) that the user could touch with their non-dominant hand. This provided a stable grounding of the user potential, leaving the drive voltage between the dominant hand and the test surface. The drive signal was floating, and there was a 5 Mohm serial resistor in series with the output. The system was capable of driving voltages up to 2.4 kV peak to peak in the frequency range of 40 to 600 Hz. The system schematics are shown in Figure 1.
Fig. 1. Test system hardware. The user slides their finger on the tixel surface, where the visual gesture hint is projected. The non-dominant hand is placed on the ground surface.
3.4 Stimuli
All the stimuli used in the experiment were pure sine waves. There were 13 different signal patterns used in this test. In the original pilot studies we conducted to identify the frequency scale, we tested 40Hz-200Hz with 40Hz intervals. In that study we found that 80Hz was the most sensitive vibration level and using a maximum of 200Hz did not cover a large enough scale. Hence we increased the range to 320Hz. In the pilot study, the intensity ratings of 120Hz stimuli were not significantly high de-spite that fact that 125Hz should be the most sensitive level of vibration for the skin. Therefore, in the study reported here, we examined a range of frequencies using the following scale: 40Hz, 80Hz, 160Hz, 240Hz and 320Hz. 0dB, -6dB and -12dB were used as amplitudes. -6dB and -12dB were selected since they resemble the signals closer to the half and the quarter of the original signal. 0dB corresponds to a 1.2 kV peak. All combinations of frequency and amplitude were used in the test except 240Hz/-12dB and 320Hz/-12dB. These stimuli were excluded from the experiment after pilot studies revealed them to be unperceivable.

618 D. Wijekoon et al.
3.5 Subjects
We recruited 26 volunteer members of the University in the study and received tnumber of males and femalwas determined by the Edthree participants were actu
3.6 Methodology
Before the actual test beganof the session to acquaint feedback. The participantsindex finger of their domithe test bed (see Figure 2).grounding surface while do
There were two phases iFirstly, a magnitude estimatrary number of their own Participants were then preseintensity number reflectingthere were 26 tasks in the ethe 13 frequency/amplitudesented with the 80Hz 0dB sto the 40Hz -12dB stimulus
The second phase of the in a random order, and rated
Before the test there wawith additional qualitative qimately 30 minutes to comcould interrupt their performfrom the system between ea
Fig. 2. (a) left
participants (mean age: 25,5; s.d.: 4,4), mostly studentsof Helsinki, who gave their informed consent to participtwo movie tickets as compensation. There were an eqles, left-handed and right-handed participants. Handedndinburgh Handedness Inventory [22], which showed tually ambidextrous, even though they were not aware of
n, all participants took part in short tutorial at the beginnthemselves with the Tixel hardware and electrovibrat’ task was to make a continuous circle gesture with inant hand, tracing an image projected from above o. We instructed participants to keep the other hand on
oing the gesture. in the experiment: magnitude estimation and ESSI ratin
ation method was used where participants assigned an achoice to the intensity of a baseline stimulus present
ented with a series of further stimuli and asked to assigng its perceived intensity relative to the baseline. Oveexperiment using a random baseline stimulus (chosen fre combinations). For example, a participant could be pstimulus as the baseline and asked to assign a weight vas in comparison to the baseline (see Fig. 2b).
experiment focused on ESSI ratings. Users felt the stimd them one by one using the ESSI scale. as a short questionnaire, and it was repeated after the questions of user perceptions. The experiment took apprmplete. Due to the repetitiveness of the task, participamance at any time, and the subjects lifted their index finach task.
t: Test setup (b) right: Magnitude Estimation Test
s or pate qual ness that it.
ning tion the
onto the
ngs. arbi-ted. n an erall rom pre-alue
muli
test rox-ants nger
Electrostatic Modu
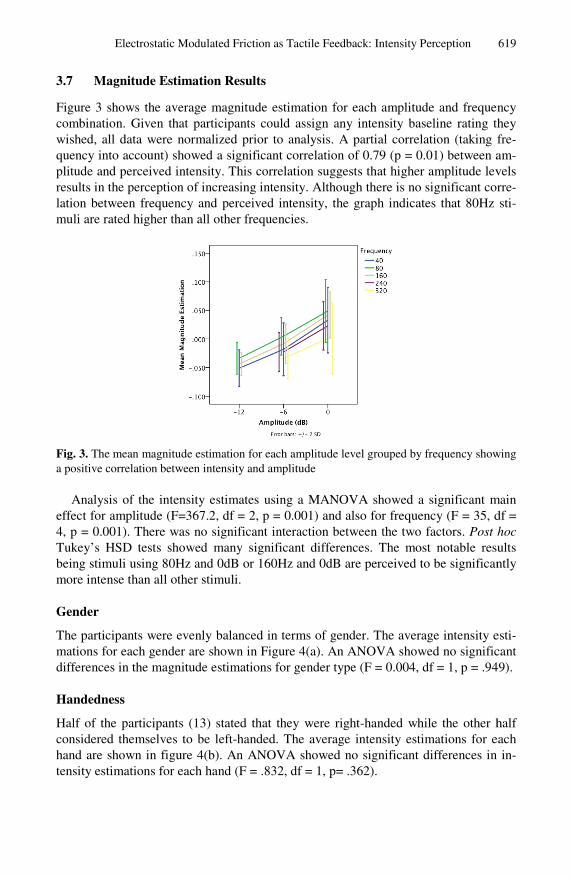
3.7 Magnitude Estimat
Figure 3 shows the averagecombination. Given that pawished, all data were normquency into account) showeplitude and perceived intenresults in the perception of lation between frequency amuli are rated higher than a
Fig. 3. The mean magnitude esa positive correlation between
Analysis of the intensityeffect for amplitude (F=3674, p = 0.001). There was noTukey’s HSD tests showedbeing stimuli using 80Hz anmore intense than all other
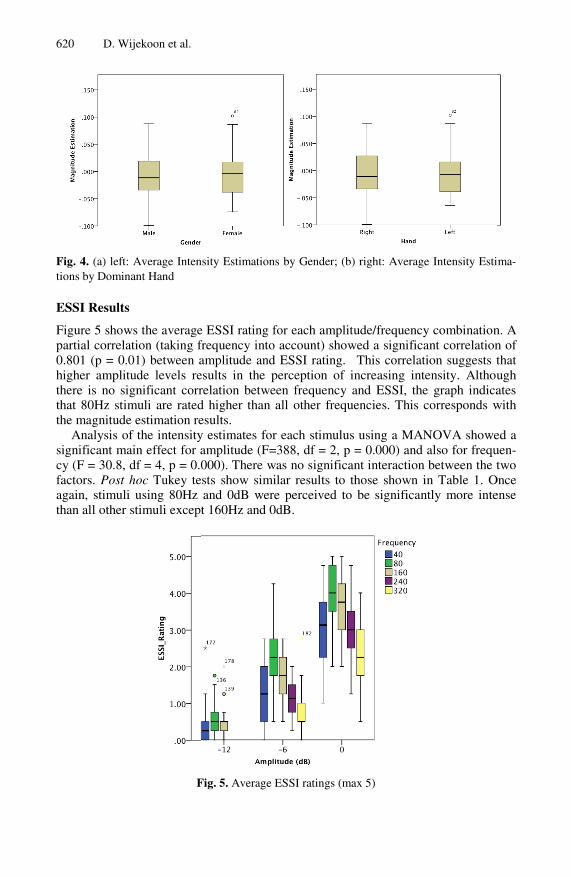
Gender
The participants were evenmations for each gender aredifferences in the magnitud
Handedness
Half of the participants (13considered themselves to bhand are shown in figure 4tensity estimations for each
ulated Friction as Tactile Feedback: Intensity Perception
tion Results
e magnitude estimation for each amplitude and frequearticipants could assign any intensity baseline rating t
malized prior to analysis. A partial correlation (taking ed a significant correlation of 0.79 (p = 0.01) between a
nsity. This correlation suggests that higher amplitude levincreasing intensity. Although there is no significant co
and perceived intensity, the graph indicates that 80Hz all other frequencies.
stimation for each amplitude level grouped by frequency showintensity and amplitude
y estimates using a MANOVA showed a significant m7.2, df = 2, p = 0.001) and also for frequency (F = 35, do significant interaction between the two factors. Post d many significant differences. The most notable resnd 0dB or 160Hz and 0dB are perceived to be significanstimuli.
ly balanced in terms of gender. The average intensity ee shown in Figure 4(a). An ANOVA showed no signific
de estimations for gender type (F = 0.004, df = 1, p = .94
3) stated that they were right-handed while the other hbe left-handed. The average intensity estimations for e4(b). An ANOVA showed no significant differences inh hand (F = .832, df = 1, p= .362).
619
ncy they fre-am-vels rre-sti-
wing
main df = hoc ults ntly
esti-cant 49).
half each n in-
620 D. Wijekoon et al.
Fig. 4. (a) left: Average Intentions by Dominant Hand
ESSI Results
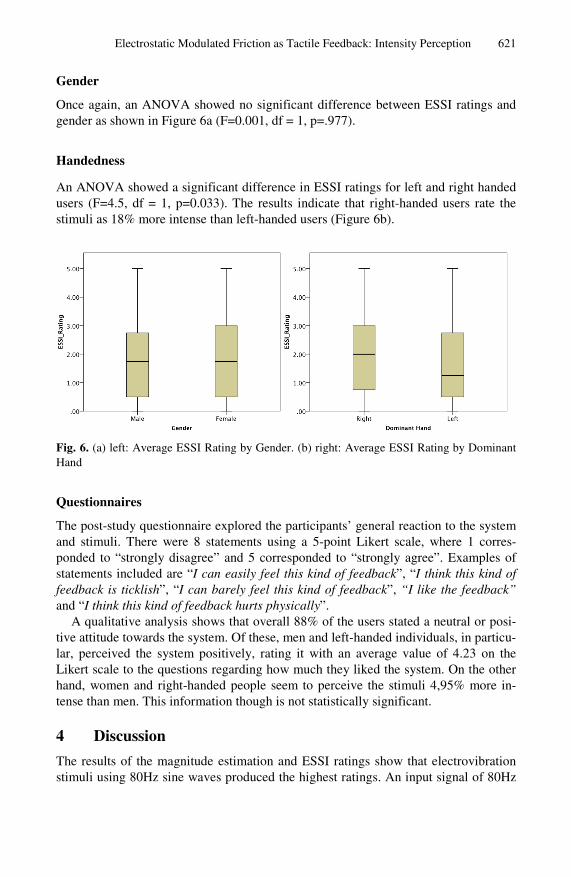
Figure 5 shows the averagepartial correlation (taking f0.801 (p = 0.01) between ahigher amplitude levels rethere is no significant corrthat 80Hz stimuli are ratedthe magnitude estimation re
Analysis of the intensitysignificant main effect for acy (F = 30.8, df = 4, p = 0.0factors. Post hoc Tukey teagain, stimuli using 80Hz than all other stimuli except
F
nsity Estimations by Gender; (b) right: Average Intensity Esti
e ESSI rating for each amplitude/frequency combinationfrequency into account) showed a significant correlationamplitude and ESSI rating. This correlation suggests tesults in the perception of increasing intensity. Althourelation between frequency and ESSI, the graph indicad higher than all other frequencies. This corresponds wesults. y estimates for each stimulus using a MANOVA showeamplitude (F=388, df = 2, p = 0.000) and also for frequ000). There was no significant interaction between the tsts show similar results to those shown in Table 1. Oand 0dB were perceived to be significantly more intet 160Hz and 0dB.
Fig. 5. Average ESSI ratings (max 5)
ima-
n. A n of that ugh ates with
ed a uen-two
Once ense
Electrostatic Modulated Friction as Tactile Feedback: Intensity Perception 621
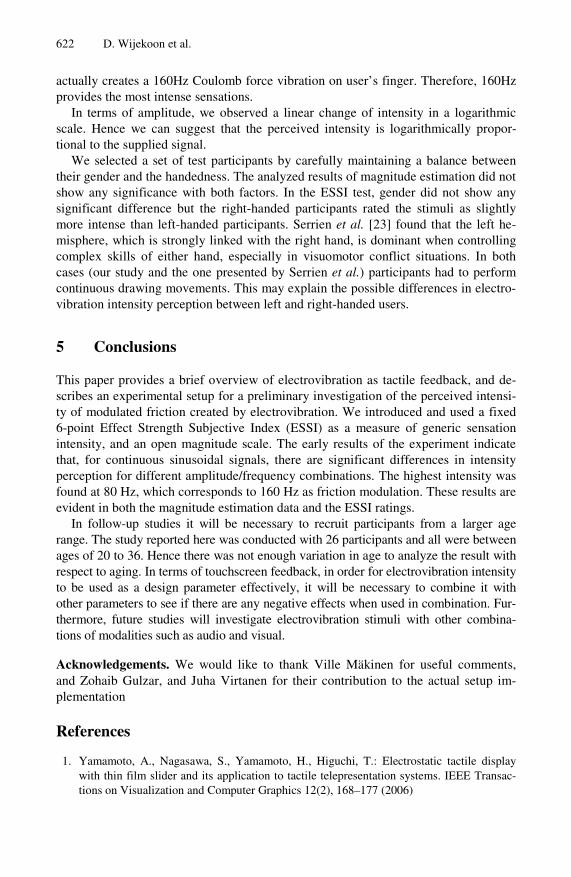
Gender
Once again, an ANOVA showed no significant difference between ESSI ratings and gender as shown in Figure 6a (F=0.001, df = 1, p=.977).
Handedness
An ANOVA showed a significant difference in ESSI ratings for left and right handed users (F=4.5, df = 1, p=0.033). The results indicate that right-handed users rate the stimuli as 18% more intense than left-handed users (Figure 6b).
Fig. 6. (a) left: Average ESSI Rating by Gender. (b) right: Average ESSI Rating by Dominant Hand
Questionnaires
The post-study questionnaire explored the participants’ general reaction to the system and stimuli. There were 8 statements using a 5-point Likert scale, where 1 corres-ponded to “strongly disagree” and 5 corresponded to “strongly agree”. Examples of statements included are “I can easily feel this kind of feedback”, “I think this kind of feedback is ticklish”, “I can barely feel this kind of feedback”, “I like the feedback” and “I think this kind of feedback hurts physically”.
A qualitative analysis shows that overall 88% of the users stated a neutral or posi-tive attitude towards the system. Of these, men and left-handed individuals, in particu-lar, perceived the system positively, rating it with an average value of 4.23 on the Likert scale to the questions regarding how much they liked the system. On the other hand, women and right-handed people seem to perceive the stimuli 4,95% more in-tense than men. This information though is not statistically significant.
4 Discussion
The results of the magnitude estimation and ESSI ratings show that electrovibration stimuli using 80Hz sine waves produced the highest ratings. An input signal of 80Hz
622 D. Wijekoon et al.
actually creates a 160Hz Coulomb force vibration on user’s finger. Therefore, 160Hz provides the most intense sensations.
In terms of amplitude, we observed a linear change of intensity in a logarithmic scale. Hence we can suggest that the perceived intensity is logarithmically propor-tional to the supplied signal.
We selected a set of test participants by carefully maintaining a balance between their gender and the handedness. The analyzed results of magnitude estimation did not show any significance with both factors. In the ESSI test, gender did not show any significant difference but the right-handed participants rated the stimuli as slightly more intense than left-handed participants. Serrien et al. [23] found that the left he-misphere, which is strongly linked with the right hand, is dominant when controlling complex skills of either hand, especially in visuomotor conflict situations. In both cases (our study and the one presented by Serrien et al.) participants had to perform continuous drawing movements. This may explain the possible differences in electro-vibration intensity perception between left and right-handed users.
5 Conclusions
This paper provides a brief overview of electrovibration as tactile feedback, and de-scribes an experimental setup for a preliminary investigation of the perceived intensi-ty of modulated friction created by electrovibration. We introduced and used a fixed 6-point Effect Strength Subjective Index (ESSI) as a measure of generic sensation intensity, and an open magnitude scale. The early results of the experiment indicate that, for continuous sinusoidal signals, there are significant differences in intensity perception for different amplitude/frequency combinations. The highest intensity was found at 80 Hz, which corresponds to 160 Hz as friction modulation. These results are evident in both the magnitude estimation data and the ESSI ratings.
In follow-up studies it will be necessary to recruit participants from a larger age range. The study reported here was conducted with 26 participants and all were between ages of 20 to 36. Hence there was not enough variation in age to analyze the result with respect to aging. In terms of touchscreen feedback, in order for electrovibration intensity to be used as a design parameter effectively, it will be necessary to combine it with other parameters to see if there are any negative effects when used in combination. Fur-thermore, future studies will investigate electrovibration stimuli with other combina-tions of modalities such as audio and visual.
Acknowledgements. We would like to thank Ville Mäkinen for useful comments, and Zohaib Gulzar, and Juha Virtanen for their contribution to the actual setup im-plementation
References
1. Yamamoto, A., Nagasawa, S., Yamamoto, H., Higuchi, T.: Electrostatic tactile display with thin film slider and its application to tactile telepresentation systems. IEEE Transac-tions on Visualization and Computer Graphics 12(2), 168–177 (2006)

Electrostatic Modulated Friction as Tactile Feedback: Intensity Perception 623
2. Levesque, V., Oram, L., MacLean, K., Cockburn, A., Marchuk, N., Johnson, D., Colgate, J.E., Peshkin, M.: Frictional widgets: enhancing touch interfaces with programmable fric-tion. In: Proceedings of the 2011 Annual Conference Extended Abstracts on Human Fac-tors in Computing Systems, Vancouver, BC, Canada (2011)
3. Brewster, S., Chohan, F., Brown, L.: Tactile feedback for mobile interactions. In: Proceed-ings of the SIGCHI Conference on Human Factors in Computing Systems, San Jose, Cali-fornia, USA (2007)
4. Amberg, M., Giraud, F., Semail, B., Olivo, P., Casiez, G., Roussel, N.: STIMTAC: a tac-tile input device with programmable friction. In: Proceedings of the 24th Annual ACM Symposium Adjunct on User Interface Software and Technology, Santa Barbara, Califor-nia, USA (2011)
5. Bau, O., Poupyrev, I., Israr, A., Harrison, C.: TeslaTouch: electrovibration for touch sur-faces. In: Proceedings of the 23nd Annual ACM Symposium on User Interface Software and Technology, New York, New York, USA (2010)
6. Higashiyama, A., Rollman, G.: Perceived locus and intensity of electrocutaneous stimula-tion. IEEE Transactions on Biomedical Engineering 38(7), 679–686 (1991)
7. Brown, L.M., Brewster, S.A.: Multidimensional Tactons for Non-Visual Information Dis-play in Mobile Devices. In: MobileHCI 2006 (2006)
8. Maclean, K., Enriquez, M.: Perceptual design of haptic icons. In: Proceedings of Eurohap-tics (2003)
9. Mallinckrodt, E., Hughes, A.L., William Sleator, J.: Perception by the Skin of Electrically Induced Vibrations. Science 118(3062), 277–278 (1953)
10. Tang, H., Beebe, D.: A microfabricated electrostatic haptic display for persons with visual impairments. IEEE Transactions on Rehabilitation Engineering 6(3), 241–248 (1998)
11. Fukushima, S., Kajimoto, H.: Palm touch panel: providing touch sensation through the de-vice. In: Proceedings of the ACM International Conference on Interactive Tabletops and Surfaces, Kobe, Japan (2011)
12. Hiroyuki, K., Yonezo, K., Susumu, T.: Forehead electrotactile display. In: Proceedings of the Virtual Reality Society of Japan Annual Conference, vol. 11 (2006)
13. Agarwal, A., Nammi, K., Kaczmarek, K., Tyler, M., Beebe, D.: A hybrid natural/artificial electrostatic actuator for tactile stimulation. In: 2nd Annual International IEEE-EMB Spe-cial Topic Conference on Microtechnologies in Medicine & Biology (2002)
14. Strong, R., Troxel, D.: An Electrotactile Display. IEEE Transactions on Man-Machine Systems 11(1), 72–79 (1970)
15. Linjama, J., Mäkinen, V.: E-Sense screen: Novel haptic display with Capacitive Electro-sensory Interface. In: HAID 2009, 4th Workshop for Haptic and Audio Interaction Design, Dresden, Germany (2009)
16. Winfield, L., Glassmire, J., Colgate, J.E., Peshkin, M.: T-PaD: Tactile Pattern Display through Variable Friction Reduction. In: Second Joint EuroHaptics Conference, 2007 and Symposium on Haptic Interfaces for Virtual Environment and Teleoperator Systems, World Haptics 2007, Tsukaba (2007)
17. Marchuk, N., Colgate, J., Peshkin, M.: Friction measurements on a Large Area TPaD. In: IEEE Haptics Symposium, Waltham, MA, USA (2010)
18. Verrillo, R.T.: Psychophysics of vibrotactile stimulation. The Journal of the Acoustical Society of America 77(1), 225–232 (1985)
19. Gescheider, G.A.: Psychophysical Scaling. Annual Review of Psychology 39, 169–200 (1988)
20. Linjama, J., Puhakka, M., Kaaresoja, T.: User Studies on Tactile Perception of Vibrating Alert. In: HCI International, Crete, Greece (2003)

624 D. Wijekoon et al.
21. Keelan, B.W.: Handbook of Image Quality, Characterization and Prediction. CRC Press (2002)
22. Oldfield, R.C.: The assessment and analysis of handedness: The Edinburgh inventory. Neuropsychologia 9(1), 97–113 (1971)
23. Serrien, D.J., Spapé, M.M.: The role of hand dominance and sensorimotor congruence in voluntary movement. Exp. Brain Res. 199, 195–200 (2009)