Embed Size (px)
Citation preview
Adaptive Fraud Detection Using Benford’s Law
Fletcher Lu1, J. Efrim Boritz2, and Dominic Covvey2
1 Canadian Institute of Chartered Accountants,66 Grace Street, Scarborough, Ontario, M1J 3K9
[email protected] University of Waterloo, 200 University Avenue West,
Waterloo, Ontario, Canada, N2L [email protected],
Abstract. Adaptive Benford’s Law [1] is a digital analysis technique that speci-fies the probabilistic distribution of digits for many commonly occurringphenomena, even for incomplete data records. We combine this digital analy-sis technique with a reinforcement learning technique to create a new fraud dis-covery approach. When applied to records of naturally occurring phenomena, ouradaptive fraud detection method uses deviations from the expected Benford’s Lawdistributions as an indicators of anomalous behaviour that are strong indicators offraud. Through the exploration component of our reinforcement learning methodwe search for the underlying attributes producing the anomalous behaviour. In ablind test of our approach, using real health and auto insurance data, our Adap-tive Fraud Detection method successfully identified actual fraudsters among thetest data.
1 Introduction
In this paper we illustrate the implementation of a fraud discovery system which uses anew approach for discovering fraud that combines a reinforcement learning (RL) tech-nique with a digital analysis method. The idea behind this approach is to use the digitalanalysis to uncover data anomalies and then utilize the reinforcement learning compo-nent to reveal the attributes contributing to the anomaly, thereby uncovering underlyingfraudulent behaviour.
As Bolton and Hand [2] noted, fraud detection methods may be divided into bothsupervised and unsupervised methods. For supervised methods, both fraudulent andnon-fraudulent records are used to train a system, which then searches and classifiesnew records according to the trained patterns. The limitation to supervised methods isthat one must have both classes of records identified for the system to train on. Thus,this approach is limited to only previously known methods of committing fraud.
Unsupervised methods, in contrast, typically identify records that do not fit expectednorms. The advantage of this approach is that one may identify new instances of fraud.The common approach to this method is to use forms of outlier detection. The mainlimit to this approach is that we are essentially identifying anomalies that may or maynot be fraudulent behaviour. Just because a behaviour is anomalous does not neces-sarily mean that the behaviour is fraudulent. Instead they can be used as indicators of
L. Lamontagne and M. Marchand (Eds.): Canadian AI 2006, LNAI 4013, pp. 347–358, 2006.c© Springer-Verlag Berlin Heidelberg 2006
348 F. Lu, J.E. Boritz, and D. Covvey
possible fraud, whereby the strength of the anomalous behaviour (how much it devi-ates from expected norms), may be used as a measure of ones confidence in how likelythe behaviour may be fraudulent. Investigators may then be employed to analyze theseanomalies. However, given the often enormous numbers of records involved in typicalfraud application areas such as credit card, cellular phone and healthcare records, evenwith identified anomalies, investigating the anomalies can be a considerable burden toresources. The novelty of our approach is that we extend the typical outlier detectionmethods with a reinforcement learning component.
The reinforcement learning component of our algorithm builds on identified out-liers by associating with our outliers, underlying attributes that may be linked togetherto build a case for fraud. Reinforcement learning has typically been used in the pastto find the best choice of actions when trying to perform some physical task requir-ing a sequence of actions to accomplish a desirable goal such as navigating through amaze. The core idea which makes reinforcement learning useful to fraud discovery isits ability to link together states through a pattern of state-action pairs in a policy. In ouralgorithm we will link together anomalies according to their underlying attributes usingthe magnitude of the anomalous behaviour as a measure of its desireablity within thereinforcement learning context (in other words anomalies are equivalent to the rewardsin an RL environment).
To identify our outliers, we use a digital analysis technique known as adaptive Ben-ford’s Law [1]. Benford’s Law specifies the distribution of the digits for naturally oc-curring phenomena. For a long time this technique, commonly used in areas of taxationand accounting, was considered mostly a mathematical curiosity as it described thefrequency with which individual and sets of digits for naturally growing phenomenasuch as population measures should appear [3]. Such naturally growing phenomena,however, has been shown to include practical areas such as spending records and stockmarket values [4]. One of the limits to the use of classic Benford’s Law in fraud detec-tion has been its requirement that analyzed records have no artificial cutoffs. In otherwords, records must be complete. However, in many practical application areas, oneonly has information for a subset, such as a single year, of financial records. Recentwork by Lu and Boritz [1] has removed this limitation with an adaptive Benford’s Law,making it more practically useful.
In our paper we will explain the algorithm for our technique and test our new frauddiscovery technique against outlier detection methods using real healthcare and autoinsurance records, demonstrating improvements in classifying fraudsters.
1.1 Complications in Practical Fraud Detection Research
Two major complications for fraud detection researchers are:
1. Secrecy with regards to details on fraud detection techniques.2. Limits on available real fraud records.
Both of these complications stem from the nature of the application area. It is quite nat-ural that in order to stay ahead of fraudsters, those employing fraud detection methodstend to keep secret their algorithm details in order to avoid fraudsters from knowingthese details and developing methods to circumnavigate them. This secrecy makes it
Adaptive Fraud Detection Using Benford’s Law 349
difficult to compare new fraud detection techniques with previous methods. The sec-ond complication is due to the fact that companies do not generally like to reveal theamounts of fraud within their field as it tends to have a detrimental impact on share-holder confidence as well as consumer confidence. In addition, laws in Canada as wellas many other countries do not require the explicit reporting of fraud losses. Withoutavailable real fraud records, many researchers use artificially created synthetic fraudrecords to test their methods. However, synthetic records for testing are only as usefulas they are truly representative of actual fraudulent and non-fraudulent records.
We deal with the first complication by developing a general technique that is notmeant to be application area specific but is meant as an improvement over the gen-eral Benford’s Law outlier detection approach. Many fraud detection techniques aread hoc and use specific details about their application area for detection. For instance,cellular phone detection uses the fact that one can uncover phone usage stealing byidentifying that the same phone is calling from two different locations at the same time,which would imply at least one of the calls is from an illegitimate user. Since our frauddiscovery technique is meant as an improvement over previous Benford’s Law out-lier detection methods, we compare our method specifically with that outlier detectionapproach.
We deal with the second complication by testing our method on real auto insurancerecords that have been audited and classified for actual fraud. In order to demonstraterobustness, we also apply our method to real healthcare insurance records. However,these records have yet to be audited for fraud and thus we use it only to demonstratethe technique’s operation on a differing application area and to illustrate the adaptiveBenford’s Law component of our fraud detection method on a real fraud application.
2 Background
2.1 Benford’s Law
Benford’s Law is a probability distribution with strong relevance to accounting fraud.Much of the research on Benford’s Law has been in areas of statistics [5, 6] as well asauditing [7, 8].
Benford’s Law is a mathematical formula that specifies the probability of leadingdigit sequences appearing in a set of data. What we mean by leading digit sequences isbest illustrated through an example. Consider the set of data
S = {231, 432, 1, 23, 634, 23, 1, 634, 2, 23, 34, 1232}.
There are twelve data entries in set S. The digit sequence ‘23’ appears as a leading digitsequence (i.e. in the first and second position) 4 times. Therefore, the probability of thefirst two digits being ‘23’ is 4
9 ≈ 0.44. The probability is computed out of 9 becauseonly 9 entries have at least 2 digit positions. Entries with less than the number of digitsbeing analyzed are not included in the probability computation.
The actual mathematical formula of Benford’s law is:
P (D = d) = log10(1 +1d), (1)
350 F. Lu, J.E. Boritz, and D. Covvey
where P (D = d) is the probability of observing the digit sequence d in the first ‘y’digits and where d is a sequence of ‘y’ digits. For instance, Benford’s Law would statethat the probability that the first digit in a data set is ‘3’ would be log10(1+ 1
3 ). Similarly,the probability that the first 3 digits of the data set are ‘238’, would be log10(1 + 1
238 ).The numbers ‘238’ and ‘23885’ would be instances of the first three digits being ‘238’.However this probability would not include the occurrence ‘3238’, as ‘238’ is not thefirst three digits in this instance.
2.2 Benford’s Law Requirements
In order to apply equation 1 as a test for a data set’s digit frequencies, Benford’s Lawrequires that:
1. The entries in a data set should record values of similar phenomena. In other words,the recorded data cannot include entries from two different phenomena such as bothcensus population records and dental measurements.
2. There should be no built-in minimum or maximum values in the data set. In otherwords, the records for the phenomena must be complete, with no artificial startvalue or ending cutoff value.
3. The data set should not be made up of assigned numbers, such as phone numbers.4. The data set should have more small value entries than large value entries.
Further details on these rules may be found in [3]. Under these conditions, Benfordnoted that the data for such sets, when placed in ascending order, often follows a geo-metric growth pattern.1 Under such a situation, equation 1 specifies the probability ofobserving specific leading digit sequences for such a data set.
The intuitive reasoning behind the geometric growth of Benford’s Law is based onthe notion that for low values it takes more time for some event to increase by 100%from ‘1’ to ‘2’ than it does to increase by 50% from ‘2’ to ‘3’. Thus, when recordingnumerical information at regular intervals, one often observes low digits much morefrequently than higher digits, usually decreasing geometrically.
Adaptive Benford’s Law modifies classic Benford’s Law by removing the secondrequirement of ‘no built-in minimum or maximum values’, thus allowing for the tech-nique to be more generally applicable to a wider array of real records which often areincomplete. For more details on the Adaptive Benford method see [1].
2.3 Reinforcement Learning
In reinforcement learning, an environment is modelled as a network of states, {s ∈ S}.Each state is associated with a set of possible actions, as ∈ As and a reward for enteringthat state {rs ∈ Rs}. We can transition from one state s(i) to another s(j) by choosingan action as and with a certain probability P (sj |si, asi) we transition to another state.A policy is a mapping of states to action. The objective is to find an optimal policy thatmaximizies the long-term rewards one may obtain as one navigates through the net-work. In order to find an optimal policy, we perform a task known as policy evaluation
1 Note: The actual data does not have to be recorded in ascending order. This ordering is merelyan illustrative tool to understand the intuitive reasoning for Benford’s law.
Adaptive Fraud Detection Using Benford’s Law 351
which determines value estimates for states given a fixed policy, π. The value estimatefor a state represents the sum of the discounted future rewards for a state following apolicy π. A variety of methods for policy evaluation have developed over time such asthe maximum likelihood approach[9], the temporal differencing method [10] and themonte carlo matrix inversion method [11].
One property of the reinforcement learning approach is that it is designed to handleintractably large state spaces. This trait makes it well suited to an environment such asfraud detection where there are usually extremely large numbers of records to process inorder to find the relatively small number of occurences of fraud among the total amountof data available. Reinforcement learning also incorporates an exploration componentthat allows it to search for better actions leading to higher long-term reward values. Suchan exploration component is key also for finding new instances of previously unknownfraud cases as we wish our fraud discovery method to be able to do. These two traitsare the main components motivating our use of a reinforcement learning approach forfraud detection.
3 Algorithm
As we noted in the introduction, our fraud detection method’s objective is to improveover outlier detection methods for finding instances of fraud. Outlier detection meth-ods, as we stated previously, actually only indicate anomalous instances. In order todetermine whether an anomalous instance is actually a result of a fraudulent occurencetypically requires the careful analysis of an auditor. Therefore, we need to consider howan auditor actually determines fraud. Without domain specific knowledge, such as thecell phone example we gave in the introduction, one typically builds a case for fraudby linking together suspicious occurences. Even with domain specific knowledge, suchas our cellular phone example, one may still need to link suspicious (anomalous) casestogether. For example, even in the cellular phone example where we know that the samecell phone cannot be calling from two different locations at the same time, we do notnecessarily know which of the two calls is the fraudulent one and indeed both may befrom illegal users. Thus, what is needed is to build a case of fraud by linking togetheranomalous instances that are related by some set of traits.
Reinforcement learning is well suited to linking together states through its state-action policy mapping. For reinforcement learning to be used as a fraud detectionmethod, we need to be able to relate rewards with anomalies. We do so by settingthe reward values as the magnitude that our anomalous instances deviate from ex-pected values. In turn, the states of our RL environment relate to individual recordsof our application environment and the actions are the attributes of a record. In such away, two records, with the same attributes are linked together by a common attributejust as an action can relate two states of a classic reinforcement learning environmentnetwork.
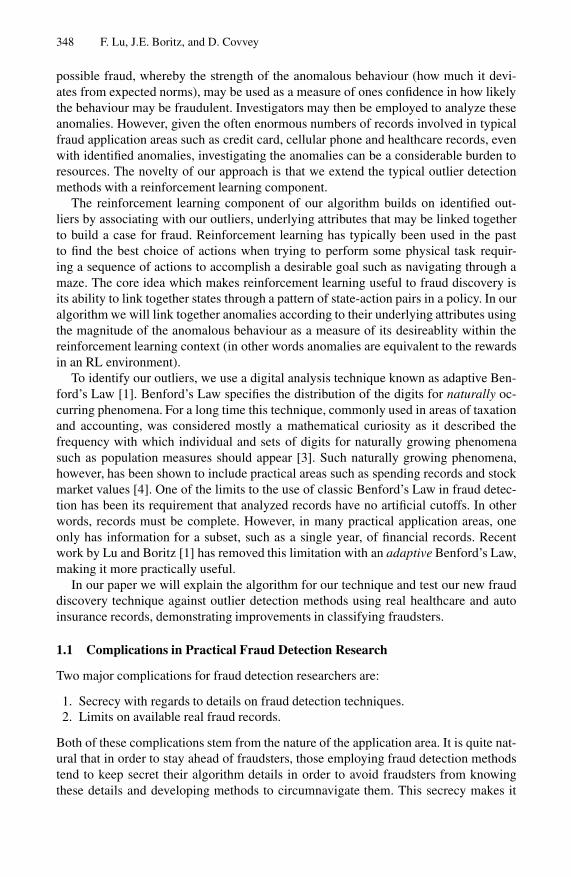
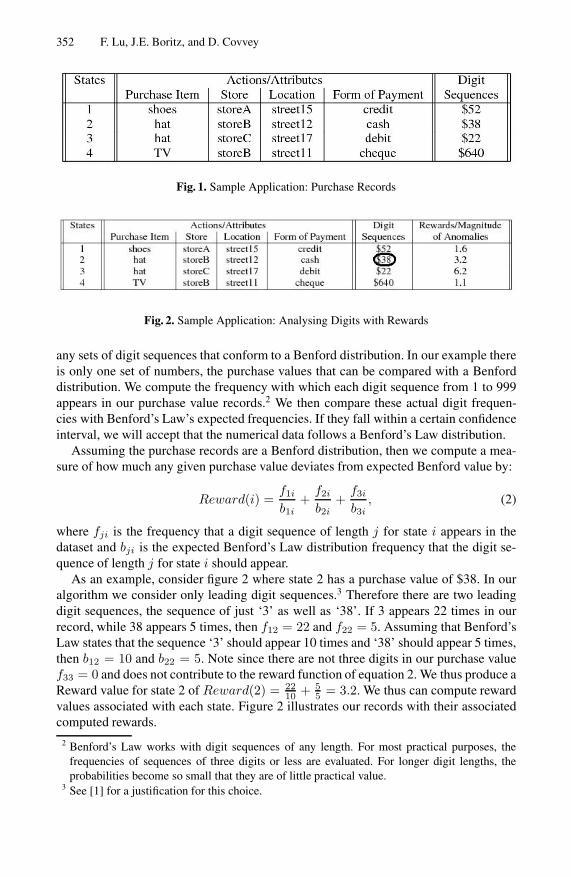
The best way to illustrate our fraud detection algorithm is through an example.Figure 1 is an example of purchase records for some consumer. Included in the recordare the purchased item, the store it was purchased in, the location of the store, theform of payment used to buy the item and the amount of the purchase under ‘DigitSequences’. We apply our fraud detection algorithm by first determining if there are
352 F. Lu, J.E. Boritz, and D. Covvey
Fig. 1. Sample Application: Purchase Records
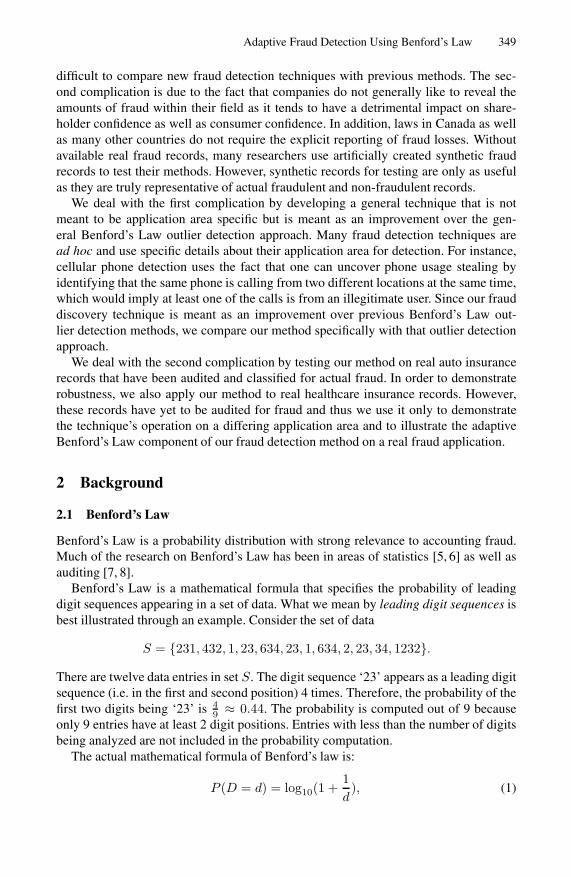
Fig. 2. Sample Application: Analysing Digits with Rewards
any sets of digit sequences that conform to a Benford distribution. In our example thereis only one set of numbers, the purchase values that can be compared with a Benforddistribution. We compute the frequency with which each digit sequence from 1 to 999appears in our purchase value records.2 We then compare these actual digit frequen-cies with Benford’s Law’s expected frequencies. If they fall within a certain confidenceinterval, we will accept that the numerical data follows a Benford’s Law distribution.
Assuming the purchase records are a Benford distribution, then we compute a mea-sure of how much any given purchase value deviates from expected Benford value by:
Reward(i) =f1i
b1i+
f2i
b2i+
f3i
b3i, (2)
where fji is the frequency that a digit sequence of length j for state i appears in thedataset and bji is the expected Benford’s Law distribution frequency that the digit se-quence of length j for state i should appear.
As an example, consider figure 2 where state 2 has a purchase value of $38. In ouralgorithm we consider only leading digit sequences.3 Therefore there are two leadingdigit sequences, the sequence of just ‘3’ as well as ‘38’. If 3 appears 22 times in ourrecord, while 38 appears 5 times, then f12 = 22 and f22 = 5. Assuming that Benford’sLaw states that the sequence ‘3’ should appear 10 times and ‘38’ should appear 5 times,then b12 = 10 and b22 = 5. Note since there are not three digits in our purchase valuef33 = 0 and does not contribute to the reward function of equation 2. We thus produce aReward value for state 2 of Reward(2) = 22
10 + 55 = 3.2. We thus can compute reward
values associated with each state. Figure 2 illustrates our records with their associatedcomputed rewards.
2 Benford’s Law works with digit sequences of any length. For most practical purposes, thefrequencies of sequences of three digits or less are evaluated. For longer digit lengths, theprobabilities become so small that they are of little practical value.
3 See [1] for a justification for this choice.
Adaptive Fraud Detection Using Benford’s Law 353
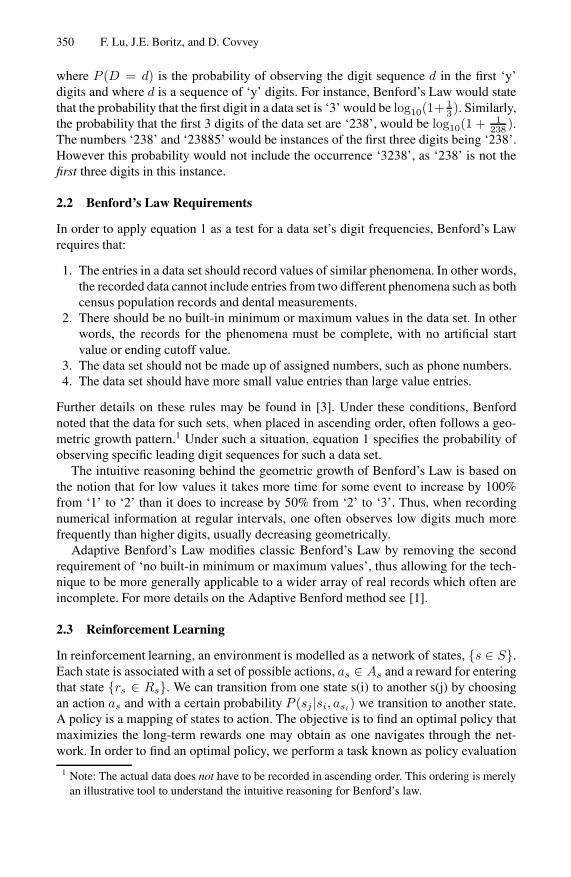
Fig. 3. Sample Application: Choosing a Record/State
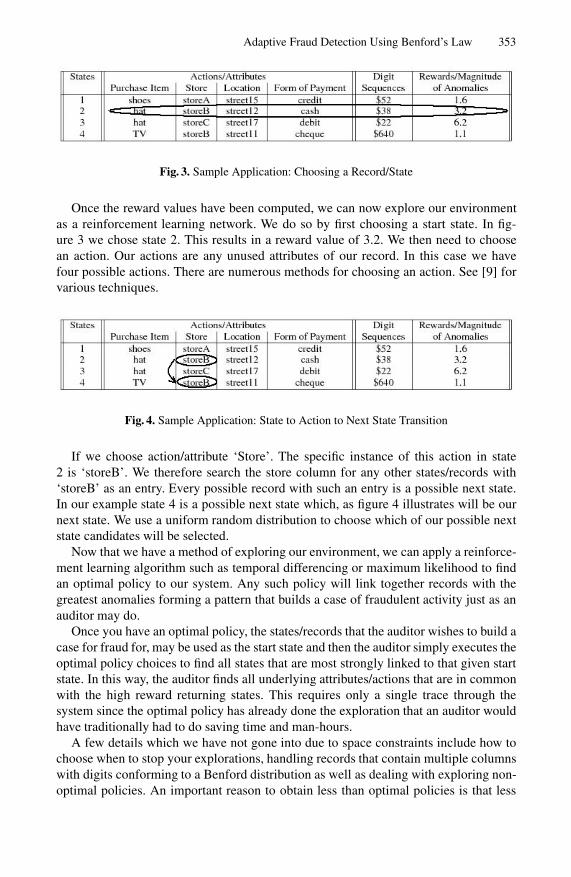
Once the reward values have been computed, we can now explore our environmentas a reinforcement learning network. We do so by first choosing a start state. In fig-ure 3 we chose state 2. This results in a reward value of 3.2. We then need to choosean action. Our actions are any unused attributes of our record. In this case we havefour possible actions. There are numerous methods for choosing an action. See [9] forvarious techniques.
Fig. 4. Sample Application: State to Action to Next State Transition
If we choose action/attribute ‘Store’. The specific instance of this action in state2 is ‘storeB’. We therefore search the store column for any other states/records with‘storeB’ as an entry. Every possible record with such an entry is a possible next state.In our example state 4 is a possible next state which, as figure 4 illustrates will be ournext state. We use a uniform random distribution to choose which of our possible nextstate candidates will be selected.
Now that we have a method of exploring our environment, we can apply a reinforce-ment learning algorithm such as temporal differencing or maximum likelihood to findan optimal policy to our system. Any such policy will link together records with thegreatest anomalies forming a pattern that builds a case of fraudulent activity just as anauditor may do.
Once you have an optimal policy, the states/records that the auditor wishes to build acase for fraud for, may be used as the start state and then the auditor simply executes theoptimal policy choices to find all states that are most strongly linked to that given startstate. In this way, the auditor finds all underlying attributes/actions that are in commonwith the high reward returning states. This requires only a single trace through thesystem since the optimal policy has already done the exploration that an auditor wouldhave traditionally had to do saving time and man-hours.
A few details which we have not gone into due to space constraints include how tochoose when to stop your explorations, handling records that contain multiple columnswith digits conforming to a Benford distribution as well as dealing with exploring non-optimal policies. An important reason to obtain less than optimal policies is that less
354 F. Lu, J.E. Boritz, and D. Covvey
than optimal policies may still also contain fraudulent patterns. One method to obtainsuch less than optimal policies is by iteratively removing the optimal policy and thenrerunning the algorithm.
In addition, two points for those unfamiliar with Benford’s Law and auditing in gen-eral may question are that the reward structure of equation 2 does not give higher re-wards for digits that appear less frequently than the Benford’s Law predicts and thatnumbers with more digits will possibly have a bias to higher rewards since there aremore digits that can contribute to the reward value. Regarding the first point, one coulduse an alternative formula to equation 2 such as:
Reward(i) = q1i + q2i + q3i, (3)
where
qji =
{fji
bjifor fji > bji
bji
jjiotherwise
. (4)
We use equation 2 in our implementation due to our application area of insurance wheregenerally, auditors are most interested in over-charges rather than under-charges. Natu-rally, this may not be the case in other application areas such as tax filings where onemay be concerned with under reporting of figures. In regards to the second point aboutnumbers with more digits having higher rewards, this situation is a Benford’s Law phe-nomenon. Certainly more digits provide more information to the auditor, but this biasis generally not of concern in practical auditing terms as successive digits have geomet-rically (10 times less for ever digit position to the left you move) less influence on theover all reward relative to the higher leading digits. Further discussions on the influenceof successive significant digits may be found in [3]. The authors will gladly providefurther details on any of these points on request.
4 Experiments
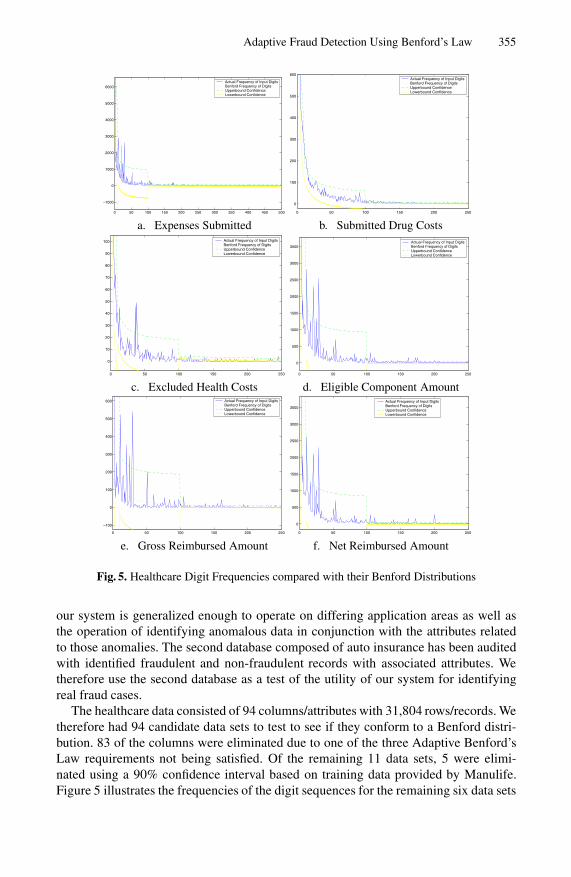
As stated in section 3 our application analyzes the first, the first two and the first threedigit sequences of a dataset, comparing them to expect Benford frequencies. Therefore,for each data set analyzed, we are comparing it to three different Benford’s Law digitfrequency distributions, one of only length 1 digit, another of length 2 digits and athird of length 3 digits. For conciseness we have reported our digit frequency analyzesthrough graphs whereby we include the first digit frequencies 1 to 9 on the x-axis valuesfrom 1 to 9, the first two digit sequences composed of 10, 11,...,99 on the x-axis from10 to 99 and the first three digit sequences on the x-axis from 100,...999. When lookingat the numerical results, one should keep in mind a single graph is actually three setsof different distributions. The expected Benford curve will contain disjunction points atthe points between 9 to 10, and 99 to 100 because they are the points at which a newBenford probability distribution starts and ends.
As stated in section 1.1, we have two databases with which to test our fraud detectionmethod on, a record of healthcare insurance claims provided by Manulife Financial aswell as records of auto insurance claims. However, the healthcare insurance claims haveyet to be audited and therefore we use it only to illustrate both the robustness of how
Adaptive Fraud Detection Using Benford’s Law 355
0 50 100 150 200 250 300 350 400 450 500
−1000
0
1000
2000
3000
4000
5000
6000Actual Frequency of Input DigitsBenford Frequency of DigitsUpperbound ConfidenceLowerbound Confidence
0 50 100 150 200 250
0
100
200
300
400
500
600Actual Frequency of Input DigitsBenford Frequency of DigitsUpperbound ConfidenceLowerbound Confidence
a. Expenses Submitted b. Submitted Drug Costs
0 50 100 150 200 250
0
10
20
30
40
50
60
70
80
90
100 Actual Frequency of Input DigitsBenford Frequency of DigitsUpperbound ConfidenceLowerbound Confidence
0 50 100 150 200 250
0
500
1000
1500
2000
2500
3000
3500Actual Frequency of Input DigitsBenford Frequency of DigitsUpperbound ConfidenceLowerbound Confidence
c. Excluded Health Costs d. Eligible Component Amount
0 50 100 150 200 250
−100
0
100
200
300
400
500
600 Actual Frequency of Input DigitsBenford Frequency of DigitsUpperbound ConfidenceLowerbound Confidence
0 50 100 150 200 250
0
500
1000
1500
2000
2500
3000
3500
Actual Frequency of Input DigitsBenford Frequency of DigitsUpperbound ConfidenceLowerbound Confidence
e. Gross Reimbursed Amount f. Net Reimbursed Amount
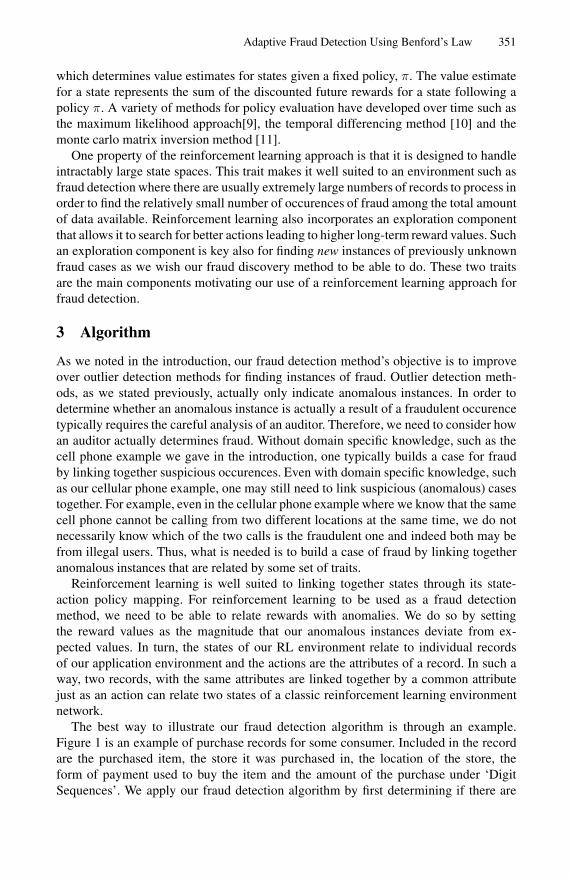
Fig. 5. Healthcare Digit Frequencies compared with their Benford Distributions
our system is generalized enough to operate on differing application areas as well asthe operation of identifying anomalous data in conjunction with the attributes relatedto those anomalies. The second database composed of auto insurance has been auditedwith identified fraudulent and non-fraudulent records with associated attributes. Wetherefore use the second database as a test of the utility of our system for identifyingreal fraud cases.
The healthcare data consisted of 94 columns/attributes with 31,804 rows/records. Wetherefore had 94 candidate data sets to test to see if they conform to a Benford distri-bution. 83 of the columns were eliminated due to one of the three Adaptive Benford’sLaw requirements not being satisfied. Of the remaining 11 data sets, 5 were elimi-nated using a 90% confidence interval based on training data provided by Manulife.Figure 5 illustrates the frequencies of the digit sequences for the remaining six data sets
356 F. Lu, J.E. Boritz, and D. Covvey
0 50 100 150 200 250
−400
−200
0
200
400
600
800
1000
1200 Actual Frequency of Input DigitsBenford Frequency of DigitsUpperbound ConfidenceLowerbound Confidence
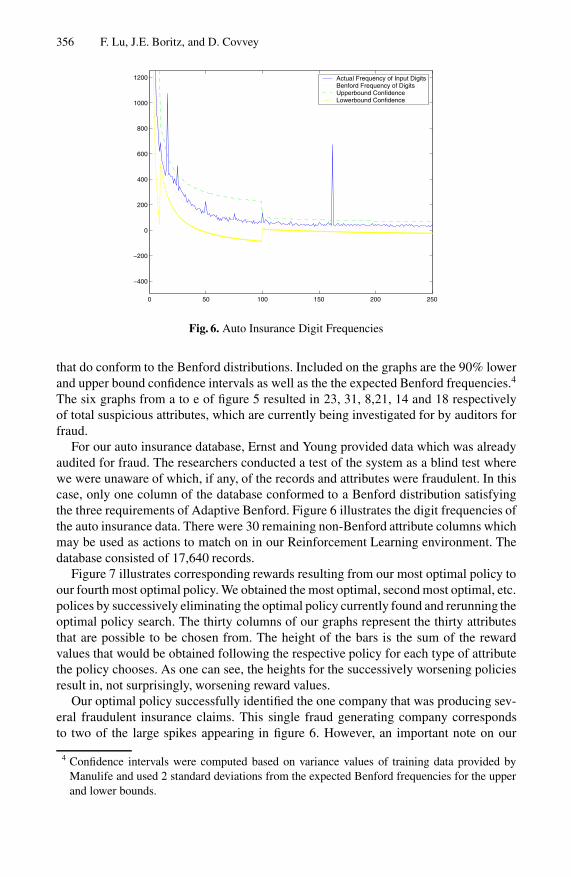
Fig. 6. Auto Insurance Digit Frequencies
that do conform to the Benford distributions. Included on the graphs are the 90% lowerand upper bound confidence intervals as well as the the expected Benford frequencies.4
The six graphs from a to e of figure 5 resulted in 23, 31, 8,21, 14 and 18 respectivelyof total suspicious attributes, which are currently being investigated for by auditors forfraud.
For our auto insurance database, Ernst and Young provided data which was alreadyaudited for fraud. The researchers conducted a test of the system as a blind test wherewe were unaware of which, if any, of the records and attributes were fraudulent. In thiscase, only one column of the database conformed to a Benford distribution satisfyingthe three requirements of Adaptive Benford. Figure 6 illustrates the digit frequencies ofthe auto insurance data. There were 30 remaining non-Benford attribute columns whichmay be used as actions to match on in our Reinforcement Learning environment. Thedatabase consisted of 17,640 records.
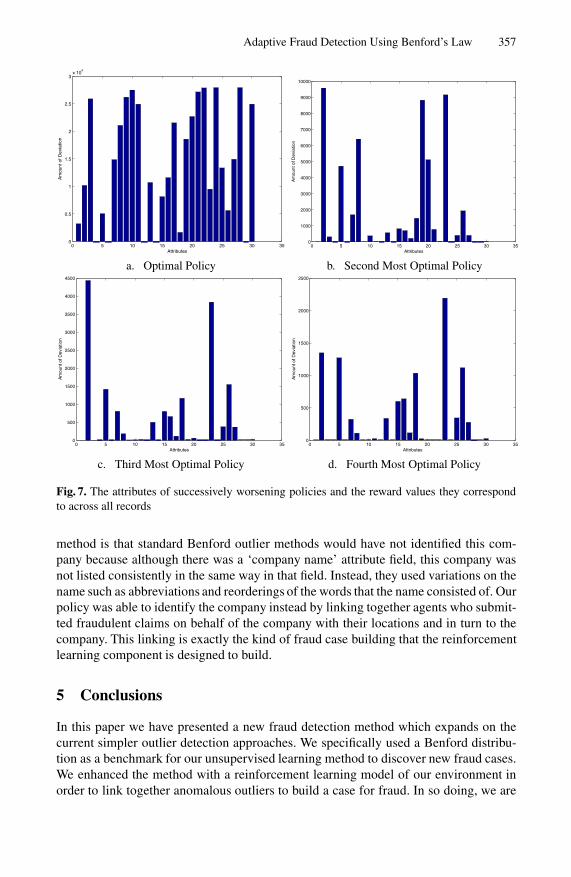
Figure 7 illustrates corresponding rewards resulting from our most optimal policy toour fourth most optimal policy. We obtained the most optimal, second most optimal, etc.polices by successively eliminating the optimal policy currently found and rerunning theoptimal policy search. The thirty columns of our graphs represent the thirty attributesthat are possible to be chosen from. The height of the bars is the sum of the rewardvalues that would be obtained following the respective policy for each type of attributethe policy chooses. As one can see, the heights for the successively worsening policiesresult in, not surprisingly, worsening reward values.
Our optimal policy successfully identified the one company that was producing sev-eral fraudulent insurance claims. This single fraud generating company correspondsto two of the large spikes appearing in figure 6. However, an important note on our
4 Confidence intervals were computed based on variance values of training data provided byManulife and used 2 standard deviations from the expected Benford frequencies for the upperand lower bounds.
Adaptive Fraud Detection Using Benford’s Law 357
0 5 10 15 20 25 30 350
0.5
1
1.5
2
2.5
3x 10
4
Attributes
Am
ount
of D
evia
tion
0 5 10 15 20 25 30 350
1000
2000
3000
4000
5000
6000
7000
8000
9000
10000
Attributes
Am
ount
of D
evia
tion
a. Optimal Policy b. Second Most Optimal Policy
0 5 10 15 20 25 30 350
500
1000
1500
2000
2500
3000
3500
4000
4500
Attributes
Am
ount
of D
evia
tion
0 5 10 15 20 25 30 350
500
1000
1500
2000
2500
Am
ount
of D
evia
tion
Attributes
c. Third Most Optimal Policy d. Fourth Most Optimal Policy
Fig. 7. The attributes of successively worsening policies and the reward values they correspondto across all records
method is that standard Benford outlier methods would have not identified this com-pany because although there was a ‘company name’ attribute field, this company wasnot listed consistently in the same way in that field. Instead, they used variations on thename such as abbreviations and reorderings of the words that the name consisted of. Ourpolicy was able to identify the company instead by linking together agents who submit-ted fraudulent claims on behalf of the company with their locations and in turn to thecompany. This linking is exactly the kind of fraud case building that the reinforcementlearning component is designed to build.
5 Conclusions
In this paper we have presented a new fraud detection method which expands on thecurrent simpler outlier detection approaches. We specifically used a Benford distribu-tion as a benchmark for our unsupervised learning method to discover new fraud cases.We enhanced the method with a reinforcement learning model of our environment inorder to link together anomalous outliers to build a case for fraud. In so doing, we are
358 F. Lu, J.E. Boritz, and D. Covvey
essentially simulating the behaviour of human auditors. We tested our system with ablind test on auto insurance data successfully identifying instances of fraud perpetratedby several people but linked to one underlying company.
In terms of future research, we plan to incorporate other outlier detection methodswith our current Benford method as well as apply our method to greater amounts ofaudited data from a variety of different application areas.
Acknowledgements. The authors wish to thank Manulife Financial as well as Ernstand Young for providing the insurance data. We would also like to thank the NaturalSciences and Engineering Research Council (NSERC) for providing funding.
References
1. F. Lu and J. E. Boritz. Detecting Fraud in Health Insurance Data: Learning to Model In-complete Benford’s Law Distributions. In 16th European Conference on Machine Learning,pages 633–640, Porto, Portugal, 2005. Springer.
2. Richard J. Bolton and David J. Hand. Statistical Fraud Detection: A Review. StatisticalScience, 17(3):235–255, 1999.
3. Mark J. Nigrini. Digital Analysis Using Benford’s Law. Global Audit Publications, Vancou-ver, B.C., Canada, 2000.
4. Mark J. Nigrini. Can Benford’s Law Be Used In Forensic Accounting? The Balance Sheet,June:7–8, 1993.
5. Roger S. Pinkham. On the Distribution of First Significant Digits. Annals of MathematicalStatistics, 32:1223–1230, 1961.
6. Theodore P. Hill. A Statistical Derivation of the Significant-Digit Law. Statistical Science,4:354–363, 1996.
7. Charles A.P.N. Carslaw. Anomalies in Income Numbers: Evidence of Goal Oriented Behav-iour. The Accounting Review, 63:321–327, 1988.
8. Nita Crowder. Fraud Detection Techniques. Internal Auditor, April:17–20, 1997.9. R. S. Sutton and A. G. Barto. Reinforcement Learning: An Introduction. MIT Press, Cam-
bridge, Massachusetts, 1998.10. R. S. Sutton. Learning to predict by the method of Temporal Differences. In Machine
Learning, volume 3, pages 9–44, 1988.11. F. Lu and D. Schuurmans. Monte Carlo Matrix Inversion Policy Evaluation. In UAI: Pro-
ceedings of the 19th Conference, pages 386–393, San Francisco, 2003. Morgan Kaufmann.12. Mark J. Nigrini and Linda J. Mittermaier. The Use of Benford’s Law as an Aid in Analytical
Procedures. In Auditing: A Journal of Practice and Theory, volume 16(2), pages 52–67,1997.