Embed Size (px)
Citation preview

lmerTest R-package for automated mixed ANOVAmodelling
Alexandra Kuznetsova 1 Rune H.B. Christensen 1 Per BruunBrockhoff 1
1DTU Compute, Statistical section, Technical University of Denmark
August 16, 2015
lmerTest R-package for automated mixed ANOVA modelling
Outline
Simple Mixed Effects models
Automated analysis/elimination of mixed effects models usinglmerTest
Example 1. Sensory profile with multi-way product structure
Example 2. External Preference Mapping with Consumer background
lmerTest R-package for automated mixed ANOVA modelling
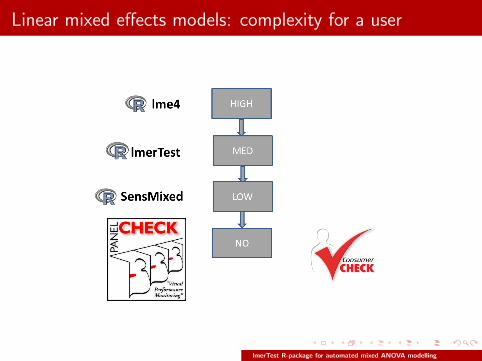
Linear mixed effects models: complexity for a user
lmerTest R-package for automated mixed ANOVA modelling
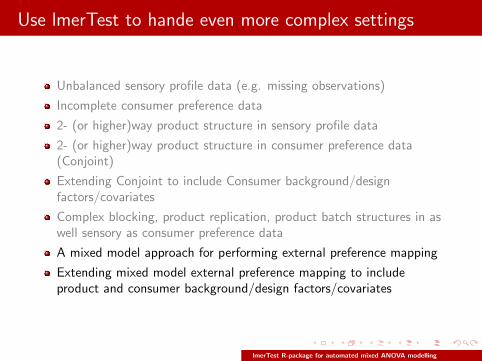
Use lmerTest to hande even more complex settings
Unbalanced sensory profile data (e.g. missing observations)
Incomplete consumer preference data
2- (or higher)way product structure in sensory profile data
2- (or higher)way product structure in consumer preference data(Conjoint)
Extending Conjoint to include Consumer background/designfactors/covariates
Complex blocking, product replication, product batch structures in aswell sensory as consumer preference data
A mixed model approach for performing external preference mapping
Extending mixed model external preference mapping to includeproduct and consumer background/design factors/covariates
lmerTest R-package for automated mixed ANOVA modelling
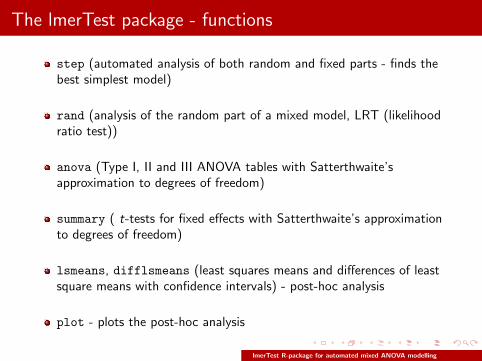
The lmerTest package - functions
step (automated analysis of both random and fixed parts - finds thebest simplest model)
rand (analysis of the random part of a mixed model, LRT (likelihoodratio test))
anova (Type I, II and III ANOVA tables with Satterthwaite’sapproximation to degrees of freedom)
summary ( t-tests for fixed effects with Satterthwaite’s approximationto degrees of freedom)
lsmeans, difflsmeans (least squares means and differences of leastsquare means with confidence intervals) - post-hoc analysis
plot - plots the post-hoc analysis
lmerTest R-package for automated mixed ANOVA modelling
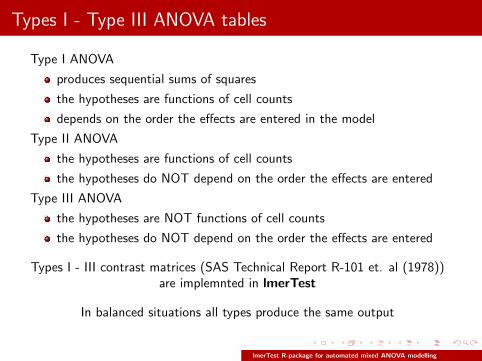
Types I - Type III ANOVA tables
Type I ANOVA
produces sequential sums of squares
the hypotheses are functions of cell counts
depends on the order the effects are entered in the model
Type II ANOVA
the hypotheses are functions of cell counts
the hypotheses do NOT depend on the order the effects are entered
Type III ANOVA
the hypotheses are NOT functions of cell counts
the hypotheses do NOT depend on the order the effects are entered
Types I - III contrast matrices (SAS Technical Report R-101 et. al (1978))are implemnted in lmerTest
In balanced situations all types produce the same output
lmerTest R-package for automated mixed ANOVA modelling
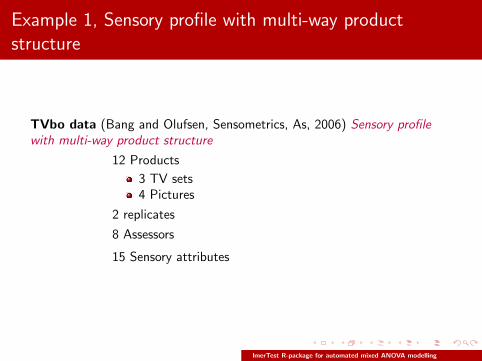
Example 1, Sensory profile with multi-way productstructure
TVbo data (Bang and Olufsen, Sensometrics, As, 2006) Sensory profilewith multi-way product structure
12 Products
3 TV sets4 Pictures
2 replicates
8 Assessors
15 Sensory attributes
lmerTest R-package for automated mixed ANOVA modelling

Example 2. Attach TVbo data
Tell R to use lmerTest and to use TVbo data
> library(lmerTest)
> data(TVbo)
lmerTest R-package for automated mixed ANOVA modelling
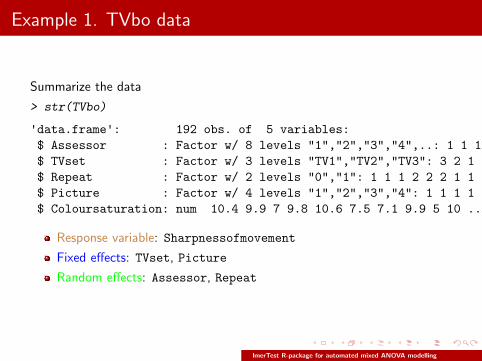
Example 1. TVbo data
Summarize the data
> str(TVbo)
'data.frame': 192 obs. of 5 variables:
$ Assessor : Factor w/ 8 levels "1","2","3","4",..: 1 1 1 1 1 1 1 1 1 1 ...
$ TVset : Factor w/ 3 levels "TV1","TV2","TV3": 3 2 1 3 2 1 3 2 1 3 ...
$ Repeat : Factor w/ 2 levels "0","1": 1 1 1 2 2 2 1 1 1 2 ...
$ Picture : Factor w/ 4 levels "1","2","3","4": 1 1 1 1 1 1 2 2 2 2 ...
$ Coloursaturation: num 10.4 9.9 7 9.8 10.6 7.5 7.1 9.9 5 10 ...
Response variable: Sharpnessofmovement
Fixed effects: TVset, Picture
Random effects: Assessor, Repeat
lmerTest R-package for automated mixed ANOVA modelling
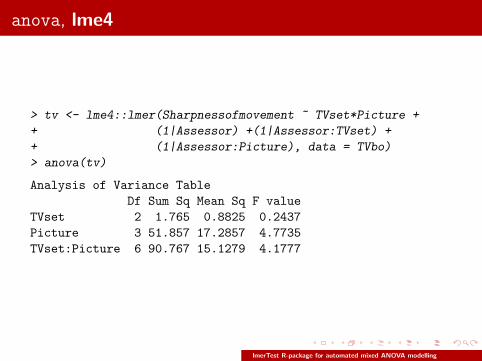
anova, lme4
> tv <- lme4::lmer(Sharpnessofmovement ~ TVset*Picture +
+ (1|Assessor) +(1|Assessor:TVset) +
+ (1|Assessor:Picture), data = TVbo)
> anova(tv)
Analysis of Variance Table
Df Sum Sq Mean Sq F value
TVset 2 1.765 0.8825 0.2437
Picture 3 51.857 17.2857 4.7735
TVset:Picture 6 90.767 15.1279 4.1777
lmerTest R-package for automated mixed ANOVA modelling
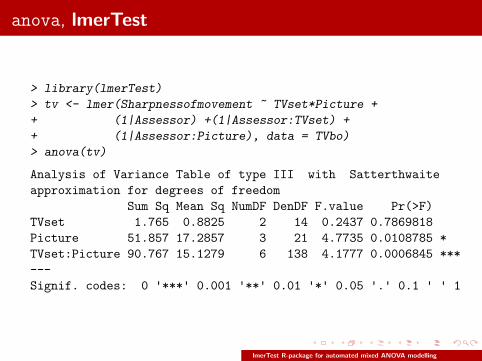
anova, lmerTest
> library(lmerTest)
> tv <- lmer(Sharpnessofmovement ~ TVset*Picture +
+ (1|Assessor) +(1|Assessor:TVset) +
+ (1|Assessor:Picture), data = TVbo)
> anova(tv)
Analysis of Variance Table of type III with Satterthwaite
approximation for degrees of freedom
Sum Sq Mean Sq NumDF DenDF F.value Pr(>F)
TVset 1.765 0.8825 2 14 0.2437 0.7869818
Picture 51.857 17.2857 3 21 4.7735 0.0108785 *
TVset:Picture 90.767 15.1279 6 138 4.1777 0.0006845 ***
---
Signif. codes: 0 '***' 0.001 '**' 0.01 '*' 0.05 '.' 0.1 ' ' 1
lmerTest R-package for automated mixed ANOVA modelling
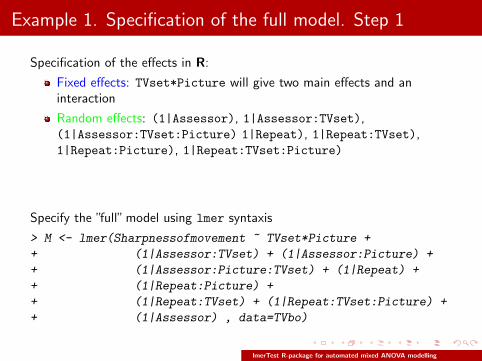
Example 1. Specification of the full model. Step 1
Specification of the effects in R:
Fixed effects: TVset*Picture will give two main effects and aninteraction
Random effects: (1|Assessor), 1|Assessor:TVset),(1|Assessor:TVset:Picture) 1|Repeat), 1|Repeat:TVset),1|Repeat:Picture), 1|Repeat:TVset:Picture)
Specify the ”full” model using lmer syntaxis
> M <- lmer(Sharpnessofmovement ~ TVset*Picture +
+ (1|Assessor:TVset) + (1|Assessor:Picture) +
+ (1|Assessor:Picture:TVset) + (1|Repeat) +
+ (1|Repeat:Picture) +
+ (1|Repeat:TVset) + (1|Repeat:TVset:Picture) +
+ (1|Assessor) , data=TVbo)
lmerTest R-package for automated mixed ANOVA modelling
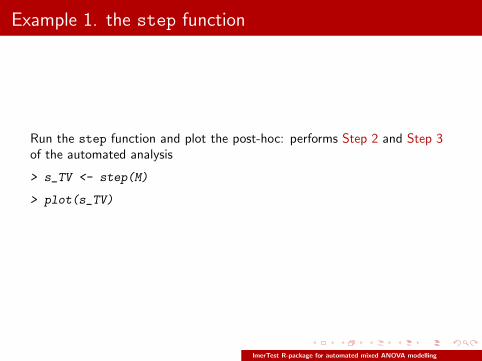
Example 1. the step function
Run the step function and plot the post-hoc: performs Step 2 and Step 3of the automated analysis
> s_TV <- step(M)
> plot(s_TV)
lmerTest R-package for automated mixed ANOVA modelling
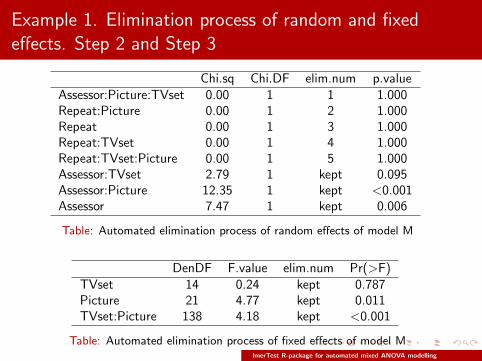
Example 1. Elimination process of random and fixedeffects. Step 2 and Step 3
Chi.sq Chi.DF elim.num p.valueAssessor:Picture:TVset 0.00 1 1 1.000Repeat:Picture 0.00 1 2 1.000Repeat 0.00 1 3 1.000Repeat:TVset 0.00 1 4 1.000Repeat:TVset:Picture 0.00 1 5 1.000Assessor:TVset 2.79 1 kept 0.095Assessor:Picture 12.35 1 kept <0.001Assessor 7.47 1 kept 0.006
Table: Automated elimination process of random effects of model M
DenDF F.value elim.num Pr(>F)TVset 14 0.24 kept 0.787Picture 21 4.77 kept 0.011TVset:Picture 138 4.18 kept <0.001
Table: Automated elimination process of fixed effects of model MlmerTest R-package for automated mixed ANOVA modelling
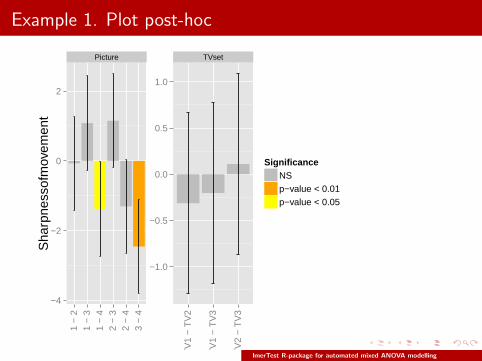
Example 1. Plot post-hoc
Picture TVset
−4
−2
0
2
−1.0
−0.5
0.0
0.5
1.01
− 2
1 −
31
− 4
2 −
32
− 4
3 −
4
TV
1 −
TV
2
TV
1 −
TV
3
TV
2 −
TV
3
levels
Sha
rpne
ssof
mov
emen
t
SignificanceNSp−value < 0.01p−value < 0.05
lmerTest R-package for automated mixed ANOVA modelling
Example 2, External Preference Mapping with consumerbackground
carrots data (Brockhoff, DTU course 02429) External PreferenceMapping with consumer background
12 carrots varieties
103 Consumers
Consumer background info
Homesize (2)
Product background info
Sensory profile PC scores 1 and 2 (sens1, sens2)
lmerTest R-package for automated mixed ANOVA modelling
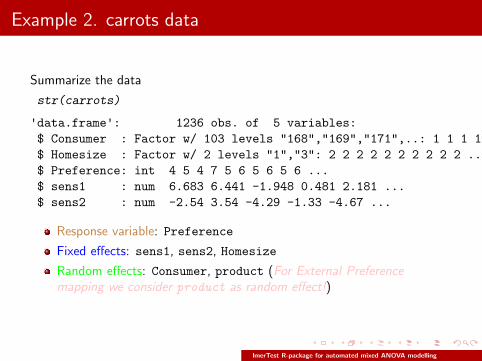
Example 2. carrots data
Summarize the data
str(carrots)
'data.frame': 1236 obs. of 5 variables:
$ Consumer : Factor w/ 103 levels "168","169","171",..: 1 1 1 1 1 1 1 1 1 1 ...
$ Homesize : Factor w/ 2 levels "1","3": 2 2 2 2 2 2 2 2 2 2 ...
$ Preference: int 4 5 4 7 5 6 5 6 5 6 ...
$ sens1 : num 6.683 6.441 -1.948 0.481 2.181 ...
$ sens2 : num -2.54 3.54 -4.29 -1.33 -4.67 ...
Response variable: Preference
Fixed effects: sens1, sens2, Homesize
Random effects: Consumer, product (For External Preferencemapping we consider product as random effect!)
lmerTest R-package for automated mixed ANOVA modelling
Example 2. Specification of the model
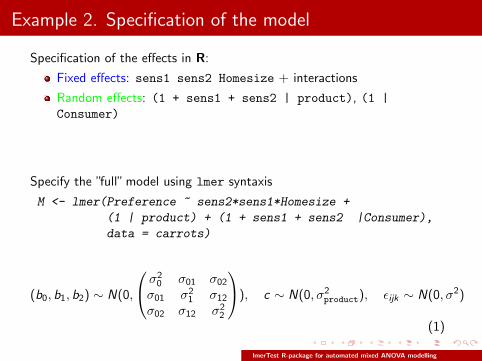
Specification of the effects in R:
Fixed effects: sens1 sens2 Homesize + interactions
Random effects: (1 + sens1 + sens2 | product), (1 |
Consumer)
Specify the ”full” model using lmer syntaxis
M <- lmer(Preference ~ sens2*sens1*Homesize +
(1 | product) + (1 + sens1 + sens2 |Consumer),
data = carrots)
(b0, b1, b2) ∼ N(0,
σ20 σ01 σ02
σ01 σ21 σ12
σ02 σ12 σ22
), c ∼ N(0, σ2product), εijk ∼ N(0, σ2)
(1)
lmerTest R-package for automated mixed ANOVA modelling
Example 2. the step function
Run the step function: performs Step 2 and Step 3 of the automatedanalysis
t <- step(M)
lmerTest R-package for automated mixed ANOVA modelling
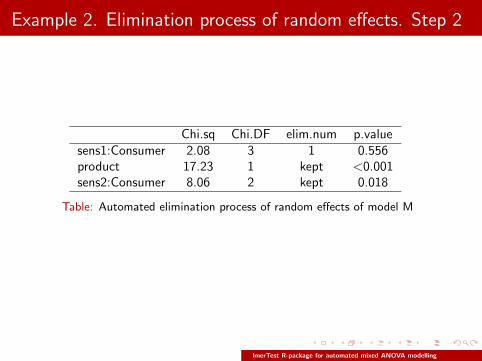
Example 2. Elimination process of random effects. Step 2
Chi.sq Chi.DF elim.num p.valuesens1:Consumer 2.08 3 1 0.556product 17.23 1 kept <0.001sens2:Consumer 8.06 2 kept 0.018
Table: Automated elimination process of random effects of model M
lmerTest R-package for automated mixed ANOVA modelling
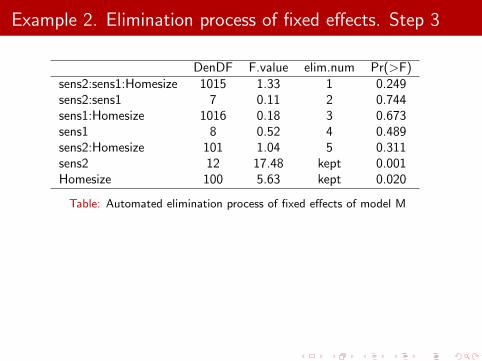
Example 2. Elimination process of fixed effects. Step 3
DenDF F.value elim.num Pr(>F)sens2:sens1:Homesize 1015 1.33 1 0.249sens2:sens1 7 0.11 2 0.744sens1:Homesize 1016 0.18 3 0.673sens1 8 0.52 4 0.489sens2:Homesize 101 1.04 5 0.311sens2 12 17.48 kept 0.001Homesize 100 5.63 kept 0.020
Table: Automated elimination process of fixed effects of model M
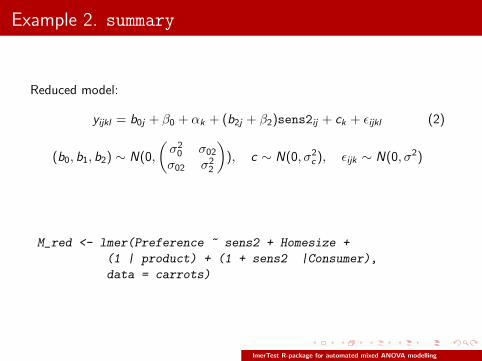
Example 2. summary
Reduced model:
yijkl = b0j + β0 + αk + (b2j + β2)sens2ij + ck + εijkl (2)
(b0, b1, b2) ∼ N(0,
(σ20 σ02
σ02 σ22
)), c ∼ N(0, σ2
c ), εijk ∼ N(0, σ2)
M_red <- lmer(Preference ~ sens2 + Homesize +
(1 | product) + (1 + sens2 |Consumer),
data = carrots)
lmerTest R-package for automated mixed ANOVA modelling
Example 2. summary
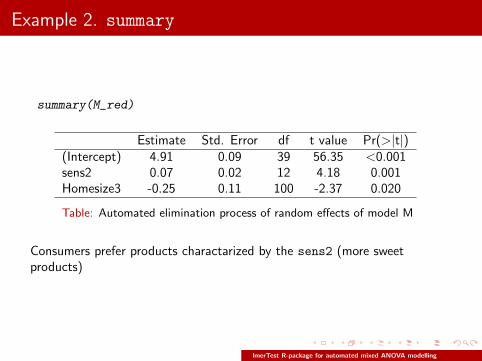
summary(M_red)
Estimate Std. Error df t value Pr(>|t|)(Intercept) 4.91 0.09 39 56.35 <0.001sens2 0.07 0.02 12 4.18 0.001Homesize3 -0.25 0.11 100 -2.37 0.020
Table: Automated elimination process of random effects of model M
Consumers prefer products charactarized by the sens2 (more sweetproducts)
lmerTest R-package for automated mixed ANOVA modelling
To remember!
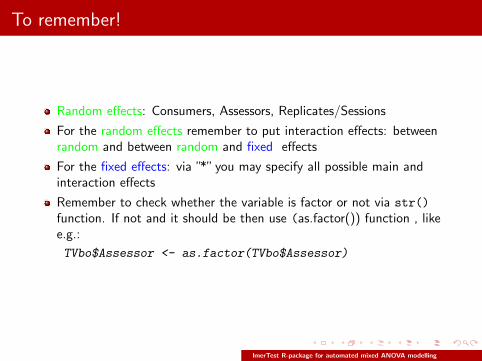
Random effects: Consumers, Assessors, Replicates/Sessions
For the random effects remember to put interaction effects: betweenrandom and between random and fixed effects
For the fixed effects: via ”*” you may specify all possible main andinteraction effects
Remember to check whether the variable is factor or not via str()
function. If not and it should be then use (as.factor()) function , likee.g.:
TVbo$Assessor <- as.factor(TVbo$Assessor)
lmerTest R-package for automated mixed ANOVA modelling
Getting started with lmerTest
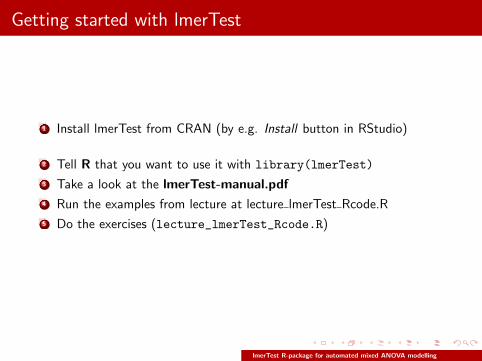
1 Install lmerTest from CRAN (by e.g. Install button in RStudio)
2 Tell R that you want to use it with library(lmerTest)
3 Take a look at the lmerTest-manual.pdf
4 Run the examples from lecture at lecture lmerTest Rcode.R
5 Do the exercises (lecture_lmerTest_Rcode.R)
lmerTest R-package for automated mixed ANOVA modelling
Bibliography I
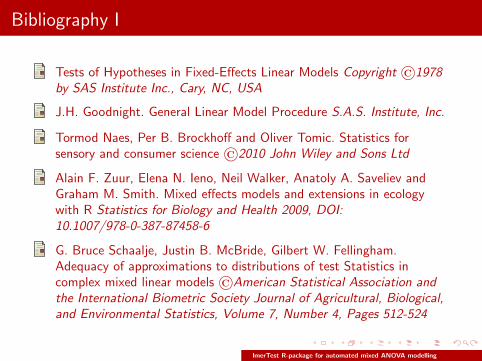
Tests of Hypotheses in Fixed-Effects Linear Models Copyright ©1978by SAS Institute Inc., Cary, NC, USA
J.H. Goodnight. General Linear Model Procedure S.A.S. Institute, Inc.
Tormod Naes, Per B. Brockhoff and Oliver Tomic. Statistics forsensory and consumer science ©2010 John Wiley and Sons Ltd
Alain F. Zuur, Elena N. Ieno, Neil Walker, Anatoly A. Saveliev andGraham M. Smith. Mixed effects models and extensions in ecologywith R Statistics for Biology and Health 2009, DOI:10.1007/978-0-387-87458-6
G. Bruce Schaalje, Justin B. McBride, Gilbert W. Fellingham.Adequacy of approximations to distributions of test Statistics incomplex mixed linear models ©American Statistical Association andthe International Biometric Society Journal of Agricultural, Biological,and Environmental Statistics, Volume 7, Number 4, Pages 512-524
lmerTest R-package for automated mixed ANOVA modelling
Bibliography II
Harry T. Lawless, Hildegarde Heymann. Sensory Evaluation of Food©2010 Springer Science+Business Media, LLC
lmerTest R-package for automated mixed ANOVA modelling


![lmerTest Presentation final PBB.ppt [Mode de compatibilité] · 2012. 8. 1. · Title: Microsoft PowerPoint - lmerTest_Presentation_final_PBB.ppt [Mode de compatibilité] Author:](https://img.pdfslide.us/doc/110x75/608b96ab9f1d6267d743b3ea/lmertest-presentation-final-pbbppt-mode-de-compatibilit-2012-8-1-title.jpg)


![Rosselli Del Turco - Mixed data, mixed audience [dh 2014]](https://img.pdfslide.us/doc/110x75/559678a71a28ab57498b47c5/rosselli-del-turco-mixed-data-mixed-audience-dh-2014.jpg)