Embed Size (px)
Citation preview
Insurance
www.fitchratings.com 26 August 2011
Reinsurers / United Kingdom
Lloyd’s of London Full Rating Report
Key Rating Drivers Resilience of Earnings: Fitch Ratings considers the resilience of Lloyd’s of London’s (Lloyd’s)
earnings in currently challenging market conditions, characterised by significant natural
catastrophe losses in Q111 and soft pricing conditions across some classes, to be the primary
rating driver. The agency will continue to assess the volatility of earnings at Lloyd’s in relation
to a range of European and Bermudian reinsurers that the agency considers to represent the
closest peer group.
PMD’s Market Oversight: Fitch views the Performance Management Directorate’s (PMD)
oversight of market participants as a key mechanism in improving earnings stability in the
medium term. The agency will continue to monitor the influence of the PMD’s efforts, paying
particular attention to cycle management, improved long-term profitability and the performance
of the market, which are the PMD’s stated areas of emphasis.
Financial Flexibility: The variety of funding sources for the Central Fund gives The Society of
Lloyd’s (the Society) significant financial flexibility. The Society has the ability to raise funds
both internally – through contributions, levies and syndicate loans – and externally through the
capital markets.
Capitalisation Remains Strong: Fitch anticipates that capitalisation will continue to support
the current rating, assuming further losses fall within boundaries anticipated by the market. The
three-layered capital structure at Lloyd’s (consisting of syndicates’ Premium Trust Funds
(PTFs), members’ Funds at Lloyd’s (FAL) and the Central Fund) remained strong in 2010,
despite an uptick in large loss activity during H110.
What Could Trigger a Rating Action Weakened Capitalisation: A marked erosion of capital, including Central Fund assets, or a
poor level of reported profitability relative to peers over a period of time could lead to a
downgrade of the ratings.
Reduced Earnings Volatility: Key drivers for an upgrade would be a reduced level of earnings
volatility versus peers in the wake of a large catastrophe event, or evidence of earnings
resilience during a prolonged period of increased attritional losses and lower premium pricing
conditions.
Ratings Lloyd’s of London Insurer Financial Strength Rating A+
The Society of Lloyd’s Long-Term IDR A Subordinated debt BBB+
Lloyd’s Insurance Company (China) Ltd Insurer Financial Strength Rating A+
Outlooks Insurer Financial Strength Ratings Stable Long-Term IDR Stable
Financial Data Lloyd’s of London 2010 2009
Total assets (GBPm) 70,610 67,290 Total liabilities (GBPm) 52,419 49,127 Gross written premiums (GBPm)
22,592 21,973
Pre-tax profit (GBPm) 2,195 3,868 Combined ratio (%) 93.3 86.1 Return on capital (%) 12.1 23.9
Related Research UK Non-Life Insurance – Profitability: Capital is Both the Problem and the Solution (June 2011)
Hurricane Season 2011: A desk Reference for Insurance Investors (May 2011)
Analysts Martyn Street +44 20 3530 1211 [email protected] Sonja Zinner +44 20 3530 1321 [email protected]
Amendment This report, which was originally
published on 25 August 2011, is
being amended to change Figure 6,
Figure 15 and to remove the term
"IFRS" in Figures 16, 17 & 18."
Insurance
Lloyd’s of London
August 2011 2
Company Profile Unique Ownership Structure Viewed as Marginal Positive
Fitch considers the unique corporate structure of Lloyd’s, being a marketplace rather than a
corporation, as marginally positive for its ratings compared to traditional corporate reinsurers.
This view considers two primary factors: (i) the “Chain of Security,” which provides a mixture of
several and mutual claims-paying capital, and (ii) the subscription basis of underwriting used
within Lloyd’s, allowing large complex risks to be underwritten by a group of syndicates.
Strong Market Position and Management Strategy Supportive of Rating Globally renowned (re)insurance market
Product diversification stronger by class than by geography
Broker-led distribution model
Underwriting syndicates a unique market feature
Clearly defined and consistent strategy viewed positively.
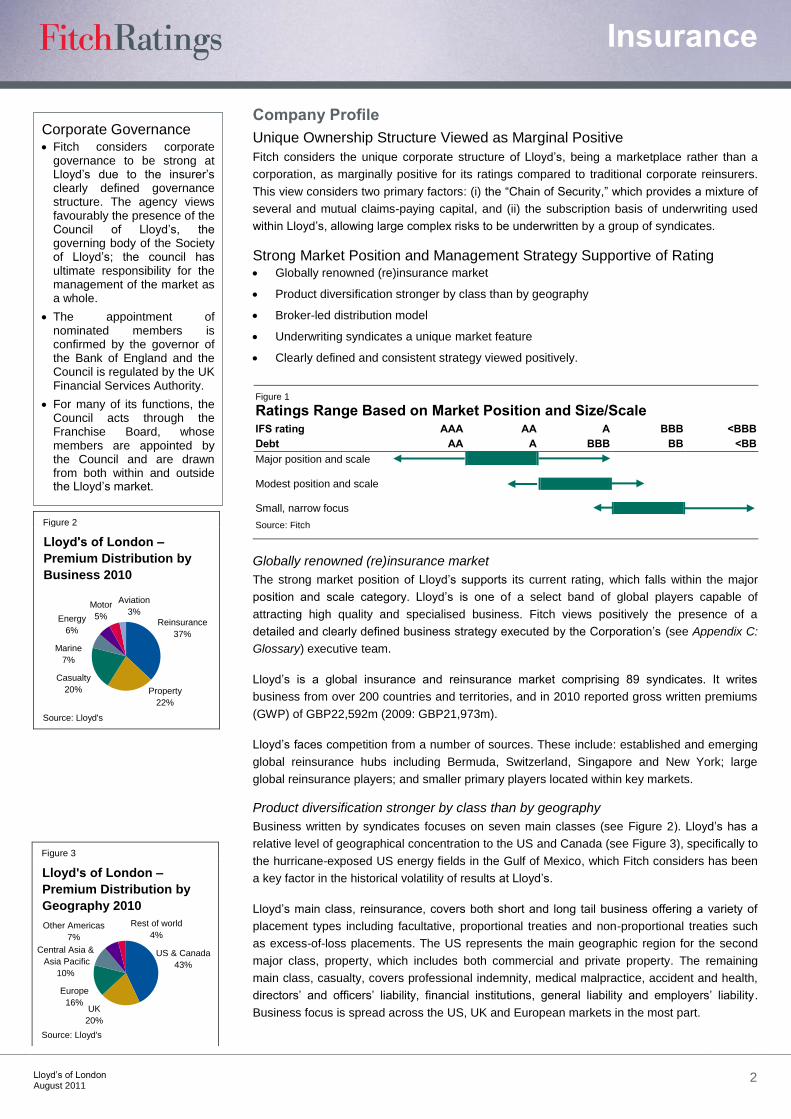
Figure 1 Ratings Range Based on Market Position and Size/Scale IFS rating AAA AA A BBB <BBB Debt AA A BBB BB <BB Major position and scale Modest position and scale Small, narrow focus
Source: Fitch
Globally renowned (re)insurance market
The strong market position of Lloyd’s supports its current rating, which falls within the major
position and scale category. Lloyd’s is one of a select band of global players capable of
attracting high quality and specialised business. Fitch views positively the presence of a
detailed and clearly defined business strategy executed by the Corporation’s (see Appendix C:
Glossary) executive team.
Lloyd’s is a global insurance and reinsurance market comprising 89 syndicates. It writes
business from over 200 countries and territories, and in 2010 reported gross written premiums
(GWP) of GBP22,592m (2009: GBP21,973m).
Lloyd’s faces competition from a number of sources. These include: established and emerging
global reinsurance hubs including Bermuda, Switzerland, Singapore and New York; large
global reinsurance players; and smaller primary players located within key markets.
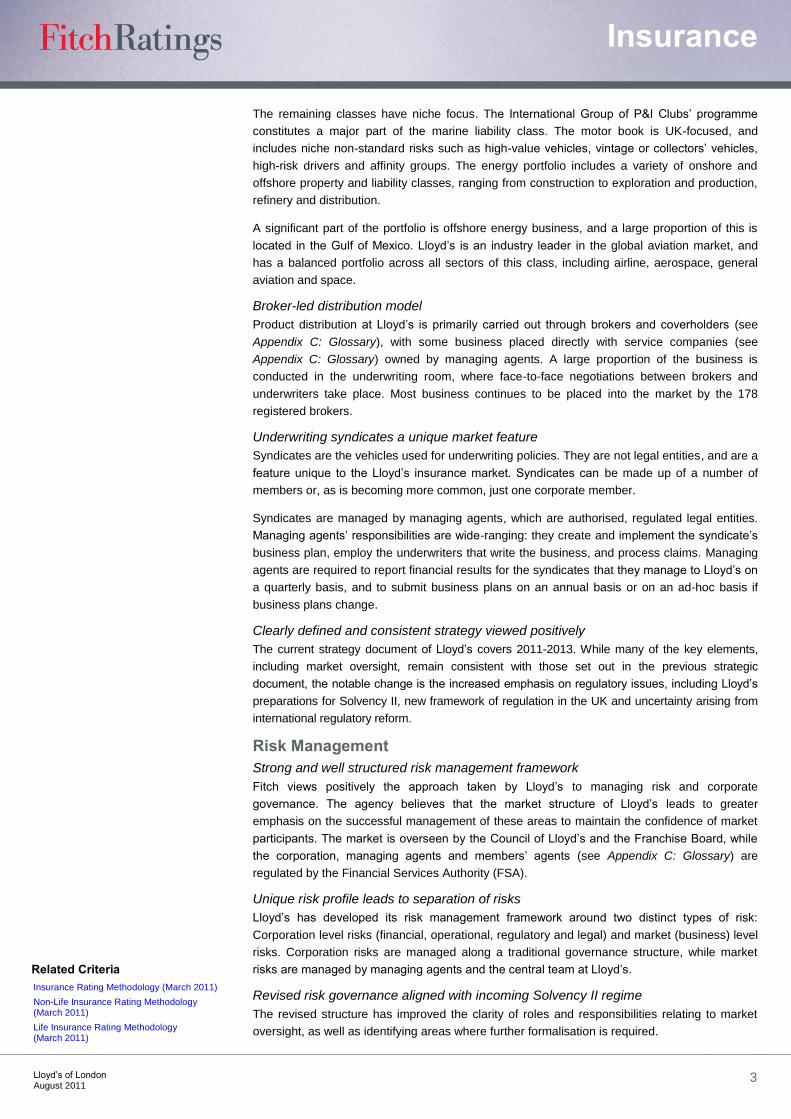
Product diversification stronger by class than by geography
Business written by syndicates focuses on seven main classes (see Figure 2). Lloyd’s has a
relative level of geographical concentration to the US and Canada (see Figure 3), specifically to
the hurricane-exposed US energy fields in the Gulf of Mexico, which Fitch considers has been
a key factor in the historical volatility of results at Lloyd’s.
Lloyd’s main class, reinsurance, covers both short and long tail business offering a variety of
placement types including facultative, proportional treaties and non-proportional treaties such
as excess-of-loss placements. The US represents the main geographic region for the second
major class, property, which includes both commercial and private property. The remaining
main class, casualty, covers professional indemnity, medical malpractice, accident and health,
directors’ and officers’ liability, financial institutions, general liability and employers’ liability.
Business focus is spread across the US, UK and European markets in the most part.
Figure 2
Motor
5%Energy
6%
Marine
7%
Lloyd's of London –
Premium Distribution by
Business 2010
Source: Lloyd's
Reinsurance
37%
Property
22%
Casualty
20%
Aviation
3%
Figure 3
UK
20%
Europe
16%
Lloyd's of London –
Premium Distribution by
Geography 2010
Source: Lloyd's
US & Canada
43%
Central Asia &
Asia Pacific
10%
Other Americas
7%
Rest of world
4%
Corporate Governance Fitch considers corporate
governance to be strong at Lloyd’s due to the insurer’s clearly defined governance structure. The agency views favourably the presence of the Council of Lloyd’s, the governing body of the Society of Lloyd’s; the council has ultimate responsibility for the management of the market as a whole.
The appointment of nominated members is confirmed by the governor of the Bank of England and the Council is regulated by the UK Financial Services Authority.
For many of its functions, the Council acts through the Franchise Board, whose members are appointed by the Council and are drawn from both within and outside the Lloyd’s market.
Insurance
Lloyd’s of London
August 2011 3
The remaining classes have niche focus. The International Group of P&I Clubs’ programme
constitutes a major part of the marine liability class. The motor book is UK-focused, and
includes niche non-standard risks such as high-value vehicles, vintage or collectors’ vehicles,
high-risk drivers and affinity groups. The energy portfolio includes a variety of onshore and
offshore property and liability classes, ranging from construction to exploration and production,
refinery and distribution.
A significant part of the portfolio is offshore energy business, and a large proportion of this is
located in the Gulf of Mexico. Lloyd’s is an industry leader in the global aviation market, and
has a balanced portfolio across all sectors of this class, including airline, aerospace, general
aviation and space.
Broker-led distribution model
Product distribution at Lloyd’s is primarily carried out through brokers and coverholders (see
Appendix C: Glossary), with some business placed directly with service companies (see
Appendix C: Glossary) owned by managing agents. A large proportion of the business is
conducted in the underwriting room, where face-to-face negotiations between brokers and
underwriters take place. Most business continues to be placed into the market by the 178
registered brokers.
Underwriting syndicates a unique market feature
Syndicates are the vehicles used for underwriting policies. They are not legal entities, and are a
feature unique to the Lloyd’s insurance market. Syndicates can be made up of a number of
members or, as is becoming more common, just one corporate member.
Syndicates are managed by managing agents, which are authorised, regulated legal entities.
Managing agents’ responsibilities are wide-ranging: they create and implement the syndicate’s
business plan, employ the underwriters that write the business, and process claims. Managing
agents are required to report financial results for the syndicates that they manage to Lloyd’s on
a quarterly basis, and to submit business plans on an annual basis or on an ad-hoc basis if
business plans change.
Clearly defined and consistent strategy viewed positively
The current strategy document of Lloyd’s covers 2011-2013. While many of the key elements,
including market oversight, remain consistent with those set out in the previous strategic
document, the notable change is the increased emphasis on regulatory issues, including Lloyd’s
preparations for Solvency II, new framework of regulation in the UK and uncertainty arising from
international regulatory reform.
Risk Management Strong and well structured risk management framework
Fitch views positively the approach taken by Lloyd’s to managing risk and corporate
governance. The agency believes that the market structure of Lloyd’s leads to greater
emphasis on the successful management of these areas to maintain the confidence of market
participants. The market is overseen by the Council of Lloyd’s and the Franchise Board, while
the corporation, managing agents and members’ agents (see Appendix C: Glossary) are
regulated by the Financial Services Authority (FSA).
Unique risk profile leads to separation of risks
Lloyd’s has developed its risk management framework around two distinct types of risk:
Corporation level risks (financial, operational, regulatory and legal) and market (business) level
risks. Corporation risks are managed along a traditional governance structure, while market
risks are managed by managing agents and the central team at Lloyd’s.
Revised risk governance aligned with incoming Solvency II regime
The revised structure has improved the clarity of roles and responsibilities relating to market
oversight, as well as identifying areas where further formalisation is required.
Related Criteria Insurance Rating Methodology (March 2011)
Non-Life Insurance Rating Methodology (March 2011)
Life Insurance Rating Methodology (March 2011)

Insurance
Lloyd’s of London
August 2011 4
Organisational Structure
Figure 4
Structure Diagram
Source: Lloyd's, Fitch
Policyholders
Business Flow Capital Flow
Corporation of Lloyd’s
Managing Agents SyndicatesThe Market
Distribution Channel
Brokers
Coverholders
Service Companies
Members
Corporate
Non-Corporate (via Member’s Agents
Industry Profile and Operating Environment
Figure 5 Ratings Range Based on Industry Profile/Operating Environment IFS rating AAA AA A BBB <BBB Debt AA A BBB BB <BB Primary — casualty lines
Primary — property lines
Reinsurance lines
Composite
Source: Fitch
Reinsurance Industry Supports Wide Range of Ratings
The provision by reinsurers of risk-transfer services for the primary insurance industry generally
requires companies operating in this sector to hold higher quality credit ratings. The achievable
range of ratings reflects:
Generally low barriers to entry
The reinsurance industry generally has low barriers to entry, as seen by the wave of start-up
reinsurers (primarily in Bermuda) entering the market following significant catastrophe events.
Fitch notes that the barriers to entry to Lloyd’s itself are quite high, with the PMD keeping a
tight control on the number of new syndicates and managing agents entering the Market. One
reason for this is to protect the mutual capital layers from unscrupulous underwriting.
Cyclical pricing
Reinsurers are generally more susceptible to cyclical pricing trends, which fundamentally result
from changes in supply and demand for different business lines.
Sovereign and Macroeconomic Risks United Kingdom Foreign Currency Long-Term IDR AAA Short-Term IDR F1+
Local Currency Long-Term IDR AAA Country Ceiling AAA
Outlooks Stable
Strength Delivery of government deficit reduction would help underpin the UK’s AAA rating.
Weakness Possibility of negative growth and inflationary surprises.

Insurance
Lloyd’s of London
August 2011 5
Peer Analysis Favourable performance compared with peers
Due to its unique structure and mix of business underwritten, Lloyd’s has no directly
comparable peers. However, meaningful comparison can still be made with large global
reinsurance players.
Solid underwriting performance
Among these companies, Lloyd’s ranked second by net earned premium in 2010, and
performed well against its peers on underwriting profitability, achieving the lowest combined
ratio in 2010 at 93.3% (see figure 6).
Figure 6
Peer Comparisons (2010) Combined ratio (%)
IFS Rating 2010 2009 Q111 Q110 ROE (%) Net earned premiums
(EURm) Munich Re AA− 100.5 95.3 159.4 109.2 11.1 43,075
Lloyd’s A+ 93.3 86.1 NR NR 12.1 19,914 Swiss Re Not rated 93.9 95.3 163.7 109.4 8.2 14,476 Hannover Re A+ 98.2 96.6 123.8 99.3 23.2 10,047 Partner Re AA− 95.0 81.8 193.7 116.9 11.8 3,518
Source: Fitch and company financial statements Note: Premiums converted to Euro at 2010 average exchange rates

Insurance
Lloyd’s of London
August 2011 6
Capital Strength Derived from Member and Central Capital Growth of Members’ Funds improves risk-adjusted capitalisation
Financial leverage remains at a modest level
Modest Total Financing Commitments (TFC) ratio
Risk-based approach to setting capital at member level and central capital
Fitch considers the capitalisation of Lloyd’s to be supportive of its current rating, with strength
being derived from assets held as part of member capital and central capital. Capital and
reserves were largely unchanged at GBP18.2bn at end-2010, while both leverage and the total
financing commitments ratio remained at modest levels at end-2010. Assuming a normalised
level of large losses for the rest of 2011, Fitch anticipates that capitalisation will remain broadly
similar to that reported at end-2010.
Growth of Members’ Funds improves risk-adjusted capitalisation
Considered on Fitch’s risk-adjusted basis, the capitalisation of Lloyd’s improved marginally in
2008 to 2010, as growth in Members’ Funds has outstripped growth in net written premiums
(NWP), which represents a key element of the risk-based capital charges.
Financial leverage remains at a modest level
Financial leverage, as calculated by Fitch, remained unchanged at 6% at end-2010 (end-2009:
6%). Fitch notes that, in 2009, Lloyd’s repurchased the equivalent of £102m of outstanding
debt. During 2010, a further GBP21m was repurchased.
Modest Total Financing Commitments (TFC) ratio
Lloyds’ TFC ratio remained at a modest level at end-2010, improving to 12% (end-2009: 18%).
The primary driver was a reduction in the value of contingent liabilities captured under the ratio.
Risk-based approach to setting capital at member level and central capital
At member level, capital is set at 135% of the syndicate’s Individual Capital Assessment (ICA)
result. This percentage has not changed since 2006. Lloyd’s reviews each syndicate’s ICA in
detail, and requires loadings if it deems the syndicate’s calculations deficient. Lloyd’s believes
that the 35% uplift allows for sufficient capital to maintain financial strength and credit ratings at
their current levels. In 2011, Lloyd’s has maintained its 35% uplift, and continues to review its
methodology to reflect changing market, macroeconomic and legislative conditions.
Figure 7 Capitalisation and Leverage (GBPm) 2006 2007 2008 2009 2010 Fitch’s expectation Adjusted debt leverage (%)
4 9 9 6 6 Leverage will remain largely unchanged or reduce slightly in the near-term. Assuming that major losses fall within the bounds anticipated by the market for the remainder of 2011, Fitch does not foresee a significant change in the level of capitalisation in the near term.
Estimated statutory solvency surplus
1,801 2,297 2,475 2,756 2,923
Source: Fitch

Insurance
Lloyd’s of London
August 2011 7
Strong Debt-Servicing Capability and Good Financial Flexibility Ability to service debt expected to remain strong
Flexibility of repayment options
No immediate maturities
Fitch anticipates that the ability of Lloyd’s to service its debt obligations will remain strong in the
foreseeable future. The agency notes that Lloyd’s has a variety of mechanisms available to
raise capital, including member calls, Central Fund contributions, increased loading for required
capital on top of ICA, charging premium levy and raising subordinated debt.
Ability to service debt expected to remain strong
Lloyd’s continues to exhibit a strong debt-servicing capability, despite a reduction in the level of
interest coverage since 2008. Fitch anticipates that this coverage will decrease for 2011, due to
lower reported net income.
Flexibility of repayment options
In a going-concern scenario, the Society has several options available for the repayment of
principal and interest, as it has complete discretion over the use of the Central Fund. The
Central Fund receives a regular supply of funds from syndicate contributions, syndicate loans
and investment income. Moreover, if necessary, the Society could increase members’
contributions, impose a premium levy (as it has in the past) or use the callable layer. These can
all be used on an ongoing basis to pay the interest on the debt.
No immediate maturities
Lloyd’s has no immediate debt falling due, with the outstanding issues having call dates in 2014
and 2015. The subordinated debt issued in 2004 and 2007 are obligations of the Society.
Figure 8 Debt-Servicing Capability and Financial Flexibility (GBPm) 2006 2007 2008 2009 2010 Fitch’s expectation Interest coverage – Market (x) 80.6 84.6 27.3 55.5 33.3 Interest coverage will remain strong in the medium term, although the
level of absolute coverage for 2011 is expected to be lower, reflecting the agency’s expectations for a lower level of reported profitability. Fitch does not foresee a significant increase in interest expense in the near-term.
Interest coverage – Society (x) 2.5 3.1 1.4 2.1 4.9 Interest paid 46.0 46.0 72.1 71.0 68.0
Source: Fitch
Insurance
Lloyd’s of London
August 2011 8
Catastrophe Losses Key Near-Term Earnings Driver Continued assessment of PMD’s ability to regulate earnings volatility
Reinsurance: largest class will take significant share of catastrophe losses
Property: competition maintains pricing pressure
Casualty: Longer-tail lines exposed to low-yielding investment horizon
Marine: Industry recovery suggests slow improvement
Energy: Recent trend of low losses keeps rates under pressure
Motor: Controlling claims costs viewed as a priority
Aviation: High frequency of losses fails to dampen capacity
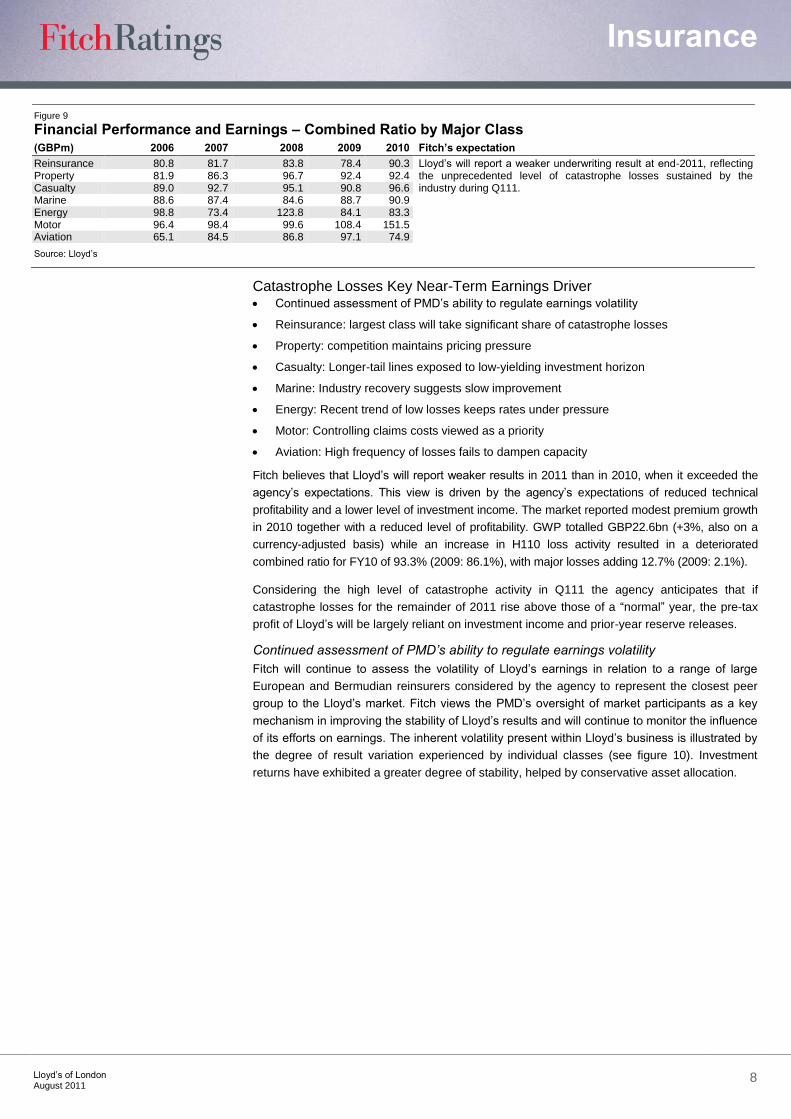
Fitch believes that Lloyd’s will report weaker results in 2011 than in 2010, when it exceeded the
agency’s expectations. This view is driven by the agency’s expectations of reduced technical
profitability and a lower level of investment income. The market reported modest premium growth
in 2010 together with a reduced level of profitability. GWP totalled GBP22.6bn (+3%, also on a
currency-adjusted basis) while an increase in H110 loss activity resulted in a deteriorated
combined ratio for FY10 of 93.3% (2009: 86.1%), with major losses adding 12.7% (2009: 2.1%).
Considering the high level of catastrophe activity in Q111 the agency anticipates that if
catastrophe losses for the remainder of 2011 rise above those of a “normal” year, the pre-tax
profit of Lloyd’s will be largely reliant on investment income and prior-year reserve releases.
Continued assessment of PMD’s ability to regulate earnings volatility
Fitch will continue to assess the volatility of Lloyd’s earnings in relation to a range of large
European and Bermudian reinsurers considered by the agency to represent the closest peer
group to the Lloyd’s market. Fitch views the PMD’s oversight of market participants as a key
mechanism in improving the stability of Lloyd’s results and will continue to monitor the influence
of its efforts on earnings. The inherent volatility present within Lloyd’s business is illustrated by
the degree of result variation experienced by individual classes (see figure 10). Investment
returns have exhibited a greater degree of stability, helped by conservative asset allocation.
Figure 9 Financial Performance and Earnings – Combined Ratio by Major Class (GBPm) 2006 2007 2008 2009 2010 Fitch’s expectation Reinsurance 80.8 81.7 83.8 78.4 90.3 Lloyd’s will report a weaker underwriting result at end-2011, reflecting
the unprecedented level of catastrophe losses sustained by the industry during Q111.
Property 81.9 86.3 96.7 92.4 92.4 Casualty 89.0 92.7 95.1 90.8 96.6 Marine 88.6 87.4 84.6 88.7 90.9 Energy 98.8 73.4 123.8 84.1 83.3 Motor 96.4 98.4 99.6 108.4 151.5 Aviation 65.1 84.5 86.8 97.1 74.9
Source: Lloyd’s

Insurance
Lloyd’s of London
August 2011 9
Figure 10
Energy
AviationReinsurance
Property
Casualty
Marine
75
80
85
90
95
100
105
110
0 5 10 15 20 25 30
Lloyd's by Major Business CategoryVolatility of combined ratio, 2006-10
(Average combined ratio, 2006-10)
Size of bubble denotes GWP
Source: Fitch, Lloyd's
(Standard deviation, 2006-10)
Average = 89.9%
Average = 5.8%
Reinsurance: largest class will take significant share of catastrophe losses
Fitch anticipates that the dominant property sub-treaty class will incur a significant proportion of
the losses arising from the catastrophe events witnessed so far during 2011. The agency notes
that this was the case in 2010, when catastrophe losses in H110 left underwriting profitability
almost entirely dependent on prior-year reserve surplus.
Property: competition maintains pricing pressure
Abundant capacity has caused pricing and terms and conditions to remain under pressure.
Fitch also expects catastrophe losses to influence results for 2011. As with the reinsurance
class, the 2010 property underwriting result was largely supported by prior year surplus for
profitability.
Casualty: Longer-tail lines exposed to low-yielding investment horizon
Capacity continues to remain in this class despite the challenging outlook, although all of 2010
underwriting profitability came from prior-year surpluses. While some uncertainty remains
regarding a possible increase in claims arising from the financial crisis, Fitch will continue to
closely assess the overall adequacy of reserves for this class.
Marine: Industry recovery suggests slow improvement
While continuing strong capacity is likely to hamper any significant rate increases Fitch
anticipates that the 2011 underwriting result will be similar to that achieved in 2010.
Energy: Recent trend of low losses keeps rates under pressure
The positive technical results reported by this class in 2009 and 2010 were due to the large
hurricanes in these seasons avoiding the major US energy fields. Strong capacity continues to
keep terms and conditions under pressure, placing greater emphasis on underwriting control of
what is a highly technical class.
Motor: Controlling claims costs viewed as a priority
Fitch anticipates that the pace of premium rate increases, compared with those achieved in
2010, will slow during 2011. It remains uncertain as to whether the marked increase in pricing
achieved over the last 18 months will be sufficient to restore technical profitability in this class
and the agency believes that successful claim cost control is a key factor in this context.
Aviation: High frequency of losses fails to dampen capacity
Lloyd’s smallest class achieved an improved technical result in 2010 despite a relatively high
number of large losses. With the market continuing to supply adequate capacity, the rating
environment for 2011 continues to look challenging.

Insurance
Lloyd’s of London
August 2011 10
Conservative investment policy for all links in the Chain of Security PTFs: First source of policyholder repayment is high quality and liquid
FAL: Second repayment layer Support Point
Central Fund: Mutual layer available at discretion of Council of Lloyd’s
Strong Liquidity position supported by high quality, liquid assets
Fitch considers the overall asset allocation for Lloyd’s to be fairly conservative when looking at
the aggregate of Premium Trust Funds (PTFs), Funds at Lloyd’s (FAL) and the Central Fund.
However, the agency notes that substantial variation exists at the PTF and FAL levels for
individual syndicates.
PTFs: First source of policyholder repayment is high quality and liquid
PTFs are the first resource for paying policyholder claims from a syndicate. Investments are
generally invested in liquid, short-duration, high-quality assets. Around 81% of assets are
invested in bonds. Of the 44% of investments held in corporate bonds, 92% are rated ‘A’ or
above.
FAL: Second repayment layer Support Point
FAL represent the second layer of capital provided by members to support their underwriting.
The amount of deposited funds is determined by the Corporation, reviewing each syndicate’s
ICA and applying an uplift based upon the syndicate’s business proposal. The capital is held in
trust as readily realisable assets. Letters of Credit (LOCs) continue to represent a significant
proportion of assets within FAL (49% at end-2010). Fitch notes that the largest providers of
LOC facilities have remained constant through the credit crisis.
Central Assets: Mutual layer available at discretion of Council of Lloyd’s
Central Assets at Lloyd’s are the third level of security, and are available at the discretion of the
Council of Lloyd’s to meet any valid claim that cannot be met by the resources of any member.
The Central Assets value at end-2010 was GBP2.4bn, with 80% of the portfolio invested in
bonds.
Strong Liquidity position supported by high quality, liquid assets
Lloyd’s maintains a strong liquidity position, which is supported by a significant level of high-
quality liquid assets held at both the FAL and Central Fund asset levels.
Figure 11 Investments and Asset Risk (GBPm) 2006 2007 2008 2009 2010 Fitch’s expectation Invested assets 35,108 36,990 44,377 46,264 48,494 Investment profile and strategy will remain fairly constant in the
near term. Currently, the greatest challenge is the persistence of a low yielding investment environment, which would continue to place pressure on earnings.
Investment return (%) 4.7 5.6 2.4 3.9 2.7 Liquid assets/tech reserves (%) 136.0 140.6 131.5 147 143.3
Source: Fitch
Figure 12
Syndicate PTF InvestmentsEnd-2010
Source: Lloyd's
Corporate
bonds
44%Government
bonds
37%
Cash or equiv.
17%
Equities & alternative invest.
2%
Figure 13
Cash
9%
Members’ FAL InvestmentsEnd-2010
Source: Lloyd's
Letters of credit/
bank guarantee
49%
Corporate
bonds
20%
Government
bonds
15%
Equities
7%
Figure 14
Central Fund InvestmentsEnd-2009
Source: Lloyd's
Government
bond
46%Corporate
bond
33%
Cash or equiv.
3%
Hedge funds
4%
Property
3%
Equities
11%

Insurance
Lloyd’s of London
August 2011 11
Prior Year Surplus Continues to be Generated by Majority of Classes Motor development worsens
Casualty strengthening suggests further challenges
Reserving position has greatly improved following Equitas
This trend was driven by favourable claims experiences across most of Lloyds’ main classes,
which resulted in a 5.9% improvement in the calendar-year combined ratio (2009: 5.6%). Less
favourable developments occurred within the motor and casualty classes, where the level of
surplus was much reduced from 2009, following the strengthening of more recent underwriting
years.
Motor development worsens
Reserve releases were again reported across all major classes of business, with the exception
of the motor account, where the deterioration added 36.7% to the combined ratio (2009: 3.9%).
Fitch views the level of prior-year deterioration in this class as surprising, and will continue to
monitor future developments.
Casualty strengthening suggests further challenges
The challenging outlook for this major class was reflected by the strengthening seen in the
more recent underwriting years, which sharply reduced the overall release. While the ultimate
level of claims arising from the financial crisis remains unclear, the agency views strengthening
efforts positively, although it remains cautious about future development.
Reserving position has greatly improved following Equitas
The reserving position of Lloyd’s has improved significantly since the 1992-and-prior liabilities
were reinsured into Equitas in 1996 and then subsequently further reinsured with the Berkshire
Hathaway Phase 1 and Phase 2 deals in 2007 and 2009 respectively. With the transfer of long-
tailed liabilities into Equitas, the reserving position of Lloyd’s is now much less volatile, as the
proportion of long-tailed liabilities has significantly diminished.
Reinsurance, Risk Mitigation and Catastrophe Risk Reduced Reinsurance Recoverable; Credit Quality of Reinsurers is Good Falling external reinsurance utilisation rate
Lloyd’s has continued to manage its reinsurance recoverables, which at end-2010 stood at
GBP9.2bn (+1.1%), significantly down from a peak of GBP17.4bn at the end of 2001 following
the 11 September 2001 terrorist attack in the US. Fitch regards the reinsurance recoverables
as generally high quality, with 93% of counterparties rated ‘A’ or above.
Falling external reinsurance utilisation rate
Each syndicate is required to make its own reinsurance arrangements. Across the market, the
“external” reinsurance utilisation rate is around 22% (2009: 22%), down from a high of 25% in
2003. Reinsurance within the market between syndicates is excluded from this ratio.
Figure 15 Reserve Adequacy – Prior Year Reserve Movement % Movement in Combined Ratio 2006 2007 2008 2009 2010 Fitch’s expectation Reinsurance 3.8 -4.6 -12.1 -5.8 -9.5 Continued caution regarding the level of surplus that will be generated by
prior underwriting years. Of the seven classes, the future development of the casualty and motor reserves will receive the greatest scrutiny.
Property -4.3 -6.0 -6.5 -3.4 -6.7 Casualty -7.3 -9.1 -8.8 -8.3 -4.5 Marine -10.4 -7.6 -7.8 -7.4 -7.5 Energy 15.1 -3.9 -8.2 -6.2 -18.3 Motor -5.3 -6.4 -1.3 3.9 36.7 Aviation -22.3 -18.3 -23.7 -16.6 -24.5
Note: Negative figures indicate a surplus development from prior years, whereas positive figures indicate a deficit. Source: Fitch

Insurance
Lloyd’s of London
August 2011 12
Appendix A: Financial Statements
Figure 16 Lloyd’s of London: Summary Rating Data (GBPm) 2006 2007 2008 2009 2010 Key financials Total revenue 14,930 15,263 15,174 18,987 18,914 Operating result 3,757 4,060 2,083 4,018 2,333 Net income 3,662 3,846 1,899 3,868 2,195 Combined ratio (%) 82.8 83.9 91.2 85.9 93.1 Return on revenue (%) 25.3 26.6 13.7 21.2 12.3 Total assets 42,503 44,007 53,597 55,179 58,002 Total adjusted equity 12,836 13,449 14,182 18,163 18,191 Coverage of the estimated minimum margin (x) 6.1 6.3 6.2 6.6 6.4 Business statistics Total gross written premiums 16,414 16,366 17,985 21,973 22,592 Annual change (%) 9.6 -0.3 9.9 22.2 2.8 Total net written premiums 13,201 13,256 14,217 17,218 17,656 Annual change (%) 12.2 0.4 7.2 21.1 2.5 Operating statistics Total revenue 14,930 15,263 15,174 18,987 18,914 Operating result 3,757 4,060 2,083 4,018 2,333 Net income 3,662 3,846 1,899 3,868 2,195 Return on revenue (ex. gains) (%) 25.3 26.6 13.7 21.2 12.3 Return on assets (incl. gains) (%) 8.5 8.9 3.9 7.0 3.8 Return on adj. equity (incl. gains) (%) 31.4 29.3 13.4 21.3 12.1 Non-life Incurred loss ratio (%) 49.0 50.0 61.4 51.6 58.6 Commission ratio (%) 25.1 26.3 27.0 26.4 27.4 Expense ratio (%) 6.9 8.4 8.9 7.6 8.4 Reins. comm., profit participation, other ratio (%) 1.7 -0.9 -6.0 0.4 -1.3 Combined ratio (%) 82.8 83.9 91.2 85.9 93.1 Portfolio performance Net investment income 1,729 2,007 957 1,769 1,258 Running yield (%) 4.9 5.6 2.4 3.9 2.7 Running yield on technical reserves (%) 3.6 4.7 1.8 4.1 2.7 Total yield (incl. unrealised gains) (%) 4.9 5.6 2.4 3.9 2.7 Portfolio composition (%) Real estate 0.0 0.0 0.0 0.0 0.0 Shares 11.1 11.5 10.2 10.9 12.0 Bonds 54.6 56.3 56.7 58.1 59.6 Cash and bank deposits 34.2 32.2 33.0 30.8 28.3 Other assets 0.1 0.0 0.1 0.2 0.1 Financial statistics Total assets 42,503 44,007 53,597 55,179 58,002 Total adjusted equity 12,836 13,449 14,182 18,163 18,191 Change in adj. equity (%) 22.4 4.8 5.5 28.1 0.2 Coverage of the estimated minimum margin (x) 6.1 6.3 6.2 6.6 6.4 Non-life technical reserves/non-life NPW (%) 195.4 198.5 237.2 182.6 191.5 Non-life claims reserves/non-life NPW (%) 160.0 162.4 196.4 148.8 155.9 Technical reserves/adj. equity (%) 200.9 195.6 237.8 173.1 185.9 Invested assets/(adj. equity + technical reserves) (%) 90.9 93.0 92.6 93.3 93.2 Liquid assets/technical reserves (%) 136.0 140.6 131.5 147.0 143.3 Investment leverage (%) 30.3 31.6 31.9 27.8 32.1 Debt/capital (%) 3.7 7.0 7.1 5.0 4.9 Non-life reinsurance utilisation ratio (%) 19.6 19.0 21.0 21.6 21.8
Source: Fitch-adjusted company audited financial statements

Insurance
Lloyd’s of London
August 2011 13
Figure 17 Lloyd’s of London: Profit & Loss Account (GBPm) 2006 2007 2008 2009 2010 Technical account Gross written premiums 16,414 16,366 17,985 21,973 22,592 Premiums ceded -3,213 -3,110 -3,768 -4,755 -4,936 Net written premiums 13,201 13,256 14,217 17,218 17,656 Change in unearned premium reserve 513 159 421 493 545 Net premiums earned 12,688 13,097 13,796 16,725 17,111 Gross claims paid 11,718 8,741 9,736 11,544 11,565 Reinsurance recoveries -5,120 -2,515 -2,158 -2,469 -2,751 Net claims paid 6,598 6,226 7,578 9,075 8,814 Change in claims case reserves -379 321 886 -451 1,215 Net claims incurred 6,219 6,547 8,464 8,624 10,029 Acquisition costs 3,191 3,449 3,720 4,408 4,692 Administrative expenses 910 1,117 1,267 1,304 1,475 Other underwriting income/(expenses) -226 115 853 -69 228 Total underwriting expenses (incl. FX) 4,327 4,451 4,134 5,781 5,939 Technical interest 957 1,223 543 1,344 865 Underwriting result 3,099 3,322 1,741 3,664 2,008 Non-technical account Investment income 1,729 2,007 957 1,769 1,258 Less technical interest -957 -1,223 -543 -1,344 -865 Net investment income 772 784 414 425 393 Interest paid 46 46 74 71 68 Operating result 3,871 4,106 2,155 4,089 2,333 Other income/(expenses) -95 -214 -184 -150 -138 Pre-tax profit 3,662 3,846 1,899 3,868 2,195 Reported net income 3,662 3,846 1,899 3,868 2,195
Source: Fitch-adjusted company audited financial statements
Insurance
Lloyd’s of London
August 2011 14
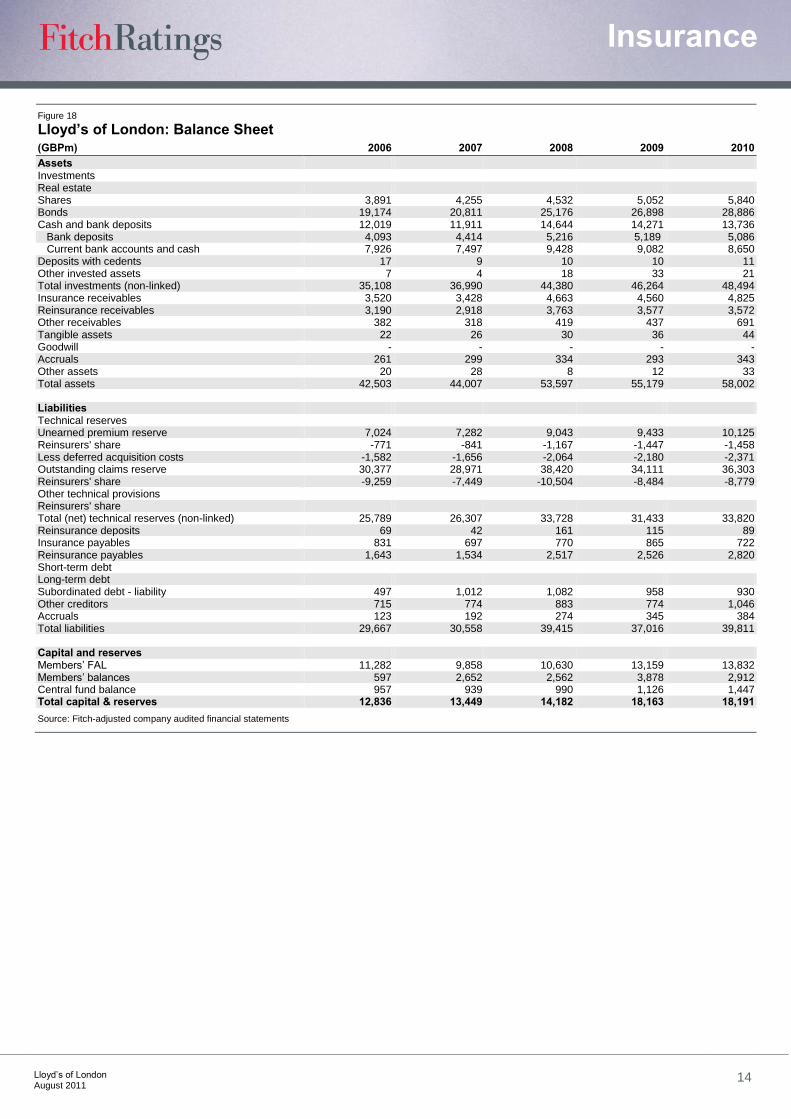
Figure 18 Lloyd’s of London: Balance Sheet (GBPm) 2006 2007 2008 2009 2010 Assets Investments Real estate Shares 3,891 4,255 4,532 5,052 5,840 Bonds 19,174 20,811 25,176 26,898 28,886 Cash and bank deposits 12,019 11,911 14,644 14,271 13,736 Bank deposits 4,093 4,414 5,216 5,189 5,086 Current bank accounts and cash 7,926 7,497 9,428 9,082 8,650 Deposits with cedents 17 9 10 10 11 Other invested assets 7 4 18 33 21 Total investments (non-linked) 35,108 36,990 44,380 46,264 48,494 Insurance receivables 3,520 3,428 4,663 4,560 4,825 Reinsurance receivables 3,190 2,918 3,763 3,577 3,572 Other receivables 382 318 419 437 691 Tangible assets 22 26 30 36 44 Goodwill - - - - - Accruals 261 299 334 293 343 Other assets 20 28 8 12 33 Total assets 42,503 44,007 53,597 55,179 58,002 Liabilities Technical reserves Unearned premium reserve 7,024 7,282 9,043 9,433 10,125 Reinsurers' share -771 -841 -1,167 -1,447 -1,458 Less deferred acquisition costs -1,582 -1,656 -2,064 -2,180 -2,371 Outstanding claims reserve 30,377 28,971 38,420 34,111 36,303 Reinsurers' share -9,259 -7,449 -10,504 -8,484 -8,779 Other technical provisions Reinsurers' share Total (net) technical reserves (non-linked) 25,789 26,307 33,728 31,433 33,820 Reinsurance deposits 69 42 161 115 89 Insurance payables 831 697 770 865 722 Reinsurance payables 1,643 1,534 2,517 2,526 2,820 Short-term debt Long-term debt Subordinated debt - liability 497 1,012 1,082 958 930 Other creditors 715 774 883 774 1,046 Accruals 123 192 274 345 384 Total liabilities 29,667 30,558 39,415 37,016 39,811 Capital and reserves Members’ FAL 11,282 9,858 10,630 13,159 13,832 Members’ balances 597 2,652 2,562 3,878 2,912 Central fund balance 957 939 990 1,126 1,447 Total capital & reserves 12,836 13,449 14,182 18,163 18,191 Source: Fitch-adjusted company audited financial statements

Insurance
Lloyd’s of London
August 2011 15
Appendix B: Other Ratings Considerations Below is a summary of additional ratings considerations of a “technical” nature that are part of
Fitch’s ratings criteria.
Group IFS Rating Approach
The Lloyd’s insurance entities listed on page 1 are rated on a group approach, with all entities
being considered core.
Notching
Lloyd’s unique corporate structure, being a market place rather than a corporation, makes
reference to operating and holding companies inappropriate in this circumstance. A description
of how the respective ratings of Lloyds’ entities were reached is provided below. The regulatory
environment in the United Kingdom is considered to be strong.
Notching Summary
Society of Lloyd’s The Society’s IDR rating is linked to the IFS rating assigned to Lloyd’s of London. The
Society has no legal liability for the insurance liabilities of members other than where it
has issued an undertaking. The undertakings are liabilities of the Society and constitute
unsecured obligations of the Society ranking pari passu with its other senior unsecured
liabilities. Thus, Fitch has aligned the IDR of the Society with the implied IDR of Lloyd’s
of London.
IFS Ratings Due to the existence of policyholder priority, a baseline recovery assumption of Good
applies to the IFS Rating, and standard notching from the implied IDR was used.
The insurance policies issued by Lloyd’s of London are supported by a chain of security
that includes Lloyd’s premium trust funds, members’ funds at Lloyd’s and the Central
Fund. The Central Fund and central assets of the Society of Lloyd’s, a legal entity
distinct from the members of Lloyd’s, and provide partial mutuality to the Lloyd’s market.
It is this mutuality that enables Fitch to assign an IFS rating to Lloyd’s of London.
Debt Not applicable.
Hybrids Notching of junior subordinated debt was based on a standard baseline recovery
assumption, given default, of Poor for the Society being the issuer, and standard
notching was used.
Hybrids – Equity/Debt Treatment
Figure 19
Hybrids Treatment CAR CAR FLR Hybrid Amount Fitch (%) Reg override (%) Debt (%) Sub debt GBP300m 0 100 100 Sub debt EUR253m 0 100 100 Sub perpetual GBP419m 0 100 100
Source: Fitch
Exceptions to Criteria/Ratings Limitations
None.

Insurance
Lloyd’s of London
August 2011 16
Appendix C: Glossary Corporation of Lloyd’s
The executive of the Council of Lloyd’s, Lloyd’s Franchise Board and their respective
committees. The Corporation does not underwrite insurance or reinsurance itself but provides
the licences and other facilities that enable business to be underwritten on a worldwide basis
by managing agents acting on behalf of members.
Coverholder
A company or partnership authorised by a managing agent to enter into a contract or contracts
of insurance to be underwritten by the members of a syndicate managed by it, in accordance
with the terms of a binding authority.
Members' agent
An underwriting agent which has permission from Lloyd’s to be appointed by a member to
provide services and perform duties of the same kind and nature as those set out in the
standard members’ agent’s agreement. These services and duties include advising the
member on which syndicates he should participate, the level of participation on such
syndicates and liaising with the member’s managing agents
Service Company
A ‘service company coverholder (referred to in the Code simply as a “service company”)’ is an
approved coverholder which Lloyd’s has agreed can be classified as a “service company” by
reason of it being a wholly owned subsidiary of either a managing agent or of a managing
agent’s holding company and which is normally only authorised to enter into contracts of
insurance for members of its associated syndicate and/or associated insurance companies

Insurance
Lloyd’s of London
August 2011 17
ALL FITCH CREDIT RATINGS ARE SUBJECT TO CERTAIN LIMITATIONS AND DISCLAIMERS. PLEASE READ THESE LIMITATIONS AND DISCLAIMERS BY FOLLOWING THIS LINK: HTTP://FITCHRATINGS.COM/UNDERSTANDINGCREDITRATINGS. IN ADDITION, RATING DEFINITIONS AND THE TERMS OF USE OF SUCH RATINGS ARE AVAILABLE ON THE AGENCY'S PUBLIC WEB SITE AT WWW.FITCHRATINGS.COM. PUBLISHED RATINGS, CRITERIA, AND METHODOLOGIES ARE AVAILABLE FROM THIS SITE AT ALL TIMES. FITCH'S CODE OF CONDUCT, CONFIDENTIALITY, CONFLICTS OF INTEREST, AFFILIATE FIREWALL, COMPLIANCE, AND OTHER RELEVANT POLICIES AND PROCEDURES ARE ALSO AVAILABLE FROM THE CODE OF CONDUCT SECTION OF THIS SITE.
Copyright © 2011 by Fitch, Inc., Fitch Ratings Ltd. and its subsidiaries. One State Street Plaza, NY, NY 10004.Telephone: 1-800-753-4824, (212) 908-0500. Fax: (212) 480-4435. Reproduction or retransmission in whole or in part is prohibited except by permission. All rights reserved. In issuing and maintaining its ratings, Fitch relies on factual information it receives from issuers and underwriters and from other sources Fitch believes to be credible. Fitch conducts a reasonable investigation of the factual information relied upon by it in accordance with its ratings methodology, and obtains reasonable verification of that information from independent sources, to the extent such sources are available for a given security or in a given jurisdiction. The manner of Fitch’s factual investigation and the scope of the third-party verification it obtains will vary depending on the nature of the rated security and its issuer, the requirements and practices in the jurisdiction in which the rated security is offered and sold and/or the issuer is located, the availability and nature of relevant public information, access to the management of the issuer and its advisers, the availability of pre-existing third-party verifications such as audit reports, agreed-upon procedures letters, appraisals, actuarial reports, engineering reports, legal opinions and other reports provided by third parties, the availability of independent and competent third-party verification sources with respect to the particular security or in the particular jurisdiction of the issuer, and a variety of other factors. Users of Fitch’s ratings should understand that neither an enhanced factual investigation nor any third-party verification can ensure that all of the information Fitch relies on in connection with a rating will be accurate and complete. Ultimately, the issuer and its advisers are responsible for the accuracy of the information they provide to Fitch and to the market in offering documents and other reports. In issuing its ratings Fitch must rely on the work of experts, including independent auditors with respect to financial statements and attorneys with respect to legal and tax matters. Further, ratings are inherently forward-looking and embody assumptions and predictions about future events that by their nature cannot be verified as facts. As a result, despite any verification of current facts, ratings can be affected by future events or conditions that were not anticipated at the time a rating was issued or affirmed.
The information in this report is provided “as is” without any representation or warranty of any kind. A Fitch rating is an opinion as to the creditworthiness of a security. This opinion is based on established criteria and methodologies that Fitch is continuously evaluating and updating. Therefore, ratings are the collective work product of Fitch and no individual, or group of individuals, is solely responsible for a rating. The rating does not address the risk of loss due to risks other than credit risk, unless such risk is specifically mentioned. Fitch is not engaged in the offer or sale of any security. All Fitch reports have shared authorship. Individuals identified in a Fitch report were involved in, but are not solely responsible for, the opinions stated therein. The individuals are named for contact purposes only. A report providing a Fitch rating is neither a prospectus nor a substitute for the information assembled, verified and presented to investors by the issuer and its agents in connection with the sale of the securities. Ratings may be changed or withdrawn at anytime for any reason in the sole discretion of Fitch. Fitch does not provide investment advice of any sort. Ratings are not a recommendation to buy, sell, or hold any security. Ratings do not comment on the adequacy of market price, the suitability of any security for a particular investor, or the tax-exempt nature or taxability of payments made in respect to any security. Fitch receives fees from issuers, insurers, guarantors, other obligors, and underwriters for rating securities. Such fees generally vary from US$1,000 to US$750,000 (or the applicable currency equivalent) per issue. In certain cases, Fitch will rate all or a number of issues issued by a particular issuer, or insured or guaranteed by a particular insurer or guarantor, for a single annual fee. Such fees are expected to vary from US$10,000 to US$1,500,000 (or the applicable currency equivalent). The assignment, publication, or dissemination of a rating by Fitch shall not constitute a consent by Fitch to use its name as an expert in connection with any registration statement filed under the United States securities laws, the Financial Services and Markets Act of 2000 of Great Britain, or the securities laws of any particular jurisdiction. Due to the relative efficiency of electronic publishing and distribution, Fitch research may be available to electronic subscribers up to three days earlier than to print subscribers.