Embed Size (px)
Citation preview

Livongo Health A Compelling Digital Health Growth Story, Initiate with an Outperform Rating
LVGO
Target price (12M, US$)
132.00
Outperform[V] Healthcare Technology & Distribution | Initiation
An Underpenetrated, Attractive TAM Driven by Growing Chronic Care Population.
We initiate coverage of Livongo, a digital health platform providing its members with
solutions for their chronic health conditions, with an Outperform rating and $132 TP.
LVGO operates in a highly underpenetrated and growing chronic care market. With a little
over $350 mln in annual rev (CS 2020 est), LVGO is barely scratching the surface in a
market which the company sizes at $46.7 bln (combined TAM for U.S. opportunities in
diabetes & hypertension). We believe this estimate is conservative for four reasons: 1)
LVGO uses chronic disease prevalence and population estimates using 2015 data, which
have moved exponentially higher today; 2) TAM does not incorporate its other solutions,
Prediabetes & Weight Management and Behavioral Health; 3) there are several other areas
of chronic care management that are largely underpenetrated where LVGO has yet to
enter; and 4) LVGO’s TAM estimates do not incorporate potential international expansion.
COVID Pulled Forward the Adoption of Remote Patient Monitoring, Opening New
Avenues of Growth. The COVID-19 pandemic has had a myriad of positive impacts on
LVGO, and others in digital health. With people with chronic conditions being most at-risk
during the pandemic, LVGO’s ability to monitor and maintain continuity of care for these
individuals and deliver a hard ROI for clients well position the company. LVGO recently
previewed its 2Q20 results above its prior expectations, setting the stage for another
upward guidance revision when reporting earnings in early August. Further, the pandemic
has accelerated LVGO’s opportunities in new markets, particularly Medicare fee-for-service,
which LVGO expects to become a growth contributor in 2021 vs. 2024-2025 pre-COVID.
Valuation and TP. We expect LVGO shares to maintain the current one-year forward
EV/Sales multiple of ~26x 12 months from now. A 26x multiple on our 2021 rev est yields
a 12-month TP of $132, ~36% upside potential, and thus warrants an Outperform rating.
A 26x multiple, while high, is supported by the fact that comparable high growth
SaaS/HCIT companies expected to grow rev 27% Y/Y in 2021 (FactSet est) are trading
at 18.0x 2021 EV/Sales. Our 2021 rev growth estimate of 59% for LVGO is more than
double the 2021 avg rev growth rate for SaaS/HCIT companies, implying a
~1.5x premium multiple over the average is not a stretch. Risks to our rating and TP
include any major contract loss, slower enrollment rates, pricing pressure, sustaining
increase in unemployment, etc.
14 July 2020
Equity Research
Americas | United States
DISCLOSURE APPENDIX AT THE BACK OF THIS REPORT CONTAINS IMPORTANT DISCLOSURES, ANALYST CERTIFICATIONS,
LEGAL ENTITY DISCLOSURE AND THE STATUS OF NON-US ANALYSTS. US Disclosure: Credit Suisse does and seeks to do business
with companies covered in its research reports. As a result, investors should be aware that the Firm may have a conflict of interest that could
affect the objectivity of this report. Investors should consider this report as only a single factor in making their investment decision.
Price (13 Jul 20, US$) 97.38
52-week price range 107.56 - 15.92
Market cap (US$ m) 9,525.42
Enterprise value (US$ m) 9,446
[V] = Stock Considered Volatile (see Disclosure Appendix)
Research Analysts
Jailendra Singh
212 325 8121
Jermaine Brown
212 325 8125
Adam Heussner
212 325 4727
Financial and valuation metrics
Year 12/19A 12/20E 12/21E 12/22E EPS (CS adj.) (US$) -0.39 -0.04 0.08 0.39 Prev. EPS (US$) - - - - Revenue (US$ m) 170.2 353.7 563.2 784.9 EBITDA (US$ m) -20.1 7.8 32.3 71.4 P/OCF (x) -63.4 n.m 344.2 157.4 EV/EBITDA (current) -463.4 1,202.1 288.9 130.6 Net debt (US$ m) -242 -80 -12 44 ROIC (%) -8.84 0.71 6.18 12.17
Number of shares (m) 97.82 IC (current, US$ m) 265.63 Net debt (Next Qtr., US$ m) -119.2 Dividend (current, US$) - Net debt/tot eq (Next Qtr.,%) -27.9
Source: Company data, Refinitiv, Credit Suisse estimates
Share price performance
On 13-Jul-2020 the S&P 500 INDEX closed at 3155.22Daily
Jul25, 2019 - Jul13, 2020, 07/25/19 = US$38.1
Quarterly EPS Q1 Q2 Q3 Q4 2019A -0.48 -0.46 -0.05 0.02 2020E 0.03 0.03 -0.04 -0.07 2021E 0.02 0.01 0.02 0.03

14 July 2020
Livongo Health 2
Livongo Health (LVGO) Analyst: Jailendra Singh Price (13 Jul 2020): US$97.38 Target Price: 132.00 Rating: Outperform
Income Statement 12/19A 12/20E 12/21E 12/22E
Revenue (US$ m) 170.2 353.7 563.2 784.9
EBITDA (US$ m) (20) 8 32 71
Depr. & amort. (3) (5) (7) (9) EBIT (US$) (23) 2 25 63
Net interest exp 4 (7) (16) (16) PBT (US$) (20) (4) 9 47
Income taxes (0) 0 (0) (2) Profit after tax (20) (4) 9 44
Minorities - - - - Net profit (US$) (20) (4) 9 44
Reported net income (US$) (20) (4) 9 44
Other NPAT adjustments 0 0 0 0 Adjusted net income (20) (4) 9 44
Cash Flow 12/19A 12/20E 12/21E 12/22E
EBIT (23) 2 25 63 Net interest 4 (7) (16) (16) Change in working capital - - - - Cash flow from operations (20) 8 32 71
CAPEX (7) (14) (23) (31) Free cashflow to the firm (27) (7) 10 40
Acquisitions - - - - Divestments - - - - Cash flow from investments (7) (14) (23) (31)
Net share issue(/repurchase) - - - - Dividends paid 0 0 0 0 Changes in Net Cash/Debt 133 (162) (68) (55)
Balance Sheet (US$) 12/19A 12/20E 12/21E 12/22E
Assets Cash & cash equivalents 242 629 561 506 Account receivables 41 77 118 164 Other current assets 176 202 230 260 Total current assets 488 958 984 1,034
Total fixed assets 10 20 36 59 Investment securities - - - - Total assets 561 1,059 1,107 1,186
Liabilities Total current liabilities 42 77 117 161
Total liabilities 53 640 687 739
Total liabilities and equity 561 1,059 1,107 1,186
Net debt (242) (80) (12) 44 Per share 12/19A 12/20E 12/21E 12/22E
No. of shares (wtd avg) 51 113 114 115 CS adj. EPS (0.39) (0.04) 0.08 0.39 Prev. EPS (US$) Dividend (US$) 0.00 0.00 0.00 0.00 Free cash flow per share (0.54) (0.06) 0.09 0.35
Earnings 12/19A 12/20E 12/21E 12/22E
Sales growth (%) 148.7 107.8 59.2 39.4 EBIT growth (%) 18.9 110.4 940.6 147.9 Net profit growth (%) 27.7 78.6 319.8 378.6 EPS growth (%) 76.5 90.3 317.3 373.2 EBITDA margin (%) (11.8) 2.2 5.7 9.1 EBIT margin (%) (13.8) 0.7 4.5 8.0 Pretax margin (%) (11.6) (1.2) 1.7 6.0 Net margin (%) (11.6) (1.2) 1.7 5.7 Valuation 12/19A 12/20E 12/21E 12/22E
EV/Sales (x) 54.55 26.71 16.89 12.19 P/E (x) (251.4) (2595.9) 1194.5 252.4 Price to book (x) 9.8 26.2 26.5 25.1 Asset turnover 0.3 0.3 0.5 0.7 Returns 12/19A 12/20E 12/21E 12/22E
ROE stated-return on (%) (9.4) (0.9) 2.2 10.3 ROIC (%) (8.8) 0.7 6.2 12.2 Gearing 12/19A 12/20E 12/21E 12/22E
Net debt/equity (%) (47.6) (19.1) (2.8) 9.7 Interest coverage ratio (X) 6.3 0.4 1.6 3.9 Quarterly EPS Q1 Q2 Q3 Q4 2019A -0.48 -0.46 -0.05 0.02 2020E 0.03 0.03 -0.04 -0.07 2021E 0.02 0.01 0.02 0.03
Company Background
Livongo operates a digital health platform focused on people with chronic
conditions. The company leverages data science and technology to create
a personalized experience for the member to encourage healthy behavior
and to ultimately save costs.
Blue/Grey Sky Scenario
Our Blue Sky Scenario (US$) 177.00
Our Blue Sky valuation for LVGO is $177 and assumes LVGO shares
trade at roughly 35x our 2021 revenue estimate. This would primarily be
driven by higher-than-expected enrollment rates in LVGO's current client
base, significant client wins, better retention of existing members, and an
better execution of cross-selling among LVGO's various solutions.
Our Grey Sky Scenario (US$) 77.00
Our Grey Sky valuation for LVGO is $77 and assumes LVGO shares
trade at roughly 15x our 2021 revenue estimate, which would result from
lower enrollment rates, increased churn among LVGO's existing
membership base, failure to improve margins and lack of execution on
cross-selling among LVGO's portfolio of solutions.
Share price performance
On 13-Jul-2020 the S&P 500 INDEX closed at 3155.22
Daily Jul25, 2019 - Jul13, 2020, 07/25/19 = US$38.1
Source: Company data, Refinitiv, Credit Suisse estimates

14 July 2020
Livongo Health 3
Table of Contents
Key Charts 4
Executive Summary 5
Overarching Chronic Disease Trends .............................................................................. 5
Conservative Total Addressable Market ........................................................................... 5
A Sticky Platform with a Highly Attractive B2B2C go-to-market Strategy .......................... 5
AI+AI Data Engine Drives Real Hard ROI for LVGO’s Clients ............................................ 6
COVID-19 Pulled Forward the RPM Adoption ................................................................. 6
Valuation and Price Target ............................................................................................. 6
Investment Themes 7
Focused on the Largest Health Care Problems in the U.S. ............................................... 7
Attractive TAM With a Long Runway for Growth .............................................................. 9
Compelling Multi-channel B2B2C Go-to-Market Strategy ............................................... 11
Cross-Selling Opportunities .......................................................................................... 15
A Sticky Healthcare-as-a-Service (HaaS) Platform ........................................................ 16
COVID-19 Pulled Forward the RPM Adoption ............................................................... 17
New Payment Models Create Tailwind for LVGO ........................................................... 19
AI+AI Data Engine a Core Component of LVGO’s Competitive Strategy .......................... 21
Measurable Outcomes Bring Hard ROI for Clients.......................................................... 22
Recent Notable Clients Wins and Opportunities ............................................................. 23
Strong Financial Performance ...................................................................................... 24
Investment Risks 25
Exposure to High Unemployment Rate .......................................................................... 25
Channel Partners’ Influence on Revenue ....................................................................... 25
A New, But Rapidly Growing Market Brings Competition ................................................ 25
CGM Vendors & Device Manufacturers ......................................................................... 26
Health Insurers Offering Own Digital Care Programs ...................................................... 26
Price Performance and Valuation 27
Company Overview 30
Solution Overview ........................................................................................................ 30
Margin Expansion Opportunity Through CGMs ............................................................... 31
Business Model .......................................................................................................... 31
Financials 33

14 July 2020
Livongo Health 4
Key Charts
Figure 1: LVGO Revenue Growth Figure 2: LT Target Margins
Source: Company data, Credit Suisse estimates Source: Company data, Reflects average of LT targets, *Operating margin: +20%
Figure 3: Estimated Value of Agreements Figure 4: Diabetes Market Remains Largely Untapped by LVGO
Source: Company data Source: Company data, Credit Suisse, Based on 1Q20 Livongo Enrolled Diabetes
Members
$31 $68
$170
$354
$563
$785
$1,027
2017 2018 2019 2020E 2021E 2022E 2023E
$77.2
$11.3
$24.8
$62.3$56.1
$48.1
$74.2
$85.5
$76.7
$89.0
4Q17 1Q18 2Q18 3Q18 4Q18 1Q19 2Q19 3Q19 4Q19 1Q20
LVGO Diabetes Members: 1.04%
31.4 mln U.S. Adults With
Diabetes

14 July 2020
Livongo Health 5
Executive Summary
We are initiating coverage of Livongo (LVGO) with an Outperform rating and a $132
price target.
Overarching Chronic Disease Trends
Livongo (LVGO) stands to benefit from a healthcare industry that is becoming more connected
with the patient and the focus of employers and health plans to save costs. LVGO is focused on
improving the lives of people with chronic conditions through its consumer digital health platform
that provides over-the-air updatable devices, informed coaching, data science-enabled insights,
and facilitates access to medications across multiple chronic conditions. Currently, LVGO’s
solutions are available for those with diabetes, hypertension, pre-diabetes & weight
management, and behavioral health. LVGO sells its core Livongo for Diabetes solution on a
pure SaaS basis, which results in LVGO being able to cite a 90% visibility into future revenue.
As of 3/31/2020, LVGO had over 328k enrolled diabetes members on its platform, which
represents around 1% penetration when considering that there are over 31 mln insured people
in the U.S. living with diabetes. Further, according to the American Diabetes Association, 1.5
mln Americans are diagnosed with diabetes every year, representing an ongoing opportunity for
LVGO to capture new members. Chronic conditions go beyond just diabetes, however.
According to the CDC – going back to 2014 – 90% of the $3.5 trln in healthcare expenditures
were for people with chronic and mental health conditions. Though LVGO was built on helping
people with diabetes, the company has expanded its offerings to include weight management
and pre-diabetes, management of hypertension, and its most recent product launch (via
acquisition of myStrength) of behavioral health. With 70% of people with Type 2 diabetes
struggling with hypertension, and over 50% of those with Type 2 having a weight management
issue, LVGO is well-positioned to leverage its core Diabetes management platform to enable
those living with comorbidities to live better lives.
Conservative Total Addressable Market
LVGO sizes its total addressable market in the U.S. for the diabetes management solution at
$28.2 bln (based on 31.4 mln adults with diagnosed/undiagnosed diabetes and LVGO’s
annualized $75 Per Participant Per Month (PPPM) list price). For hypertension, LVGO
estimates an addressable market in the U.S. of $18.5 bln (based on 39.6 mln adults with
hypertension who do not also have diabetes, which is known to be about 74%, and LVGO’s
annualized $39 PPPM list price). Between diabetes and hypertension, LVGO operates in a
$46.7 bln TAM. We believe this estimate is conservative for four reasons: 1) LVGO uses
chronic disease prevalence and population estimates using 2015 data, which have moved
exponentially higher today; 2) TAM does not incorporate its other solutions, Prediabetes &
Weight Management & Behavioral Health; 3) There are several other areas of chronic care
management that are largely underpenetrated where LVGO has yet to enter; and 4) LVGO’s
TAM estimates do not incorporate potential international expansion.
A Sticky Platform with a Highly Attractive B2B2C go-
to-market Strategy
Livongo utilizes a B2B2C go-to-market strategy where it sells its platform to employers, health
plans/payors, health systems, labor unions, and government entities. LVGO currently has over
30% of Fortune 500 companies as clients. Unlike other benefit plan solutions where a company
might pay for its entire employee population to have access, employers and other LVGO clients
only pay for the subsets of their populations that are at-risk and who actually use the solution.
LVGO operates a sticky platform, which is evident by a 2-3% average monthly member attrition
(driven primarily by members losing eligibility because of change in employer). Only a small portion
(~6%) of LVGO’s churn comes from clients deciding to terminate their contract with LVGO.

14 July 2020
Livongo Health 6
AI+AI Data Engine Drives Real Hard ROI for LVGO’s
Clients
The value in LVGO’s platform comes via its use of Applied Health Signals (e.g., blood pressure
checks, weight scale readings, blood glucose checks, etc.) to capture and then translate data
into actionable, personalized and timely signals to improve the lives of those with chronic
medical conditions, both medically and financially. The core of LVGO’s strategy is in its AI+AI
(which stands for Aggregate & Interpret, Apply & Iterate) Data Engine, where it takes over 500
mln data points and runs them against algorithms to help coach members on a clinical basis.
COVID-19 Pulled Forward the RPM Adoption
COVID-19 has resulted in a pull-forward of adoption of remote patient monitoring through
actions taken by various regulatory bodies. With people with chronic conditions most at risk
during the current pandemic, LVGO’s solutions have seen increased interest. Additionally,
LVGO is also seeing increased enrollment from clients already in LVGO’s portfolio via patients
looking to maintain some degree of care for their chronic condition and not being able/willing to
see a doctor in person, with a solution that is free of charge from their employer/health plan.
Further, as a result of CMS changing billable CPT codes specific to remote patient monitoring,
it has allowed LVGO to accelerate the penetration of the Medicare fee-for-service market.
LVGO is still in early stages in providing its RPM solutions to health systems, though the
company does have pilot programs in place in several health systems across the country.
Valuation and Price Target
Following LVGO’s IPO in July 2019, shares declined 34.2% in 2019, but have surged 289%
YTD in 2020 as COVID-19 has put a spotlight on companies in the digital healthcare market
and solutions with the ability to monitor patients remotely.
The primary valuation metric we use to value LVGO shares is EV/Sales primarily due to the
company’s growth profile and limited history of positive earnings. On an EV/Sales metric, LVGO
shares currently trade at approximately 25.9x our 2020 revenue estimate and 16.3x our 2021
revenue estimate. When compared with a mix of similar top-line growth profile software-as-a-
service (SaaS) and healthcare technology companies, LVGO trades at a discounted valuation
relative to the group average (16.3x our 2021 revenue estimate vs the group average of 18.0x),
despite a Y/Y revenue growth expectation of 59% in 2021, double the average revenue growth
expectation of 27% for the group.
We expect LVGO shares to maintain its current EV/Sales multiple of 26x one year from now. A
26x on our 2021 revenue estimate for LVGO yields a 12-month TP of $132. A $132 price
target would imply roughly 36% upside potential from the current levels, and thus an
Outperform rating. Risks to our rating and TP include any major contract loss, slower enrollment
rates, pricing pressure, sustaining increase in unemployment, etc.

14 July 2020
Livongo Health 7
Investment Themes
Focused on the Largest Health Care Problems in the
U.S.
According to the CDC, 6 in 10 adults in the U.S. have a chronic disease while 4 in 10 adults
are living with 2+ chronic diseases. Out of the $3.5 trillion spent on U.S. healthcare in 2017,
around 90% was attributable to people with chronic and mental health conditions.
More than 30 million people in the U.S. have diabetes, and 1 in 4 of them don’t know they have
it. More than 84 million U.S. adults have prediabetes, and 90% of them don’t know they have it.
Prediabetes is a serious health condition in which blood sugar levels are higher than normal, but
not high enough yet to be diagnosed as type 2 diabetes. A person with prediabetes is at high
risk of type 2 diabetes, heart disease, and stroke. Being overweight, being age 45 or older, and
being physically active less than 3 times a week are risk factors for prediabetes and type 2
diabetes. Based on a study conducted by the American Diabetes Association, the total cost of
diabetes in the U.S. was $327 billion in 2017, including $237 billion in direct medical costs and
$90 billion in reduced productivity. On average, people with diagnosed diabetes incur medical
expenditures of $16.7K per year, of which about $9.6K is attributed to diabetes. Also, people
with diagnosed diabetes have medical expenditures approximately 2.3x higher than what
expenditures would be in the absence of diabetes. Separately, according to the American
Diabetes Association, the cost of prediabetes was about $43 billion in 2017.
High blood pressure is one of the most prevalent health conditions facing Americans today with
roughly half of the U.S. population (108 million) living with a systolic blood pressure ≥ 130 mm
Hg or a diastolic blood pressure ≥ 80 mm Hg or are taking medication for hypertension. Only 1
in 4 adults with hypertension have their condition under control. In terms of cost in the U.S.,
around $131 billion is attributed to high blood pressure.
Approximately 40% of Americans are considered to be obese, which results in a higher risk of
developing other chronic conditions such as diabetes, heart disease, as well as cancer. The
estimated annual medical cost of obesity in the U.S. was $147 billion. The prevalence of
obesity in the U.S. has also been increasing over the past 20 years as the age-adjusted
prevalence in obesity increased from 30.5% in 1999-2000 to 42.4% in 2017-2018. In
addition, the prevalence of severe obesity has more than doubled over the same period, growing
from 4.7% to 9.2%.
Figure 5: Age-Adjusted Prevalence of Obesity & Severe Obesity in the U.S.
Source: NCHS, National Health and Nutrition Examination Survey, 1999–2018
30.5% 30.5%32.2%
34.3% 33.7%35.7% 34.9%
37.7%39.6%
42.4%
4.7% 5.1% 4.8% 5.9% 5.7% 6.3% 6.4% 7.7% 7.7% 9.2%
1999-2000 2001-2002 2003-2004 2005-2006 2007-2008 2009-2010 2011-2012 2013-2014 2015-2016 2017-2018
Obesity Severe Obesity

14 July 2020
Livongo Health 8
According to the National Institute of Mental Health, an estimated 46.6 million adults (18.9% of
all U.S. adults) in the U.S. had a mental illness in 2017. In addition, there was an estimated
11.2 million adults (4.5% of all U.S. adults) with a serious mental illness in 2017. However,
mental illness is not only prevalent, it is also costly. For instance, according to the National
Alliance on Mental Illness, mental illness costs the U.S. an estimated $300 billion per year. The
treatment of mental health cannot be thought of in isolation, however, as mental disease is
correlated with other chronic conditions, such as heart condition, diabetes, hypertension, etc.
Figure 6: Prevalence of Comorbid Health Conditions Among Nonelderly Adults with
Mental Illness, 2015
Source: Kaiser Family Foundation, Credit Suisse
Livongo operates a digital health platform geared toward helping its members with chronic
conditions live better, healthier lives while at the same time reducing the cost burden of
employers, health plans, and the entire healthcare system. LVGO is built around its core product,
Livongo for Diabetes, a solution that offers members a cellular-connected blood glucose meter,
unlimited blood glucose test strips, personalized Health Nudges that prompt members to take
action on their health, digital tools across mobile, web, and email, as well as coaching and
monitoring. While LVGO is still heavily concentrated in its marquee diabetes management
solution, the company has expanded its product offering to include Livongo for Prediabetes &
Weight Management, Livongo for Hypertension, and most recently through its acquisition of
myStrength in Feb 2019, myStrength for Behavioral Health. LVGO’s suite of solutions share a
common data structure and are all delivered through a common user interface, multi-channel
applications for management of conditions, and a cross-condition integrated coaching model.
Importantly, each of LVGO’s four solutions can be used alone or in tandem with one another.
LVGO generates around 90-95% of its revenue from monthly subscription fees, but the
company does recognize a small portion of revenue from the sale of connected devices, which
tend to be more apparent in revenue contribution in the 1H of the year as clients are launched
onto the platform and members begin to enroll. In addition, LVGO also has a small portion of at-
risk revenue based on performance metrics (e.g., clinical improvement in A1C scores, weight
loss improvement, Net Promoter Scores, etc.). If LVGO were to not hit a certain performance
metric, instead of generating incremental revenue, the company would be forced to provide a
credit to the client. However, LVGO is experiencing that clients are wanting to incorporate these
performance-based metrics into contracts much less relative to 3-4 years ago, which can be
explained by LVGO’s solutions proven capabilities and better brand recognition now. Clients
have ended up paying more when a performance-based metric is involved because of the
results LVGO is able to consistently deliver. LVGO is still open to incorporate a variable revenue
component into contracts if a client wants it.
10% 10%
20%
15%
20%
Heart Condition Diabetes Hypertension Asthma Substance
Abuse/Addiction

14 July 2020
Livongo Health 9
Figure 7: Livongo Product Overview
Solution
Pricing
Model
Built vs
Bought
Launch/Acquisition
Date
Diabetes
~$75 PPPM Built Sep-14
Prediabetes & Weight
Management
~$35 PPPM Bought Apr-18
Hypertension
~$39 PPPM Built Aug-18
Behavioral Health by
myStrength
$LSDs PMPM
Bought Feb-19
Source: Company data, Credit Suisse, PPPM: Per-Participant-Per-Month, PMPM: Per-Member-Per-Month
Attractive TAM With a Long Runway for Growth
LVGO sizes its total addressable market in the U.S. for its diabetes management solution at
$28.2 bln (based on 31.4 mln adults with diagnosed/undiagnosed diabetes and LVGO’s
annualized $75 PPPM list price). For hypertension, LVGO estimates an addressable market in
the U.S. of $18.5 bln (based on 39.6 mln adults with hypertension who do not also have
diabetes, which is known to be about 74%, and LVGO’s annualized $39 PPPM list price).
Between diabetes and hypertension, LVGO operates in a $46.7 bln total addressable market.
Notably, due to limitations on the availability of data for both diabetes and hypertension, the total
addressable market of $46.7 bln cited by LVGO is based on chronic disease prevalence and
population estimates as of 2015. Therefore, it is likely the addressable market for these two
solutions has increased since then.
Further, LVGO’s cited TAM does not incorporate other solutions of pre-diabetes & weight
management or the myStrength Behavioral Health solution.
Figure 8: Breakdown of Diabetes & Hypertension Total Addressable Markets
Diabetes
Insured Lives LVGO List Price (PPPY) Addressable Market TAM
Employer Coverage 13.7 M $900 $12.3 B $28.2 B
Medicare/Medicaid 17.7 M $900 $15.9 B
Hypertension
Insured Lives LVGO List Price (PPPY) Addressable Market TAM
Employer Coverage 27.4 M $468 $12.8 B $18.5 B
Medicare/Medicaid 12.2 M $468 $5.7 B
Source: Company data, Credit Suisse estimates
LVGO has historically focused on the self-insured employer market where the company has had
success as employers look to save money on the most costly subsets of their employee
populations. However, LVGO also has an opportunity to go after other markets in need of cost-
savings and better outcomes. As more and more clients receive positive ROIs and better
outcomes, we see LVGO becoming more successful in winning business in the fully insured
employer/commercial health plan markets as well. Based on estimates of prevalence in insured
populations, we see a largely unaddressed market for LVGO to penetrate.

14 July 2020
Livongo Health 10
Figure 9: Underpenetrated Markets to Go After
Source: Company data, Kaiser, Credit Suisse
Given diabetes management is LVGO’s foundational pillar, we see the company as likely to roll
out additional solutions that are commonly correlated with those living with type 2 diabetes. For
example, for people living with type 2 diabetes, 73.6% have hypertension, 87.5% are
overweight/obese, 75.2% have hyperlipidemia, 36.5% have chronic kidney disease, and
32.2% have a cardiovascular disease. According to a Rand Corporation study on chronic
conditions, 27% of U.S. adults have hypertension while 21.6% are living with lipid disorders
(e.g., high cholesterol). Based on recent commentary by LVGO management, the company
plans on rolling out a solution for people with high cholesterol by the end of the year with other
areas on LVGO’s roadmap to further growth. Therefore, LVGO’s cited TAM is likely to expand
as the company enters new chronic care markets, in addition to the company’s TAM for
diabetes/hypertension as the population of persons living with the conditions increase.
Figure 10: Prevalence of Top Chronic Conditions (2014)
Source: Rand Corporation, Credit Suisse
International expansion provides LVGO further opportunity to expand its TAM, as chronic
conditions are not exclusive to the U.S. market. According to the International Diabetes
Federation, there were around 463 mln adults (age 20-79) globally living with diabetes, with
50% of people with diabetes being undiagnosed. However, by 2030, the number of people with
diabetes is expected to rise to 578 mln and by 2045 is expected to hit over 700 mln people.
With zero international exposure currently, international expansion for LVGO represents a large
runway for future growth given the expected increases in persons living with diabetes as well as
LVGO’s straightforward pricing model, which should allow the company to integrate with many
of the healthcare systems abroad. Management has noted that the company is likely to begin
expansion into international markets in countries where English is the language of medicine.
99 mln
64 mln 58 mln
36 mln24 mln
Prevalence: 8%
Prevalence: 9%Prevalence: 8%
Prevalence: 25%
Prevalence: 25%
Self-Insured
Employers
Medicaid Fully-Insured
Employers
Medicare FFS Medicare
Advantage
27.0%
21.6%
11.9%10.4% 9.7%
7.4% 7.4% 6.5% 6.3%4.8%
Hypertension Lipid disorders
(e.g., high
cholesterol)
Mood disorders
(e.g.,
depression,
bipolar disorder)
Diabetes
mellitus
Anxiety
disorders
Other upper
respiratory
disorders
Inflammatory
joint disorders
(other than
arthritis)
Osteoarthritis Asthma Coronary
atherosclerosis
and other heart
disease

14 July 2020
Livongo Health 11
Figure 11: Persons with Diabetes Globally
Source: International Diabetes Federation, Credit Suisse
Compelling Multi-channel B2B2C Go-to-Market Strategy
Livongo utilizes a B2B2C go-to-market strategy where it sells its platform to employers, health
plans/payors, health systems, labor unions, and government entities. Ultimately, LVGO looks to
sell its platform and services to anyone who has risk for the underlying population. LVGO
currently has over 30% of Fortune 500 companies as clients. Unlike other benefit plan solutions
where a company might pay for its entire employee population to have access, employers and
other LVGO clients only pay for the subsets of their populations that are at-risk and who actually
use the solution.
LVGO sells its solutions through its direct sales force in addition to relying on a limited number
of channel partners and resellers. These channel partners, which are made up of pharmacy
benefit managers (PBMs), health plans, and other resellers, speed up the process for LVGO in
gaining access to potential clients. In exchange for the increased speed and access the channel
partners provide, LVGO gives up a HSD% of top-line revenue in commission expenses. From
an accounting standpoint, in situations where LVGO utilizes a channel partner to obtain a client,
revenue would be recognized on a gross basis and the fee paid to the channel partner
recognized as commission expense in sales and marketing. The fee paid to channel partners
can be thought of as a revenue share arrangement as it is based on a percentage of revenue on
an ongoing basis.
For 2019, LVGO disclosed that sales generated through its top five channel partners (i.e.,
Express Scripts, CVS, Health Care Service Corporation, Anthem, and Highmark) represented
61.3% of revenue. The agreements with LVGO’s channel partners/resellers are on a non-
exclusive basis, and as such, they may refer business to competitors other than LVGO. LVGO
nonetheless maintains strong relationships with each of its channel partners due to the
evidence-based outcomes LVGO is able to deliver for its members. For example, LVGO is
Express Scripts’ only preferred provider for its digital health formulary, where Express Scripts
takes on risk, pointing to the financial ROI LVGO drives. Additionally, LVGO recently received
preferred status within Express Scripts’ new Health Connect 360 solution, which is the
industry’s first outcomes-based model that centers on engaging people in their care.
References to “clients” for LVGO include only contractually signed and paying clients. As such,
during the ~3 month ramp that it takes upon contract signing with a commercial client until
service launch, LVGO would not count that newly signed client in its membership base.
151194
246285
366 382415 425
463
578
700
2000 2003 2006 2009 2011 2013 2015 2017 2019 2030E2045E

14 July 2020
Livongo Health 12
LVGO refers to Estimated Value of Agreements (previously referred to as Total Contract Value,
or TCV) as contractually committed orders to be invoiced under agreements that were entered
into during the reporting period. For purposes of EVA, LVGO assumes an average member
enrollment rate in addition to making certain assumptions over the total number of recruitable
individuals at a client, commencement of the enrollment period, enrollment method, starting
enrollment rates, monthly increases to enrollment rates, contract length, and client size/industry.
Notably, until LVGO actually begins invoicing the client, amounts reflected in EVA do not show
up in deferred revenue, revenue, or anywhere else in the financial statements. Accordingly, EVA
should be thought of as the top of the funnel for where LVGO begins a path to revenue
generation.
LVGO currently experiences a 35% average enrollment rate in its diabetes management
solution with some of its best clients reaching a 50% enrollment rate for eligible populations. It
takes ~9 months to reach the average 35% enrollment run rate for a population due to the time
it takes for LVGO’s marketing and outreach initiatives to take effect. As a result, it takes ~12
months from contract signing to reach the full 35% average enrollment rate (e.g., 3 months
from contract signing until service launch and 9 months from service launch until run rate
enrollment). When LVGO is able to deploy an optimal outreach strategy, characterized by having
more availability to data, what is known about potential members, and how the company is
allowed to reach out to them, LVGO believes it can reach a 70% optimal enrollment rate.
Figure 12: EVA – Client – Members
Source: Company data
Figure 13: Estimated Value of Agreements (EVA)
Source: Company data
LVGO refers to clients as business entities having at least one active paid contract with the
company. Entities that utilize LVGO’s platform, but come through LVGO’s channel partners
(e.g., PBMs, resellers, etc.) are counted as individual clients. Prior to 1Q20, LVGO treated
multiple employers who contracted for LVGO’s services through a single health plan, as a single
client given the relatively small number of employers who were enrolling through health plans.
However, because of the increase in the number of employers enrolling through health plans
EVA
• Skews toward 2H as benefit plans are established
• Takes <6 months on Avg from initial outreach to signed contract
Client
• Represents signed & paying clients
• Additions skew toward 1H
• ~3 months on Avg from contract signing to enrollment initiation
Members
• Represents active employees/members & dependents on the LVGO platform
• Additions skew toward 1H
• ~9 months to full enrollment
$77.2
$11.3
$24.8
$62.3$56.1
$48.1
$74.2$85.5
$76.7
$89.0
4Q17 1Q18 2Q18 3Q18 4Q18 1Q19 2Q19 3Q19 4Q19 1Q20

14 July 2020
Livongo Health 13
instead of through other channels, LVGO now treats each entity that enrolls in the platform as a
separate client. Notably, along with this change, LVGO now treats health plans similar to how it
treats its channel partners, where they are counted as a client only if they also have an active
paid contract to use one of LVGO’s solutions.
Figure 14: Client Growth
Source: Company data
LVGO’s initial and primary solution is focused on the management of diabetes, one of the
fastest-growing chronic conditions in the world. LVGO defines Enrolled Diabetes Members as
all individuals that are enrolled in the Livongo for Diabetes solution at the end of the period.
Notably, the number of enrollees excludes: 1) employees or dependents of a client that have
ceased using the solution; 2) employees who no longer have an employment relationship with
an active client, and their dependents, and 3) employees/dependents who have not been active
on or used the solution for a period of time (specific in each client agreement), which is typically
between 4 and 6 months. Further, the number of Enrolled Diabetes Members does not include
employees/members of LVGO’s other three solutions (e.g., hypertension, prediabetes & weight
management, and behavioral health), which do not have the scale as that of the core diabetes
management solution, but serve as an important runway for growth going forward.
LVGO tends to sign more clients in the 2H of the year, which will show up in the company’s
Estimated Value of Agreements (EVA) metric, as companies decide which benefits to add
ahead of open enrollment season. Being that it takes ~2-3 months from contract signing until
service launch for commercial clients, additions to the number of reported clients and enrolled
diabetes members tend to skew toward the 1H of the year as prior period signings begin to
launch. However, LVGO is still able to sell all year long as its services are not necessarily tied to
the benefits season. For health plans in particular, it takes around 6-9 months after signing for
the enrollment period to begin, with a majority of enrollment periods for health plan clients
beginning in either January or July.
Without factoring any additional growth in enrolled diabetes members – taking LVGO’s 328K
members at the end of 1Q20 – and assuming an enrollment rate of 45% across LVGO’s entire
book, it would equate to an incremental ~$85 mln in annual revenue based on LVGO’s $75
PPPM list price for its diabetes solution. Given that LVGO is unlikely to operate at a 70%
targeted optimal enrollment rate across its whole book of business, as a result of differences in
outreach to varying client types, we see a 45% enrollment rate after 9 months since client
launch being an attainable target in the medium term. As LVGO becomes more sophisticated
with its enrollment and marketing strategy using its AI+AI engine, collecting further data around
populations and determining the optimal outreach approach, we see believe LVGO having a
large opportunity to drive top-line growth organically. Further, LVGO recently entered into an
agreement with one of its channel partners that allows the company to access all available
emails from their joint clients, providing another pathway to improve member outreach and drive
enrollment rates.
5 30100
218
413
872
1,252
2014 2015 2016 2017 2018 2019 1Q20

14 July 2020
Livongo Health 14
Figure 15: LVGO for Diabetes Enrollment Rates
Source: Company data, Credit Suisse estimate: 45% enrollment after ~9 months of client launch
(attainable within 3-5 years)
From 2014 to 1Q20, enrolled diabetes members have grown at a 185% CAGR while blood
glucose checks among LVGO’s diabetes members have grown at a 315% CAGR. We believe
this highlights the ability by LVGO to better engage with members through health nudges and
coaching the longer people are on the platform and through the enhancement of LVGO’s AI+AI
engine.
Figure 16: Enrolled Diabetes Members & Blood Glucose Checks
Source: Company data, Credit Suisse estimates
Once LVGO inks the deal with a client, the company begins working with the client to identify
the full population who may be eligible to enroll in the solution. LVGO utilizes a personalized and
targeted marketing strategy to notify potential members of their eligibility to enroll in the solution
and encourage them to sign up, which include email, direct mail, and company communications.
As a result of LVGO’s go-to market strategy, the company ends up selling its solution twice: 1)
to the employer, health plan, etc., and 2) to the employee/member encouraging them to enroll
in LVGO’s platform. And since LVGO only gets paid in its core diabetes management solution
for the subset of the at-risk populations it enrolls, the company is keenly focused on optimizing
enrollment.
27%
34% 35%
45%
2017 2018 2019 Estimate
0.6k 6k20k
54.0k
113.9k
222.7k
328.5k
1 mln 3 mln
12 mln
31 mln
73 mln
87 mln
0k
50k
100k
150k
200k
250k
300k
2014 2015 2016 2017 2018 2019 1Q20
0 mln
10 mln
20 mln
30 mln
40 mln
50 mln
60 mln
70 mln
80 mln
90 mln
Enrolled Diabetes Members Blood Glucose Checks
CAGR: 185% CAGR: 315%

14 July 2020
Livongo Health 15
LVGO not only uses its AI+AI Data Engine to create a more personalized experience for people
with chronic conditions, but also uses data science and technology to drive member enrollment.
As LVGO is primarily compensated based on the number of participants in its solution (i.e.,
PPPM), a successful marketing and enrollment strategy is paramount even beyond the contract
signing with the client. Leveraging the AI+AI engine, LVGO is able to test and iterate
messaging and other communications in various channels to drive better results.
Cross-Selling Opportunities
Livongo has continued to increase penetration of existing clients as well as attract new clients
outside of its core diabetes management platform, highlighted by 18% of LVGO’s clients having
purchased more than one solution from Livongo as of 1Q20, compared to just 4% of clients as
of 4Q18. Further, 20% of LVGO’s 3Q19 EVA of $85.53 mln (or ~$17 mln) and 35% of the
4Q19 EVA of $76.67 mln (or ~$27 mln) was for solutions other than the diabetes platform,
highlighting an increasing ability to cross-sell among solutions.
Figure 17: Percentage of LVGO Clients Purchasing Multiple Solutions
Source: Company data, Credit Suisse
By building out a portfolio of solutions aimed at covering the whole person and their care, LVGO
is able to offer an end-to-end client experience from implementation through reporting and
billing. And since all LVGO solutions are powered by the underlying AI+AI data engine, each
interface with a member is able to further feed the algorithm contributing to a valuable flywheel
effect able to provide members with better guidance over time for their health.
Figure 18: Supporting the Whole Person
Source: Company data
4%
14%
18%
4Q18 4Q19 1Q20

14 July 2020
Livongo Health 16
Using LVGO’s 1Q20 enrolled diabetes membership base and applying estimates of
comorbidities among people with diabetes, we see an annual revenue opportunity for LVGO’s
hypertension, prediabetes & weight management, and behavioral health solutions of around
$280 mln. However, LVGO is unlikely to penetrate additional solutions into its existing diabetes
membership base at the exact percentage of people living with multiple solutions. LVGO has
begun offering bundled packages of multiple solutions at reduced rates to clients in order to
take care of the “whole person,” which comes at a discounted rate and would therefore alter the
revenue opportunity for clients stacking multiple solutions for their populations.
Figure 19: Cross-Selling Revenue Opportunity
1Q20 Enrollment
LVGO for Diabetes 328.5K
Condition
% of People that
have diabetes AND
Annual
Fee
Relevant
Population
Annual Rev
Opportunity Note
Hypertension 70% $468 230K $108 mln
Overweight/Obese 85% $600 279K $168 mln 30% of overweight people have diabetes, and 85% of
diabetics are overweight
Mental Health/Depression 42% $36 136K $5 mln In any 18-month period, 33% to 50% of people with diabetes have diabetes distress.
Source: Company data, CDC, Harvard
A Sticky Healthcare-as-a-Service (HaaS) Platform
LVGO operates a sticky platform, which is evident by the 2-3% average monthly member
attrition. By way of background, LVGO calculates its monthly member churn by looking at the
members who were on the platform at the beginning of each month, subtracting the number of
those members still on the solution at the end of the month, and dividing that number by the
starting member number for such month. Then, to get the average monthly member churn
(which LVGO reports to be ~2-3%), the average of all twelve months of churn is taken.
The vast majority of LVGO’s 2-3% average monthly churn comes from members losing
eligibility, which would occur when a member leaves their current employer, followed by around
20% of churn occurring due to lapsed use of the service, where a member is no longer deemed
to be active on the platform, which depends on each client agreement, but is typically between
4 and 6 months of non-activity. Lastly, a small portion (~6%) of LVGO’s churn comes from
clients deciding to terminate their contracts with LVGO.
Figure 20: Components of Member Churn (based on 2018 data)
Source: Company data, Credit Suisse
Though 2-3% of existing membership churning out each month may be alarming at first, the
most significant reason for member churn comes as a result of the underlying turnover of
employees at LVGO’s clients. In addition, LVGO has averaged a 95% client retention rate over
the past two years (94.2% in 2018 and 95.9% in 2019), which is a more important metric to
74%
20%
6%
Members Losing Eligibility Lapsed Use by Members Client Contract Terminations

14 July 2020
Livongo Health 17
track because even if there is employee turnover at the client, as long as LVGO maintains the
contract with that client, they are able to target new employees who may be eligible to enroll in
a LVGO solution.
Another important variable in thinking about LVGO’s overall retention and performance at the
client level is the company’s dollar-based net expansion rate, which takes the monthly service
revenue at the end of the period for a set of clients (where LVGO generated monthly service
revenue 2 years prior to the calculation date) and divided by the monthly service revenue one
year prior to the calculation date for the same set of clients. The monthly service revenue is
calculated as the monthly fee for the LVGO for Diabetes and LVGO for Hypertension solutions,
multiplied by the number of active members who were on or used the solution. For 2019, the
dollar-based net expansion rate was 111.5% and for 2018 it was 113.8%. As a result, LVGO
has shown the ability to add members at clients at a rate that surpasses any attrition due to
underlying employee turnover or change in benefits.
Similar to other SaaS model companies, LVGO operates at a negative contribution margin in
year one of solution rollout after taking into account cost of devices and other direct costs
before turning to profitability in the second year of service. Note, however, that LVGO has
witnessed significant growth since 2016, and as such, we believe that the actual contribution
margins may be better than as depicted below given the company’s improved enrollment efforts
and continued scalability of its AI+AI engine.
Figure 21: LVGO Contribution Margin Overview (2016 Cohort)
Source: Company data, Credit Suisse
COVID-19 Pulled Forward the RPM Adoption
Similar to the impact COVID-19 has had on the telehealth industry, so too has the pandemic
resulted in a pull-forward of adoption of remote patient monitoring through actions taken by
various regulatory bodies. For example, the Federal Drug Administration (FDA) granted an
emergency period waiver to allow any inpatient facility in the United States to use LVGO’s
cellular-enabled diabetes meter, allowing people with COVID-19 to monitor their blood glucose
levels within the hospital inpatient setting. As personal protective equipment (PPE) has been in
high demand and supply has been a key issue in fighting the pandemic, the ability for a patient
to use LVGO’s hardware and have the data automatically transmitted to the cloud allows
healthcare providers to continually monitor patients with diabetes all while saving PPE for other
purposes. Outside of this emergency period offering, LVGO does not sell into the inpatient
setting, and has no plans to. However, LVGO has shown the flexibility of its solutions to meet
member/client needs whatever they might be.
$3.7
$12.8 $15.7
($7.15) ($5.40) ($6.20)
-92%
58%61%
-95%
-75%
-55%
-35%
-15%
5%
25%
45%
65%
($10)
($5)
$0
$5
$10
$15
$20
2016 2017 2018
Revenue Variable Costs Contribution Margin %

14 July 2020
Livongo Health 18
The sharp decline in patient visit volumes across the United States, and internationally, has
resulted in patients not receiving the proper treatment and diagnosis that would have otherwise
occurred without COVID-19. In addition, people with chronic conditions are most notably at risk
during the current pandemic as hospitalizations have been six times higher and deaths twelve
times higher for COVID-19 patients with reported underlying conditions, particularly patients
with diabetes, cardiovascular disease, and chronic lung disease. Accordingly, we expect
LVGO’s solutions to see increased interest from potential clients in the near term as entities
look to better understand the populations they are at risk for. Additionally, we see opportunity
for LVGO to report increased enrollment near term from clients already in LVGO’s portfolio via
patients looking to maintain some degree of care for their chronic condition and not being
able/willing to see a doctor in person, with a solution that is free of charge from their
employer/health plan.
Figure 22: Reported Underlying Conditions Among Persons
with Confirmed COVID-19 (Jan 22 – May 30, 2020)
Figure 23: CDC Data Highlight Vulnerability of Patients with
Underlying Health Conditions
Source: CDC, Credit Suisse Source: CDC, Credit Suisse
LVGO was relatively well-positioned heading into COVID-19 from an operational perspective
given that over one-third of LVGO employees, including health coaches and certified diabetes
educators had already been working remotely. In addition, LVGO had previously been
diversifying its supply chain by multi-sourcing production locations for the company’s connected
hardware devices.
The overall impact of COVID-19, however, is still uncertain in terms of its effect on LVGO’s
underlying member base and associated employee turnover. Based on LVGO’s prospectus filing
in 2019, some of the company’s top clients in terms of revenue in 2018 include some
prominent companies from the travel and entertainment industries, including Delta Air Lines and
Hyatt Hotels. However, management has noted that many of their employer clients, including
Amazon, have actually increased hiring. Further, some of the heavily impacted industries have
asked LVGO to accelerate their programs as a means to provide cost savings in a time
companies need it most.
Additionally, many employers have continued benefits for furloughed employees as well as some
employers structuring benefit payments for laid off employees to continue for a period of time,
which has allowed LVGO to retain those members. Further, some members after being laid off
would continue to receive their health benefits through continuation of coverage under COBRA.
Although a very small percentage of LVGO’s client base, LVGO also sells in a direct-to-
consumer (DTC) model for members that may have lost their benefit package to buy direct from
LVGO. The company has been offering this at a discounted rate in light of the current
environment to ensure members are able to continue to receive LVGO’s services.
32%
30%
17%
8%
5%
5%
1%
Any cardiovascular disease
Diabetes
Any chronic lung disease
Renal disease
Immunocompromised
Neurologic disability
Liver disease
45.4%
19.5%
7.6%1.6%
Reported Hospitalizations
(Including ICU)
Died
Patients with Underlying Condition
Patients with NO Underlying Condition

14 July 2020
Livongo Health 19
New Payment Models Create Tailwind for LVGO
As a result of Medicare not considering remote patient monitoring as a telehealth service, the
regulations for telehealth surrounding originating site and provision of services to patients limited
to rural areas do not apply to remote patient monitoring. Though these regulations have been
waived as part of the government’s response to COVID-19, the waivers are in effect for as long
as the public health emergency persists. As such, it will take lobbying and advocacy by
telehealth stakeholders to maintain these relaxations going forward – something vendors/parties
in the remote patient monitoring space do not have to spend time focusing on.
As a result of CMS changing billable CPT codes specific to remote patient monitoring, it has
allowed LVGO to accelerate penetration of the Medicare fee-for-service market. Within the
Medicare fee-for-service market, provider organizations are able to use LVGO as a tool to
manage their patient populations, and pay LVGO via its traditional subscription fee model.
However, since the provider is now able to be reimbursed under RPM CPT, the provider
organization essentially ends up paying LVGO’s subscription fee out of the money the provider
is being reimbursed with through CMS. This model is different than LVGO’s traditional client
which holds the underlying risk for the patient population (e.g., self-insured employers, health
plans, Medicare Advantage plans, etc.). As such, the underlying value proposition by LVGO is
different based on the two different models. For the self-insured employers, MA plans, etc., the
value from using LVGO comes through the ability to lower costs through better management of
chronic conditions through LVGO’s platforms. From a health system and provider perspective,
the incentive to use LVGO’s platform comes through the ability to earn a spread through billing
Medicare FFS using RPM billable CPT codes offset by the subscription fee paid to LVGO. With
the RPM CPT codes now more easily billable, LVGO has indicated that the Medicare FFS
market has become quickly available in a manner of months, versus the years it might have
taken to reach otherwise.
LVGO is still in early stages in providing its RPM solutions to health systems, though the
company does have pilot programs in place in several health systems across the country. LVGO
currently works with a number of health systems providing the LVGO solutions to employees of
the health system. However, the next step for the model would be for health systems to broadly
stand up RPM programs to monitor their patient populations, which would provide the health
system with an incremental source of revenue. In terms of payment for LVGO, management
noted that the company is still figuring out how such partnerships would work, but is assessing
whether LVGO would take a percentage of revenue or be paid under its standard subscription
model. With the changes to the remote patient monitoring reimbursable codes, it is still in the
early innings for how the structure would work as well as health systems still figuring out how
they will stand up the programs on a widespread basis and how they will be staffed.
Notably, LVGO’s preliminary 2Q20 revenue of $86-$87 mln did not come as a result of any
significant pickup in the Medicare FFS program, nor does the company expect there to be much
of a meaningful contributor for the rest of 2020. However, as a result of relaxed regulations
around Medicare reimbursement, LVGO expects the program to start generating noticeable
revenue in 2021, which previously had been thought of more as a 2024-2025 type of
opportunity.

14 July 2020
Livongo Health 20
Figure 24: LVGO Economic Model with Medicare Fee-for-Service
Source: Company data
When working with Medicare Advantage (MA) plans, LVGO operates in a similar manner to how
it provides its services with self-insured or fully-insured employers, whereby the MA plan will pay
LVGO its traditional PPPM fee and the MA plan will benefit from cost savings associated with
providing better, more proactive care to MA members and keep individuals out of the
emergency room or other costly sites of care. In addition, LVGO is also in a place to help MA
plans improve their HEDIS scores, which becomes an important factor that affects the
reimbursement rate a plan receives from CMS. By providing more proactive, and preventative,
care to MA populations by using LVGO’s solutions, MA plans are able to improve their member
satisfaction while at the same time improving their own financial position.
Figure 25: LVGO Economic Model with Medicare Advantage Plans
Source: Company data
Because of changes to Medicare regulations, LVGO was approved in early 2019 as an enrolled
provider for Medicare Advantage members. As a result, a lot of what LVGO’s certified diabetes
educators do for members is potentially billable. LVGO has been figuring out what activities their
coaches are already doing in their day-to-day can be potentially billed for and reimbursed by
CMS. Since the fee for LVGO’s coaching and other services would likely be included in the
PPPM fee paid by a health system, LVGO’s opportunity to be reimbursed by CMS for the
coaching and diabetes education it provides would most likely come through a DTC model.
Patient
PPPM
Fee
ReimbursementProvider
LVGO Platform
Access/Devices
LVGO Platform
Access/Devices
MA/LVGO
Member
MA Plan
PPPM Fee
LVGO Platform Access/Devices
Cost
Savings
Capitated Payments
14 July 2020
Livongo Health 21
Figure 26: LVGO Economic Model Using Direct-to-Consumer (DTC) Approach
Source: Company data, Credit Suisse
AI+AI Data Engine a Core Component of LVGO’s
Competitive Strategy
LVGO’s digital health platform is powered by its proprietary data engine, which the company
refers to as its AI+AI: Aggregate, Interpret, Apply, and Iterate. Through a constant feedback
loop, LVGO Aggregates data from multiple sources, Interprets that data to identify what it is a
member actually needs, Apply the insights learned from previous iterations of the AI+AI loop
about the specific member’s chronic conditions as well as similar members, and Iterate the
process tailoring the member’s experience based on their behavior and feedback. We see
LVGO’s AI+AI engine as a core component of the company’s competitive strategy. Across the
entire healthcare and consumer landscape, there is an ample amount of data to understand the
underlying trends in someone’s health and then be able to recommend and coach that person
on how to better manage their health. The key, however, is the ability to extract and understand
the data, which is why LVGO employs more data scientists than people coding their solutions.
By aggregating dozens of data sets outside of LVGO’s own proprietary data, the company is
able to create a well-rounded picture of what the key drivers are of a member’s behavior
change and do so on a member-by-member level, much like an Amazon or Netflix experience,
which is tailored specifically to an individual’s preference level. In fact, LVGO takes over 500
million data points and runs them against their algorithms to translate data into actionable,
personalized signals that improve member outcomes and financial savings. The more members
using LVGO’s various solutions, the more data are collected and the more robust and
personalized the platform is able to become for members. Members have shown appreciation
for the LVGO platform as well, as LVGO claims a +64 average net promoter score (NPS) as of
December 31, 2019.
When a member in the diabetes management solution tracks their blood glucose, they receive a
highly personalized message about what to do at that moment, which LVGO refers to as a
Health Nudge. As a result of the vast amount of data LVGO collects about each member, it is
able to engage with the member using Health Nudges that may include diet advice, medication
information, or suggestions for increases in physical activity in the relevant context. For example,
when a member measures their blood sugar in the morning and it comes back at a high level,
LVGO will ask if they had breakfast, what they ate, etc. Based on the member’s answers,
LVGO is able put their blood sugar reading in context and provide nutritional advice (e.g.,
replace the doughnut with a healthier, yet still tasteful breakfast that is better for blood sugar
levels).
Additionally, when a member takes a blood sugar measurement before they had breakfast,
LVGO is able to collect an important data point since what happens to someone’s blood sugar
while sleeping is an indication of how well their medication and dosage are working. How a
member responds to a specific Health Nudge allows LVGO to further adapt its AI+AI engine to
provide better insights in the future. 40% of LVGO’s members take action upon receiving a
Health Nudge, resulting in LVGO being able to constantly refine their algorithms.
PatientPPPM Fee
Reimbursement
LVGO Platform Access/Devices
14 July 2020
Livongo Health 22
Aggregate: Collect data from a variety of sources, including LVGO-provided devices (e.g.,
blood glucose monitors, blood pressure cuffs, weight scale, etc.), third party devices (e.g.,
Apple Watch, Fitbit, CGMs, etc.), medical/pharmacy claims, member preference surveys, etc.
Interpret: Parse through the health and consumer data and identify relevant Health Signals to
develop actionable, personalized and timely insights tailored to a specific person.
Apply: Deliver specific Health Nudges directly to members, based on each member’s chronic
condition and specific needs at exactly the right time in the right format and context.
Iterate: Iterate and continuously tailor a member’s experience based on his or her behavior,
preferences, feedback, and results, in much the same way Netflix makes entertainment
recommendations based on your preferences.
Figure 27: AI+AI Engine Overview
Source: Company data
Measurable Outcomes Bring Hard ROI for Clients
LVGO’s portfolio of solutions do not just sound good, but have demonstrated that they actually
work. For example, the Livongo for Hypertension product demonstrated a 10 mmHg reduction
in systolic blood pressure over a six-week period for individuals with a starting blood pressure of
greater than 140/80 mmHg. A 10mmHg reduction in systolic blood pressure has been shown
to reduce stroke rates by 41% and is comparable to starting a blood pressure medication.
LVGO’s core Livongo for Diabetes solution demonstrates an average 3.7x ROI in the first year of
using the solution, which is based on a 22% reduction in total medical spending, 26% reduction in
avoidable ER costs, and an average 20% diabetes-related savings. These cost reductions
translate into total medical savings of $129 PPPM. In addition, within the first year of use, 99% of
LVGO clients receive a positive ROI. However, cost savings are enhanced to $159 PPPM after
accounting for ~$30 of test strip supply costs per month, since supplies are included in LVGO’s
$75 PPPM pricing model in the Livongo for Diabetes solution. LVGO utilizes a difference-in-
difference analysis to calculate its ROI based on what clients’ spend is in the twelve months prior
to using LVGO relative to the last twelve months. Beyond year one, clients see even greater
returns as LVGO is able to make adjustments to the AI+AI engine, resulting in LVGO being better
enabled to care for members more efficiently and effectively translating to further reduced medical
spending. As a result, LVGO has disclosed that for five clients that have been with LVGO for at
least two years and that make the data available to LVGO, those clients on average experienced a
4.4x ROI in the second year using Livongo for Diabetes.

14 July 2020
Livongo Health 23
In LVGO’s Pre-Diabetes and Weight Management solution, LVGO has been able to show
weight loss in the first year of use. Further, as of December 2018, the average decrease in
weight for members who had been using the solution for 12 months was 7.32%.
As for LVGO’s Behavioral Health solution by myStrength, after tracking members’ Depression
Anxiety Stress Scale (DASS) since May 2011, and as of September 2019, 55% of LVGO’s
members showed clinical improvement.
Clients see the value in LVGO’s approach, as the company has several clients that reduce or
entirely waive the co-pay for diabetes and hypertension medications, but only if the employee
joins Livongo and engages with the platform. As a result of employers encouraging this behavior,
LVGO not only improves enrollment rates, and therefore revenue, but also helps its clients save
money across their populations.
In fact, Sony recently conducted a study geared toward assessing consumer adoption and
interest in remote health technology aimed at helping people manage chronic conditions. The
study found that almost 50% of survey respondents would visit their doctor’s office less often if
they had the means to share health data digitally. Separately, 54% of respondents indicated
they could avoid three or more annual visits to the doctor with just 10% of respondents saying
they would still need all of the visits they typically have.
Recent Notable Clients Wins and Opportunities
Livongo has recently announced some notable client wins outside of the company’s core
diabetes management solution. For example, in April 2020, Kaiser Permanente announced it
made Livongo’s myStrength mental health solution available to members in most regions with a
contract length of 5 years. Kaiser is one of the largest not-for-profit health plans in the U.S.,
serving ~12.4 mln members.
Livongo has also had recent success winning business in the government payer space, having
landed a large contract with the Government Employee Health Association (GEHA) in May
2020 as well as a contract with the Federal Employees Health Benefits Program (FEHBP) back
in October 2019. The contract with GEHA is one of LVGO’s largest yet, with GEHA
representing 2 million lives. Further, the contract with GEHA allows LVGO to provide diabetes,
hypertension, and prediabetes solutions as a benefit to eligible members.
LVGO’s largest contract win came in October 2019 through the Federal Employees Health
Benefits Program (FEHBP) under one health plan covering 5.3 mln federal employees, retirees,
and their families out of ~8 mln people who receive their benefits through the FEHBP. Notably,
LVGO is expecting FEHBP to contribute 25k enrolled diabetes members in 2020 and 25k
more in 2021 with a revenue contribution of $20-25 mln in 2020 and $30-35 mln in 2021.
LVGO also picked up an important win in March 2020 when the Health Transformation Alliance
(HTA) and Welltok selected LVGO as the first health and wellbeing partner for the consumer
engagement platform available to the over 50 HTA member/owners. By way of background,
Welltok operates as an enterprise SaaS company delivering a healthcare consumer activation
platform. Welltok pre-integrates digital health platforms, like LVGO for example, and then offers
its own aggregated platform of resources to health plans, health systems, and had been
recently selected to operate the HTA’s marketplace (see our HCDT&I note featuring Welltok).
Notably, the HTA’s marketplace of health and well-being programs will offer LVGO’s Diabetes,
Hypertension, Prediabetes & Weight Management programs to the more than 7 million lives
covered by the cooperative’s 50+ self-insured employer member/owners. The underlying
member/owners of the HTA will allow LVGO to gain access to more of largest Fortune 500
employers in the country.
Most recently, it was announced that Priority Health, the second largest health plan in Michigan,
would be offering LVGO’s myStrength behavioral health solution at no cost for all members who
sign up. In addition, BlueCross BlueShield of Western New York is offering the myStrength app
to its nearly one million members to support members’ overall wellness during the pandemic.

14 July 2020
Livongo Health 24
Strong Financial Performance
LVGO has shown consistent, strong revenue growth most notably from its foundational Livongo
for Diabetes solution, as the company has grown its client base and improved enrollment rates
among its members. Notably, a significant majority of this revenue growth has come from
LVGO’s penetration in the self-insured employer market. Even with the strong growth already
experienced, we see a long runway ahead for LVGO to capture more share in the self-insured
market given that LVGO’s 328.5K enrolled diabetes members represent just ~1% of the total
+30 mln people living with diabetes in the U.S. Further, management has pointed to the
company gaining traction in the fully insured health plan market, as LVGO has been able to
demonstrate clinical improvements in its existing base, which further solidifies the company’s
value proposition. In addition, we see a significant, largely untouched growth opportunity for
LVGO in the Medicare (MA and FFS) and Medicaid markets.
In terms of EBITDA, since LVGO entered the public markets the company has indicated an
expectation to turn adjusted EBITDA positive and remain there on a sustained basis beginning
in 2021. However, LVGO has been continuing to show improvement in EBITDA margins as the
company has continued to gain operating leverage through its AI+AI engine in recruitment of
members, better retention, and in the use of digital coaching. In addition, LVGO has seen
improvements from the higher incremental margins associated from members who stay on the
LVGO platform for longer. As a result of improved operating leverage, LVGO posted positive
adjusted EBITDA of $3.8 mln in 1Q20. Notably, 4Q19 although showing positive EBITDA of
$1.6 mln, the quarter included a $1.9 mln one-time beneficial adjustment for the deferral of
costs in the hypertension solution’s blood pressure cuffs and the weight scales in the
prediabetes & weight management solution, which LVGO will defer and amortize going forward.
4Q19 also benefited from a one-time adjustment of $1.2 mln for a portion of sales
commissions deferred/amortized moving forward. Taking into account these one-time
adjustments, we see 1Q20 as LVGO’s first quarter of true positive adjusted EBITDA. Based on
LVGO’s preliminary reported revenue for 2Q20 of $86-$87 mln (vs. previous guidance of $73-
$75 mln) we expect LVGO to report positive adjusted EBITDA for 2Q20. For reference, going
into 1Q20, LVGO was guiding to revenue of $60-$62 mln and adjusted EBITDA of ($4.5)-
($5.5) mln, where the company also preannounced revenues of $65.5-$66.5 mln. When the
company actually reported 1Q20 results, LVGO came in at $68.8 mln in revenue and a positive
$3.8 mln in EBITDA.
Figure 28: LVGO Annual Revenue Figure 29: LVGO Annual Adj. EBITDA
Source: Company data, Credit Suisse estimates Source: Company data, Credit Suisse estimates
$31 $68 $170
$354
$563
$785
$1,027
2017 2018 2019 2020E 2021E 2022E 2023E
($14.1)($27.7)
($20.1)
$7.8
$32.3
$71.4
$128.2
2017 2018 2019 2020E 2021E 2022E 2023E
14 July 2020
Livongo Health 25
Investment Risks
Exposure to High Unemployment Rate
LVGO derives a high concentration of revenue to clients that are self-insured employers. Thus,
the significant rise in unemployment as a result of COVID-19 brings inherent risk. In addition,
any prolonged economic recession poses risk to the future of LVGO’s revenue outlook if layoffs
were to be disproportionately concentrated to where LVGO derives its members.
Channel Partners’ Influence on Revenue
LVGO has a significant amount of revenue influenced by its channel partners, who collect an
administrative/marketing commission for their services. Sales through LVGO’s top five channel
partners (Express Scripts, CVS Pharmacy, Health Care Service Corporation, Anthem, and
Highmark) represented 61.3% of LVGO’s revenue in 2019. Further, LVGO contracts with its
channel partners and resellers on a non-exclusive basis. As a result, such channel partners are
able to refer business to LVGO’s competitors or develop their own solutions.
In exchange for the speed and access to new client populations LVGO’s channel partners
provide, LVGO gives up a high-single-digit percentage of top-line revenue. As a result of the
upfront cost LVGO incurs as part of bringing in a client through its partner channel rather than
through its own direct sales force, the time to breakeven on a cash basis is further delayed.
LVGO and CVS have worked together since 2017 through CVS Health’s Transform Diabetes
Care (TDC) program, which aims to help CVS’ PBM clients improve health outcomes for their
members and therefore lower costs by using solutions like LVGO. Recently, CVS rolled out a
next generation Transform Diabetes Care program, in which LVGO has opted not to participate.
The new CVS program will be shifting to a per-member-per-month model versus LVGO’s
traditional (outside of behavioral health) per-participant-per-month model, which the company
has found success in selling as clients only have to pay for what they use. The decision by
LVGO to opt out of the new CVS Transform Diabetes Care program appears to have affected
the CVS relationship to some extent. For instance, back in March 2020, CVS announced that it
would be adding 5 digital health offerings (Livongo, Hinge Health, Hello Heart, Torchlight, and
Whil) to CVS Health’s Point Solutions Management platform, which is similar to Express Scripts’
Health Connect 360 solution. Since LVGO made the decision to opt out of CVS’ new
Transform Diabetes Care program, CVS appears to have dropped LVGO from the Point
Solutions Management platform.
Though LVGO’s channel partners do present a degree of risk given the significant percentage
of revenue that is influenced, since the contracts with LVGO’s partners are set up as a revenue
share agreement, each party has an incentive to help LVGO attract new business as well as
retain existing business.
A New, But Rapidly Growing Market Brings Competition
LVGO operates in a relatively new, but rapidly growing section of the digital healthcare ecosystem.
The company competes against a wide array of companies, including Virta Health, Omada Health,
Glooko, Hello Heart, Lyra Health, Onduo LLC, and Ginger.io. In addition, LVGO also faces
competition from healthcare providers and insurance carriers who develop their own platform or
tools for their populations. LVGO also faces competition from device manufacturers, which
facilitate data collection, but are not as capable to offer the interpretation, feedback or guidance
that LVGO is able to provide via its robust data collection efforts and AI+AI engine.
We believe LVGO may face the largest threat in competition from some of the large tech
companies (e.g., Apple, Google, Amazon, Microsoft, etc.), which are well-capitalized, have the
technological capabilities to compete with and offer a cloud-based platform collecting healthcare
data from a wide-range of sources like LVGO does, in addition to these companies having the
consumer-friendly hardware that can be integrated with a healthcare platform (e.g., Apple
Watch, Fitbit, etc.).

14 July 2020
Livongo Health 26
CGM Vendors & Device Manufacturers
We see LVGO’s value coming from the services and platform approach the company provides,
rather than the actual devices provided to members. LVGO currently has strategic partnerships
with two of the leading manufacturers of CGMs in the market, Dexcom and Abbott, where
LVGO is able to integrate the data obtained from the CGM, analyze it, and deliver better insights
to LVGO’s members. Though LVGO derives a significant majority of its revenue from its
diabetes management platform, we see LVGO’s approach to expanding to other chronic
conditions as a differentiating factor between device manufacturers. However, if CGMs/device
manufacturers build out more robust software and data science-enabled platforms
supplementing their core devices, it does present an inherent risk to LVGO’s strategy.
Health Insurers Offering Own Digital Care Programs
With the large market opportunity in chronic care management, health insurance carriers may
begin developing/acquiring digital health solutions to manage their own insured populations, as
well as offering their own chronic care management programs to self-insured employer clients.
Earlier this week, UnitedHealth announced that it is offering a pilot program using Level2 to
over 230K employer-sponsored, fully insured members in 27 states, including Washington D.C.
By way of background, Level2 is a data-driven care program for individuals with type 2 diabetes
and offers participants the Dexcom G6 CGM system as well as a Fitbit activity tracker with a
focus on reducing A1C levels and potentially type 2 diabetes remission. In addition, the
announcement highlighted that UNH may offer a similar model for chronic conditions other than
type 2 diabetes.
Based on our conversations with LVGO, the company noted that LVGO has around 10-20% of
its members using CGMs currently where the company’s model does not require the use of a
CGM to enroll in the program. Management noted that although CGMs present a valuable
opportunity to help manage individuals manage their diabetes, some people are still not
comfortable using CGMs. In addition, management noted that, depending on the insurance plan,
CGMs may not be covered if the individual isn’t insulin dependent. However, UnitedHealth could
be relaxing some of these requirements in its Level2 initiative to expand its reach to its diabetes
population.
Though the chronic care market presents a large opportunity for multiple entities to capture
growth, a significant push by UnitedHealth or other health insurers offering their own programs
and technologies could pose a risk to Livongo and others in the digital health ecosystem.

14 July 2020
Livongo Health 27
Price Performance and Valuation
During 2019, LVGO shares fell 34% including reaching a trough of $15.92 (representing a
58% decline relative to the closing price of $38.10 on LVGO’s 7/25/19 IPO). However, in
2020 shares have recovered 2019’s losses and more, delivering a 289% return YTD. Since the
IPO, LVGO shares have returned 156%. We see the key drivers of this outperformance being
driven by LVGO’s ability to maintain care for at-risk populations during COVID-19, while
delivering financial ROIs for clients at a time when financial uncertainty for stakeholders is a key
concern. In addition, LVGO has announced notable client relationships in 2020, such as being
selected as the first partner in the Health Transformation Alliance (HTA)/Welltok’s consumer
engagement platform and Kaiser Permanente making LVGO’s behavioral health solution
available to members. Most recently, shares spiked after LVGO reported preliminary revenue
results for 2Q20 of $86-$87 mln vs. previous guidance of $73-$75 mln.
Figure 30: LVGO vs. S&P Price Performance
2019 2020 YTD*
LVGO -34.2% 288.6%
S&P 500 Health Care Index 18.7% -0.7%
S&P 500 28.9% -2.3%
Source: FactSet, Credit Suisse, *YTD through July 13, 2020
The primary valuation metric we use to value LVGO shares is EV/Sales primarily due to the
company’s growth profile and limited history of positive earnings. On an EV/Sales metric, LVGO
shares currently trade at approximately 25.9x our 2020 revenue estimate and 16.3x our 2021
revenue estimate. When compared with a mix of similar top-line growth profile software-as-a-
service (SaaS) and healthcare technology companies, LVGO trades at a discounted valuation
relative to the group average (16.3x our 2021 revenue estimate vs the group average of 18.0x),
despite a Y/Y revenue growth expectation of 59% in 2021, more than double the average
revenue growth expectation of 27% for the group.
We expect LVGO shares to maintain its one-year forward current EV/Sales multiple of 26x one
year from now. A 26x multiple on our 2021 revenue estimate for LVGO yields a 12-month TP
of $132. A $132 price target would imply roughly 36% upside potential from the current levels,
and thus an Outperform rating.

14 July 2020
Livongo Health 28
Figure 31: Industry Comparable EV/Sales and Revenue Growth
EV/Sales Revenue Growth EV/Sales / Rev
Growth
Ticker Peer Comps 2020 2021 2022 2020 2021 2022 2021 2022
TWLO Twilio 19.9x 16.0x 12.7x 34% 25% 26% 0.64 0.49
ZM Zoom 43.9x 33.3x 26.4x 176% 32% 26% 1.05 1.01
COUP Coupa Software 39.3x 31.3x 24.7x 28% 25% 27% 1.23 0.93
OKTA Okta, Inc 32.4x 24.9x 19.3x 34% 30% 29% 0.83 0.66
CRWD CrowdStrike Holdings 29.5x 22.2x 16.8x 63% 33% 32% 0.67 0.53
DDOG Datadog 44.7x 33.3x 24.7x 55% 34% 35% 0.97 0.71
ZS Zscaler 31.9x 24.7x 19.2x 36% 29% 28% 0.84 0.68
CRM salesforce.com 8.4x 7.1x 6.0x 19% 17% 19% 0.41 0.32
WDAY Workday, Inc. 10.4x 8.8x 7.4x 16% 18% 19% 0.50 0.38
NOW ServiceNow, Inc. 17.5x 14.0x 11.2x 26% 25% 25% 0.56 0.45
ADBE Adobe Inc. 16.5x 14.3x 12.6x 14% 15% 14% 0.95 0.93
HUBS HubSpot 11.4x 9.4x 7.5x 19% 21% 26% 0.46 0.29
WORK Slack Technologies 21.4x 16.2x 12.3x 39% 32% 32% 0.52 0.39
SMAR Smartsheet 14.5x 11.2x 8.4x 36% 30% 34% 0.38 0.24
ZEN Zendesk 10.1x 8.1x 6.4x 24% 25% 26% 0.32 0.24
VEEV Veeva Systems 25.5x 21.3x 17.9x 27% 20% 19% 1.08 0.93
ONEM One Medical 15.3x 10.9x 8.8x 8% 40% 25% 0.27 0.35
TDOC Teladoc 21.9x 17.1x 13.8x 49% 28% 24% 0.61 0.56
Peer - Average 23.0x 18.0x 14.2x 39% 27% 26% 0.68 0.56
LVGO Livongo 25.9x 16.3x 11.7x 108% 59% 39% 0.27 0.30
Source: FactSet, Credit Suisse, as of July 13, 2020, LVGO revenue growth based on Credit Suisse estimates
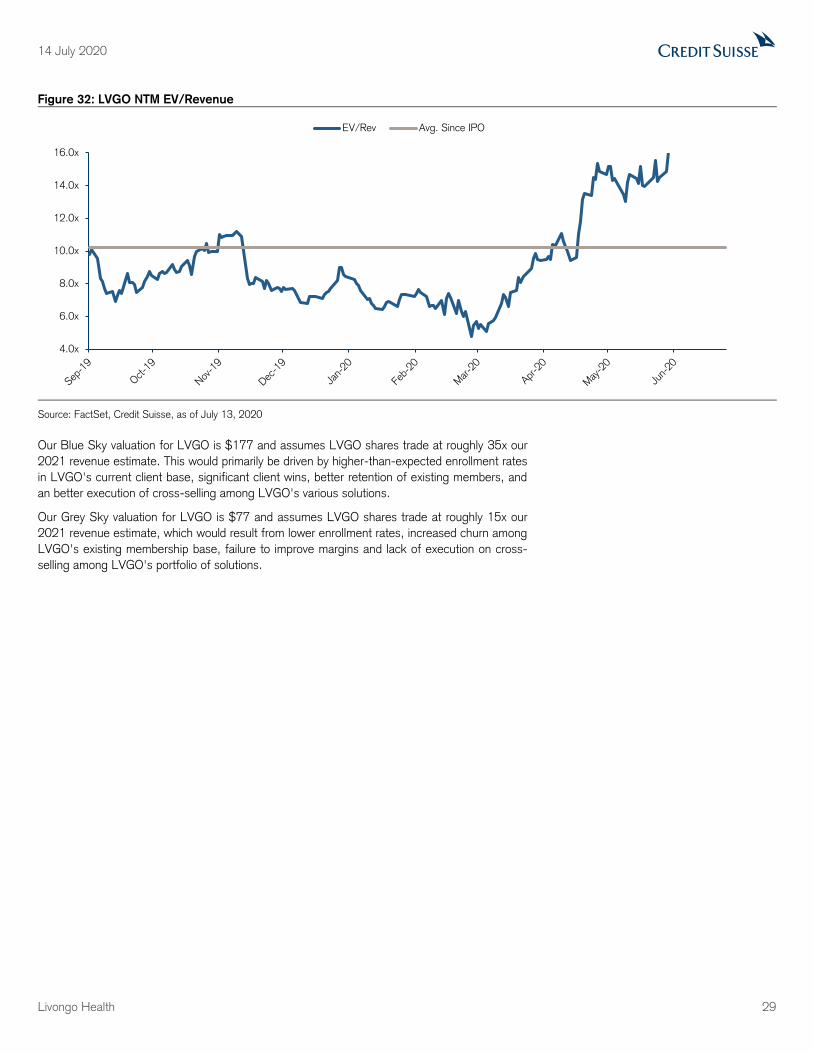
14 July 2020
Livongo Health 29
Figure 32: LVGO NTM EV/Revenue
Source: FactSet, Credit Suisse, as of July 13, 2020
Our Blue Sky valuation for LVGO is $177 and assumes LVGO shares trade at roughly 35x our
2021 revenue estimate. This would primarily be driven by higher-than-expected enrollment rates
in LVGO's current client base, significant client wins, better retention of existing members, and
an better execution of cross-selling among LVGO's various solutions.
Our Grey Sky valuation for LVGO is $77 and assumes LVGO shares trade at roughly 15x our
2021 revenue estimate, which would result from lower enrollment rates, increased churn among
LVGO's existing membership base, failure to improve margins and lack of execution on cross-
selling among LVGO's portfolio of solutions.
4.0x
6.0x
8.0x
10.0x
12.0x
14.0x
16.0x
EV/Rev Avg. Since IPO

14 July 2020
Livongo Health 30
Company Overview
Livongo is a digital health company that develops and operates a consumer digital health
platform that provides smart, connected devices, informed coaching, data science-enabled
insights, and facilitates access to medications/treatment across multiple chronic conditions.
Despite the fact people are forced to live with their chronic condition 24x7x365, the current
healthcare service model is primarily administered at hospitals or clinics. With LVGO, members
are provided with an ability to streamline their interactions with the healthcare system, so they
can focus their time and energy on the rest of their lives, instead of managing their care with
unneeded hospital visits.
The company was built around its marquee solution, Livongo for Diabetes, which has accounted
for a substantial portion of total revenue and is expected to continue for the next several years.
However, beginning in April 2018, Livongo began expanding its portfolio with the acquisition of
Retrofit, Inc. (rebranded to Livongo for Prediabetes & Weight Management), a provider of
weight management and disease prevention programs. Since the acquisition of Retrofit, Livongo
has rapidly entered new markets with the rollout of Livongo for Hypertension and the acquisition
of behavioral health provider. Through LVGO’s entrance into these new markets, the company
has moved toward its goal of being able to care for ‘the whole person’.
By leveraging data science and technology, LVGO is able to provide a personalized experience
for people with chronic conditions that helps them live better, healthier lives. LVGO’s platform is
powered by its proprietary engine referred to as AI+AI, which Aggregates data from multiple
sources, Interprets that data to separate signal from noise, Applies it at just the right time on
the right surface to LVGO’s members and Iterates to build improvements based on what is
learned through each interaction. Through LVGO’s Applied Health Signals, LVGO ensures that
every time a member contributes information (e.g., checking blood glucose levels, stepping on
the connected weight scale, checking their blood pressure, etc.), they receive tailored,
actionable guidance in return. For example, when a member checks their blood glucose, that
member receives a Health Nudge to manage their condition. Based on the member’s response
to a Health Nudge, LVGO is able to adapt its algorithms based on a constant feedback loop,
which enables LVGO to provide better insights to the company’s entire member base.
LVGO offers an integrated suite of solutions, which can be purchased individually or bundled
together, to promote sustainable health behavior change based on real-time data captured by
LVGO’s own devices as well as third-party sources, with insights driven through use of data
science, and incorporating human intervention when needed. LVGO’s suite of solutions shares
a common product architecture and data structure, delivered through a common user interface,
multi-channel applications for management, and a cross-condition integrated coaching model.
Solution Overview
Livongo for Diabetes: Members receive a cellular-connected interactive blood glucose meter,
unlimited blood glucose test strips, personalized Health Nudges to support behavior change,
digital tools across mobile, web, and email, as well as coaching and monitoring.
Livongo for Hypertension: Members receive a wireless, connected blood pressure monitor
and cuff which transmits data after each measurement to the mobile app. Members are able to
review their results, get Health Nudges for managing their blood pressure by reminding them to
take their medication, following healthy eating patterns, be more physically active, and receive
coaching and monitoring.
Livongo for Prediabetes and Weight Management: Members who are at risk for developing
diabetes or are overweight are offered a combination of a cellular-connected weight scale, a
mobile experience that includes health education, personalized coaching by registered dieticians
and exercise physiologists, group classes, and online communities to encourage healthy eating
and exercise habits.

14 July 2020
Livongo Health 31
Livongo for Behavioral Health by myStrength: LVGO offers its behavioral health solution
using a digital-first approach to delivering evidence-based interventions including cognitive
behavioral therapy, acceptance and commitment therapy, positive psychology, mindfulness, and
motivational interviewing to help resolve clinical conditions, build resiliency, manage stress,
improve mood, sleep better, or simply find daily inspiration.
Margin Expansion Opportunity Through CGMs
LVGO estimates that between 10% and 20% of its member population uses a continuous
glucose monitor (CGM). The vast majority of CGMs are used by those with type 1 diabetes, which
tend to be intensive and regular users of insulin injections and represent ~3 mln of people with
diabetes in the U.S. Since people with type 1 diabetes are insulin dependent (e.g., their pancreas
doesn’t produce insulin), they require regular injections into the body to maintain an appropriate
amount of insulin, which allows for the body to move sugar (glucose) from the bloodstream and
into the cells. As a result, a CGM can become efficient for helping those with type 1 diabetes
manage their insulin production. However, the diabetes population is immensely skewed toward
those with type 2 diabetes. Type 2 diabetes is different from type 1, in that the body still produces
insulin, but it doesn’t move glucose into the cells as effectively as it should. When sugar is unable
to enter the body’s cells, a high level of sugar builds up in the blood (called hyperglycemia) and the
body is unable to use the glucose for energy. However, a CGM can become extremely valuable for
people with type 2 diabetes in helping them better monitor and manage their blood sugar levels as
they are able to in real-time check on their metrics. The barrier for use in type 2 diabetes
population adoption, however, has come down to insurance coverage as the devices are often not
covered for those with type 2. In addition, when the device is not covered by insurance, the price
point for the CGM becomes another barrier as they are not cheap. The value in the CGM for
people with type 2 diabetes comes through an enhanced ability to monitor their blood sugar levels
without having to constantly prick their finger to check their readings, allowing them to more
effectively maintain proper diet, exercise, and medication. As CGM technology becomes more
sophisticated, and as manufacturers become more efficient in their production processes, price
points are likely to drop, making devices more affordable from an out-of-pocket standpoint and
adoption rates increase. In addition, as diabetes awareness improves and the technology
underlying CGMs becomes more efficient/less-costly, health plans are likely to improve coverage
for CGMs in type 2 diabetes populations.
Overall, we see advancement in the CGM market having a positive impact on LVGO in two,
interrelated ways: 1) An enhanced ability to collect blood glucose, and other vitals from its
members and therefore improving the AI+AI engine; and 2) Margin improvement, via LVGO not
having to incur costs for the blood glucose monitoring strips and other supplies that are included
in the LVGO PPPM fee structure. In fact, LVGO does not pride itself on being a company that
provides devices/supplies for its members, but rather on the company’s artificial intelligence and
consumer engagement platform. LVGO collects data from multiple sources, not just through
members using the LVGO-provided devices.
Business Model
LVGO sells to clients, and acquires members, through the company’s direct sales force as well
as through channel partners, PBMs, and resellers. However, LVGO contracts directly with each
client. In each of LVGO’s solutions, with the exception of the Behavioral Healthy by myStrength
solution, LVGO invoices clients monthly on a per-participant basis. For the Livongo for
Behavioral Health by myStrength solution, however, LVGO’s fee is based on the per-member-
per-month (PMPM) rate multiplied by the number of members who have access to the solution.
In addition, LVGO may charge an upfront fee for the devices, resulting in a lower subscription
fee rate, with the upfront fee amortized to revenue over the expected member enrollment period
(~24 months).

14 July 2020
Livongo Health 32
The company tends to enter into contracts in the second half of the year as employer benefit
plans are established for the following year. It takes around 6 months on average from initial
outreach to signing a contract with a client. Once the contract is signed, it takes around 3
months on average to begin enrolling members on the LVGO platform, which allows LVGO to
begin billing the client based on the number of participating members (except for the
myStrength solution, which is simply based on availability). The company essentially has to sell
their service twice: 1) LVGO sells their solution to the client (e.g. self-insured employer, health
plans, MA plans, etc); and 2) LVGO must enroll individual members (except for myStrength) to
generate revenue. As such, LVGO leverages its data science and technology to develop the
most optimal outreach strategies in order to increase enrollment rates. It takes around 9 months
on average from initial enrollment to reach LVGO’s average 35% enrollment rate.
As chronic conditions and the associated costs across the United States, and internationally,
continue to rise, there is, and will continue to be, a need to care for patients before they reach
most costly sites of care. Given that the chronic conditions are not mutually exclusive with one
another (e.g., 70% of people with diabetes have hypertension), LVGO’s approach of offering a
digital health platform will be well-positioned to address the needs of those living with chronic
conditions.

14 J
uly 2
020
Livo
ngo H
ealth
3
3
Financials
Figure 33: Quarterly Income Statement ($ in millions except per share)
Source: Company data, Credit Suisse estimates
1Q20 1Q19 Y/Y ∆ 2Q20E 2Q19 Y/Y ∆ 3Q20E 3Q19 Y/Y ∆ 4Q20E 4Q19 Y/Y ∆ 2020E 2019 Y/Y ∆
Operating revenues $68.8 $32.1 114.6% $86.7 $40.9 112.1% $96.4 $46.7 106.5% $101.8 $50.4 102.1% $353.7 $170.2 107.8%
Guidance $86-$87 $290-$303
COGS $17.6 $9.5 84.6% $23.4 $12.5 87.0% $25.5 $11.7 118.6% $26.5 $10.5 152.7% $93.0 $44.5 109.1%
Gross Profit $51.2 $22.5 127.3% $63.3 $28.4 123.3% $70.8 $35.0 102.5% $75.3 $39.9 88.8% $260.7 $125.7 107.4%
R&D $11.6 $8.6 34.7% $14.3 $9.8 46.0% $19.3 $12.3 56.3% $22.4 $10.9 106.1% $67.6 $41.6 62.4%
Sales and marketing $25.2 $14.2 77.3% $32.1 $17.7 81.8% $37.6 $18.1 107.7% $39.7 $18.2 117.6% $134.5 $69.2 94.3%
General and administrative $11.9 $9.0 32.1% $13.0 $9.8 33.2% $14.5 $9.3 55.1% $16.8 $10.2 64.5% $56.1 $38.3 46.6%
EBITDA $3.8 ($8.6) (143.8%) $5.2 ($8.1) (164.0%) $0.9 ($3.9) (123.0%) ($2.1) $1.6 (231.1%) $7.8 ($20.1) (138.5%)
Guidance ($2) - $0 ($14)-($10)
Depreciation and amortization $1.2 $0.7 69.5% $1.3 $0.8 69.8% $1.4 $0.9 60.1% $1.5 $1.0 46.0% $5.3 $3.3 60.0%
EBIT $2.6 ($9.3) (127.8%) $3.9 ($8.9) (144.1%) ($0.5) ($4.8) (89.9%) ($3.6) $0.6 (720.5%) $2.4 ($23.4) (110.4%)
Other income, net $1.3 $0.5 184.6% $0.0 $0.2 (100.0%) ($4.0) $1.4 (383.9%) ($4.0) $1.7 (337.2%) ($6.7) $3.7 (278.6%)
Pretax income (loss) $3.9 ($8.8) (144.2%) $3.9 ($8.7) (145.0%) ($4.5) ($3.4) 33.2% ($7.6) $2.3 (434.6%) ($4.2) ($19.7) (78.4%)
Income tax (benefit) $0.0 $0.0 162.5% $0.0 $0.0 290.3% ($0.0) $0.0 (473.5%) ($0.0) $0.0 (572.6%) ($0.0) $0.0 (173.0%)
Accretion of Redeemable Convert Preferred Stock $0.0 $0.0 (100.0%) $0.0 $0.0 (100.0%) $0.0 $0.0 (100.0%) $0.0 $0.0 $0.0 $0.1 (100.0%)
Net earnings (loss) attritutable to LVGO $3.9 ($8.9) (143.7%) $3.9 ($8.7) (144.5%) ($4.5) ($3.4) 31.8% ($7.5) $2.3 (434.1%) ($4.2) ($19.8) (78.7%)
One time charges, net of tax ($9.4) ($5.6) 69.9% ($21.0) ($5.6) 277.3% ($14.7) ($16.3) (10.0%) ($7.5) ($8.3) (10.0%) ($52.6) ($35.8) 47.1%GAAP net earnings (loss) ($5.6) ($14.4) (61.3%) ($17.1) ($14.3) 19.8% ($19.2) ($19.7) (2.8%) ($15.0) ($6.0) 148.0% ($56.8) ($55.4) 2.7%
Shares outstanding (diluted) 112.3 18.2 112.6 18.9 112.9 72.2 113.3 112.1 112.8 50.9
Adj. EPS $0.03 ($0.49) $0.03 ($0.46) ($0.04) ($0.05) ($0.07) $0.02 ($0.04) ($0.39)
Margin Analysis (% of revenues)
COGS ratio 25.6% 29.7% 27.0% 30.6% 26.5% 25.0% 26.0% 20.8% 26.3% 26.1%
Gross Margin 74.4% 70.3% 73.0% 69.4% 73.5% 75.0% 74.0% 79.2% 73.7% 73.9%
R&D 16.9% 26.9% 16.5% 24.0% 20.0% 26.4% 22.0% 21.6% 19.1% 24.5%
Sales and marketing 36.6% 44.2% 37.0% 43.2% 39.0% 38.8% 39.0% 36.2% 38.0% 40.7%
General and administrative 17.2% 28.0% 15.0% 23.9% 15.0% 20.0% 16.5% 20.3% 15.9% 22.5%
Total Opex Ratio 70.7% 99.2% 68.5% 91.0% 74.0% 85.2% 77.5% 78.1% 73.0% 87.6%
EBITDA margin 5.5% -26.7% 6.0% -19.8% 0.9% -8.4% -2.0% 3.2% 2.2% -11.8%
Depreciation and amortization 1.7% 2.2% 1.5% 1.8% 1.4% 1.8% 1.5% 2.0% 1.5% 2.0%
EBIT margin 3.7% -28.9% 4.5% -21.7% -0.5% -10.2% -3.5% 1.1% 0.7% -13.8%
Other income, net 1.9% 1.4% 0.0% 0.5% -4.2% 3.0% -3.9% 3.3% -1.9% 2.2%
Pretax margin 5.7% -27.5% 4.5% -21.2% -4.7% -7.2% -7.4% 4.5% -1.2% -11.6%
Reported tax rate 0.5% -0.1% 0.5% -0.1% 0.5% -0.2% 0.5% 0.4% 0.5% -0.1%
Accretion of Redeemable Convet Preferred Stock 0.0% 0.1% 0.0% 0.1% 0.0% 0.0% 0.0% 0.0% 0.0% 0.1%Adjusted earnings (loss) attributable to LVGO 5.6% -27.6% 4.5% -21.3% -4.6% -7.3% -7.4% 4.5% -1.2% -11.6%

14 July 2020
Livongo Health 34
Figure 34: Annual Income Statement ($ in millions except per share)
Source: Company data, Credit Suisse estimates
($ million except EPS) 2017 2018 2019 2020E 2021E 2022E 2023E
Operating revenues $30.9 $68.4 $170.2 $353.7 $563.2 $784.9 $1,026.6
Guidance $290-$303
COGS $8.3 $19.9 $44.487 $93.0 $147.9 $206.1 $269.5
Gross Profit $22.6 $48.5 $125.7 $260.7 $415.2 $578.8 $757.1
R&D $11.5 $22.7 $41.6 $67.6 $102.7 $135.3 $166.7
Sales and marketing $16.1 $35.2 $69.2 $134.5 $205.8 $275.0 $344.1
General and administrative $9.4 $19.5 $38.3 $56.1 $81.4 $105.7 $128.1
EBITDA ($14.1) ($27.7) ($20.1) $7.8 $32.3 $71.4 $128.2
Guidance ($14)-($10)
Depreciation and amortization $0.4 $1.3 $3.3 $5.3 $6.9 $8.5 $10.1
EBIT ($14.5) ($28.9) ($23.4) $2.4 $25.3 $62.8 $118.1
Other income, net $0.1 $1.6 $3.7 ($6.7) ($16.0) ($16.0) ($16.0)
Pretax income (loss) ($14.3) ($27.3) ($19.703) ($4.2) $9.3 $46.8 $102.1
Income tax (benefit) ($0.1) $0.0 $0.027 ($0.0) $0.0 $2.3 $12.8
Accretion of Redeemable Convert Preferred Stock $0.1 $0.2 $0.096 $0.0 $0.0 $0.0 $0.0
Net earnings (loss) attritutable to LVGO ($14.4) ($27.5) ($19.826) ($4.2) $9.3 $44.5 $89.4
One time charges, net of tax ($2.6) ($6.1) ($35.8) ($52.6) ($60.5) ($69.6) ($80.0)
GAAP net earnings (loss) ($17.0) ($55.4) ($55.4) ($56.8) ($51.2) ($25.1) $9.3
Shares outstanding (diluted) 14.4 16.6 50.9 112.8 114.1 115.4 116.7
Adj. EPS ($1.00) ($1.66) ($0.39) ($0.04) $0.08 $0.39 $0.77
Margin Analysis (% of revenues)
COGS ratio 26.9% 29.1% 26.1% 26.3% 26.3% 26.3% 26.3%
Gross Margin 73.1% 70.9% 73.9% 73.7% 73.7% 73.7% 73.7%
R&D 37.2% 33.1% 24.5% 19.1% 18.2% 17.2% 16.2%
Sales and marketing 52.2% 51.5% 40.7% 38.0% 36.5% 35.0% 33.5%
General and administrative 30.6% 28.5% 22.5% 15.9% 14.5% 13.5% 12.5%
Total Opex Ratio 120.0% 113.1% 87.6% 73.0% 69.2% 65.7% 62.2%
EBITDA margin -45.7% -40.4% -11.8% 2.2% 5.7% 9.1% 12.5%
Depreciation and amortization 1.2% 1.8% 2.0% 1.5% 1.2% 1.1% 1.0%
EBIT margin -46.9% -42.3% -13.8% 0.7% 4.5% 8.0% 11.5%
Other income, net 0.4% 2.4% 2.2% -1.9% -2.8% -2.0% -1.6%
Pretax margin -46.5% -39.9% -11.6% -1.2% 1.7% 6.0% 9.9%
Reported tax rate 0.4% -0.1% -0.1% 0.5% 0.5% 5.0% 12.5%
Accretion of Redeemable Convet Preferred Stock 0.5% 0.2% 0.1% 0.0% 0.0% 0.0% 0.0%
Adjusted earnings (loss) attributable to LVGO -46.7% -40.1% -11.6% -1.2% 1.7% 5.7% 8.7%
Year-Over-Year % Change
Operating revenues 121.8% 148.7% 107.8% 59.2% 39.4% 30.8%
Cost of revenue 140.1% 123.2% 109.1% 59.1% 39.3% 30.8%
Gross Profit 115.1% 159.2% 107.4% 59.3% 39.4% 30.8%
Operating Expenses:
R&D 97.4% 83.6% 62.4% 51.9% 31.8% 23.2%
Sales and marketing 119.1% 96.5% 94.3% 53.0% 33.6% 25.2%
General and administrative 106.7% 96.3% 46.6% 45.1% 29.8% 21.2%
EBITDA 96.2% -27.2% -138.5% 316.0% 121.2% 79.7%
EBIT 1234.1% 128.0% -278.6% 139.3% 0.0% 0.0%
Net earnings (loss) attributable to LVGO 90.5% -27.8% -78.7% -319.8% 378.6% 100.8%
Adj. EPS 66.0% -76.5% -90.4% -317.3% 373.2% 98.6%

14 July 2020
Livongo Health 35
Companies Mentioned (Price as of 13-Jul-2020) 1life Healthcare (ONEM.OQ, $38.06) Abbott Laboratories (ABT.N, $93.09) Adobe Systems Inc. (ADBE.OQ, $442.47) Alphabet (GOOGL.OQ, $1512.23) Amazon com Inc. (AMZN.OQ, $3104.0) Anthem, Inc. (ANTM.N, $257.58) Apple Inc (AAPL.OQ, $381.91) CVS Health (CVS.N, $62.62) Care Service (2425.T, ¥493) Coupa (COUP.OQ, $283.01) CrowdStrike, Inc. (CRWD.OQ, $106.21) Datadog (DDOG.OQ, $86.66) Delta Air Lines, Inc. (DAL.N, $26.82) DexCom, Inc. (DXCM.OQ, $404.23) HubSpot (HUBS.N, $218.09) Hyatt Hotels (H.N, $49.15) Livongo Health (LVGO.OQ, $97.38, OUTPERFORM[V], TP $132.0) Microsoft (MSFT.OQ, $207.07) Netflix Inc. (NFLX.OQ, $525.5) Okta (OKTA.OQ, $200.09) Salesforce.com (CRM.N, $188.34) ServiceNow, Inc. (NOW.N, $401.87) Slack Technologies, Inc (WORK.N, $33.42) Smartsheet (SMAR.N, $47.47) Teladoc Health (TDOC.N, $218.45) Twilio (TWLO.N, $224.8) UnitedHealth Group Inc. (UNH.N, $299.71) Veeva Systems (VEEV.N, $240.77) Workday Inc (WDAY.OQ, $184.77) Zendesk (ZEN.N, $87.69) Zoom Video Communications (ZM.OQ, $260.3) Zscaler (ZS.OQ, $119.91)
Disclosure Appendix
Analyst Certification
Jailendra Singh, Jermaine Brown and Adam Heussner each certify, with respect to the companies or securities that the individual analyzes, that (1) the views expressed in this report accurately reflect his or her personal views about all of the subject companies and securities and (2) no part of his or her compensation was, is or will be directly or indirectly related to the specific recommendations or views expressed in this report.
As of December 10, 2012 Analysts’ stock rating are defined as follows:
Outperform (O) : The stock’s total return is expected to outperform the relevant benchmark* over the next 12 months. Neutral (N) : The stock’s total return is expected to be in line with the relevant benchmark* over the next 12 months. Underperform (U) : The stock’s total return is expected to underperform the relevant benchmark* over the next 12 months. *Relevant benchmark by region: As of 10th December 2012, Japanese ratings are based on a stock’s total return relative to the analyst's coverage universe which consists of all companies covered by the analyst within the relevant sector, with Outperforms representing the most attractive, Neutrals the less attractive, and Underperforms the least attractive investment opportunities. As of 2nd October 2012, U.S. and Canadian as well as European (excluding Turkey) ratings are based on a stock’s total return relative to the analyst's coverage universe which consists of all companies covered by the an alyst within the relevant sector, with Outperforms representing the most attractive, Neutrals the less attractive, and Underperforms the least attractive investment opportunities. For Latin America, Turkey and Asia (excluding Japan and Australia), stock ratings are based on a stock’s total return relative to the average to tal return of the relevant country or regional benchmark (India - S&P BSE Sensex Index); prior to 2nd October 2012 U.S. and Canadian ratings were based on (1) a stock’s absolute total return potential to its current share price and (2) the relative attractiveness of a s tock’s total return potential within an analyst’s coverage universe. For Australian and New Zealand stocks, the expected total return (ETR) calculation includes 12-month rolling dividend yield. An Outperform rating is assigned where an ETR is greater than or equal to 7.5%; Underperform where an ETR less than or equal to 5%. A Neutral may be assigned where the ETR is between -5% and 15%. The overlapping rating range allows analysts to assign a rating that puts ETR in the context of associated risks. Prior to 18 May 2015, ETR ranges for Outperform and Underperform ratings did not overlap with Neutral thresholds between 15% and 7.5%, which was in operation from 7 July 2011. Restricted (R) : In certain circumstances, Credit Suisse policy and/or applicable law and regulations preclude certain types of communications, including an investment recommendation, during the course of Credit Suisse's engagement in an investment banking transaction and in certain other circumstances. Not Rated (NR) : Credit Suisse Equity Research does not have an investment rating or view on the stock or any other securities related to the company at this time. Not Covered (NC) : Credit Suisse Equity Research does not provide ongoing coverage of the company or offer an investment rating or investment view on the equity security of the company or related products.
Volatility Indicator [V] : A stock is defined as volatile if the stock price has moved up or down by 20% or more in a month in at least 8 of the past 24 months or the analyst expects significant volatility going forward.
Analysts’ sector weightings are distinct from analysts’ stock ratings and are based on the analyst’s expectations for the fundamentals and/or valuation of the sector* relative to the group’s historic fundamentals and/or valuation: Overweight : The analyst’s expectation for the sector’s fundamentals and/or valuation is favorable over the next 12 months. Market Weight : The analyst’s expectation for the sector’s fundamentals and/or valuation is neutral over the next 12 months. Underweight : The analyst’s expectation for the sector’s fundamentals and/or valuation is cautious over the next 12 months. *An analyst’s coverage sector consists of all companies covered by the analyst within the relevant sector. An analyst may c over multiple sectors.

14 July 2020
Livongo Health 36
Credit Suisse's distribution of stock ratings (and banking clients) is:
Global Ratings Distribution
Rating Versus universe (%) Of which banking clients (%) Outperform/Buy* 49% (32% banking clients)
Neutral/Hold* 37% (27% banking clients)
Underperform/Sell* 12% (21% banking clients)
Restricted 1%
*For purposes of the NYSE and FINRA ratings distribution disclosure requirements, our stock ratings of Outperform, Neutral, a nd Underperform most closely correspond to Buy, Hold, and Sell, respectively; however, the meanings are not the same, as our stock ratings are determined on a relative basis. (Please r efer to definitions above.) An investor's decision to buy or sell a security should be based on investment objectives, current hold ings, and other individual factors.
Important Global Disclosures
Credit Suisse’s research reports are made available to clients through our proprietary research portal on CS PLUS. Credit Suisse research products may also be made available through third-party vendors or alternate electronic means as a convenience. Certain research products are only made available through CS PLUS. The services provided by Credit Suisse’s analysts to clients may depend on a specific client’s preferences regarding the frequency and manner of receiving communications, the client’s risk profile and investment, the size and scope of the overall client relationship with the Firm, as well as legal and regulatory constraints. To access all of Credit Suisse’s research that you are entitled to receive in the most timely manner, please contact your sales representative or go to https://plus.credit-suisse.com . Credit Suisse’s policy is to update research reports as it deems appropriate, based on developments with the subject company, the sector or the market that may have a material impact on the research views or opinions stated herein. Credit Suisse's policy is only to publish investment research that is impartial, independent, clear, fair and not misleading. For more detail please refer to Credit Suisse's Policies for Managing Conflicts of Interest in connection with Investment Research: https://www.credit-suisse.com/sites/disclaimers-ib/en/managing-conflicts.html . Any information relating to the tax status of financial instruments discussed herein is not intended to provide tax advice or to be used by anyone to provide tax advice. Investors are urged to seek tax advice based on their particular circumstances from an independent tax professional. Credit Suisse has decided not to enter into business relationships with companies that Credit Suisse has determined to be involved in the development, manufacture, or acquisition of anti-personnel mines and cluster munitions. For Credit Suisse's position on the issue, please see https://www.credit-suisse.com/media/assets/corporate/docs/about-us/responsibility/banking/policy-summaries-en.pdf . The analyst(s) responsible for preparing this research report received compensation that is based upon various factors including Credit Suisse's total revenues, a portion of which are generated by Credit Suisse's investment banking activities
Target Price and Rating Valuation Methodology and Risks: (12 months) for Livongo Health (LVGO.OQ)
Method: Our $132 target price and Outperform rating for LVGO are derived from 26x our 2021 revenues estimate, which assumes LVGO shares maintain the current one-year forward EV/revenue multiple 12-months from now.
Risk: Downside risks to our Outperform rating and $132 TP include loss of any major contracts, failure to improve margins and a failure to execute on cross-selling among solutions, increased unemployment resulting in higher-than-expected churn in LVGO's existing membership base.
Please refer to the firm's disclosure website at https://rave.credit-suisse.com/disclosures/view/selectArchive for the definitions of abbreviations typically used in the target price method and risk sections.
See the Companies Mentioned section for full company names
Credit Suisse expects to receive or intends to seek investment banking related compensation from the subject company (H.N) within the next 3 months. Credit Suisse or a member of the Credit Suisse Group is a market maker or liquidity provider in the securities of the following subject issuer(s): H.N, LVGO.OQ As of the date of this report, Credit Suisse beneficially own 1% or more of a class of common equity securities of (LVGO.OQ).
For date and time of production, dissemination and history of recommendation for the subject company(ies) featured in this report, disseminated within the past 12 months, please refer to the link: https://rave.credit-suisse.com/disclosures/view/report?i=532243&v=-2yerwiqxe81mb8i1n2vby86hk .
Important Regional Disclosures
Singapore recipients should contact Credit Suisse AG, Singapore Branch for any matters arising from this research report. The analyst(s) involved in the preparation of this report may participate in events hosted by the subject company, including site visits. Credit Suisse does not accept or permit analysts to accept payment or reimbursement for travel expenses associated with these events. For Credit Suisse Securities (Canada), Inc.'s policies and procedures regarding the dissemination of equity research, please visit https://www.credit-suisse.com/sites/disclaimers-ib/en/canada-research-policy.html. Investors should note that income from such securities and other financial instruments, if any, may fluctuate and that price or value of such securities and instruments may rise or fall and, in some cases, investors may lose their entire principal investment. This research report is authored by:

14 July 2020
Livongo Health 37
Credit Suisse Securities (USA) LLC ........................................................ Jailendra Singh ; Jermaine Brown ; Adam Heussner
Important disclosures regarding companies that are the subject of this report are available by calling +1 (877) 291-2683. The same important disclosures, with the exception of valuation methodology and risk discussions, are also available on Credit Suisse’s disclosure website at https://rave.credit-suisse.com/disclosures . For valuation methodology and risks associated with any recommendation, price target, or rating referenced in this report, please refer to the disclosures section of the most recent report regarding the subject company.

14 July 2020
Livongo Health 38
This report is produced by subsidiaries and affiliates of Credit Suisse operating under its Global Markets Division. For more information on our structure, please use the following link: https://www.credit-suisse.com/who-we-are This report may contain material that is not directed to, or intended for distribution to or use by, any person or entity who is a citizen or resident of or located in any locality, state, country or other jurisdiction where such distribution, publication, availability or use would be contrary to law or regulation or which would subject Credit Suisse or its affiliates ("CS") to any registration or licensing requirement within such jurisdiction. All material presented in this report, unless specifically indicated otherwise, is under copyright to CS. None of the material, nor its content, nor any copy of it, may be altered in any way, transmitted to, copied or distributed to any other party, without the prior express written permission of CS. All trademarks, service marks and logos used in this report are trademarks or service marks or registered trademarks or service marks of CS or its affiliates.The information, tools and material presented in this report are provided to you for information purposes only and are not to be used or considered as an offer or the solicitation of an offer to sell or to buy or subscribe for securities or other financial instruments. CS may not have taken any steps to ensure that the securities referred to in this report are suitable for any particular investor. CS will not treat recipients of this report as its customers by virtue of their receiving this report. The investments and services contained or referred to in this report may not be suitable for you and it is recommended that you consult an independent investment advisor if you are in doubt about such investments or investment services. Nothing in this report constitutes investment, legal, accounting or tax advice, or a representation that any investment or strategy is suitable or appropriate to your individual circumstances, or otherwise constitutes a personal recommendation to you. Please note in particular that the bases and levels of taxation may change. Information and opinions presented in this report have been obtained or derived from sources believed by CS to be reliable, but CS makes no representation as to their accuracy or completeness. CS accepts no liability for loss arising from the use of the material presented in this report, except that this exclusion of liability does not apply to the extent that such liability arises under specific statutes or regulations applicable to CS. This report is not to be relied upon in substitution for the exercise of independent judgment. CS may have issued, and may in the future issue, other communications that are inconsistent with, and reach different conclusions from, the information presented in this report. Those communications reflect the different assumptions, views and analytical methods of the analysts who prepared them and CS is under no obligation to ensure that such other communications are brought to the attention of any recipient of this report. Some investments referred to in this report will be offered solely by a single entity and in the case of some investments solely by CS, or an associate of CS or CS may be the only market maker in such investments. Past performance should not be taken as an indication or guarantee of future performance, and no representation or warranty, express or implied, is made regarding future performance. Information, opinions and estimates contained in this report reflect a judgment at its original date of publication by CS and are subject to change without notice. The price, value of and income from any of the securities or financial instruments mentioned in this report can fall as well as rise. The value of securities and financial instruments is subject to exchange rate fluctuation that may have a positive or adverse effect on the price or income of such securities or financial instruments. Investors in securities such as ADR's, the values of which are influenced by currency volatility, effectively assume this risk. Structured securities are complex instruments, typically involve a high degree of risk and are intended for sale only to sophisticated investors who are capable of understanding and assuming the risks involved. The market value of any structured security may be affected by changes in economic, financial and political factors (including, but not limited to, spot and forward interest and exchange rates), time to maturity, market conditions and volatility, and the credit quality of any issuer or reference issuer. Any investor interested in purchasing a structured product should conduct their own investigation and analysis of the product and consult with their own professional advisers as to the risks involved in making such a purchase. Some investments discussed in this report may have a high level of volatility. High volatility investments may experience sudden and large falls in their value causing losses when that investment is realised. Those losses may equal your original investment. Indeed, in the case of some investments the potential losses may exceed the amount of initial investment and, in such circumstances, you may be required to pay more money to support those losses. Income yields from investments may fluctuate and, in consequence, initial capital paid to make the investment may be used as part of that income yield. Some investments may not be readily realisable and it may be difficult to sell or realise those investments, similarly it may prove difficult for you to obtain reliable information about the value, or risks, to which such an investment is exposed. This report may provide the addresses of, or contain hyperlinks to, websites. Except to the extent to which the report refers to website material of CS, CS has not reviewed any such site and takes no responsibility for the content contained therein. Such address or hyperlink (including addresses or hyperlinks to CS's own website material) is provided solely for your convenience and information and the content of any such website does not in any way form part of this document. Accessing such website or following such link through this report or CS's website shall be at your own risk.
This report is issued and distributed in European Union (except Germany and Spain): by Credit Suisse Securities (Europe) Limited, One Cabot Square, London E14 4QJ, England, which is authorised by the Prudential Regulation Authority and regulated by the Financial Conduct Authority and the Prudential Regulation Authority; Spain: Credit Suisse Securities, Sociedad de Valores, S.A. (“CSSSV”) regulated by the Comision Nacional del Mercado de Valores; Germany: Credit Suisse (Deutschland) Aktiengesellschaft regulated by the Bundesanstalt fuer Finanzdienstleistungsaufsicht ("BaFin"). United States: Credit Suisse Securities (USA) LLC; Canada: Credit Suisse Securities (Canada), Inc.; Switzerland: Credit Suisse AG; Brazil: Banco de Investimentos Credit Suisse (Brasil) S.A or its affiliates; Mexico: Banco Credit Suisse (México), S.A., Institución de Banca Múltiple, Grupo Financiero Credit Suisse (México) and Casa de Bolsa Credit Suisse (México), S.A. de C.V., Grupo Financiero Credit Suisse (México) ("Credit Suisse Mexico"). This document has been prepared for information purposes only and is exclusively distributed in Mexico to Institutional Investors. Credit Suisse Mexico is not responsible for any onward distribution of this report to non-institutional investors by any third party. The authors of this report have not received payment or compensation from any entity or company other than from the relevant Credit Suisse Group company employing them; Japan: by Credit Suisse Securities (Japan) Limited, Financial Instruments Firm, Director-General of Kanto Local Finance Bureau ( Kinsho) No. 66, a member of Japan Securities Dealers Association, The Financial Futures Association of Japan, Japan Investment Advisers Association, Type II Financial Instruments Firms Association; Hong Kong: Credit Suisse (Hong Kong) Limited; Australia: Credit Suisse Equities (Australia) Limited; Thailand: Credit Suisse Securities (Thailand) Limited, regulated by the Office of the Securities and Exchange Commission, Thailand, having registered address at 990 Abdulrahim Place, 27th Floor, Unit 2701, Rama IV Road, Silom, Bangrak, Bangkok10500, Thailand, Tel. +66 2614 6000; Malaysia: Credit Suisse Securities (Malaysia) Sdn Bhd; Singapore: Credit Suisse AG, Singapore Branch; India: Credit Suisse Securities (India) Private Limited (CIN no.U67120MH1996PTC104392) regulated by the Securities and Exchange Board of India as Research Analyst (registration no. INH 000001030) and as Stock Broker (registration no. INZ000248233), having registered address at 9th
Floor, Ceejay House, Dr.A.B. Road, Worli, Mumbai - 18, India, T- +91-22 6777 3777; South Korea: Credit Suisse Securities (Europe) Limited, Seoul Branch; Taiwan: Credit Suisse AG Taipei Securities Branch; Indonesia: PT Credit Suisse Sekuritas Indonesia; Philippines:Credit Suisse Securities (Philippines ) Inc., and elsewhere in the world by the relevant authorised affiliate of the above. Additional Regional Disclaimers Australia: Credit Suisse Securities (Europe) Limited ("CSSEL") and Credit Suisse International ("CSI") are authorised by the Prudential Regulation Authority and regulated by the Financial Conduct Authority ("FCA") and the Prudential Regulation Authority under UK laws, which differ from Australian Laws. CSSEL and CSI do not hold an Australian Financial Services Licence ("AFSL") and are exempt from the requirement to hold an AFSL under the Corporations Act (Cth) 2001 ("Corporations Act") in respect of the financial services provided to Australian wholesale clients (within the meaning of section 761G of the Corporations Act) (hereinafter referred to as “Financial Services”). This material is not for distribution to retail clients and is directed exclusively at Credit Suisse's professional clients and eligible counterparties as defined by the FCA, and wholesale clients as defined under section 761G of the Corporations Act. Credit Suisse (Hong Kong) Limited ("CSHK") is licensed and regulated by the Securities and Futures Commission of Hong Kong under the laws of Hong Kong, which differ from Australian laws. CSHKL does not hold an AFSL and is exempt from the requirement to hold an AFSL under the Corporations Act in respect of providing Financial Services. Investment banking services in the United States are provided by Credit Suisse Securities (USA) LLC, an affiliate of Credit Suisse Group. CSSU is regulated by the United States Securities and Exchange Commission under United States laws, which differ from Australian laws. CSSU does not hold an AFSL and is exempt from the requirement to hold an AFSL under the Corporations Act in respect of providing Financial Services. Credit Suisse Asset Management LLC (CSAM) is authorised by the Securities and Exchange Commission under US laws, which differ from Australian laws. CSAM does not hold an AFSL and is exempt from the requirement to hold an AFSL under the Corporations Act in respect of providing Financial Services. This material is provided solely to Institutional Accounts (as defined in the FINRA rules) who are Eligible Contract Participants (as defined in the US Commodity Exchange Act). Credit Suisse Equities (Australia) Limited (ABN 35 068 232 708) ("CSEAL") is an AFSL holder in Australia (AFSL 237237). Malaysia: Research provided to residents of Malaysia is authorised by the Head of Research for Credit Suisse Securities (Malaysia) Sdn Bhd, to whom they should direct any queries on +603 2723 2020. Singapore: This report has been prepared and issued for distribution in Singapore to institutional investors, accredited investors and expert investors (each as defined under the Financial Advisers Regulations) only, and is also distributed by Credit Suisse AG, Singapore Branch to overseas investors (as defined under the Financial Advisers Regulations). Credit Suisse AG, Singapore Branch may distribute reports produced by its foreign entities or affiliates pursuant to an arrangement under Regulation 32C of the Financial Advisers Regulations. Singapore recipients should contact Credit Suisse AG, Singapore Branch at +65-6212-2000 for matters arising from, or in connection with, this report. By virtue of your status as an institutional investor, accredited investor, expert investor or overseas investor, Credit Suisse AG, Singapore Branch is exempted from complying with certain compliance requirements under the Financial Advisers Act, Chapter 110 of Singapore (the “FAA”), the Financial Advisers Regulations and the relevant Notices and Guidelines issued thereunder, in respect of any financial advisory service which Credit Suisse AG, Singapore Branch may provide to you. EU: This report has been produced by subsidiaries and affiliates of Credit Suisse operating under its Global Markets Division In jurisdictions where CS is not already registered or licensed to trade in securities, transactions will only be effected in accordance with applicable securities legislation, which will vary from jurisdiction to jurisdiction and may require that the trade be made in accordance with applicable exemptions from registration or licensing requirements. This material is issued and distributed in the U.S. by CSSU, a member of NYSE, FINRA, SIPC and the NFA, and CSSU accepts responsibility for its contents. Clients should contact analysts and execute transactions through a Credit Suisse subsidiary or affiliate in their home jurisdiction unless governing law permits otherwise. CS may provide various services to US municipal entities or obligated persons ("municipalities"), including suggesting individual transactions or trades and entering into such transactions. Any services CS provides to municipalities are not viewed as "advice" within the meaning of Section 975 of the Dodd-Frank Wall Street Reform and Consumer Protection Act. CS is providing any such services and related information solely on an arm's length basis and not as an advisor or fiduciary to the municipality. In connection with the provision of the any such services, there is no agreement, direct or indirect, between any municipality (including the officials,management, employees or agents thereof) and CS for CS to provide advice to the municipality. Municipalities should consult with their financial, accounting and legal advisors regarding any such services provided by CS. In addition, CS is not acting for direct or indirect compensation to solicit the municipality on behalf of an unaffiliated broker, dealer, municipal securities dealer, municipal advisor, or investment adviser for the purpose of obtaining or retaining an engagement by the municipality for or in connection with Municipal Financial Products, the issuance of municipal securities, or of an investment adviser to provide investment advisory services to or on behalf of the municipality. If this report is being distributed by a financial institution other than Credit Suisse AG, or its affiliates, that financial institution is solely responsible for distribution. Clients of that institution should contact that institution to effect a transaction in the securities mentioned in this report or require further information. This report does not constitute investment advice by Credit Suisse to the clients of the distributing financial institution, and neither Credit Suisse AG, its affiliates, and their respective officers, directors and employees accept any liability whatsoever for any direct or consequential loss arising from their use of this report or its content. No information or communication provided herein or otherwise is intended to be, or should be construed as, a recommendation within the meaning of the US Department of Labor’s final regulation defining "investment advice" for purposes of the Employee Retirement Income Security Act of 1974, as amended and Section 4975 of the Internal Revenue Code of 1986, as amended, and the information provided herein is intended to be general information, and should not be construed as, providing investment advice (impartial or otherwise). Copyright © 2020 CREDIT SUISSE AG and/or its affiliates. All rights reserved. When you purchase non-listed Japanese fixed income securities (Japanese government bonds, Japanese municipal bonds, Japanese government guaranteed bonds, Japanese corporate bonds) from CS as a seller, you will be requested to pay the purchase price only.