Embed Size (px)
Citation preview
SUPPLEMENTS TO THE SECOND QUARTER 2001 RESULTS

Supplement 1
SUPPLEMENTS TO THE SECOND QUARTER 2001 RESULTS

Supplement 2
In CHF m
Operating incomePersonnel expensesOther operating expensesTotal operating expensesGross operating profitDepreciation *, write-offsLosses, provisions **Pre-tax profitNet extraordinary itemsTaxesNet op. profit bef. minorities
CSFS
2,759-1,058
-659-1,7171,042-170-80792
7-240559
CSPB
1,502-438-268-706796-15-43738
2-160580
CSAM
417-197-122-319
98-80
900
-288
CSFB
6,614-4,130-1,425-5,5551,059-226-298535
0-92443
CC& Adj.
-110-13626012414
-839
-60-99425
BUSINESS UNIT RESULTS Q2 2001 – OVERVIEW
CSG
11,182-5,959-2,214-8,1733,009-502-412
2,0950
-4001,695
* excl. amortisation ofacquired intangible assets and goodwill
** ? to actual credit provisions at CC +28 0 -24
Supplement 3
In CHF m
Operating incomePersonnel expensesOther operating expensesTotal operating expensesGross operating profitDepreciation *, write-offsLosses, provisions **Pre-tax profitNet extraordinary itemsTaxesNet op. profit bef. minorities
CSFS
2,462-991-637
-1,628834
-131-86617
1-168450
CSPB
1,579-436-237-673906-11-42853
1-202652
CSAM
377-175-113-288
89-70
82-1
-1368
CSFB
6,744-4,362-1,230-5,5921,152-213-92847
-1-187659
CC& Adj.
-71-66263197126
-121-18-1322
-65-56
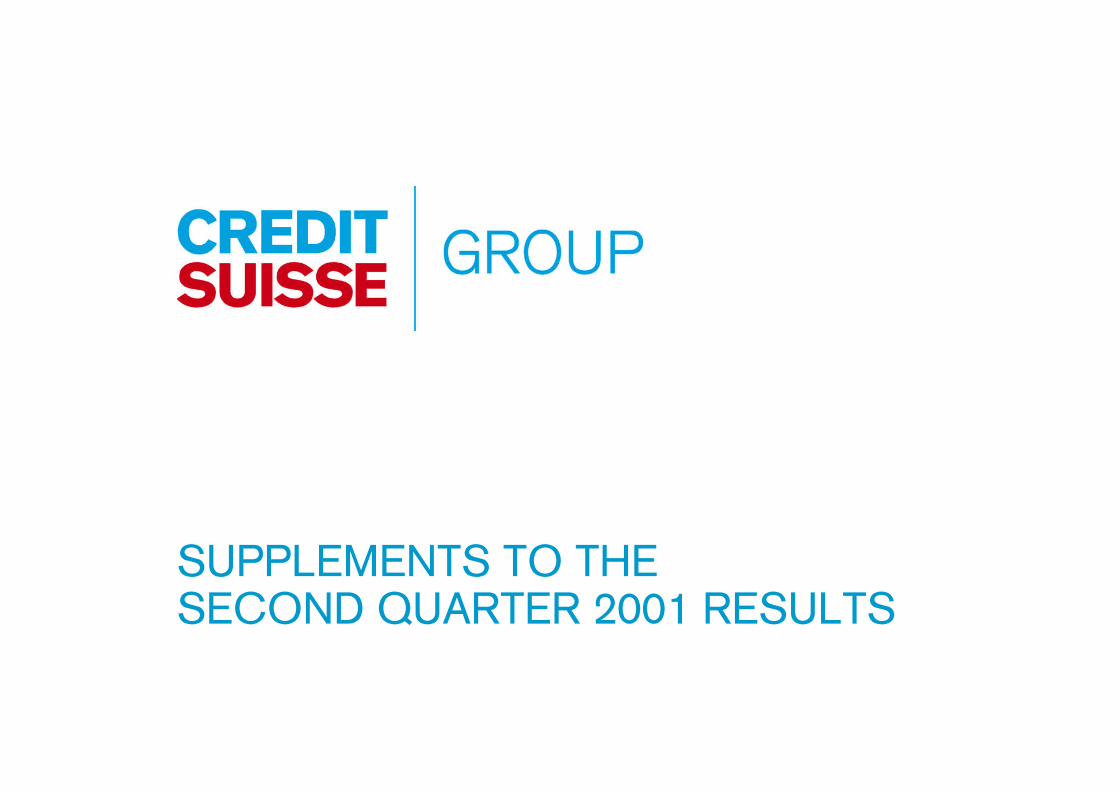
PRO MEMORIABUSINESS UNIT RESULTS Q1 2001 – OVERVIEW
CSG
11,091-6,030-1,954-7,9843,107-483-238
2,38622
-6351,773
* excl. amortisation ofacquired intangible assets and goodwill
** ? to actual credit provisions at CC -33 +1 +24

Supplement 4
BUSINESS UNIT RESULTSQUARTERLY COMPARISON
Net operating profit, CHF m
CSFSWINWLPCSBCSPF
CSPB
CSAM
CSFB
Q2/01
504217214178
-105
576
88
443
Changeto Q1/01
+18%+63%
+8%-5%
+15%
-11%
+29%
-33%
Q1/01
428133199187-91
645
68
659
Q2/00
498202127192-23
643
77
507

Supplement 5
VALUE BASED ANALYSIS
326 CSG
CSFS
CSPB
CSAMCSFB
Adjustments
51058 6 - 151
749
Value added Q2/01 by BU, in CHF m

Supplement 6
Cash & time depositsSafe custody accounts
Fixed incomeEquitiesBalanced
Total FI/Eq./Bal.Investment funds
whereof CSAM inv. fundswhereof other CSG funds *whereof external funds
Other (derivatives, etc.)FiduciaryInsurance AuMTotal
whereof discretionary
CSPBCHF bn
32392138125
-263125
5450224
65-
489123
CSAMCHF bn
7496186169
95449
----
471-
503372
CSFBCHF bn
0181
3998
-137441232
--0-
18158
CSGCHF bn
911,150
373413
95880211
9984285970
1421,452
701
CSFSCHF bn
52801021
-3141341684
142278148
ASSETS UNDER MANAGEMENT AS PER 30.06.2001
* incl. private equity on behalf of clients

Supplement 7
CREDIT SUISSE FINANCIAL SERVICESINCOME STATEMENT
* excl. amortisation of goodwill** additional (+) / lower (-) actual credit-related provisions +28 -33 -18
Operating incomePersonnel expensesOther operating expensesTotal operating expensesGross operating profitDepreciation *, write-offsLosses, provisions **Pre-tax profitE.o. items, netTaxesNet operating profit bef. minoritiesNet operating profit
Q2/01CHF m
2,759-1,058
-659-1,7171,042-170-80792
7-240559504
Changeto Q1/01
+12%+7%+3%+5%
+25%+30%
-7%+28%
-+43%+24%+18%
Q1/01CHF m
2,462-991-637
-1,628834
-131-86617
1-168450428
Q2/00CHF m
2,328-878-541
-1,419909-83
-116710
1-173538498

Supplement 8
WINTERTHUR INSURANCEINCOME STATEMENT (insurance chart of account)
* excl. amortisation of goodwill
Net premiums earnedClaims and annuities incurred, netDividends to policyholders incurred, netOperating exp., net (incl. commissions paid)Underwriting result, netNet investment incomeInterest received on deposits & bank accountsInterest paidOther income / expense, net (incl. FX differences) *Profit before e.o. items, taxesE.o. items, netTaxesNet operating profit before minoritiesNet operating profit
Q2/01CHF m
3,887-3,056
-71-1,172
-412825
17-41-14375
0-120255217
Changeto H1/00
+15%+16%
-3%+13%+14%+20%-48%
-1%-57%+15%
-+25%+11%+7%
Q1/01CHF m
3,617-2,799
-112-1,049
-343529
7-2643
2100
-60150133
Q2/00CHF m
3,468-2,668
-94-1,005
-29959423
-3441
3250
-97228202

Supplement 9
WINTERTHUR INSURANCEINCOME STATEMENT (BU format reconciliation) Q2/01
* excl. amortisation of goodwill
in CHF m
Net premiums earnedClaims and annuities incurred, netDividends to policyholders incurred, netOperating exp., net (incl. commissions paid)Underwriting result, netNet investment incomeInterest received on deposits & bank accountsInterest paidOther income / expense, net (incl. FX differences) *
Profit before e.o. items, taxes
BUformat3,887
-3,056-71
-573
82517
-418
996
Operatingincome
Insuranceformat3,887
-3,056-71
-1,172-412825
17-41-14
375
BUformat
-574
-574
Operatingexpenses
BUformat
-25
-22
-47
Depreci-ation * &
write-offs

Supplement 10
WINTERTHUR INSURANCEINCOME STATEMENT (BU format reconciliation) Q1/01
* excl. amortisation of goodwill
in CHF m
Net premiums earnedClaims and annuities incurred, netDividends to policyholders incurred, netOperating exp., net (incl. commissions paid)Underwriting result, netNet investment incomeInterest received on deposits & bank accountsInterest paidOther income / expense, net (incl. FX differences) *
Profit before e.o. items, taxes
BUformat3,617
-2,799-112-451
5297
-2650
815
Operatingincome
Insuranceformat3,617
-2,799-112
-1,049-343529
7-2643
210
BUformat
-575
-575
Operatingexpenses
BUformat
-23
-7
-30
Depreci-ation * &
write-offs

Supplement 11
WINTERTHUR INSURANCEINCOME STATEMENT (BU format reconciliation) Q2/00
* excl. amortisation of goodwill
in CHF m
Net premiums earnedClaims and annuities incurred, netDividends to policyholders incurred, netOperating exp., net (incl. commissions paid)Underwriting result, netNet investment incomeInterest received on deposits & bank accountsInterest paidOther income / expense, net (incl. FX differences) *
Profit before e.o. items, taxes
BUformat3,468
-2,668-94
-433
59423
-3456
912
Operatingincome
Insuranceformat3,468
-2,668-94
-1,005-299594
23-3441
325
BUformat
-546
-546
Operatingexpenses
BUformat
-26
-15
-41
Depreci-ation * &
write-offs

Supplement 12
WINTERTHUR INSURANCEINCOME STATEMENT (BU reporting format)
Operating incomePersonnel expensesOther operating expensesTotal operating expensesGross operating profitDepreciation *, write-offsLosses, provisionsPre-tax profitE.o. items, netTaxesNet operating profit bef. minoritiesNet operating profit
Q2/01CHF m
996-386-188-574422-47
0375
0-120255217
Changeto Q1/01
+22%+8%-14%
0%+76%+57%
-+79%
-+100%
+70%+63%
Q1/01CHF m
815-356-219-575240-30
0210
0-60150133
Q2/00CHF m
912-335-211-546366-41
0325
0-97228202
* excl. amortisation of goodwill

Supplement 13
Combined ratio (excl. dividends to policyholders)Claims ratioExpense ratioAuM, CHF bn *Technical provisions, CHF m *Investment return
- current interest income- realised gains
Number of employees *
Q2/01
108.8%78.6%30.2%
32.630,339
9.8%5.2%4.7%
22,516
Q1/01
106.4%77.4%29.0%
32.730,132
6.3%4.6%1.7%
22,244
WINTERTHUR INSURANCEKEY PERFORMANCE INDICATORS
Q2/00
105.9%76.9%29.0%
32.526,653
7.4%4.9%2.5%
21,796
* 30.06.01, 31.03.01 and 31.12.00 resp.

Supplement 14
WINTERTHUR INSURANCEKEY FIGURES
107.3 107.6
H1/00 H1/01
29.629.9
H1/00 H1/01
Combined ratio (%)excl. dividends to policyholders
Expense ratio (%)
7.56.6
H1/00 H1/01
77.4 78.0
H1/00 H1/01
Claims ratio (%)Net premiums earned (CHF bn)

Supplement 15
WINTERTHUR LIFE & PENSIONSINCOME STATEMENT (insurance chart of account)
Net premiums earnedDeath and other benefits incurredChange in prov. for future policyholder benefitsDividends to policyholders incurredOperating exp., net (incl. commissions paid)Net investment incomeInterest received on deposits & bank accountsInterest on bonuses credited to policyholdersOther interest paidOther income / expense, net (incl. FX differences) *Profit before e.o. items, taxesE.o. items, netTaxesNet operating profit before minoritiesNet operating profit
Q2/01CHF m
3,183-2,687-1,205
-228-581
1,91924
-40-62-27296
0-66230214
Changeto H1/00
+11%+30%-19%-46%
+26%-14%-16%
+24%-16%-60%+52%
-+143%
+37%+43%
Q1/01CHF m
6,124-3,686-2,094
-403-372793
13-32-37-39267
0-63204199
Q2/00CHF m
3,279-2,558
-984-450-363
1,37822
-29-59-72164
0-23141127
* excl. amortisation of goodwill

Supplement 16
in CHF m
Net premiums earnedDeath and other benefits incurredChange in prov. for future policyholder benefitsDividends to policyholders incurredOperating exp., net (incl. commissions paid)Net investment incomeInterest received on deposits & bank accountsInterest on bonuses credited to policyholdersOther interest paidOther income / expense, net (incl. FX differences) *
Profit before e.o. items, taxes
Insuranceformat3,183
-2,687-1,205
-228-581
1,91924
-40-62-27
296
BUformat
-89-3
-4
-96
Depreci-ation * &
write-offs
BUformat3,183
-2,687-1,205
-228-116
1,92224
-40-62-23
768
Operatingincome
BUformat
-376
-376
Operatingexpenses
WINTERTHUR LIFE & PENSIONSINCOME STATEMENT (BU format reconciliation) Q2/01
* excl. amortisation of goodwill

Supplement 17
in CHF m
Net premiums earnedDeath and other benefits incurredChange in prov. for future policyholder benefitsDividends to policyholders incurredOperating exp., net (incl. commissions paid)Net investment incomeInterest received on deposits & bank accountsInterest on bonuses credited to policyholdersOther interest paidOther income / expense, net (incl. FX differences) *
Profit before e.o. items, taxes
Insuranceformat6,124
-3,686-2,094
-403-372793
13-32-37-39
267
BUformat
-58
-4
-62
Depreci-ation * &
write-offs
BUformat6,124
-3,686-2,094
-4035
79313
-32-37-35
648
Operatingincome
BUformat
-319
-319
Operatingexpenses
WINTERTHUR LIFE & PENSIONSINCOME STATEMENT (BU format reconciliation) Q1/01
* excl. amortisation of goodwill

Supplement 18
in CHF m
Net premiums earnedDeath and other benefits incurredChange in prov. for future policyholder benefitsDividends to policyholders incurredOperating exp., net (incl. commissions paid)Net investment incomeInterest received on deposits & bank accountsInterest on bonuses credited to policyholdersOther interest paidOther income / expense, net (incl. FX differences) *
Profit before e.o. items, taxes
Insuranceformat3,279
-2,558-984-450-363
1,37822
-29-59-72
164
BUformat
-10
-15
-25
Depreci-ation * &
write-offs
BUformat3,279
-2,558-984-450-92
1,37822
-29-59-57
450
Operatingincome
BUformat
-261
-261
Operatingexpenses
WINTERTHUR LIFE & PENSIONSINCOME STATEMENT (BU format reconciliation) Q2/00
* excl. amortisation of goodwill

Supplement 19
WINTERTHUR LIFE & PENSIONSINCOME STATEMENT (BU reporting format)
Operating incomePersonnel expensesOther operating expensesTotal operating expensesGross operating profitDepreciation *, write-offsLosses, provisionsPre-tax profitE.o. items, netTaxesNet operating profit bef. minoritiesNet operating profit
Q2/01CHF m
768-212-164-376392-96
0296
0-66230214
Changeto Q1/01
+19%+16%+21%+18%+19%+55%
-+11%
-+5%
+13%+8%
Q1/01CHF m
648-183-136-319329-62
0267
0-63204199
Q2/00CHF m
450-141-120-261189-25
0164
0-23141127
* excl. amortisation of goodwill

Supplement 20
Expense ratioNet return on average technical provisionsNet new assets, CHF bnAuM, CHF bn *Technical provisions, CHF m *Investment return
- current interest income- realised gains
Number of employees *
Q2/01
18.3%21 bp
0.6109.4
108,9266.9%4.9%1.9%
7,276
Q1/01
6.1%19 bp
2.1107.1
107,3906.2%4.4%1.8%
7,095
WINTERTHUR LIFE & PENSIONSKEY PERFORMANCE INDICATORS
Q2/00
11.1%15 bp
0.2104.7
105,5226.4%4.7%1.7%
6,562
* 30.06.01, 31.03.01 and 31.12.00 resp.

Supplement 21
WINTERTHUR LIFE & PENSIONSKEY FIGURES
3935
H1/00 H1/01
2.7
1.6
H1/00 H1/01
Return on average tech. provisions (bp) not annualised (full-year target 60-65 bp)
Net new assets (CHF bn)
8.69.4
H1/00 H1/01
10.29.0
H1/00 H1/01
Expense ratio (%)Gross premiums (CHF bn)
Supplement 22
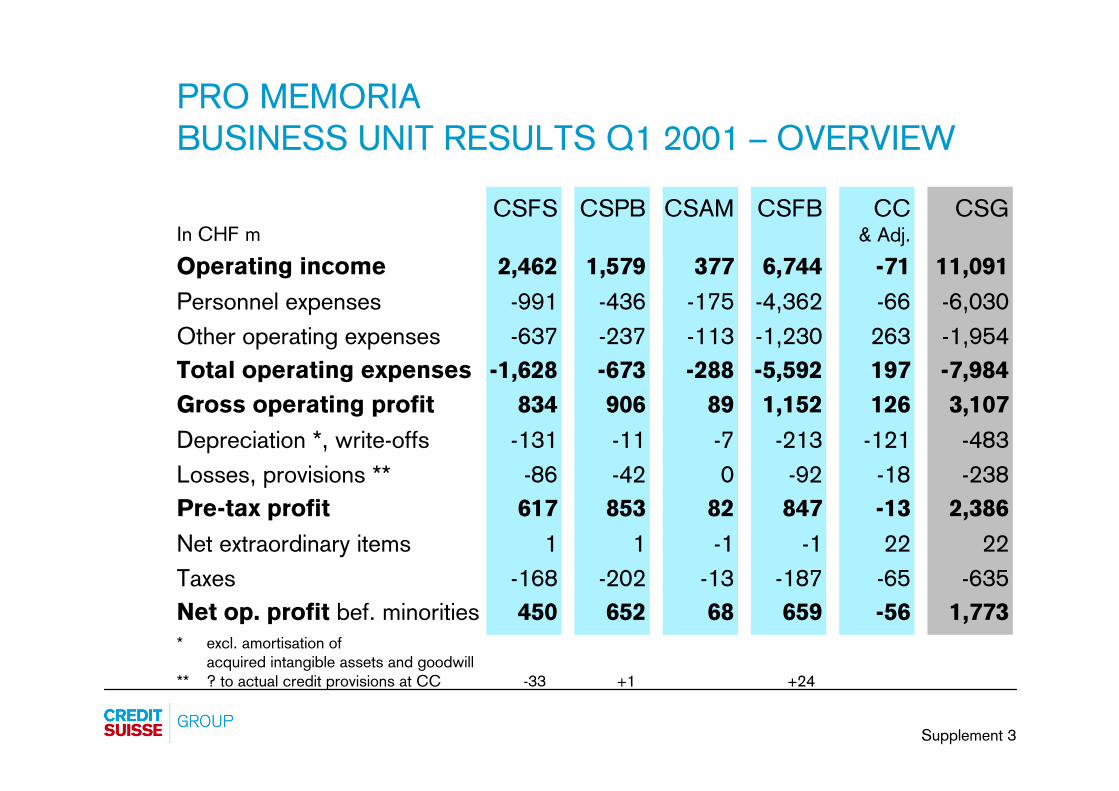
* excl. amortisation of goodwill** additional (+) / lower (-) actual credit-related provisions +28 -33 -18
CREDIT SUISSE BANKINGINCOME STATEMENT
Operating incomePersonnel expensesOther operating expensesTotal operating expensesGross operating profitDepreciation *, write-offsLosses, provisions **Pre-tax profitE.o. items, netTaxesNet operating profit bef. minoritiesNet operating profit
Q2/01CHF m
982-417-229-646336-22-79235
7-63179178
Changeto Q1/01
0%+3%+8%+5%-9%
-33%-8%-6%
--2%-4%-5%
Q1/01CHF m
983-403-212-615368-33-86249
2-64187187
Q2/00CHF m
945-378-183-561384-16
-116252
1-61192192

Supplement 23
Operating ROE *Pre-tax margin *Cost / income ratio *Loan growthNet interest marginAuM, CHF bn **Average allocated equity capital, CHF m
CREDIT SUISSE BANKINGKEY PERFORMANCE INDICATORS
* excl. amortisation of goodwill** 30.06.01, 31.03.01 and 31.12.00 resp.
Q2/01
16.7%24.6%68.0%2.3%
238 bp130.34,289
Q1/01
16.9%25.5%65.9%2.2%
242 bp130.84,428
Q2/00
17.4%26.8%61.1%0.1%
236 bp130.84,409
Supplement 24
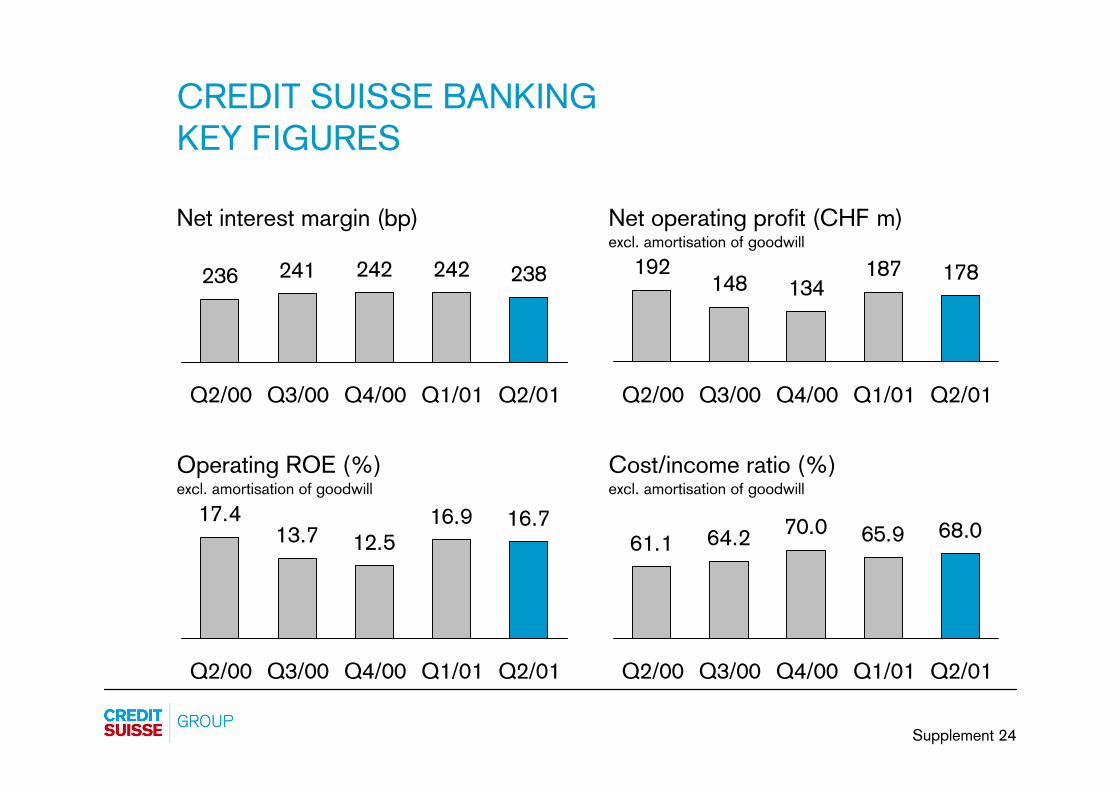
CREDIT SUISSE BANKINGKEY FIGURES
68.065.970.064.261.1
Q2/00 Q3/00 Q4/00 Q1/01 Q2/01
16.716.912.513.7
17.4
Q2/00 Q3/00 Q4/00 Q1/01 Q2/01
Cost/income ratio (%)excl. amortisation of goodwill
Operating ROE (%)excl. amortisation of goodwill
238242242241236
Q2/00 Q3/00 Q4/00 Q1/01 Q2/01
178192148 134
187
Q2/00 Q3/00 Q4/00 Q1/01 Q2/01
Net operating profit (CHF m)excl. amortisation of goodwill
Net interest margin (bp)

Supplement 25
CREDIT SUISSE PERSONAL FINANCEINCOME STATEMENT
Operating incomePersonnel expensesOther operating expensesTotal operating expensesGross operating profit / lossDepreciation *, write-offsLosses, provisionsPre-tax profit / lossE.o. items, netTaxesNet operating profit / loss
Q2/01CHF m
13-43-78
-121-108
-5-1
-11409
-105
Changeto Q1/01
-19%-12%
+11%+2%+5%
-17%-
+5%-
-53%+15%
Q1/01CHF m
16-49-70
-119-103
-60
-109-119
-91
Q2/00CHF m
21-23-28-51-30
-10
-3108
-23
* excl. amortisation of goodwill
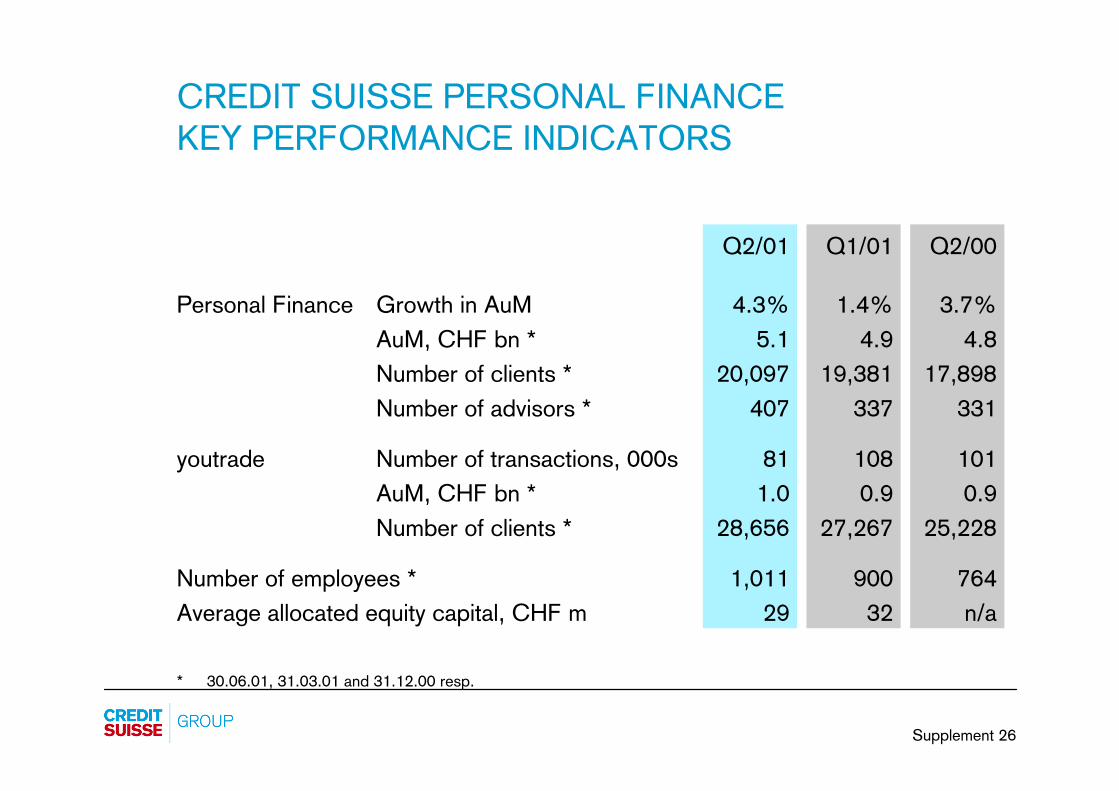
Supplement 26
Personal Finance Growth in AuMAuM, CHF bn *Number of clients *Number of advisors *
youtrade Number of transactions, 000sAuM, CHF bn *Number of clients *
Number of employees *Average allocated equity capital, CHF m
CREDIT SUISSE PERSONAL FINANCE KEY PERFORMANCE INDICATORS
Q2/01
4.3%5.1
20,097407
811.0
28,656
1,01129
Q1/01
1.4%4.9
19,381337
1080.9
27,267
90032
Q2/00
3.7%4.8
17,898331
1010.9
25,228
764n/a
* 30.06.01, 31.03.01 and 31.12.00 resp.

Supplement 27
CREDIT SUISSE PRIVATE BANKINGINCOME STATEMENT
* excl. amortisation of goodwill** additional (+) / lower (-) actual credit-related provisions 0 +1 -13
Operating incomePersonnel expensesOther operating expensesTotal operating expensesGross operating profitDepreciation *, write-offsLosses, provisions **Pre-tax profitE.o. items, netTaxesNet operating profit bef. minoritiesNet operating profit
Q2/01CHF m
1,502-438-268-706796-15-43738
2-160580576
Changeto Q1/01
-5%0%
+13%+5%
-12%+36%
+2%-13%
--21%-11%-11%
Q1/01CHF m
1,579-436-237-673906-11-42853
1-202652645
Q2/00CHF m
1,524-431-204-635889-12-39838
-8-181649643

Supplement 28
Total revenue / AuMOperating return on AuM *Pre-tax margin *Cost / income ratio *Fee income / total revenueAuM, CHF bn **Growth in AuM
CREDIT SUISSE PRIVATE BANKINGKEY PERFORMANCE INDICATORS
Q2/01
125 bp48 bp
49.3%48.0%70.4%489.15.5%
Q1/01
137 bp57 bp
54.1%43.3%64.9%463.61.6%
Q2/00
130 bp55 bp
54.5%42.5%66.8%456.4-1.9%
* excl. amortisation of goodwill** 30.06.01, 31.03.01 and 31.12.00 resp.

Supplement 29
CREDIT SUISSE PRIVATE BANKINGCOMPOSITION OF ASSETS UNDER MANAGEMENT
26% 26% 26%
39% 40% 41%
27% 27% 26%
8% 8% 7%
12/00 03/01 06/01
AuM currency composition
38% 34% 33%
32% 34% 33%
30% 32% 34%
12/00 03/01 06/01
AuM categories
Liquidity / MM & other
Fixed income
Equities
EUR
USD
CHF
all other currencies

Supplement 30
CREDIT SUISSE ASSET MANAGEMENTINCOME STATEMENT
Operating incomePersonnel expensesOther operating expensesTotal operating expensesGross operating profitDepreciation *, write-offsLosses, provisionsPre-tax profitE.o. items, netTaxesNet operating profit
Q2/01CHF m
417-197-122-319
98-80
900
-288
Changeto Q1/01
+11%+13%
+8%+11%+10%+14%
-+10%
--85%+29%
Q1/01CHF m
377-175-113-288
89-70
82-1
-1368
Q2/00CHF m
370-153-116-269101
-50
960
-1977
* excl. amortisation of acquired intangible assets and goodwill

Supplement 31
Operating return on AuM *Pre-tax margin *Cost / income ratio **Personnel expenses / operating income **AuM, CHF bn ***Discretionary funds, CHF bn ***Mutual funds distributed, CHF bn ***Growth in discretionary AuM
Q2/01
7.0 bp21.2%76.9%46.4%503.4372.4138.34.4%
Q1/01
5.6 bp20.1%73.4%43.5%485.4356.7129.5-0.9%
CREDIT SUISSE ASSET MANAGEMENTKEY PERFORMANCE INDICATORS
Q2/00
6.9 bp25.3%72.3%40.4%487.2360.1136.9-3.4%
* excl. amortisation of acquired intangible assets and goodwill** excl. acquisition interest as well as amortisation of acquired intangible assets and goodwill*** 30.06.01, 31.03.01 and 31.12.00 resp.

Supplement 32
CREDIT SUISSE ASSET MANAGEMENTKEY FIGURES
34% 36% 35%
34% 31% 31%
21% 21% 22%11% 12% 12%
12/00 03/01 06/01
Other
Balanced
Equity
FixedIncome
1.26.84.3
Q2/00 Q1/01 Q2/01
Composition of discretionary AuMNet new assets (CHF bn)
34 33 34
Q2/00 Q1/01 Q2/01
6.9 5.6 7.0
Q2/00 Q1/01 Q2/01
Net margin (bp)excl. amortisation of acquired intangible assets and goodwill
Gross margin (bp)excl. acquisition interest

Supplement 33
CREDIT SUISSE FIRST BOSTONREVENUE BY INCOME STATEMENT ITEMS
Net interest income before acquisition interestAcquisition interest
Net interest incomeNet commission & service fee incomeNet trading incomeOther ordinary income, netOperating income
n.b.Brokerage, execution and clearing expenses(not netted against operating income, but presented as part of operating expenses)
Q2/01CHF m
855-200
6553,0083,060-109
6,614
189
Changeto Q1/01
0%-18%
+7%-6%
+4%-
-2%
+20%
Q1/01CHF m
854-243
6113,2172,949
-336,744
157
Q2/00CHF m
2920
2922,2632,139
-494,645
129

Supplement 34
CREDIT SUISSE FIRST BOSTONINCOME STATEMENT (IN CHF)
* excl. amortisation of acquired intangible assets and goodwill** additional (+) / lower (-) actual credit-related provisions -24 +24 -23
Operating incomePersonnel expensesOther operating expensesTotal operating expensesGross operating profitDepreciation *, write-offsLosses, provisions **Pre-tax profitE.o. items, netTaxesNet operating profit bef. minoritiesNet operating profit
Q2/01CHF m
6,614-4,130-1,425-5,5551,059-226-298535
0-92443443
Changeto Q1/01
-2%-5%
+16%-1%-8%
+6%+224%
-37%-
-51%-33%-33%
Q1/01CHF m
6,744-4,362-1,230-5,5921,152-213-92847
-1-187659659
Q2/00CHF m
4,645-2,813
-766-3,5791,066-194-177695
0-190505507

Supplement 35
CREDIT SUISSE FIRST BOSTONINCOME STATEMENT (IN USD)
* excl. amortisation of acquired intangible assets and goodwill** additional (+) / lower (-) actual credit-related provisions -15 +15 -14
Operating incomePersonnel expensesOther operating expensesTotal operating expensesGross operating profitDepreciation *, write-offsLosses, provisions **Pre-tax profitE.o. items, netTaxesNet operating profit bef. minoritiesNet operating profit
Q2/01USD m
3,838-2,396
-830-3,226
612-131-176305
0-50255255
Changeto Q1/01
-7%-10%
+11%-5%
-13%+1%
+214%-41%
--56%-37%-37%
Q1/01USD m
4,113-2,660
-750-3,410
703-130-56517
-1-114402402
Q2/00USD m
2,812-1,703
-464-2,167
645-118-108419
0-114305306

Supplement 36
CREDIT SUISSE FIRST BOSTONFID REVENUE BREAKDOWN - H1 2001 YTD
EMG19%
Rates38% Credit
43%
Fixed Income *
* Fixed Income revenue includes 50% of fixed income capital markets

Supplement 37
CREDIT SUISSE FIRST BOSTONEQUITY REVENUE BREAKDOWN - H1 2001 YTD
US customer
31%
LatAm customer
3%
Europe customer
16%
Asia customer
7%
EDCU43%
Equity *
* Equity revenue includes 50% of equity capital markets

Supplement 38
CREDIT SUISSE FIRST BOSTONIBD REVENUE BREAKDOWN - H1 2001 YTD
Leveraged finance12%
M&A51%
PE3%
Other7%
ECM20%
DCM7%
Investment Banking *
* Investment Banking revenue includes 50% of equity capital markets and 50% of fixed income capital markets

Supplement 39
Operating ROE *Pre-tax margin *Cost / income ratio **Personnel expenses / operating income **Number of employees ***Average allocated equity capital, CHF m
CREDIT SUISSE FIRST BOSTONKEY PERFORMANCE INDICATORS
Q2/01
13.0%10.8%81.9%57.6%27,68717,653
Q1/01
18.7%14.9%80.3%59.7%28,21116,836
Q2/00
18.6%15.0%81.2%60.6%
10,875
* excl. amortisation of retention payments as well as acquired intangible assets and goodwill** excl. acquisition interest and amortisation of retention payments as well as acquired intangible assets and goodwill*** 30.06.01, 31.03.01 and 31.12.00 resp.
Supplement 40
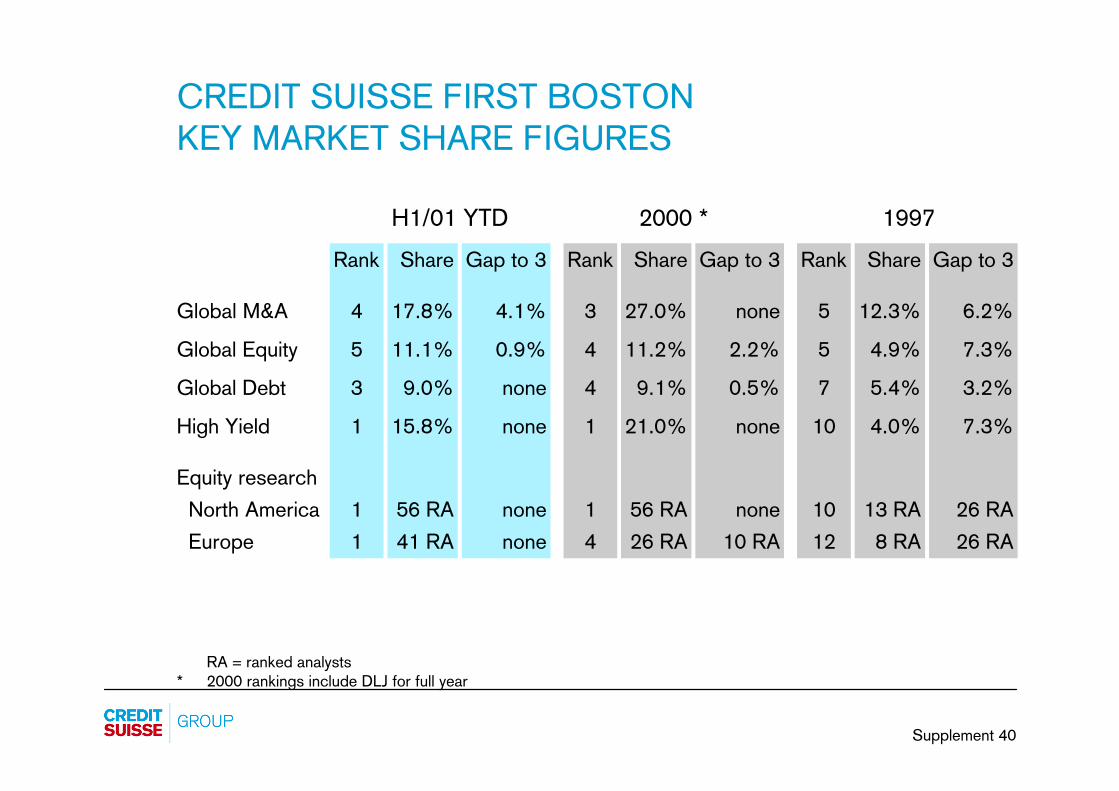
CREDIT SUISSE FIRST BOSTONKEY MARKET SHARE FIGURES
RA = ranked analysts* 2000 rankings include DLJ for full year
Global M&A
Global Equity
Global Debt
High Yield
Equity researchNorth AmericaEurope
H1/01 YTD 2000 * 1997
Rank
3
4
4
1
14
Share
27.0%
11.2%
9.1%
21.0%
56 RA26 RA
Gap to 3
none
2.2%
0.5%
none
none10 RA
Rank
4
5
3
1
11
Share
17.8%
11.1%
9.0%
15.8%
56 RA41 RA
Gap to 3
4.1%
0.9%
none
none
nonenone
Rank
5
5
7
10
1012
Share
12.3%
4.9%
5.4%
4.0%
13 RA8 RA
Gap to 3
6.2%
7.3%
3.2%
7.3%
26 RA26 RA

Supplement 41
CREDIT SUISSE FIRST BOSTONTRADING EXPOSURE (99% 1-day VaR)
Comment:§ Reported VaR as disclosed based on model approved by regulators§ Difference between reported VaR and observed trading volatility caused by model conservatism§ "Observed VaR" looks at actual trading P&L volatility; best method for peer comparison
VaR by risk typeInterest rateForeign exchangeEquityCommodityDiversification benefit
Total VaR at period endAverage during quarterMaximum during quarterMinimum during quarter
Standard deviation of trading P&LQuarterYTD
06.2001USD m
79.817.121.21.1
-46.972.373.085.366.6
USD m21.823.0
03.2001USD m
97.615.712.72.2
-44.483.882.499.469.5
USD m24.024.0
12.2000USD m
80.58.9
24.21.5
-31.084.186.7
103.975.5
USD m17.118.4

Supplement 42
CREDIT SUISSE FIRST BOSTONEMERGING MARKETS EXPOSURES
AsiaTotal exposure, net of provisions and off-sets(whereof provisions)
Americas *Total exposure, net of provisions and off-sets(whereof provisions)
Eastern EuropeTotal exposure, net of provisions and off-sets(whereof provisions)
AfricaTotal exposure, net of provisions and off-sets(whereof provisions)
Middle EastTotal exposure, net of provisions and off-sets(whereof provisions)
12.2000USD m
3,233(304)
2,068(16)
1,918(258)
813(29)
392(12)
06.2001USD m
2,895(308)
3,405(27)
1,996(45)
620(29)
496(12)
03.2001USD m
3,130(304)
3,620(16)
1,787(137)
563(29)
410(12)
* Net exposure Argentina 06/01: USD 430 m, whereof USD 215 m loans (all performing)

Supplement 43
CREDIT SUISSE FIRST BOSTONGLOBAL TELECOM EXPOSURE * BY RATING
AAAAAABBB
Total inv. grade
BBBCCC-CD
Total exposure
in %
-4.8%
52.0%10.9%
67.6%
11.8%13.1%2.9%4.5%
100.0%
06.2001USD m
-275
2,968620
3,863
676746166260
5,712* exposure defined as loan commitments (funded and unfunded) plus MTM trading exposures

Supplement 44
TOTAL COUNTERPARTY EXPOSUREINDUSTRY BREAKDOWN
Selected Industries
§ Automotive: 0.5%§ Computer: 2.0%§ Energy: 4.9%§ Health Care: 1.2%§ Telecom: 2.7%
Services13.1%
Manufacturing10.9%
RE & Const.8.5%
Energy/Environ.5.0%
Agri/Mining1.7%
Financial Enterprises
39.6%
Public3.1%
Individuals15.3%
Other3.0%
Total exposure: CHF 431 bn(as of 30 June 2001)

Supplement 45
in CHF m
Non-performing loans (NPLs) *% change to 31.12.00
Capital provisions against NPLs **Counterparty exposure *
- of which lending
Coverage ratio of NPLs30.06.0131.12.00
NPLs as %age of credit exposure *30.06.0131.12.00
CSFS06.01
6,923-16%
4,389129,603103,840
63%62%
5.3%6.5%
CSPB06.01
149+34%
7541,83037,373
50%54%
0.4%0.3%
CSFB06.01
2,668+80%1,405
259,83046,369
53%67%
1.0%0.6%
CSG06.01
9,740-1%
5,869431,263187,682
60%63%
2.3%2.4%
ASSET QUALITY CAPITAL EXPOSURE & PROVISION DEVELOPMENT
* includes loans and loan equivalents** excludes total interest of CHF 1,685 m (fully provided)