Embed Size (px)
Citation preview
Journal of Sustainable Development; Vol. 10, No. 1; 2017 ISSN 1913-9063 E-ISSN 1913-9071
Published by Canadian Center of Science and Education
55
Living Shoreline Treatment Suitability Analysis: A Study on Coastal Protection Opportunities for Sarasota County
Briana N. Dobbs1, Michael I. Volk2 & Nawari O. Nawari3 1 Graduate Student, College of Design, Construction, and Planning, University of Florida, USA 2 Assistant Research Professor, School of Landscape Architecture and Planning, College of Design, Construction, and Planning, University of Florida, USA 3 Associate Professor, School of Architecture, College of Design, Construction, and Planning, University of Florida, USA
Correspondence: Briana N. Dobbs, Graduate Student, College of Design, Construction, and Planning, University of Florida, USA. E-mail: [email protected]
Received: October 30, 2016 Accepted: November 28, 2016 Online Published: February 3, 2017
doi:10.5539/jsd.v10n1p55 URL: http://dx.doi.org/10.5539/jsd.v10n1p55
Abstract Increases in the world population, sea level rise, and urbanization of coastal areas have put tremendous pressures on coastlines around the world. As a result, natural shoreline habitats are being replaced by seawalls and other hardened forms of coastal protection. Evidence shows that hardened shorelines can have a negative impact on the environment and surrounding habitat, leading to a loss of biodiversity and ecosystem services. This research aims to increase the different forms of coastal protection used throughout Sarasota County, Florida by conducting a geographic information system (GIS) suitability analysis for living shoreline treatment. Living shorelines or hybrid solutions are a more ecologically sustainable alternative to traditional forms of coastal protection, which use natural ecosystems or alternatively- structural organic and natural materials such as plantings, rocks, and oyster beds to stabilize shorelines and enhance shoreline habitat. The GIS model identifies coastlines that are 1) most suitable for living shoreline treatment, 2) most suitable for a hybrid solution, or 3) not suitable for living shorelines by analyzing the bathymetry, land use, land value, tree canopy, population, wave energy, shoreline sensitivity, and shoreline habitat. The suitability for living shoreline treatments was assessed independently for each parameter and assigned a value ranging from 0, areas that should consider using traditional methods of coastal protection to 3, shoreline segments most suitable for living shoreline treatment. The results from the individual analyses for each parameter were combined using a weighted overlay approach to determine general suitability for living shorelines within the study area. The result found that over 95% of the shoreline segments are potentially suitable for hybrid shoreline stabilization solutions.
Keywords: living shoreline, GIS, suitability analysis, coastal protection
1. Introduction 1.1 General
Over one-third of the human population lives within 100 km of the coastline (Moschella, Abbiati, Aberg, Anderson, Bacchiocchi, Bulleri, Dinesen, Frost, Gacia, Granhag, Jonsson, Satta, Sundelof, Thompson, & Hawkins, 2005). This trend is projected to increase significantly, leading to a high demand for infrastructure to protect coastal lands from erosion and fight sea level rise (Hartig, Zarull, & Cook, 2011). Today, the standard form of coastal protection is known as armoring and commonly occurs in the form of engineered structures such as seawalls, bulkheads, and pier pilings. These forms of protection are likely to become more common as coastal populations continue to increase (Chapman & Underwood, 2006). Traditionally, seawalls have been installed when an area must be dredged or deepened to accommodate commercial industries (Hartig et al.,2011), or to protect residents from storm- surge and erosion (Chapman & Underwood, 2006). Other times, shorelines are hardened after habitats like dunes, which naturally protect against coastal hazards, have been removed. The current rate of armoring is approximately 200 km of shoreline a year (Gittman, Fodrie, Popowich, Keller, Bruno, Currin, Peterson & Piehler, 2015). If this rate continues, the percentage of hardened shorelines, factoring in the current bans on armoring within the United States, will increase from its current state of 14% to approximately

jsd.ccsenet.org Journal of Sustainable Development Vol. 10, No. 1; 2017
56
33% by 2100.
In 2015, the National Oceanic and Atmospheric Administration (NOAA) established that nearly 14% of the United States’ shoreline was coated in concrete (Popkins, 2015). The south Atlantic and Gulf Coasts are among the fastest growing and largest contributors to hardened seawalls. Today, approximately 50% of the Gulf of Mexico coast is lined with tidal wetlands (Gittman et al., 2015). The southern portion of the Gulf Coast, where Sarasota County is located, is expected to have one of the largest increases in density, as well as seawall construction in upcoming years (Popkins, 2015). This endangers the large percentage of remaining tidal salt marshes and mangrove forests left in the area.
Statewide, approximately 20% of Florida’s shorelines are artificially hardened while specific coastal communities such as Sarasota, Florida are dominated by an even larger percentage (Hauserman, 2007). A 2005 Gulf Shoreline Stabilization Inventory showed that approximately 32% of Gulf coast shorelines in Sarasota County were stabilized or hardened while a newer GIS study showed about 25% of the total shorelines as stabilized (Sarasota County, 2014). The County has lost over 1,600 acres of wetlands since 1950 and lost more than 100 miles of natural shoreline along Sarasota Bay to hardened structures (Sarasota Bay Estuary Program, 2015). These hardened shorelines may have damaged intertidal habitats vital to sustaining a healthy ecosystem and lead to a loss of biodiversity and ecosystem services (Chapman & Bulleri, 2003). As a result, the County has set a goal to restore one percent of their shoreline a year, a total of 18 acres a year (Sarasota Bay Estuary Program, 2015).

jsd.ccsenet.org Journal of Sustainable Development Vol. 10, No. 1; 2017
57
Figure 1. Sarasota county study area
The installation of seawalls results in displacement, degradation, and fragmentation of wetlands and beaches, two of the most valuable global natural resources (Gittman et al., 2015). In a study on impacts from seawalls on mangrove habitat, Heatherington & Bishop (2012) found that mangrove forests near seawalls were in some cases 1/3rd in width and had two times the pneumatophore density compared to mangroves away from seawalls. In 1997, Costanza conducted a study to determine the monetary value of marine and terrestrial habitats throughout the United States. Wetlands (tidal salt marshes / mangroves and swamps / flood plains) were calculated to be the largest contributors providing $4.9 trillion dollars each year out of the total $33 trillion dollars all ecosystem services provide annually (Costanza, 1997). Doubtless, these numbers have increased. Wetlands also provide numerous ecosystem services such as water purification, storm protection, recreational opportunities, and carbon sequestration (Gittman, Peterson, Currin, Fodrie, Piehler, & Bruno, 2016). The continued loss of these coastal systems will clearly have monetary impacts, reduce the level of ecosystem services they are able to provide, and change the character of the coastal areas we inhabit.

jsd.ccsenet.org Journal of Sustainable Development Vol. 10, No. 1; 2017
58
1.2 Solutions
Coastlines throughout the United States are rapidly changing due to coastal development, climate change, and efforts to prevent erosion, flooding, and the negative effects caused by coastal hazards and by sea level rise. Living shoreline treatment (LST) is one type of sustainable coastal protection that can be a substitute for hardened seawalls. This technique uses natural barriers such as mangroves and fringe marshes to defend the shoreline (Davis, Takas, & Schnabel, 2007). LST and hybrid solitons known as ecological engineering and soft engineering techniques have become increasingly popular as the value of wetlands and marshes are being recognized. Not only do these solutions provide habitat for estuarine species, they can slow erosion rates, reduce runoff, and create a natural buffer that lessens storm surge (Sarasota Bay Estuary Program, 2015).
The technique of combining hard material and plantings while also enhancing ecosystem services is considered a hybrid living shoreline (Gittman et al., 2016). Research shows that different species colonize on artificial structures when compared to the colonization that occurs in natural coastal habitats. One reason is the lack of structural complexity in seawalls (Chapman & Underwood, 2011). Seawalls are typically made of sheet metal or concrete. Both materials are smooth and lack crevasses or spaces to support habitat and species. One option is for the design and construction of seawalls to be carefully engineered to achieve these goals by designing seawalls that can increase biodiversity. Hybrid solutions attempt to merge structural engineering and ecological needs in order to reduce the environmental impacts of a seawall. Ng, Lim, Ong, Teo, Chou, Chua, & Tan (2015), investigated transplanting reef biota onto newly constructed seawalls. Results identified species that were able to survive in intertidal habitats of seawalls in the tropics (Ng et al.,2015). These conclusions could lessen negative impacts of already fabricated walls by enhancing the ecological value and accelerating the colonization of organisms.
Another alternative is to remove and replace seawalls and other traditional coastal armoring structures with more ecologically sustainable solutions. In a study by Brown and McLachland (2002), a seawall located in San Francisco Bay was removed and replaced with marsh plantings. The case was successful and found that the number of species at the seawall was less than the number of species present at the marsh even during seasonal declines. Gitman et al., (2016), researched how living shorelines can potentially enhance ecosystem services. In the study, marsh plantings and breakwaters were used for LST and were compared to non-vegetated bulkheads. The living shoreline supported a higher number of species and greater biodiversity, showing that living shorelines do in fact have the opportunity to increase certain ecosystem services. In Puget Sound, a seawall was completely removed resulting in a successful application of LST (Chapman & Underwood, 2006). Removing the wall created habitat for juvenile salmon to grow. While this method is the most sustainable it does not work in all areas because it requires land to be inundated by the sea and specific environmental conditions for success.
Living shoreline treatment and hybrid solutions perform differently depending on surrounding environmental conditions and locations. By identifying shorelines that are most suitable for LST or alternative hybrid techniques, coastal municipalities have an additional tool to increase the success and palate of alternative nature-based approaches that restore vital wetlands while defending the coast. Similar studies that have been done to-date, such as the Living Shoreline Suitability Model for Worcester County, Maryland completed by the Center for Coastal Resource Management Virginia Institute of Marine Science (VIMS), and College of William and Mary (2008), approached this problem by examining fetch, bathymetry, marsh presence, beach presence, bank condition and tree canopy. These studies have primarily focused on identifying suitability based on environmental variables and have not considered anthropocentric variables such as land value, land use, and population, which are likely to be a critical part of the decision making process when choosing locations for LST construction
This project assessed shorelines in Sarasota County to quantify and determine the locations where LST and hybrid solutions would be most effective and resilient using a combination of anthropocentric and environmental variables. The study sought to answer what segments are 1) most suitable for living shoreline treatment, 2) most suitable for a hybrid solution, or 3) not suitable for LST by analyzing the bathymetry, land use, land value, tree canopy, population, wave energy, shoreline sensitivity and shoreline habitat across shorelines that occur within the County. It was hypothesized that living shoreline treatment would perform best in sheltered areas and therefore useful as a tool to for Sarasota County that may help the county achieve their goal of restoring at least one percent of their wetlands a year (Sarasota Bay Estuary Program, 2015). In addition, though modifications or improvements may be appropriate to the methodology described here, this project provides a basis for conducting future living shoreline assessments that include both anthropocentric and environmental considerations.

jsd.ccsenet.org Journal of Sustainable Development Vol. 10, No. 1; 2017
59
1.3 Types of Hybrid Living Shoreline Treatment (LST)
Figure 2. A range of shoreline stabilization techniques (NOAA, 2015).
1.3.1 Marsh with Structures
Marsh with structures include marsh sills, marsh toe revetments and marsh with groins and may be implemented where marshes already exist but are beginning to erode along with the shoreline. Structured marshes are placed in shallow water to allow for the growth of new seagrasses (Zylberman, 2016), which can eventually create a perched beach (Miller et al., 2015). The beach furthermore stabilizes the shoreline and replaces the eroded land. At times sand is placed between the shoreline and the sill to accelerate the development of the beach. Marsh with structures may be used on shorelines that experience higher levels of wave energy and require additional structural enhancement on top of marsh planting.
1.3.2 Breakwaters
Breakwaters run parallel with the coast to prevent coastal erosion and to reduce the wave energy behind the breakwaters. The lower water energy facilitates the growth of marsh vegetation and / or assists in beach establishment which increases habitat complexity (Miller et al., 2015). Often times they are placed outside of marinas, harbors or along open coasts. Breakwaters can be differentiated from sills as they are constructed in deeper water, farther away from the shore, can handle higher wave energies and are usually larger.
1.3.3 Revetments
Revetments, similar to rip-rap, are placed along the shoreline or bank to prevent erosion (Miller et al., 2015). Their locations reduce wave energy on the slope facing the water. Rock and concrete are the most common materials used to build revetments but they can also be constructed of fallen trees or debris. Contrary to rip-rap, revetments are strategically sized and placed to incorporate vegetation, increase the biodiversity, and further stabilize the structure. One disadvantage, however, is revetments do not allow for a connection between people and water that is strongly encouraged in LST. The property owners can observe the water from a distance but are unable to actually touch the water (Hardaway, Milligan, & Duhring, 2010). Additionally, if the revetment is installed incorrectly it could cause more damage and increase erosion (Zylberman, 2014).
1.3.4 Living Reefs
Living reefs, also known as offshore living reef breakwaters and living reef sills, have become increasingly popular in recent years (Miller et al., 2015). They work best in sheltered areas with lower fetch and wave energies and assist in reducing erosion rates in a manner similar to sills and constructed breakwaters. Unfortunately, naturally occurring reefs that assist in decreasing erosion rates have lessened due to anthropocentric forces and natural causes. As a result, reefs are commonly being built off-site and then brought to the site to grow. In some cases, recruitment and growth of the species occurs naturally, and the larvae settles upon the supplied substrate. As time passes, the species used in the living reef colonize and continue to grow as large species and develop as a form of natural breakwater protection as well as aquatic habitat (Miller et al.,

jsd.ccsenet.org Journal of Sustainable Development Vol. 10, No. 1; 2017
60
2015). Similar to sills, living reefs assist in facilitating the growth of vegetation behind the reefs by dissipating the tidal and wave energy. Living reefs are most commonly found in the southern parts of the United States.
1.3.5 Reef Balls
Reef balls provide an opportunity for reef development in intense wave conditions (Miller et al., 2015). In the ideal conditions, the reef structures grow independently, forming a large reef over time as the larvae finds a hard surface to naturally grow upon. Reef balls are most commonly found in the southern regions of the U.S and in the Caribbean. Not only do reef balls lessen wave energy, they also create habitats that provide numerous ecosystem services. Reef Balls work best at reducing erosion in areas with low to moderate wave energy.
1.4 Environmental Parameters for LST and Hybrid Solutions
1.4.1 Bathymetry
The bathymetry adjacent to a shoreline determines where a wave breaks, the amount of sediment it transports and the size of the wave that will hit the shore (Miller et al., 2015). Generally, the less intense the slope, the less energy a wave has when hitting the shore. Steeper slopes usually result in high wave energies that reflect off of the shoreline. When the contours produce a milder slope, the energy is more likely to be absorbed into the shoreline, dissipating the energy. Gentle slopes with vegetation indicate a stable slope and bank condition that should be considered for non-structural LST (Zylberman, 2016) and many hybrid approaches (Miller et al., 2015).
Previous GIS-based studies have been completed to assess site suitability of LST. The Living Shoreline Suitability Model for Worcester County, Maryland completed by the the Center for Coastal Resource Management (CCRM), Virginia Institute of Marine Science (VIMS), and College of William and Mary (2008), looked at bathymetry as a suitability variable. Their research showed that in order for marsh grasses to grow successfully, near-shore water depth must be shallow (Center for Coastal Resource Management [CCRM], Virginia Institute of Marine Science, & College of William and Mary, 2008). In the VIMS research, the bathymetry contour was combined with the distance away from the shoreline to determine shallow areas and not shallow areas. If the 1M contour was less than 10M away from the shoreline, then it was considered not shallow, and unsuitable for LST. If the 1M contour was greater than 10M from the shoreline, it was determined shallow and a suitable condition. This can also be considered in terms of slope. If the nearshore slope is greater than 10% the shoreline is less suitable for LST.
1.4.2 Shoreline Habitat
LST and many hybrid stabilization methods require new growth of grasses and plantings. Shorelines that are already vegetated are likely to be more suitable for LST and may have greater potential for supporting new growth (CCRM et al., 2008). An additional factor to consider is the width of existing marshes or other coastal ecosystems. Wider wetlands are likely to be healthier and more established. However, fringing marshes, or marshes less than or equal to 20M wide, deliver some equivalent functions when compared to broader marsh meadows (Bilkovic & Mitchell, 2013). Marshes that are less than 10M wide have been found to be effective at reducing wave energy and sediment deposits.
1.4.3 Shoreline Sensitivity
In 1976, the idea of ranking and mapping shoreline sensitivity originated for the Lower Cook Inlet (Petersen Michel, Zengel, White, Lord, & Plank, 2002). Since then, the idea has developed and been expanded to include North American, Central America, and portions of the Middle East. Today, the Environmental Sensitivity Index (ESI) is typically used to determine the sensitivity to oil spills but also parallels with living shoreline suitability. The shoreline slope, shoreline type, shoreline biological productivity, and overall sensitivity to waves and tidal energies determine a shoreline’s ESI score. When examining these four factors, high ESI rankings are more likely to be suitable for LST while low ESI rankings are not suitable for LST. Shoreline type is classified based on the grain size, the tidal elevation, and the substrate. Within the data set, shoreline areas that are exposed to high wave energies and with low biological productivity or sensitivity, generally rank lowest on the scale. In contrast, areas with high biological productivity and low wave energy, rank on the higher end of the scale. Both high wave energy and low biological production are unsuitable situations for LST. As a result, the higher the ESI ranking, the more suitable LST would be on that specific site (Petersen et al, 2002).
1.4.4 Tree Canopy
The amount of sunlight a shoreline receives influences terrestrial and aquatic species (Miller et al., 2015). The tree canopy determines whether there is enough sunlight to grow the necessary vegetation below and the growth

jsd.ccsenet.org Journal of Sustainable Development Vol. 10, No. 1; 2017
61
rate. Marsh plantings require a minimum of six hours of sunlight a day. Additionally, sunlight is a necessary component for photosynthesis to occur (Miller et al., 2015). Oxygen cannot be created without photosynthesis, which directly alters the water quality and biological productivity of the organism. Marsh plantings should not be planted around large shade trees or structures that prevent the sunlight from reaching the ground. Hybrid solutions that do not require marsh plantings, such as revetments, breakwaters, and reef balls are not influenced by sunlight exposure and can work under low or high sunlight conditions.
1.4.5 Wave Energy
Hydrodynamic parameters are one of the most important factors when evaluating the different variables for living shoreline suitability. Hydrodynamic characters include fetch, wakes from boat traffic, currents, ice, and storm surge (Miller et al., 2015). Wide expanses of open waters create a large fetch, while sheltered coasts create a smaller fetch (Zylberman, 2016). The higher the fetch, the greater the wave energy and size. Low wave energy is required to establish the growth of seagrasses, marshes, and mudflat habitats (NRC, 2007). Marsh sills, living reefs, and reef balls work best in environments with low to moderate wave energy. Revetments can withstand moderate to high waves, while breakwaters can withstand high energy (Miller et al., 2015).
1.5 Anthropocentric Considerations for LST and Hybrid Solutions
It has been over ten years since living shorelines started to gain popularity. Despite the available research, the number of living shoreline projects is still limited. In 2014, Virginia Institute of Marine Science held a public workshop with 144 participants and mailed out a questionnaire to identify the gap between the number of projects that have been constructed and the number of projects that should have been constructed according to suitability research that shows where living shorelines are appropriate (Center for Coastal Resource Management [CCRM], 2014). The results found that many people looked to their friends, family, and contractors, who have traditional forms of coastal protection, for advice on whether LST is the best decision for them and often times found they were more comfortable with standard construction practices. Additionally, the results indicated that individuals are also concerned about the effectiveness of LST because of the limited number of public projects. One way to fight this concern is to develop more public projects. Implementing living shoreline projects in high intensity, urban areas with high populations will result in a larger percent of the population having an opportunity to see living shorelines working in action and an opportunity for education. Areas that have a high number of visitors are great places to present the benefits of living shoreline projects and educate the public, allowing the project to act as a passive learning platform (Swann, 2008). Additionally, these areas offer an opportunity for monitoring compared to private, less populated shorelines. Monitoring the results will contribute to future research and collaborations with surrounding colleges to further education. Integrative projects can also assist in competitive grant opportunities that could help with funding for future projects.
A third concern of citizens was the cost of constructing living shoreline projects (CCRM, 2014). Maintenance costs, in addition to construction costs, must be included in the price for standard types of protection and LST. Living shorelines tend to be more resilient to storms, resulting in lower long-term maintenance costs. Standard practices must include the additional costs of mitigating wetlands if riparian vegetation or wetlands are removed, whereas living shoreline projects either include the vegetation in the design or mitigate any potential impacts on site.
Since the cost of living shoreline projects ranks highly on the list of concerns by interested individuals, it should be considered when determining the correct location for LST. Assessing the land value per acre is a coarse way to evaluate whether a shoreline is an appropriate place to implement LST with easily available data, though there are different ways of assessing suitability. Despite the evidence that shows that LST is comparable in cost to shoreline hardening, there is still a financial fear associated with living shorelines that discourages people from constructing new LST projects.
2. Methodology and Analysis 2.1 The Suitability Index
The suitability index used for this research was adapted from the Living Shoreline Suitability Model developed by the Virginia Institute of Marine Science (VIMS) for Worcester County, Maryland (2008). The research is considered a non-experimental study and was completed using secondary GIS data layers pulled from existing online databases. The variables used in this experiment were altered from the VIMS study due to the availability or lack of GIS layers and to include anthropocentric attributes such as property value, land use, and population which were not included in past studies (CCRM et al., 2008). Suitability for LST was mapped, assessed and modeled independently for each parameter. The results from the individual analyses for each parameter were
jsd.ccsenet.org Journal of Sustainable Development Vol. 10, No. 1; 2017
62
combined using a weighted overlay approach to determine general suitability for LST within the study area. The weighted overlay tool calculates the final suitability score by multiplying the value of each parameter by the weight of its importance and summing the results together.
The shoreline was represented using the Florida Fish and Wildlife Conservation Commission polyline data (2004). The Sarasota County boundary line was buffered by 400M to clip the shoreline data, ultimately creating the Sarasota County Shoreline layer. The Sarasota County Shoreline layer was buffered 400M on both sides and used as the mask for the model to identify all shorelines within the county and an upland buffer. All data features were converted to raster datasets and assigned a cell size of 10. Each raster was then reclassified and assigned a value of 0-3 based on suitability for living shoreline construction. Three identifies areas that are most suitable for living shoreline with no structural components, while 0 represents locations that were entirely unsuitable. Areas that receive a 2 are segments suitable for hybrid solutions with minimal structural components while shorelines that received 1 are candidates for hybrid solutions that incorporate vegetation and structural components. Areas of no data were also assigned a value of 0 to permit a complete overlay among the 8 variables. The 0 value was chosen to be conservative about the potential suitability.
2.2 Bathymetry
Gentle slopes with vegetation indicate a stable bank condition that should be considered for non-structural LST (Zylberman, 2016) and many hybrid approaches (Miller et al., 2015). Bathymetry data from National Oceanic and Atmospheric Administration (2002) was used to calculate the slope of the seafloor in terms of percent (percent rise) adjacent to the shorelines in the study area. Nearshore slopes that ranged from 0-3% received a value “3” and were considered shorelines that were most suitable for LST. Shorelines with a slope from 3-6% received a value of “2”, areas with a slope ranging from 6-10% received a value of “1”, and areas with a slope greater than 10% received a value of “0” because it was an unfit condition.
2.3 Land Use
The Florida Fish and Wildlife Conservation Commission’s Cooperative Land Cover (2015) raster dataset was used to identify land use. Land uses that were defined as high intensity urban areas, were considered the most suitable for LST and received the value of a “3”. Areas defined as low intense urban areas, received a value of a “2”, while rural areas were assigned a value of “1”. The Florida Fish and Wildlife Conservation Commission’s Cooperative Land Cover (2015) raster dataset was used to identify land cover in addition to land use. As a result, the data referring to land cover was reclassified as unsuitable and assigned a value of “0”.
2.4 Land Values
The surrounding land values can assist in determining whether installing a living shoreline treatment is the best option. Information was retrieved from the U.S. Census Bureau (2010) dataset. Within the attribute table, a new column was created to calculate the value of land per acre. The new values were reclassified on a scale from 0 – 3. Areas that averaged $0 - $75,000 an acre received a value of “1”. Areas that averaged $75,000 - $250,000 an acre received a value of “2”. Areas that averaged $250,000- $15,000,000 an acre received a value of “3”. The higher the property value, the more suitable the environment for the installation of LST as the individual or business would feel more comfortable investing money to protect their property.
2.5 Population
Locating living shoreline projects in areas with high populations will increase the number of people that see the project. This creates an opportunity for passive educational exhibits where community members can learn about the advantages of LST first hand. The U.S Census Bureau data set (2010), was clipped to the Sarasota County Shoreline Layer. The range of values and the mean were calculated to determine the correct values for reclassification. The highest value was 175 people per acre while the lowest value was 0 people per acre. The mean, 3.6 people per acre, was used to determine the areas that received a value of “2”. Populations ranging from 0 -1 people per acre received a value of “0”. Areas of the population that ranged from 1 – 3 people per acre were assigned a value of “1”. Areas with a population ranging from 3 – 9 people per acre received a value of “2”. Shorelines with populations of 9-175 people per acre received a value of “3” and were considered to be segments that are most suitable for LST.
2.6 Sensitive Shorelines
The Florida Fish and Wildlife Conservation Commission’s (FWCC) Sensitive Shoreline vector line (2013) dataset was used to determine the sensitivity of the shorelines in the study area. The dataset was classified according to the Environmental Sensitivity Index and was used to determine the sensitivity of coastal and marine environments and species to oil spills. The data classified the shorelines from 1-10 based on their sensitivity to

jsd.ccsenet.org Journal of Sustainable Development Vol. 10, No. 1; 2017
63
oil spills. The Environmental Sensitivity Index looked at four different aspects: the shoreline type, the ease of clean up, biological productivity and sensitivity, and the wave and tidal energy. For the purpose of this research, the data was reclassified and assigned a value from 0-3. The reclassification of the data was evenly distributed while also paying attention to the descriptions of the NOAA Environmental Sensitivity Index Guidelines for Attribute Domain Value. The most sensitive shorelines received a value of “3”, less sensitive shorelines received a value of “2”, and the least sensitive shorelines received a “1”. Shorelines that are exposed to high wave energies and have low biological productivity, generally rank lowest on the Environmental Sensitivity Index and also rank low on the suitability index. Shorelines with high biological productivity and low wave energy, rank on the higher end of the Environmental Sensitivity Index and are more suitable LST.
2.7 Shoreline Habitat
The Florida Cooperative Land Cover (2015) raster dataset contains information on ground cover and land uses was used to identify shoreline habitat types. In past studies, shorelines with marsh presence were considered suitable and ranked higher than other land cover types (Center for Coastal Resources Management, Virginia Institute of Marine Science, & College of William and Mary, 2008). As a result, this method was adopted and adapted. Using the CLC dataset, the areas defined as isolated freshwater marsh, marshes, and salt marshes were considered most suitable and were assigned a value of “3”. All other land cover types that were capable of growing vegetation and near the shoreline were given a value of “2”. These included cypress, freshwater forested wetlands, mangrove swamp, tidal flat, wet flatwoods, cultural palustrine, cultural- lacustrine, estuarine, isolated freshwater swamp, marine, other coniferous wetlands, and other hardwood wetlands. The remaining land cover types, such as uplands, and additional land use data received a “0’. Determinations were based on the definition of each type of land cover defined by the CLC.
2.8 Tree Canopy
The tree canopy of an area is an indication of whether enough sunlight underneath the canopy exists to allow vegetation to grow. The 2011 National Land Cover Database’s (NLCD) raster dataset, created by the Multi-Resolution Land Characteristics Consortium was used. The dataset depicts the percent of tree coverage for the state of Florida, ranging from 0-100%, with 100 representing full canopy coverage. The data was reclassified in equal intervals. Tree canopy coverage of 0-33% received a value of “3”. Shorelines with 33-66% tree canopy were assigned a value of “2”. Areas that showed a tree canopy between 66-100% were given a value of “1”.
2.9 Wave Energy
High erosion conditions are likely caused by high wave energy. Steep banks and areas with high wave energy are both unfavorable growing conditions for LST. Sarasota County Water Bodies (2016) data was used to determine which types of waterbodies produced the highest wave energy. After examining the location of each on the map, understanding the general waterbody definition and considering the possible boat traffic and waves that could be produced, each type of waterbody was reclassified and given a value from 0-3 based on the wave energy on the shoreline. Bayou, lagoon, slough, tidal creek, and canal were reclassified as low wave energy and received a value of “3”. Inlet, pass, waterway, and basin were reclassified as medium wave energy and assigned a value of “2”. Gulf, channel, and bay were classified as the highest wave energy and given a value of “1”. The remaining waterbody types, such as freshwater lakes and detention ponds were given a “0”.
2.10 Suitability Index
The suitability index was calculated based on eight criteria: bathymetry, land use, land value, population, shoreline habitat, shoreline sensitivity, tree canopy and wave energy. All datasets were reclassified and assigned a value between 0-3 based on their suitability. The higher the suitability for LST, the higher the assigned value. After each variable was reclassified, the final suitability score was identified using a weighted overlay approach (see Table 1).
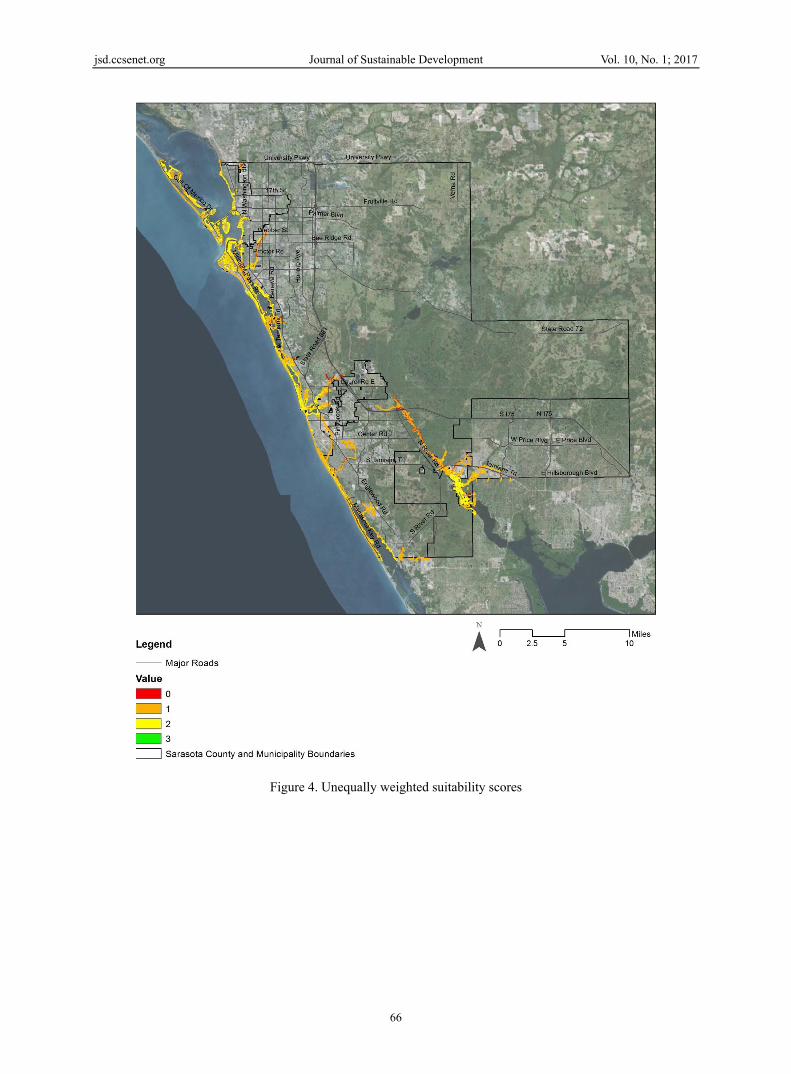
In this experiment, the weighted overlay was calculated in two different ways. The first method weighted all eight variables evenly. This means each variable received a weighted value of 0.125 and was considered equally important (see Figure 3). The second calculation separated the weights by environmental and anthropocentric attributes. Environmental factors that determined whether or not a living shoreline could persist, such as bathymetry, shoreline sensitivity, shoreline habitat, tree canopy and wave energy were assigned a higher weight of 0.155. Land value, land use and population, variables that encourage or discourage LST but do not limit its success based on growth, received a weight of 0.075. (see Figure 4).
jsd.ccsenet.org Journal of Sustainable Development Vol. 10, No. 1; 2017
64
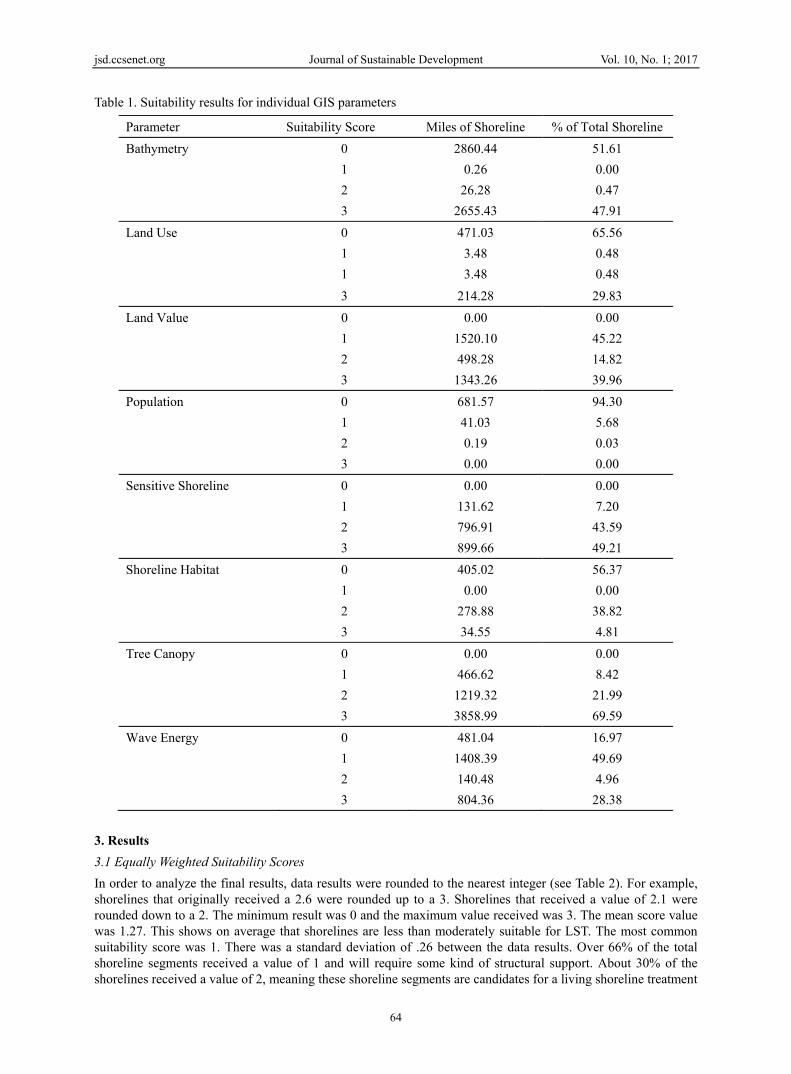
Table 1. Suitability results for individual GIS parameters
Parameter Suitability Score Miles of Shoreline % of Total Shoreline
Bathymetry 0 2860.44 51.61
1 0.26 0.00
2 26.28 0.47
3 2655.43 47.91
Land Use 0 471.03 65.56
1 3.48 0.48
1 3.48 0.48
3 214.28 29.83
Land Value 0 0.00 0.00
1 1520.10 45.22
2 498.28 14.82
3 1343.26 39.96
Population 0 681.57 94.30
1 41.03 5.68
2 0.19 0.03
3 0.00 0.00
Sensitive Shoreline 0 0.00 0.00
1 131.62 7.20
2 796.91 43.59
3 899.66 49.21
Shoreline Habitat 0 405.02 56.37
1 0.00 0.00
2 278.88 38.82
3 34.55 4.81
Tree Canopy 0 0.00 0.00
1 466.62 8.42
2 1219.32 21.99
3 3858.99 69.59
Wave Energy 0 481.04 16.97
1 1408.39 49.69
2 140.48 4.96
3 804.36 28.38
3. Results 3.1 Equally Weighted Suitability Scores
In order to analyze the final results, data results were rounded to the nearest integer (see Table 2). For example, shorelines that originally received a 2.6 were rounded up to a 3. Shorelines that received a value of 2.1 were rounded down to a 2. The minimum result was 0 and the maximum value received was 3. The mean score value was 1.27. This shows on average that shorelines are less than moderately suitable for LST. The most common suitability score was 1. There was a standard deviation of .26 between the data results. Over 66% of the total shoreline segments received a value of 1 and will require some kind of structural support. About 30% of the shorelines received a value of 2, meaning these shoreline segments are candidates for a living shoreline treatment

jsd.ccsenet.org Journal of Sustainable Development Vol. 10, No. 1; 2017
65
with minimal structural support. A minuscule amount of shorelines, less than 1%, received a value 3 for only vegetative LST.
Figure 3. Equally weighted suitability scores
3.2 Unequally Weighted Suitability Scores
After rounding to the closest integer, the maximum value was a 3 and the minimum was a 0 (see Table 2). The mean score was 1.28. This shows on average shorelines are less than moderately suitable for LST. There was a standard deviation of .27 between the data. Approximately 64% of the data received a value of 1 and about 32% of the shorelines received a value 2. When compared to the equally weighted suitability results, more shorelines are received a suitable score of 2. However, more segments received a 0 and fewer shorelines received a 3, making it less suitable for LST with vegetation only. The most common suitability score was 1.
jsd.ccsenet.org Journal of Sustainable Development Vol. 10, No. 1; 2017
66
Figure 4. Unequally weighted suitability scores
jsd.ccsenet.org Journal of Sustainable Development Vol. 10, No. 1; 2017
67
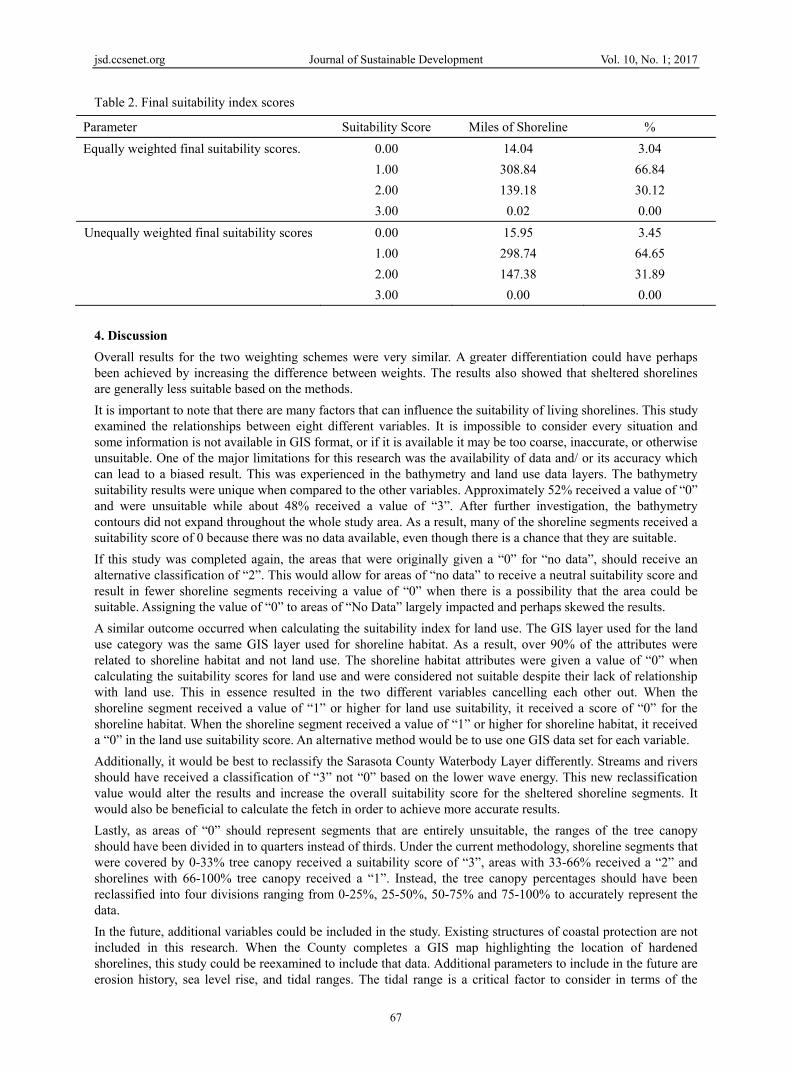
Table 2. Final suitability index scores
Parameter Suitability Score Miles of Shoreline %
Equally weighted final suitability scores. 0.00 14.04 3.04
1.00 308.84 66.84
2.00 139.18 30.12
3.00 0.02 0.00
Unequally weighted final suitability scores 0.00 15.95 3.45
1.00 298.74 64.65
2.00 147.38 31.89
3.00 0.00 0.00
4. Discussion Overall results for the two weighting schemes were very similar. A greater differentiation could have perhaps been achieved by increasing the difference between weights. The results also showed that sheltered shorelines are generally less suitable based on the methods.
It is important to note that there are many factors that can influence the suitability of living shorelines. This study examined the relationships between eight different variables. It is impossible to consider every situation and some information is not available in GIS format, or if it is available it may be too coarse, inaccurate, or otherwise unsuitable. One of the major limitations for this research was the availability of data and/ or its accuracy which can lead to a biased result. This was experienced in the bathymetry and land use data layers. The bathymetry suitability results were unique when compared to the other variables. Approximately 52% received a value of “0” and were unsuitable while about 48% received a value of “3”. After further investigation, the bathymetry contours did not expand throughout the whole study area. As a result, many of the shoreline segments received a suitability score of 0 because there was no data available, even though there is a chance that they are suitable.
If this study was completed again, the areas that were originally given a “0” for “no data”, should receive an alternative classification of “2”. This would allow for areas of “no data” to receive a neutral suitability score and result in fewer shoreline segments receiving a value of “0” when there is a possibility that the area could be suitable. Assigning the value of “0” to areas of “No Data” largely impacted and perhaps skewed the results.
A similar outcome occurred when calculating the suitability index for land use. The GIS layer used for the land use category was the same GIS layer used for shoreline habitat. As a result, over 90% of the attributes were related to shoreline habitat and not land use. The shoreline habitat attributes were given a value of “0” when calculating the suitability scores for land use and were considered not suitable despite their lack of relationship with land use. This in essence resulted in the two different variables cancelling each other out. When the shoreline segment received a value of “1” or higher for land use suitability, it received a score of “0” for the shoreline habitat. When the shoreline segment received a value of “1” or higher for shoreline habitat, it received a “0” in the land use suitability score. An alternative method would be to use one GIS data set for each variable.
Additionally, it would be best to reclassify the Sarasota County Waterbody Layer differently. Streams and rivers should have received a classification of “3” not “0” based on the lower wave energy. This new reclassification value would alter the results and increase the overall suitability score for the sheltered shoreline segments. It would also be beneficial to calculate the fetch in order to achieve more accurate results.
Lastly, as areas of “0” should represent segments that are entirely unsuitable, the ranges of the tree canopy should have been divided in to quarters instead of thirds. Under the current methodology, shoreline segments that were covered by 0-33% tree canopy received a suitability score of “3”, areas with 33-66% received a “2” and shorelines with 66-100% tree canopy received a “1”. Instead, the tree canopy percentages should have been reclassified into four divisions ranging from 0-25%, 25-50%, 50-75% and 75-100% to accurately represent the data.
In the future, additional variables could be included in the study. Existing structures of coastal protection are not included in this research. When the County completes a GIS map highlighting the location of hardened shorelines, this study could be reexamined to include that data. Additional parameters to include in the future are erosion history, sea level rise, and tidal ranges. The tidal range is a critical factor to consider in terms of the

jsd.ccsenet.org Journal of Sustainable Development Vol. 10, No. 1; 2017
68
“living” aspects for LST (Miller, Rella, Williams, & Sproule, 2015). For example, when including oysters or similar living reef elements, the placement is dependent upon the water level. Lastly, understanding the quality of water is important for successful habitat development, a key feature in almost every living shoreline project. Different habitats require different conditions for growth including water temperature, salinity, and turbidity.
Finally, any GIS-based or model-based approach to identifying suitability for LST is inherently coarse and needs to be ground-truthed. This analysis is only an early step in the process of identifying suitable locations for LST.
4.1 Challenges of Living Shoreline Implementation
Currently, the regulatory process and permitting is a major challenge when implementing living shoreline treatment, especially hybrid alternatives. There are many specifications that must be met which can turn construction approval into a lengthy process that deters residents from using LST strategies. Research, like this document, can help expedite the process by having a basic understanding of suitable locations for LST. Projects must also follow local, state and federal laws. Within the City of Sarasota, one of the main problems lies in the definition of fill. The regulations allow for nonstructural methods of living shoreline treatment but dismiss hybrid solutions in all areas. Cities around the United States are facing similar issues in regard to permitting hybrid living shoreline treatments.
One solution is to clarify and specify the permitting process. The New Jersey Department of Environmental Protection (2011) released a white paper discussing different situations that would require different types of permitting. This would allow more flexibility in LST construction and replacement (Frizzera, 2011). Others have drafted model ordinances for living shoreline projects that include the definition, purpose, and requirements for a project (Boyd & Pace, 2013). Looking to existing language in surrounding counties is another solution. Brevard County defines living shorelines in Florida Sec. 62-3661 of the code as “erosion management techniques, such as the strategic placement of plants, stone, sand, and other structural and organic materials, that are used primarily in areas with low to moderate wave energy, and are designed to mimic natural coastal processes” (Brevard County, 1994). It furthermore encourages living shorelines as the primary method of coastal protection in areas where bulkheads and rock revetments are prohibited, but stabilization is needed. Additionally, by engaging the residents at the beginning of the research, instead of using public participation data from VIMS, the methodology could have been personalized for Sarasota, helping to build momentum with the citizens to change these restricting regulations.
5. Conclusion The coastlines of Sarasota are one of the County’s most valued resources. As sea level rises and urbanization continues, the demand for coastal protection will increase in order to protect developed shorelines. Standard methods of coastal protection include shoreline armoring which can result in a loss of habitat and ecosystem services. Sarasota has placed restrictions limiting the new construction of hardened shorelines like bulkheads and seawalls. This presents a great opportunity to introduce alternative nature-based approaches. These approaches include but are not limited to, living shorelines, reef balls, and living reefs. Not only do these techniques assist in coastal erosion and sea level rise, but could support the County’s goal of restoring 18 acres of wetlands a year while also increasing the health of the water, providing habitat for marine and terrestrial species, delivering an aesthetic benefit and assisting in a variety of ecosystem services.
Suitable conditions for living shoreline treatment (LST) and hybrid solutions depend on the surrounding environment. Nonstructural alternatives, such as beach nourishment and marsh restoration, require low energy shorelines, with existing vegetation, gentle nearshore slopes and adequate sunlight. This research used ArcGIS to create a suitability index to identify shorelines that were suitable for LST and hybrid solutions by examining eight different variables. The suitability for each parameter (bathymetry, land use, land value, population, shoreline habitat, sensitive shorelines, tree canopy and wave energy) was completed independently. In order to determine the overall suitability for LST within the study area, the results from each of the individual suitability analyses were combined using a weighted overlay approach. The weighted overlay approach was calculated using two different methods. The first method assigned an equal value to each of the variables to calculate the final suitability analysis. The second method assigned a higher weight to the environmental parameters and a lesser weight to the anthropocentric attributes.
The results from the study encourage alternative methods of coastal protection in Sarasota County. The equally weighted and unequally weighted suitability analysis showed that over 95% of the shorelines may be candidates for hybrid living shoreline techniques while less than 1% of the shorelines resulted in areas that would likely support LST without structural components. Implementation of LST and hybrid options face many challenges such as costs, lack of awareness and permitting. However, as research continues and alternative methods of
jsd.ccsenet.org Journal of Sustainable Development Vol. 10, No. 1; 2017
69
coastal protection are demanded, LST will increase. This model can assist in the first step of screening for LST and begin the conversation between residents, homeowners, and officials to take the next steps to becoming a resilient County.
References Bilkovic, D. M., & Mitchell, M. M. (2013). Ecological Tradeoffs of Stabilized Salt Marshes as a Shoreline
Protection Strategy: Effects of Artificial Structures on Microbenthic Assemblages. Ecological Engineering, 61(A), 469-481. https://doi.org/10.1016/j.ecoleng.2013.10.011
Boyd, C., & Pace, N. L. (2013). Coastal Alabama living shorelines policies, rules, and model ordinance manual. Retrieved from http://floridalivingshorelines.com/wp-content/uploads/2015/05/Boyd-Pace-2013-Coastal- Alabama-Living-Shorelines-Policies- Manual.pdf
Brevard County. (1994). Code of ordinances of Brevard county, Florida volume I. municode.
Center for Coastal Resources Management, Virginia Institute of Marine Science, & College of William and Mary. (2008, May). Living Shoreline Suitability Model Worcester County, Maryland. Retrieved from http://ccrm.vims.edu/publications/projreps/worcester_living%20_shoreline_v2.pdf
Center for Coastal Resources Management. (2014). Living Shoreline Implementation: Challenges and Solutions. Rivers and Coasts, 9(2), 1-8. Retrieved from http://ccrm.vims.edu/publications/pubs/rivers&coast/RC914.pdf
Chapman, M., & Bulleri, F. (2003, Feb). Intertidal Seawalls—New Features of Landscape in Intertidal Environments. Landscape and Urban Planning, 62(3), 159-172. https://doi.org/10.1016/S0169-2046(02)00148-2
Chapman, M., & Underwood, A. (2006). Evaluation of Ecological Engineering of “armored” Shorelines to Improve their Value as Habitat. Journal of Experimental Marine Biology and Ecology, 1(2), 302-312.
Costanza, R., d’Arge, R., de Groot, R., Farberk, S., Grasso, M., Hannon, B., Limburg, K., Naeem, S., O’Neill, R.V., Paruelo, J., & Raskin, R.G. (1997). The value of the world’s ecosystem services and natural capital. NATURE, 387, 253-260. https://doi.org/10.1038/387253a0
Davis, L., Takacs, R., & Schnabel, R. (2007, Jan). Evaluating Ecological Impacts of Living Shorelines and Shoreline Habitat Elements: An Example From the Upper Western Chesapeake Bay. Research Gate. Retrieved from https://www.researchgate.net/publication/259673745_Evaluating_Ecological_Impacts_of_Living_Shorelines_and_Shoreline_Habitat_Elements_An_Example_From_the_Upper_Western_Chesapeake_Bay
ESRI. (2016). Retrieved from http://desktop.arcgis.com/en/arcmap/10.3/tools/spatial-analyst-toolbox/how-slope-works.htm
Florida Fish and Wildlife Conservation Commission (FWCC). (2013). Florida's Environmentally Sensitive Shorelines – 2013. Retrieved from http://www.fgdl.org/metadataexplorer/explorer.jsp
Florida Fish and Wildlife Conservation Commission (FWCC). (2015). Cooperative Land Cover Map. Retrieved from http://myfwc.com/research/gis/applications/articles/Cooperative-Land-Cover
Frizzera, D. (2011, Sept). Mitigating Shoreline Erosion along New Jersey’s Sheltered Coast: Overcoming Regulatory Obstacles to Allow for Living Shorelines. Retrieved from http://www.nj.gov/dep/cmp/docs/living-shorelines2011.pdf
Gittman, R. K., Fodrie, F. J., Popowich, A. M., Keller, D. A., Bruno, J. F., Currin, C. A., Peterson, C. H., & Piehler, M. F. (2015). Engineering Away Our Natural Defenses: an Analysis of Shoreline Hardening. US. Frontiers in Ecology and the Environment, 13(6), 301–307. https://doi.org/10.1890/150065
Gittman, R., Peterson, C., Currin, C., Fodrie, F., Piehler, M., & Bruno, J. (2016). Living Shorelines can Enhance the Nursery Role of Threatened Estuarine Habitats. Ecological Applications, 26(1), 249-263. https://doi.org/10.1890/14-0716
Hardaway, C., Milligan, D., & Duhring, K. (2010). Living Shoreline Design Guidelines for Shore Protection in Virginia's Estuarine Environments, Gloucester Point, VA: Virginia Institute of Marine Science, College of William and Mary.
Hartig, J., Zarull, M., & Cook, A. (2011). Soft Shoreline Engineering Survey of Ecological Effectiveness. Ecological engineering, 37, 1231-1238. https://doi.org/10.1016/j.ecoleng.2011.02.006
jsd.ccsenet.org Journal of Sustainable Development Vol. 10, No. 1; 2017
70
Hauserman, J. (2007, April). Florida’s Coastal and Ocean Future a Blueprint for Economic and Environmental Leadership. Retrieved from https://www.nrdc.org/sites/default/files/flfuture.pdf
Heatherington, C., & Bishop, M. (2012). Spatial Variation in the Structure of Mangrove Forest with Respect to Seawalls. Marine and Freshwater Research, 63, 926-933. https://doi.org/10.1071/MF12119
Miller, J. K., Rella, A., Williams, A., & Sproule, E. (2015). Living Shoreline Engineering Guidelines. Stevens Institute of Technology: Davidson Laboratory, Center for Maritime Systems.
Moschella, P., Abbiati, M., Aberg, P., Anderson, J., Bacchiocchi, F., Bulleri, F., … Hawkins, S. (2005). Low-crested Coastal Defense Structures as Artificial Habitats for Marine Life: Using Ecological Criteria in Design. Science Direct, 52, 1053-1071.
National Land Cover Database. (2011). NCLD 2011 Land Cover. Retrieved from http://www.mrlc.gov/nlcd11_data.php
National Oceanic and Atmospheric Administration (NOAA). (2002). Bathymetric Contours for the State of Florida and Surrounding Areas. Retrieved from http://www.fgdl.org/metadataexplorer/explorer.jsp
Ng, C., Lim, S., Ong, J., Teo, L., Chou, L., Chua, K., & Tan, K. (2015). Enhancing the Biodiversity of Coastal Defense Structures: Transplantation of Nursery-reared Reef biota onto Intertidal Seawalls. Ecological Engineering, 82, 480-486. https://doi.org/10.1016/j.ecoleng.2015.05.016
Petersen, J., Michel, J., Zengel, S., White, M., Lord, C., & Plank, C. (2002, March). Environmental Sensitivity Index Guidelines. Retreived from http://response.restoration.noaa.gov/sites/default/files/ESI_Guidelines.pdf
Popkin, G. (2015, Aug 8). Fourteen percent of U.S. coastline is covered in oncrete. Retrieved from http://www.sciencemag.org/news/2015/08/fourteen-percent-us-coastline-covered- concrete
Sarasota Bay Estuary Program. (2015). Wetlands. Retrieved from http://sarasotabay.org/habitat-restoration/wetlands/
Sarasota County. (2014, Aug 27). Sarasota County Comprehensive Plan. Chapter 2: Environment. Retrieved from https://www.scgov.net/CompPlan/Comp%20Plan%20Amendments/Chapter%202%20-%20 Environment.pdf
Sarasota County. (2016). Sarasota County Boundary. Retrieved from https://www.scgov.net/GIS/Pages/DataDownload.aspx
Sarasota County. (2016). Water Bodies. Retrieved from https://www.scgov.net/GIS/Pages/DataDownload.aspx
Swann, L. (2008). The use of living shorelines to mitigate the effects of storm events on Dauphin Island, Alabama, USA. American Fisheries Society Symposium 64.
U.S. Census Bureau. (2011). 2010 US Census Blocks in Florida (with Selected Fields from 2010 Redistricting Summary File and Summary File 1). Retrieved from http://www.census.gov/
University of Florida's GeoPlan Center. (2015). Florida County Boundaries with Detailed Shoreline. Retrieved from http://www.fgdl.org/metadataexplorer/explorer.jsp
Zylberman, J. M. (2016). Modeling Site Suitability of Living Shoreline Design Options in Connecticut. Master’s Thesis Paper 875. Retrieved from http://digitialcommons.uconn.edu/gs_theses875
Copyrights Copyright for this article is retained by the author(s), with first publication rights granted to the journal.
This is an open-access article distributed under the terms and conditions of the Creative Commons Attribution license (http://creativecommons.org/licenses/by/4.0/).