Embed Size (px)
Citation preview

WWF South Africa Living Planet Unit
transformation to a climate-safe future
through people-centered development
Green Infrastructure, environment
and climate change: the opportunity
presentation by Richard Worthington,
Climate Change Programme Manager
drawing on work of various colleagues
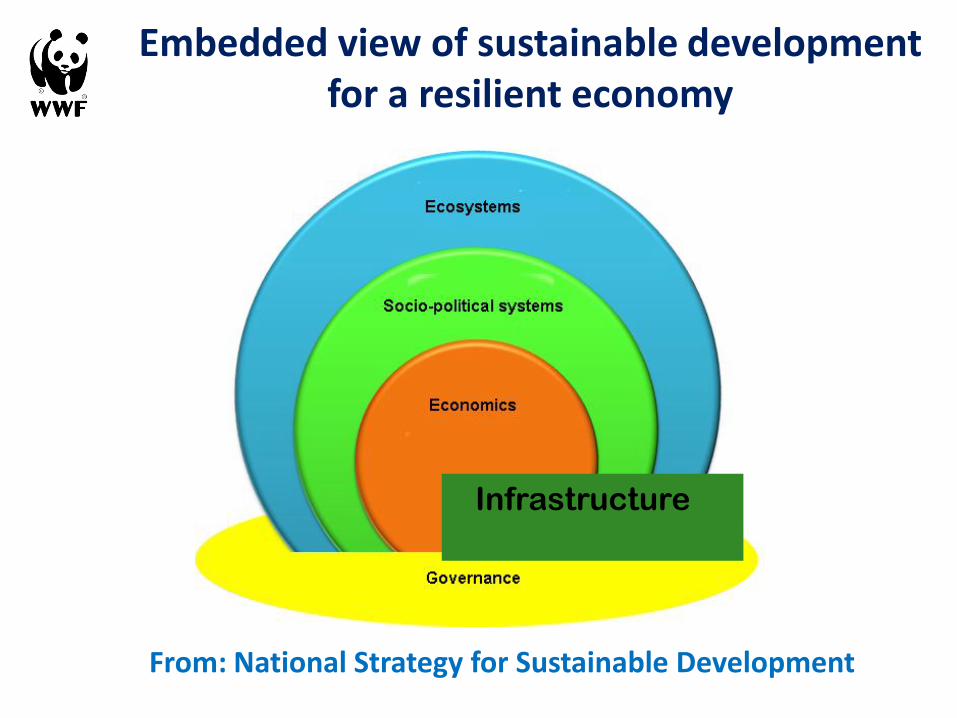
Embedded view of sustainable development for a resilient economy
From: National Strategy for Sustainable Development
Infrastructure

Evidence of an embedded world Global Ecological Footprint
Global Re-Insurance Claims


Some key considerations
• Re-assess assumptions serving extractive industry; globalisation vs localisation;
scale – economic vs resource efficiency
• A global GHG budget (2010-2050) for staying below 2
degree requires to retire about 80% of all known
conventional fossil fuel recoverable reserves by 2050
• Electrification, sp. of rural areas and transport
• Smart Grids (see Business Day 11 October 2011)
• Public finance must leverage private investment

BELOW 2 DEGREES
“…what is required by science, namely to limit
global temperature increase to 2°C ...” (SA Cabinet July 2008)
International Energy Agency (IEA) puts cost of
Copenhagen failure at $500bn a year: 11 November, 2009 (www.carbonfinance-online.com)
450 parts per million (CO2e) for a 50% chance
to keep below the crucial 2°C global threshold.

atmospheric concentration requires net zero
emissions world before end 21st Century
IPCC, 2007

For a global cumulative GHG budget 1990 – 2100,
to stabilise global emissions at 400 ppm CO2e
(roughly 33% probability of overshooting 2°C)
we have already used up 40%
-300
0
300
600
900
1200
1500
1800
1990 -
2008
1990 -
2050
1990 -
2100
2009 -
2100
2009 -
2050
CO2e
LUCF
Total
Cu
mu
lativ
e e
mis
sio
ns in
Gt C
O2e
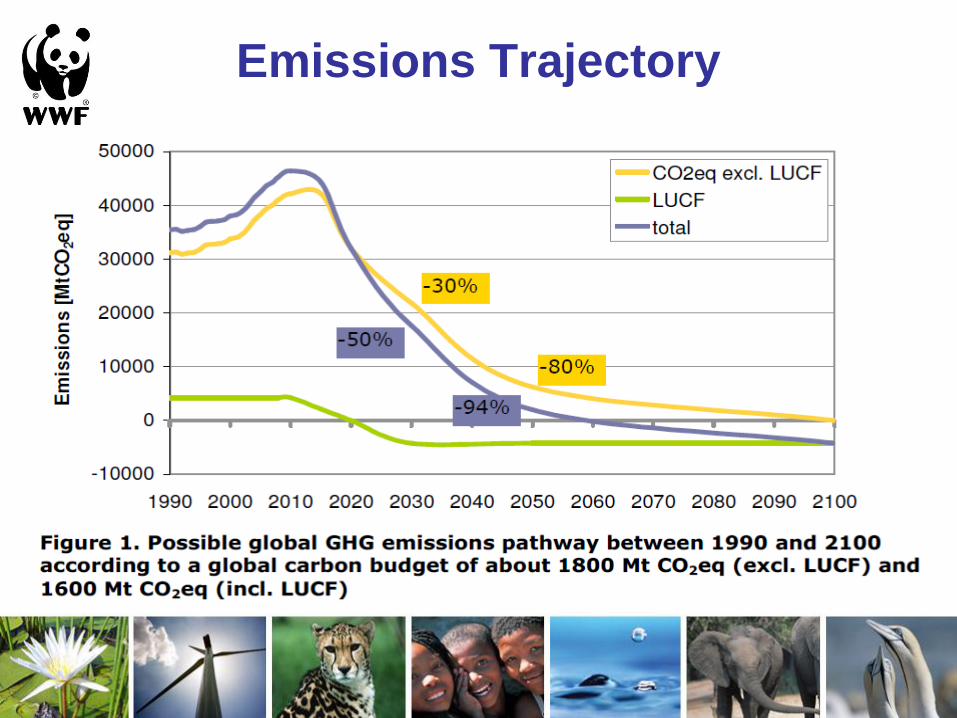
Emissions Trajectory

Global carbon budget requires not burning
a significant proportion of total known
fossil fuel recoverable reserves
0
1000
2000
3000
4000
5000
6000
Oil Gas Coal Total Foss C-BudgetSource: IPCC, 2001
Gt C
O2

The Energy Report 100% Renewable Energy by 2050
A world powered by 100%
renewable, sustainable
energy by mid-century
In all of our hands - policy-
makers, investors, corporate
leaders, communities and
individuals.
Stop fossil fuel pollution;
save money; address
climate change; improve
health; no nuclear risks;
new jobs; innovation;
protect nature
Extensive electrification of
transport; enhanced energy
conservation; smart grids;
sustainable energy for all
Conserving energy & reducing demand; electrification;
equity; investment; land/water/sea-use implications;
governance; lifestyle choices - behaviour changes &
public attitudes; innovation and R&D
A VISION
A SCENARIO
SOLUTIONS
CHALLENGES
BENEFITS
3 February 2011 - 72

Why 100% Renewable Energy?
1. Climate - at least 80% less Greenhouse Gas globally by 2050
2. Conventional oil/gas scarcity - we need “4 times Saudi Arabia and 4 times Russia for 2030”
3. Threats of unconventional fuels - CTL, GTL, deep water oil, shale gas, tar sands - more impacts than
just carbon
4. Nuclear development - What to do with 100,000 tonnes toxic waste for next 10,000 years?
5. Equity - 1.4/2.7 billion people lack access to electricity/safe cooking energy
6. Costs - No-regret technologies, easy to implement, hardly any fuel, avoid
stranded assets and minimised adaptation costs
CTL: Coal To Liquid
GTL: Gas To Liquid
3 February 2011 - 4
The Energy Report

Mobility or mortgage?

Project Partners – Ecofys, OMA
1. Limit demand for energy
through conservation and
efficiencies incl. electrification
2. Use renewable energy
to fill remaining demand
3. Use fossil fuels if necessary, as
efficiently and cleanly as possible
The Scenario The Ecofys Scenario
SOURCE: Ecofys Energy Scenario, 2010
3 February 2011 - 29
The Energy Report

Total Investments and Savings Total global annual cost results for Energy Scenario
The Ecofys Scenario
SOURCE: Ecofys Energy Scenario, 2010
The Energy Report

Upfront Investment High upfront investments needed, Saving money long term
Comparison of cost results with global GDP
NB: Cost savings do NOT include avoided damage costs from climate change, reduced
health costs and other monetary environmental impacts from using fossil fuels
The Ecofys Scenario
SOURCE: Ecofys Energy Scenario, 2010
3 February 2011 - 58
The Energy Report

The Energy
Report
Pathway to a fully
sustainable
global energy
system by 2050
3 February 2011 - 22
The Energy Report


Smart Grid Technologies Lungile Mginqi, Accenture SA Executive Director, Business Day 11 Oct :
• Eskom: improving network reliability a priority
• Infrastructure refurbishment costs over R30 billion
• “…over-all efficiency across the electricity network by better deploying resources and balancing load, and promoting healthier management of equipment across generation, transmission and distribution and customer operations.”
Barriers: lack of appreciation of value of the technologies… when and how to start… [lack of] regulatory incentives and the ability to couple new smart-grid technologies with legacy infrestructure

Working for Energy
as infrastructure intervention • Develop human/governance and skills
development infrastructure
• Decentralised infrastructure to reduce
urbanisation drive and retain value (and cash)
within communities; stimulate SMMEs
• Modularity – learning by doing and developing
local resilience; incl. Multiple mini-grids &
thousands of biogas digestors (scale of people
involved, rather than physical transformations)

Ways forward
• Incorporating externalised costs (Carbon tax)
• Patient capital (climate / ethical bonds; underwriting
- public finance to leverage private & innovative sources)
• Paradigms – Shareholder Satisfaction - Quality vs Quantity
Indicators of success / growth – HDI vs GDP
Circular vs linear – resource management
Demand management vs supply increase
Fundamental shifts, not just incrementalism (elect vs biofuel)


Thank you for your attention
www.panda.org - www.wwf.org.za

• IEA – The Golden Age of Gas Scenario: An increased share of natural gas in the global energy mix will put us on a carbon emissions trajectory reaching 35 Gt in 2035, consistent with stabilising greenhouse gases at around 650 ppm, resulting in a likely global temperature rise of over 3.5°C, well above the widely accepted 2°C target.
• This is because lower prices for natural gas will lead to an increased demand for gas. In this scenario, gas will not only displace coal but also nuclear power and suppress renewable energies.
13 October 2011 - 24
Greenhouse Gas impact

Facts that have yet to permeate public consciousness,
or relevant boardrooms
• There is more than enough renewable energy (RE) for all human needs
• Inefficiency is our core failing and is destroying our life-support systems (Lord Stern: “Climate change is the greatest market failure in human history”)
• We can’t keep growing fossil supply this century • Can’t afford to burn currently available fossil hydro-carbon
reserves (the portion of known resources considered economically viable under recent market conditions)
Stop using fossil hydro-carbons as ‘cheap’ fuel - Energy from burning fossils fuels should not be our point of departure or benchmark
Measurement of development must embrace resource efficiency, externalised costs and real wealth... ≠ GDP growth

Jobs per $1 million invested Industry Direct Indirect Induced TOTAL
Solar 5.4 4.4 3.92 13.72
Biomass 7.4 5.0 4.96 17.36
Smart Grid 4.3 4.6 3.56 12.46
Coal 1.9 3.0 1.96 6.86
Oil and gas 0.8 2.9 1.48 5.18
Nuclear 1.2 1.8 1.2 4.2
Source: Heidi Garrett-Peltier and Robert Pollin,
University of Massachusetts Political Economy and Research Institute.
Note: Multipliers derived using IMPLAN 2.0 with 2007 data. Infrastructure multipliers and assumptions are presented in
"How Infrastructure Investments Support the U.S. Economy: Employment, Productivity and Growth," Political Economy
Research Institute, January 2009,
http://www.peri.umass.edu/236/hash/efc9f7456a/publication/333/
Context