Embed Size (px)
Citation preview
LIVING BELOW THE LINE: ECONOMIC INSECURITY AMONG IOWA’S ELDERS
Jessica Horning Shawn McMahon
Fall 2015
Wider Opportunities for Women (WOW) has promoted empowerment,
equity and economic security across the lifespan since 1964. Through
advocacy, research, training and technical assistance, WOW advances equal
education and employment opportunities, non-traditional occupations for
women, economic empowerment and secure retirement.
WOW’s economic security projects work in Washington, DC and with
partners across the country to improve the lives of workers, families and
seniors. WOW’s Elder Economic Security Initiative improves policy and
programs by defining security and advocating for policies that help seniors
avoid poverty and the shadow of poverty. The Initiative is supported by the
Elder Economic Security Standard™ Index (Elder Index), an innovative
measure of the income that older adults need to meet their basic needs and
age in place with dignity.
The Iowa Alliance for Retired Americans is a statewide grassroots advocacy
organization representing more than 38,000 individuals across the
state. The mission of the Iowa ARA is to create a statewide network of
organizations in order to educate and inform the membership, the public,
and elected officials about issues that affect the well-being of retirees and
senior citizens, so that they may all work towards advancing and achieving
just and equitable living conditions for retirees and senior citizens within
the state and the nation. Its purpose is threefold; to educate, motivate, and
activate.
© Copyright Wider Opportunities for Women, 2015.
The Elder Economic Security StandardTM Index is calculated by the Gerontology Institute at the University of
Massachusetts Boston.
WOW’s Elder Initiative and Living Below the Line are funded by The Retirement Research
Foundation of Chicago.
2
owa elders face an array of economic security challenges—rising food, health care
and housing costs, long-term care needs, a soft labor market and others. To better
capture and understand the challenges faced by Iowa’s seniors, their families, and state
and local governments, WOW has calculated Elder Economic Insecurity Rates (EEIRs)—the
proportion of retired seniors whose incomes fall short of the Elder Economic Security
StandardTM Index (Elder Index), a senior-specific basic needs budget.
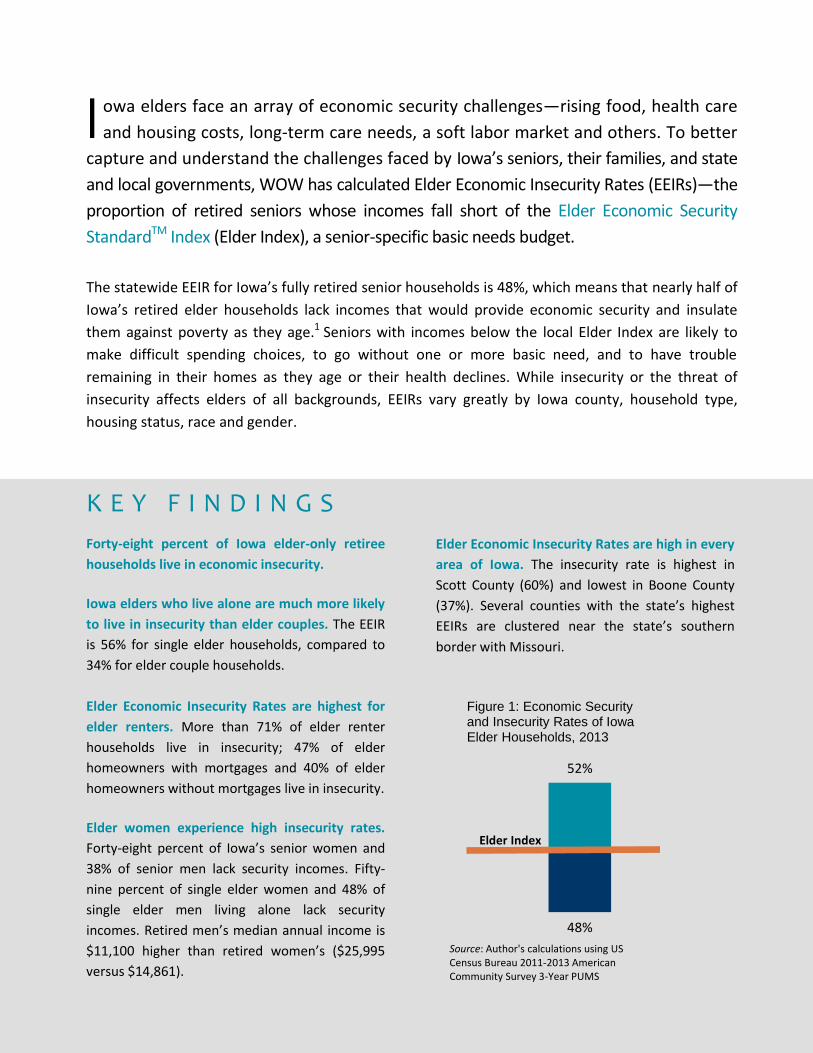
The statewide EEIR for Iowa’s fully retired senior households is 48%, which means that nearly half of
Iowa’s retired elder households lack incomes that would provide economic security and insulate
them against poverty as they age.1 Seniors with incomes below the local Elder Index are likely to
make difficult spending choices, to go without one or more basic need, and to have trouble
remaining in their homes as they age or their health declines. While insecurity or the threat of
insecurity affects elders of all backgrounds, EEIRs vary greatly by Iowa county, household type,
housing status, race and gender.
K E Y F I N D I N G S
Forty-eight percent of Iowa elder-only retiree
households live in economic insecurity.
Iowa elders who live alone are much more likely
to live in insecurity than elder couples. The EEIR
is 56% for single elder households, compared to
34% for elder couple households.
Elder Economic Insecurity Rates are highest for
elder renters. More than 71% of elder renter
households live in insecurity; 47% of elder
homeowners with mortgages and 40% of elder
homeowners without mortgages live in insecurity.
Elder women experience high insecurity rates.
Forty-eight percent of Iowa’s senior women and
38% of senior men lack security incomes. Fifty-
nine percent of single elder women and 48% of
single elder men living alone lack security
incomes. Retired men’s median annual income is
$11,100 higher than retired women’s ($25,995
versus $14,861).
Elder Economic Insecurity Rates are high in every
area of Iowa. The insecurity rate is highest in
Scott County (60%) and lowest in Boone County
(37%). Several counties with the state’s highest
EEIRs are clustered near the state’s southern
border with Missouri.
I
52%
48%
Figure 1: Economic Security and Insecurity Rates of Iowa Elder Households, 2013
Elder Index
Source: Author's calculations using US Census Bureau 2011-2013 American Community Survey 3-Year PUMS
3
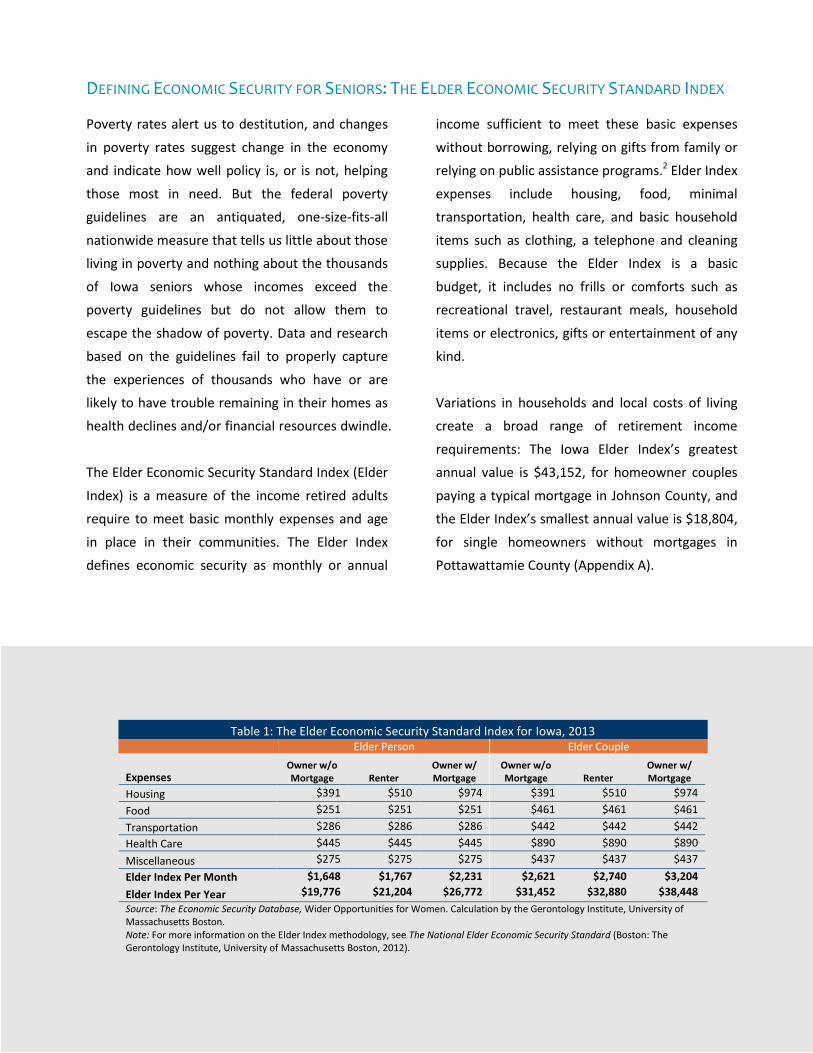
DEFINING ECONOMIC SECURITY FOR SENIORS: THE ELDER ECONOMIC SECURITY STANDARD INDEX
Poverty rates alert us to destitution, and changes
in poverty rates suggest change in the economy
and indicate how well policy is, or is not, helping
those most in need. But the federal poverty
guidelines are an antiquated, one-size-fits-all
nationwide measure that tells us little about those
living in poverty and nothing about the thousands
of Iowa seniors whose incomes exceed the
poverty guidelines but do not allow them to
escape the shadow of poverty. Data and research
based on the guidelines fail to properly capture
the experiences of thousands who have or are
likely to have trouble remaining in their homes as
health declines and/or financial resources dwindle.
The Elder Economic Security Standard Index (Elder
Index) is a measure of the income retired adults
require to meet basic monthly expenses and age
in place in their communities. The Elder Index
defines economic security as monthly or annual
income sufficient to meet these basic expenses
without borrowing, relying on gifts from family or
relying on public assistance programs.2 Elder Index
expenses include housing, food, minimal
transportation, health care, and basic household
items such as clothing, a telephone and cleaning
supplies. Because the Elder Index is a basic
budget, it includes no frills or comforts such as
recreational travel, restaurant meals, household
items or electronics, gifts or entertainment of any
kind.
Variations in households and local costs of living
create a broad range of retirement income
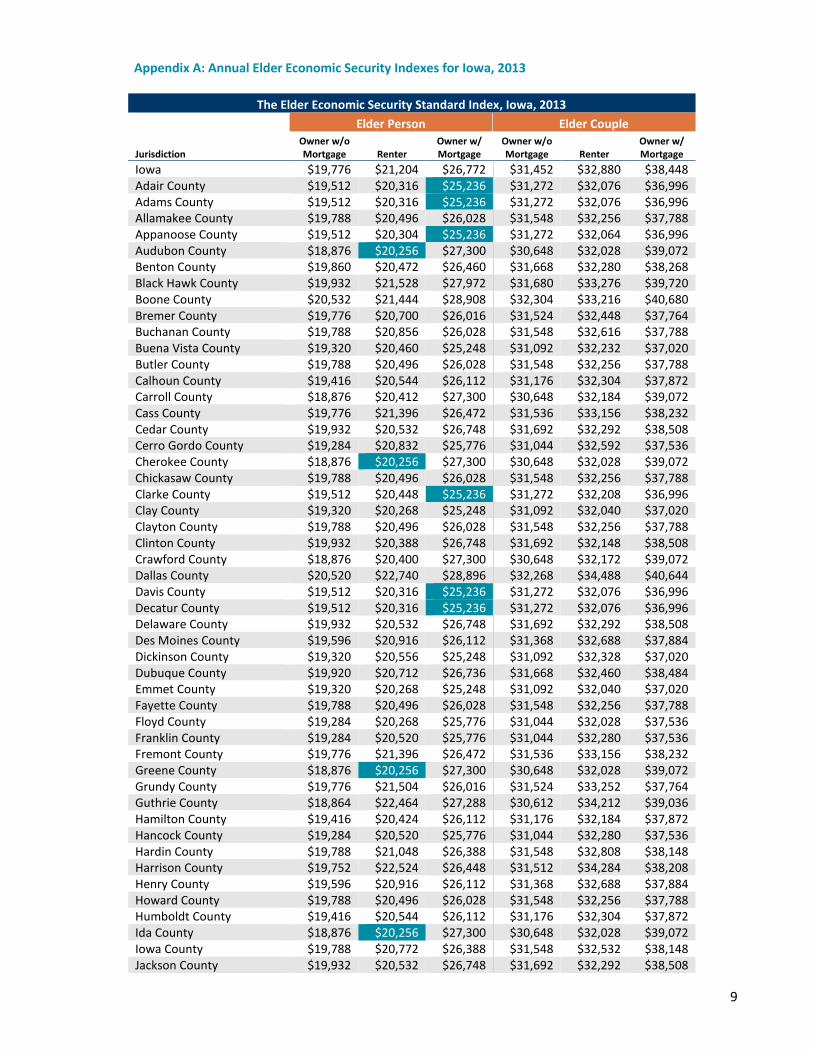
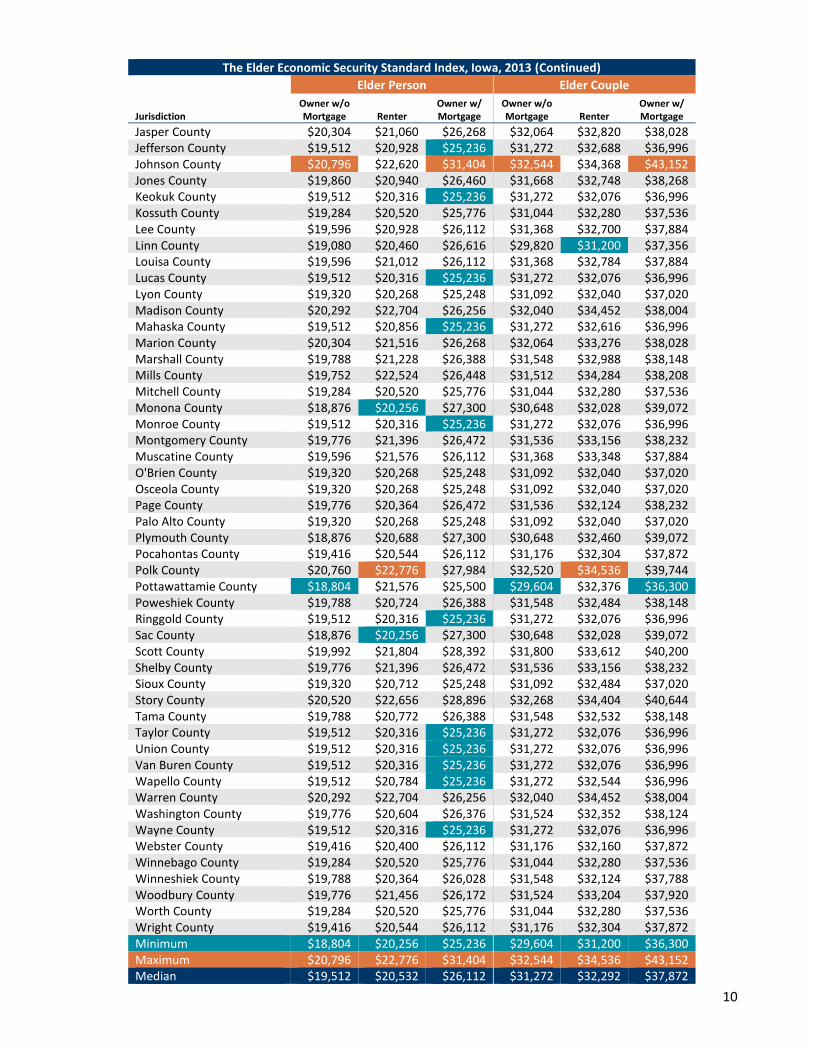
requirements: The Iowa Elder Index’s greatest
annual value is $43,152, for homeowner couples
paying a typical mortgage in Johnson County, and
the Elder Index’s smallest annual value is $18,804,
for single homeowners without mortgages in
Pottawattamie County (Appendix A).
Table 1: The Elder Economic Security Standard Index for Iowa, 2013 Elder Person Elder Couple
Expenses Owner w/o Mortgage Renter
Owner w/ Mortgage
Owner w/o Mortgage Renter
Owner w/ Mortgage
Housing $391 $510 $974 $391 $510 $974
Food $251 $251 $251 $461 $461 $461
Transportation $286 $286 $286 $442 $442 $442
Health Care $445 $445 $445 $890 $890 $890
Miscellaneous $275 $275 $275 $437 $437 $437
Elder Index Per Month $1,648 $1,767 $2,231 $2,621 $2,740 $3,204
Elder Index Per Year $19,776 $21,204 $26,772 $31,452 $32,880 $38,448
Source: The Economic Security Database, Wider Opportunities for Women. Calculation by the Gerontology Institute, University of Massachusetts Boston. Note: For more information on the Elder Index methodology, see The National Elder Economic Security Standard (Boston: The Gerontology Institute, University of Massachusetts Boston, 2012).
4
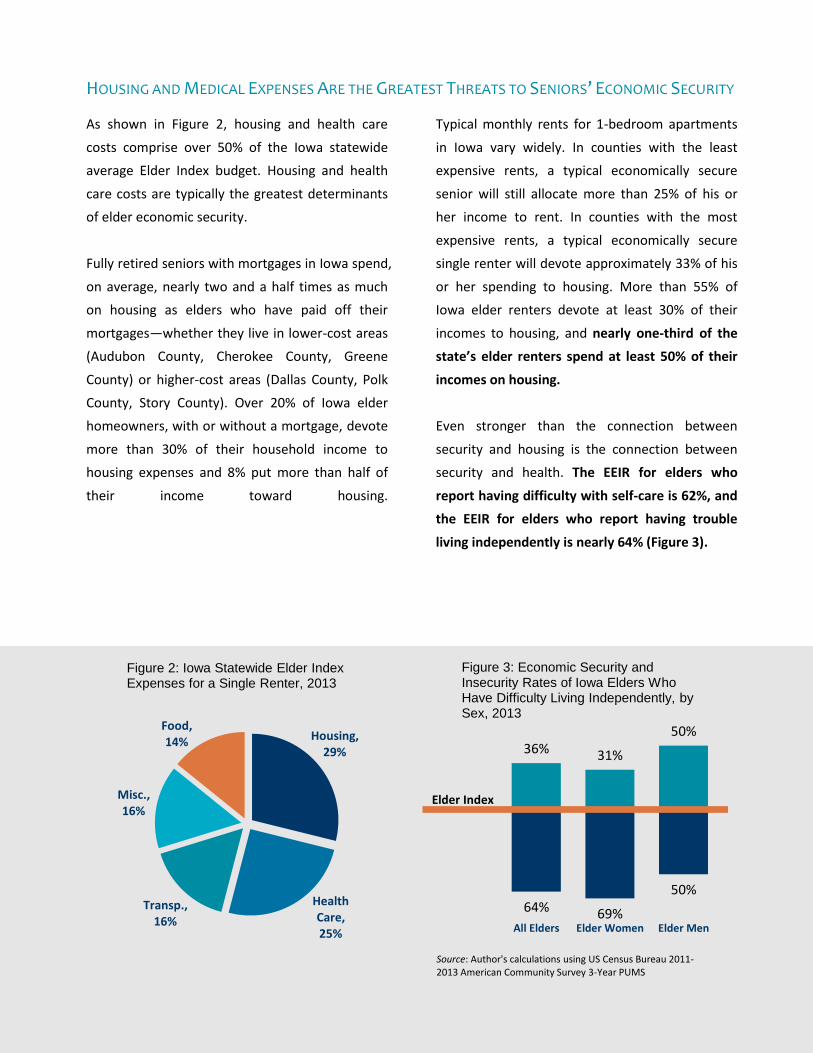
HOUSING AND MEDICAL EXPENSES ARE THE GREATEST THREATS TO SENIORS’ ECONOMIC SECURITY
As shown in Figure 2, housing and health care
costs comprise over 50% of the Iowa statewide
average Elder Index budget. Housing and health
care costs are typically the greatest determinants
of elder economic security.
Fully retired seniors with mortgages in Iowa spend,
on average, nearly two and a half times as much
on housing as elders who have paid off their
mortgages—whether they live in lower-cost areas
(Audubon County, Cherokee County, Greene
County) or higher-cost areas (Dallas County, Polk
County, Story County). Over 20% of Iowa elder
homeowners, with or without a mortgage, devote
more than 30% of their household income to
housing expenses and 8% put more than half of
their income toward housing.
Typical monthly rents for 1-bedroom apartments
in Iowa vary widely. In counties with the least
expensive rents, a typical economically secure
senior will still allocate more than 25% of his or
her income to rent. In counties with the most
expensive rents, a typical economically secure
single renter will devote approximately 33% of his
or her spending to housing. More than 55% of
Iowa elder renters devote at least 30% of their
incomes to housing, and nearly one-third of the
state’s elder renters spend at least 50% of their
incomes on housing.
Even stronger than the connection between
security and housing is the connection between
security and health. The EEIR for elders who
report having difficulty with self-care is 62%, and
the EEIR for elders who report having trouble
living independently is nearly 64% (Figure 3).
Housing, 29%
Health Care, 25%
Transp., 16%
Misc., 16%
Food, 14%
Figure 2: Iowa Statewide Elder Index Expenses for a Single Renter, 2013
36% 31%
50%
64% 69%
50%
All Elders Elder Women Elder Men
Figure 3: Economic Security and Insecurity Rates of Iowa Elders Who Have Difficulty Living Independently, by Sex, 2013
Elder Index
Source: Author's calculations using US Census Bureau 2011-2013 American Community Survey 3-Year PUMS
5
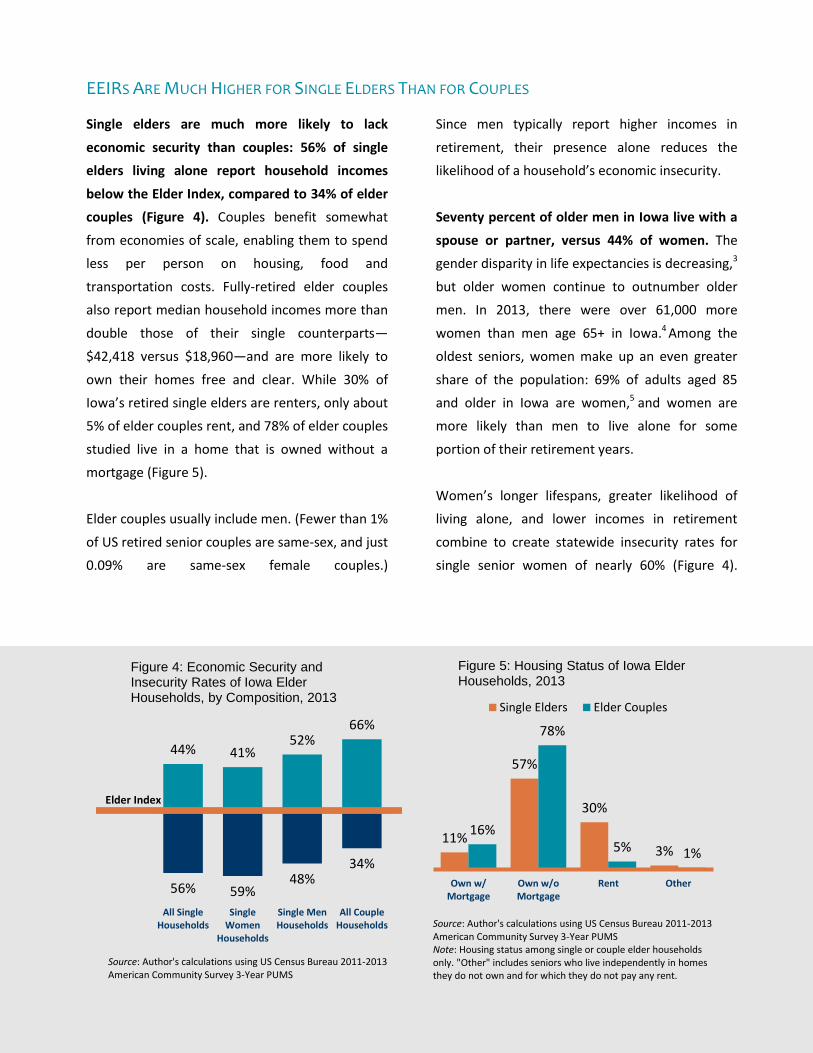
EEIRS ARE MUCH HIGHER FOR SINGLE ELDERS THAN FOR COUPLES
Single elders are much more likely to lack
economic security than couples: 56% of single
elders living alone report household incomes
below the Elder Index, compared to 34% of elder
couples (Figure 4). Couples benefit somewhat
from economies of scale, enabling them to spend
less per person on housing, food and
transportation costs. Fully-retired elder couples
also report median household incomes more than
double those of their single counterparts—
$42,418 versus $18,960—and are more likely to
own their homes free and clear. While 30% of
Iowa’s retired single elders are renters, only about
5% of elder couples rent, and 78% of elder couples
studied live in a home that is owned without a
mortgage (Figure 5).
Elder couples usually include men. (Fewer than 1%
of US retired senior couples are same-sex, and just
0.09% are same-sex female couples.)
Since men typically report higher incomes in
retirement, their presence alone reduces the
likelihood of a household’s economic insecurity.
Seventy percent of older men in Iowa live with a
spouse or partner, versus 44% of women. The
gender disparity in life expectancies is decreasing,3
but older women continue to outnumber older
men. In 2013, there were over 61,000 more
women than men age 65+ in Iowa.4 Among the
oldest seniors, women make up an even greater
share of the population: 69% of adults aged 85
and older in Iowa are women,5 and women are
more likely than men to live alone for some
portion of their retirement years.
Women’s longer lifespans, greater likelihood of
living alone, and lower incomes in retirement
combine to create statewide insecurity rates for
single senior women of nearly 60% (Figure 4).
11%
57%
30%
3%
16%
78%
5% 1%
Own w/Mortgage
Own w/oMortgage
Rent Other
Figure 5: Housing Status of Iowa Elder Households, 2013
Single Elders Elder Couples
Source: Author's calculations using US Census Bureau 2011-2013 American Community Survey 3-Year PUMS Note: Housing status among single or couple elder households only. "Other" includes seniors who live independently in homes they do not own and for which they do not pay any rent.
44% 41% 52%
66%
56% 59% 48%
34%
All SingleHouseholds
SingleWomen
Households
Single MenHouseholds
All CoupleHouseholds
Figure 4: Economic Security and Insecurity Rates of Iowa Elder Households, by Composition, 2013
Elder Index
Source: Author's calculations using US Census Bureau 2011-2013 American Community Survey 3-Year PUMS
2
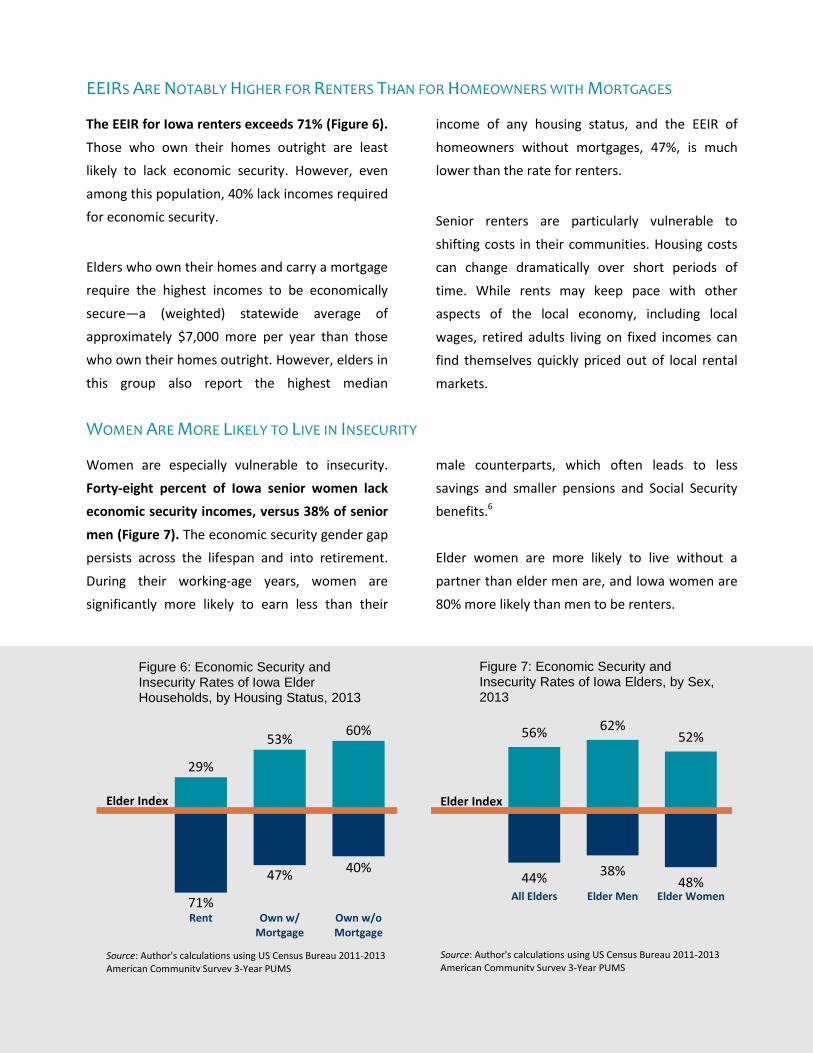
EEIRS ARE NOTABLY HIGHER FOR RENTERS THAN FOR HOMEOWNERS WITH MORTGAGES
The EEIR for Iowa renters exceeds 71% (Figure 6).
Those who own their homes outright are least
likely to lack economic security. However, even
among this population, 40% lack incomes required
for economic security.
Elders who own their homes and carry a mortgage
require the highest incomes to be economically
secure—a (weighted) statewide average of
approximately $7,000 more per year than those
who own their homes outright. However, elders in
this group also report the highest median
income of any housing status, and the EEIR of
homeowners without mortgages, 47%, is much
lower than the rate for renters.
Senior renters are particularly vulnerable to
shifting costs in their communities. Housing costs
can change dramatically over short periods of
time. While rents may keep pace with other
aspects of the local economy, including local
wages, retired adults living on fixed incomes can
find themselves quickly priced out of local rental
markets.
WOMEN ARE MORE LIKELY TO LIVE IN INSECURITY
Women are especially vulnerable to insecurity.
Forty-eight percent of Iowa senior women lack
economic security incomes, versus 38% of senior
men (Figure 7). The economic security gender gap
persists across the lifespan and into retirement.
During their working-age years, women are
significantly more likely to earn less than their
male counterparts, which often leads to less
savings and smaller pensions and Social Security
benefits.6
Elder women are more likely to live without a
partner than elder men are, and Iowa women are
80% more likely than men to be renters.
56% 62% 52%
44% 38% 48%
All Elders Elder Men Elder Women
Figure 7: Economic Security and Insecurity Rates of Iowa Elders, by Sex, 2013
Elder Index
Source: Author's calculations using US Census Bureau 2011-2013 American Community Survey 3-Year PUMS
29%
53% 60%
71%
47% 40%
Rent Own w/Mortgage
Own w/oMortgage
Figure 6: Economic Security and Insecurity Rates of Iowa Elder Households, by Housing Status, 2013
Elder Index
Source: Author's calculations using US Census Bureau 2011-2013 American Community Survey 3-Year PUMS
6
THE EFFECTS OF OCCUPATIONAL SEGREGATION DURING
WOMEN’S WORKING YEARS PERVADE RETIREMENT
Retired elder men studied report typical annual
income nearly 75% higher than typical retired
elder women’s income (median incomes of
$25,995 and $14,861, respectively). A substantial
gender income gap among older adults is not
surprising, as retirement incomes reflect gender
pay inequities and experiences during working
years. Occupational segregation, pay inequity and
caregiving responsibilities all contribute to
women’s reduced earnings during their working-
age years and to diminished capacity for saving.
Further, these factors contribute to both a
reduced likelihood of retirement or pension
income and lower Social Security payments in
retirement.
Just 32% of Iowa women studied report any
amount of income from a retirement plan or
pension, compared to 47% of elder men. Among
men and women who do report such income,
men’s median incomes exceed women’s median
incomes by more than $5,000 per year.
The gender disparity in retirement income means
women are more reliant on Social Security. In
Iowa, among those living in elder-only households,
Social Security payments constitute 61% of older
men’s average total income, compared to 71% of
women’s average total income. 7 Even though
older women rely on Social Security for the bulk of
their incomes, they typically receive smaller
payments: Median women’s payments lag behind
men’s by more than $4,500 per year.
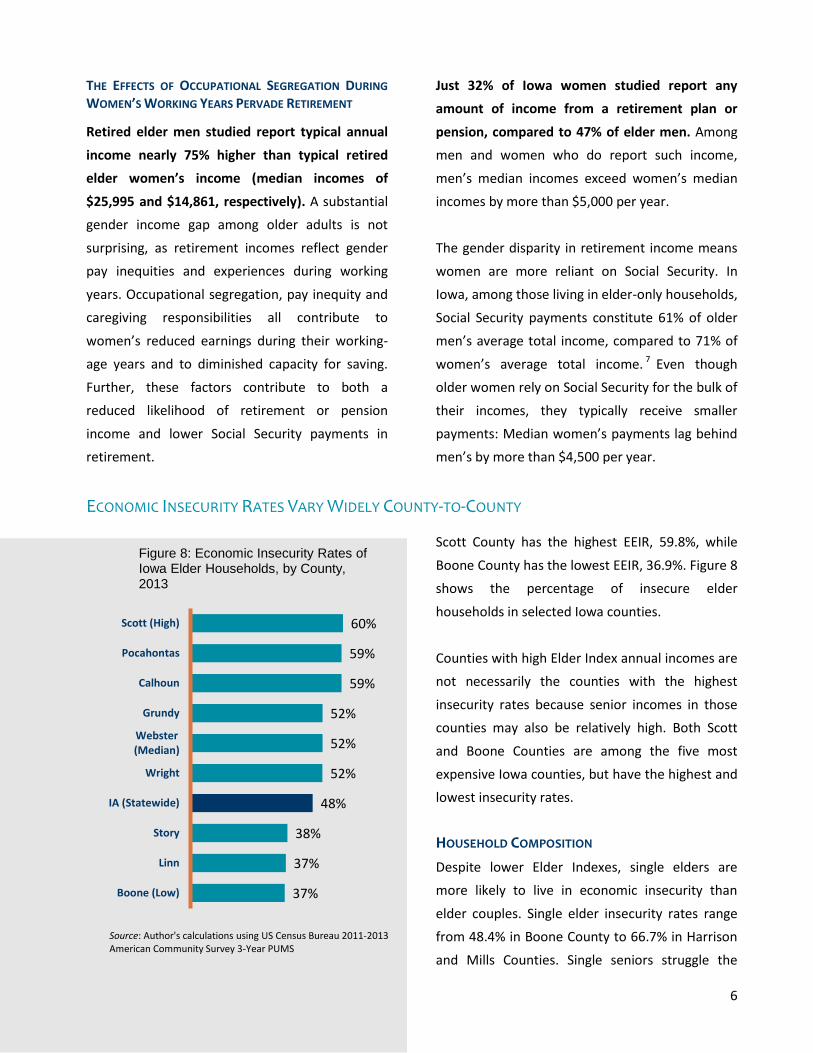
ECONOMIC INSECURITY RATES VARY WIDELY COUNTY-TO-COUNTY
Scott County has the highest EEIR, 59.8%, while
Boone County has the lowest EEIR, 36.9%. Figure 8
shows the percentage of insecure elder
households in selected Iowa counties.
Counties with high Elder Index annual incomes are
not necessarily the counties with the highest
insecurity rates because senior incomes in those
counties may also be relatively high. Both Scott
and Boone Counties are among the five most
expensive Iowa counties, but have the highest and
lowest insecurity rates.
HOUSEHOLD COMPOSITION
Despite lower Elder Indexes, single elders are
more likely to live in economic insecurity than
elder couples. Single elder insecurity rates range
from 48.4% in Boone County to 66.7% in Harrison
and Mills Counties. Single seniors struggle the
37%
37%
38%
48%
52%
52%
52%
59%
59%
60%
Boone (Low)
Linn
Story
IA (Statewide)
Wright
Webster(Median)
Grundy
Calhoun
Pocahontas
Scott (High)
Figure 8: Economic Insecurity Rates of Iowa Elder Households, by County, 2013
Source: Author's calculations using US Census Bureau 2011-2013 American Community Survey 3-Year PUMS
7
most in Harrison County (67%), Mills County (67%)
and Cass County (66%).
In contrast, the rate of insecurity for elder couples
ranges from a low of 16.1% in Scott County to a
high of 52.9% in Washington County. Elder
couples are the most insecure in Washington
County (53%), Calhoun County (50%) and
Pocahontas County (50%).
Women are more likely than men to be
economically insecure in 90% of the counties in
Iowa. Only in Washington County and several
counties in the state’s northwest corner are men’s
EEIRs (1-2 percentage points) higher than
women’s. Scott County has the widest disparity
between the insecurity rates of women (43%) and
men (23%), at 20 percentage points. Lyon County
has the smallest disparity, at 0.9 percentage
points and women’s insecurity rate (46%) is
slightly lower than the men’s rate (47%). Women
are at the highest risk of insecurity in Calhoun
County (61%), Pocahontas County (61%) and
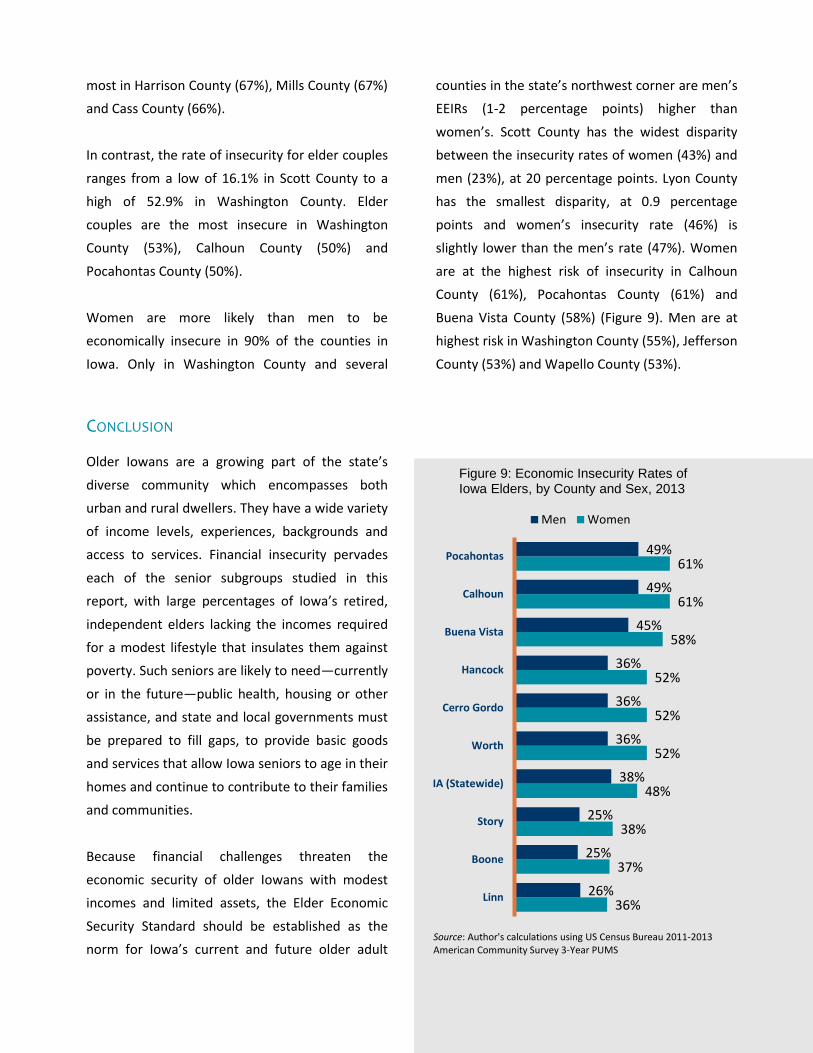
Buena Vista County (58%) (Figure 9). Men are at
highest risk in Washington County (55%), Jefferson
County (53%) and Wapello County (53%).
CONCLUSION
Older Iowans are a growing part of the state’s
diverse community which encompasses both
urban and rural dwellers. They have a wide variety
of income levels, experiences, backgrounds and
access to services. Financial insecurity pervades
each of the senior subgroups studied in this
report, with large percentages of Iowa’s retired,
independent elders lacking the incomes required
for a modest lifestyle that insulates them against
poverty. Such seniors are likely to need—currently
or in the future—public health, housing or other
assistance, and state and local governments must
be prepared to fill gaps, to provide basic goods
and services that allow Iowa seniors to age in their
homes and continue to contribute to their families
and communities.
Because financial challenges threaten the
economic security of older Iowans with modest
incomes and limited assets, the Elder Economic
Security Standard should be established as the
norm for Iowa’s current and future older adult
36%
37%
38%
48%
52%
52%
52%
58%
61%
61%
26%
25%
25%
38%
36%
36%
36%
45%
49%
49%
Linn
Boone
Story
IA (Statewide)
Worth
Cerro Gordo
Hancock
Buena Vista
Calhoun
Pocahontas
Figure 9: Economic Insecurity Rates of Iowa Elders, by County and Sex, 2013
Men Women
Source: Author's calculations using US Census Bureau 2011-2013 American Community Survey 3-Year PUMS
8
populations. Accomplishing this will require
recognition that older adults are vital to Iowa’s
communities, and that their contributions to
Iowa’s culture and economy are incalculable.
Further, this recognition should be reflected in the
programs and services provided at state and local
levels to ensure older Iowans’ economic security.
9
Appendix A: Annual Elder Economic Security Indexes for Iowa, 2013
The Elder Economic Security Standard Index, Iowa, 2013
Elder Person Elder Couple
Jurisdiction Owner w/o Mortgage Renter
Owner w/ Mortgage
Owner w/o Mortgage Renter
Owner w/ Mortgage
Iowa $19,776 $21,204 $26,772 $31,452 $32,880 $38,448 Adair County $19,512 $20,316 $25,236 $31,272 $32,076 $36,996 Adams County $19,512 $20,316 $25,236 $31,272 $32,076 $36,996 Allamakee County $19,788 $20,496 $26,028 $31,548 $32,256 $37,788 Appanoose County $19,512 $20,304 $25,236 $31,272 $32,064 $36,996 Audubon County $18,876 $20,256 $27,300 $30,648 $32,028 $39,072 Benton County $19,860 $20,472 $26,460 $31,668 $32,280 $38,268 Black Hawk County $19,932 $21,528 $27,972 $31,680 $33,276 $39,720 Boone County $20,532 $21,444 $28,908 $32,304 $33,216 $40,680 Bremer County $19,776 $20,700 $26,016 $31,524 $32,448 $37,764 Buchanan County $19,788 $20,856 $26,028 $31,548 $32,616 $37,788 Buena Vista County $19,320 $20,460 $25,248 $31,092 $32,232 $37,020 Butler County $19,788 $20,496 $26,028 $31,548 $32,256 $37,788 Calhoun County $19,416 $20,544 $26,112 $31,176 $32,304 $37,872 Carroll County $18,876 $20,412 $27,300 $30,648 $32,184 $39,072 Cass County $19,776 $21,396 $26,472 $31,536 $33,156 $38,232 Cedar County $19,932 $20,532 $26,748 $31,692 $32,292 $38,508 Cerro Gordo County $19,284 $20,832 $25,776 $31,044 $32,592 $37,536 Cherokee County $18,876 $20,256 $27,300 $30,648 $32,028 $39,072 Chickasaw County $19,788 $20,496 $26,028 $31,548 $32,256 $37,788 Clarke County $19,512 $20,448 $25,236 $31,272 $32,208 $36,996 Clay County $19,320 $20,268 $25,248 $31,092 $32,040 $37,020 Clayton County $19,788 $20,496 $26,028 $31,548 $32,256 $37,788 Clinton County $19,932 $20,388 $26,748 $31,692 $32,148 $38,508 Crawford County $18,876 $20,400 $27,300 $30,648 $32,172 $39,072 Dallas County $20,520 $22,740 $28,896 $32,268 $34,488 $40,644 Davis County $19,512 $20,316 $25,236 $31,272 $32,076 $36,996 Decatur County $19,512 $20,316 $25,236 $31,272 $32,076 $36,996 Delaware County $19,932 $20,532 $26,748 $31,692 $32,292 $38,508 Des Moines County $19,596 $20,916 $26,112 $31,368 $32,688 $37,884 Dickinson County $19,320 $20,556 $25,248 $31,092 $32,328 $37,020 Dubuque County $19,920 $20,712 $26,736 $31,668 $32,460 $38,484 Emmet County $19,320 $20,268 $25,248 $31,092 $32,040 $37,020 Fayette County $19,788 $20,496 $26,028 $31,548 $32,256 $37,788 Floyd County $19,284 $20,268 $25,776 $31,044 $32,028 $37,536 Franklin County $19,284 $20,520 $25,776 $31,044 $32,280 $37,536 Fremont County $19,776 $21,396 $26,472 $31,536 $33,156 $38,232 Greene County $18,876 $20,256 $27,300 $30,648 $32,028 $39,072 Grundy County $19,776 $21,504 $26,016 $31,524 $33,252 $37,764 Guthrie County $18,864 $22,464 $27,288 $30,612 $34,212 $39,036 Hamilton County $19,416 $20,424 $26,112 $31,176 $32,184 $37,872 Hancock County $19,284 $20,520 $25,776 $31,044 $32,280 $37,536 Hardin County $19,788 $21,048 $26,388 $31,548 $32,808 $38,148 Harrison County $19,752 $22,524 $26,448 $31,512 $34,284 $38,208 Henry County $19,596 $20,916 $26,112 $31,368 $32,688 $37,884 Howard County $19,788 $20,496 $26,028 $31,548 $32,256 $37,788 Humboldt County $19,416 $20,544 $26,112 $31,176 $32,304 $37,872 Ida County $18,876 $20,256 $27,300 $30,648 $32,028 $39,072 Iowa County $19,788 $20,772 $26,388 $31,548 $32,532 $38,148 Jackson County $19,932 $20,532 $26,748 $31,692 $32,292 $38,508
10
The Elder Economic Security Standard Index, Iowa, 2013 (Continued)
Elder Person Elder Couple
Jurisdiction Owner w/o Mortgage Renter
Owner w/ Mortgage
Owner w/o Mortgage Renter
Owner w/ Mortgage
Jasper County $20,304 $21,060 $26,268 $32,064 $32,820 $38,028 Jefferson County $19,512 $20,928 $25,236 $31,272 $32,688 $36,996 Johnson County $20,796 $22,620 $31,404 $32,544 $34,368 $43,152 Jones County $19,860 $20,940 $26,460 $31,668 $32,748 $38,268 Keokuk County $19,512 $20,316 $25,236 $31,272 $32,076 $36,996 Kossuth County $19,284 $20,520 $25,776 $31,044 $32,280 $37,536 Lee County $19,596 $20,928 $26,112 $31,368 $32,700 $37,884 Linn County $19,080 $20,460 $26,616 $29,820 $31,200 $37,356 Louisa County $19,596 $21,012 $26,112 $31,368 $32,784 $37,884 Lucas County $19,512 $20,316 $25,236 $31,272 $32,076 $36,996 Lyon County $19,320 $20,268 $25,248 $31,092 $32,040 $37,020 Madison County $20,292 $22,704 $26,256 $32,040 $34,452 $38,004 Mahaska County $19,512 $20,856 $25,236 $31,272 $32,616 $36,996 Marion County $20,304 $21,516 $26,268 $32,064 $33,276 $38,028 Marshall County $19,788 $21,228 $26,388 $31,548 $32,988 $38,148 Mills County $19,752 $22,524 $26,448 $31,512 $34,284 $38,208 Mitchell County $19,284 $20,520 $25,776 $31,044 $32,280 $37,536 Monona County $18,876 $20,256 $27,300 $30,648 $32,028 $39,072 Monroe County $19,512 $20,316 $25,236 $31,272 $32,076 $36,996 Montgomery County $19,776 $21,396 $26,472 $31,536 $33,156 $38,232 Muscatine County $19,596 $21,576 $26,112 $31,368 $33,348 $37,884 O'Brien County $19,320 $20,268 $25,248 $31,092 $32,040 $37,020 Osceola County $19,320 $20,268 $25,248 $31,092 $32,040 $37,020 Page County $19,776 $20,364 $26,472 $31,536 $32,124 $38,232 Palo Alto County $19,320 $20,268 $25,248 $31,092 $32,040 $37,020 Plymouth County $18,876 $20,688 $27,300 $30,648 $32,460 $39,072 Pocahontas County $19,416 $20,544 $26,112 $31,176 $32,304 $37,872 Polk County $20,760 $22,776 $27,984 $32,520 $34,536 $39,744 Pottawattamie County $18,804 $21,576 $25,500 $29,604 $32,376 $36,300 Poweshiek County $19,788 $20,724 $26,388 $31,548 $32,484 $38,148 Ringgold County $19,512 $20,316 $25,236 $31,272 $32,076 $36,996 Sac County $18,876 $20,256 $27,300 $30,648 $32,028 $39,072 Scott County $19,992 $21,804 $28,392 $31,800 $33,612 $40,200 Shelby County $19,776 $21,396 $26,472 $31,536 $33,156 $38,232 Sioux County $19,320 $20,712 $25,248 $31,092 $32,484 $37,020 Story County $20,520 $22,656 $28,896 $32,268 $34,404 $40,644 Tama County $19,788 $20,772 $26,388 $31,548 $32,532 $38,148 Taylor County $19,512 $20,316 $25,236 $31,272 $32,076 $36,996 Union County $19,512 $20,316 $25,236 $31,272 $32,076 $36,996 Van Buren County $19,512 $20,316 $25,236 $31,272 $32,076 $36,996 Wapello County $19,512 $20,784 $25,236 $31,272 $32,544 $36,996 Warren County $20,292 $22,704 $26,256 $32,040 $34,452 $38,004 Washington County $19,776 $20,604 $26,376 $31,524 $32,352 $38,124 Wayne County $19,512 $20,316 $25,236 $31,272 $32,076 $36,996 Webster County $19,416 $20,400 $26,112 $31,176 $32,160 $37,872 Winnebago County $19,284 $20,520 $25,776 $31,044 $32,280 $37,536 Winneshiek County $19,788 $20,364 $26,028 $31,548 $32,124 $37,788 Woodbury County $19,776 $21,456 $26,172 $31,524 $33,204 $37,920 Worth County $19,284 $20,520 $25,776 $31,044 $32,280 $37,536 Wright County $19,416 $20,544 $26,112 $31,176 $32,304 $37,872 Minimum $18,804 $20,256 $25,236 $29,604 $31,200 $36,300 Maximum $20,796 $22,776 $31,404 $32,544 $34,536 $43,152 Median $19,512 $20,532 $26,112 $31,272 $32,292 $37,872
11
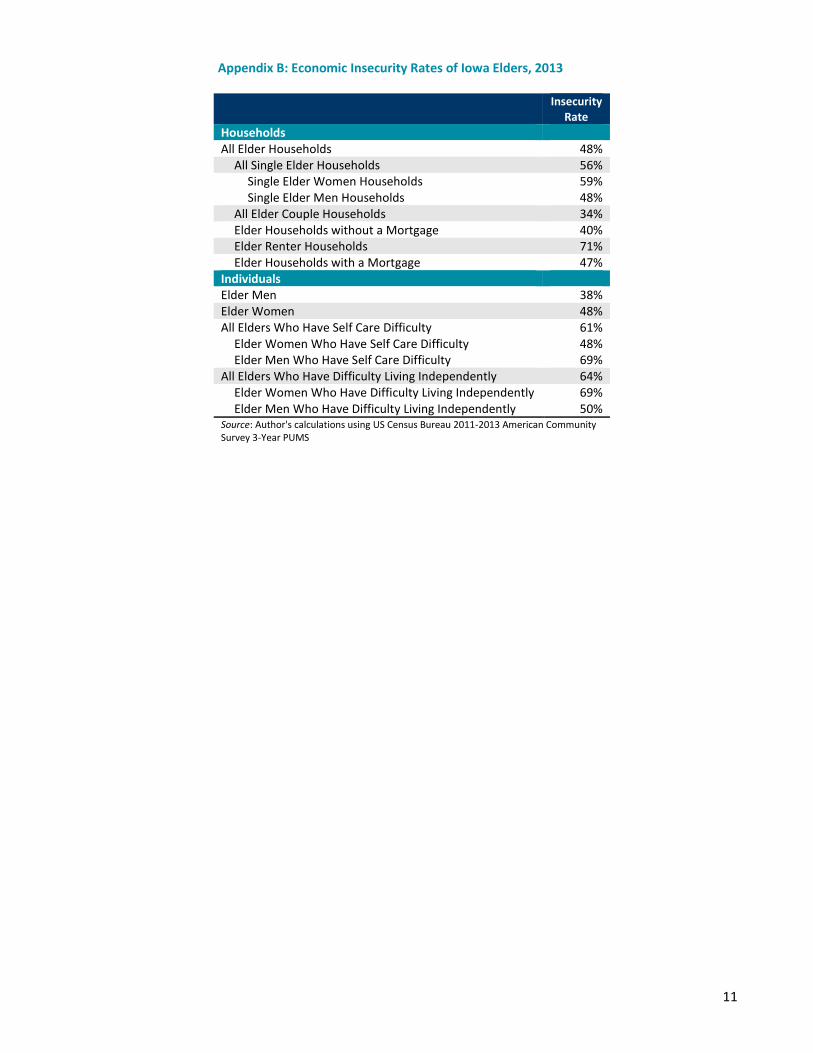
Appendix B: Economic Insecurity Rates of Iowa Elders, 2013
Insecurity Rate
Households All Elder Households 48%
All Single Elder Households 56% Single Elder Women Households 59% Single Elder Men Households 48%
All Elder Couple Households 34% Elder Households without a Mortgage 40% Elder Renter Households 71% Elder Households with a Mortgage 47%
Individuals Elder Men 38% Elder Women 48% All Elders Who Have Self Care Difficulty 61%
Elder Women Who Have Self Care Difficulty 48% Elder Men Who Have Self Care Difficulty 69%
All Elders Who Have Difficulty Living Independently 64% Elder Women Who Have Difficulty Living Independently 69% Elder Men Who Have Difficulty Living Independently 50%
Source: Author's calculations using US Census Bureau 2011-2013 American Community Survey 3-Year PUMS
12
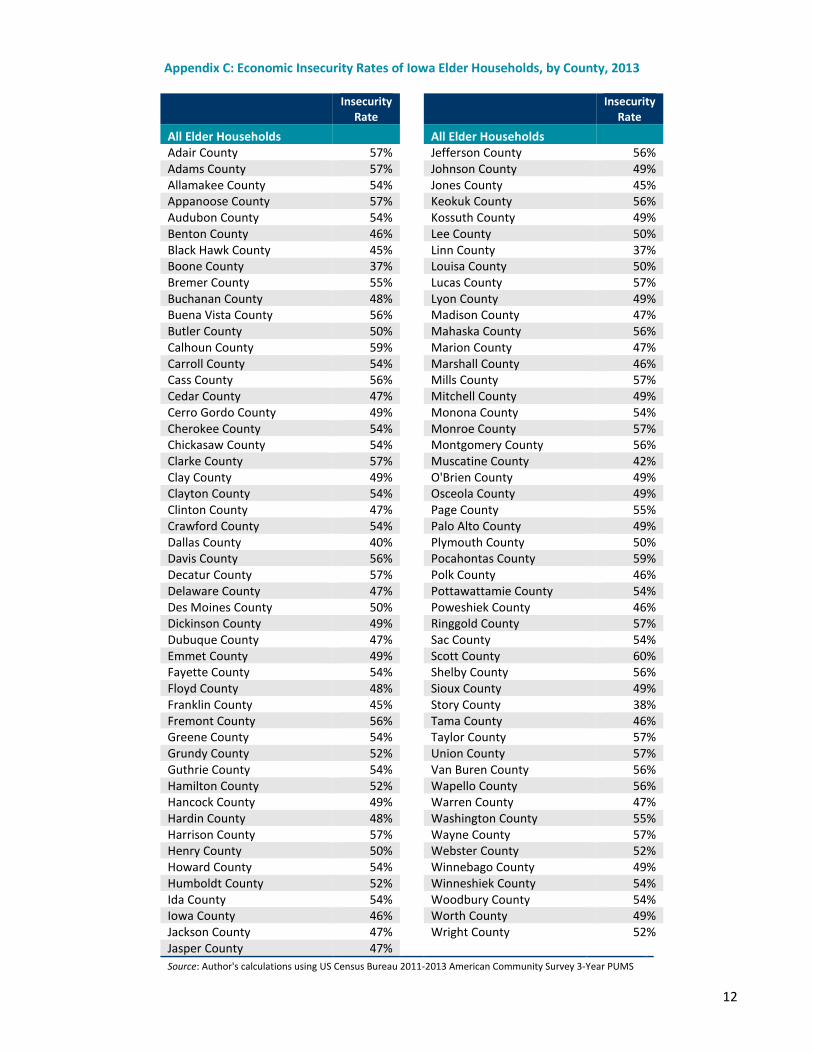
Appendix C: Economic Insecurity Rates of Iowa Elder Households, by County, 2013
Insecurity Rate
Insecurity Rate
All Elder Households
All Elder Households Adair County 57%
Jefferson County 56%
Adams County 57%
Johnson County 49% Allamakee County 54%
Jones County 45%
Appanoose County 57%
Keokuk County 56% Audubon County 54%
Kossuth County 49%
Benton County 46%
Lee County 50% Black Hawk County 45%
Linn County 37%
Boone County 37%
Louisa County 50% Bremer County 55%
Lucas County 57%
Buchanan County 48%
Lyon County 49% Buena Vista County 56%
Madison County 47%
Butler County 50%
Mahaska County 56% Calhoun County 59%
Marion County 47%
Carroll County 54%
Marshall County 46% Cass County 56%
Mills County 57%
Cedar County 47%
Mitchell County 49% Cerro Gordo County 49%
Monona County 54%
Cherokee County 54%
Monroe County 57% Chickasaw County 54%
Montgomery County 56%
Clarke County 57%
Muscatine County 42% Clay County 49%
O'Brien County 49%
Clayton County 54%
Osceola County 49% Clinton County 47%
Page County 55%
Crawford County 54%
Palo Alto County 49% Dallas County 40%
Plymouth County 50%
Davis County 56%
Pocahontas County 59% Decatur County 57%
Polk County 46%
Delaware County 47%
Pottawattamie County 54% Des Moines County 50%
Poweshiek County 46%
Dickinson County 49%
Ringgold County 57% Dubuque County 47%
Sac County 54%
Emmet County 49%
Scott County 60% Fayette County 54%
Shelby County 56%
Floyd County 48%
Sioux County 49% Franklin County 45%
Story County 38%
Fremont County 56%
Tama County 46% Greene County 54%
Taylor County 57%
Grundy County 52%
Union County 57% Guthrie County 54%
Van Buren County 56%
Hamilton County 52%
Wapello County 56% Hancock County 49%
Warren County 47%
Hardin County 48%
Washington County 55% Harrison County 57%
Wayne County 57%
Henry County 50%
Webster County 52% Howard County 54%
Winnebago County 49%
Humboldt County 52%
Winneshiek County 54% Ida County 54%
Woodbury County 54%
Iowa County 46%
Worth County 49% Jackson County 47%
Wright County 52%
Jasper County 47% Source: Author's calculations using US Census Bureau 2011-2013 American Community Survey 3-Year PUMS
13
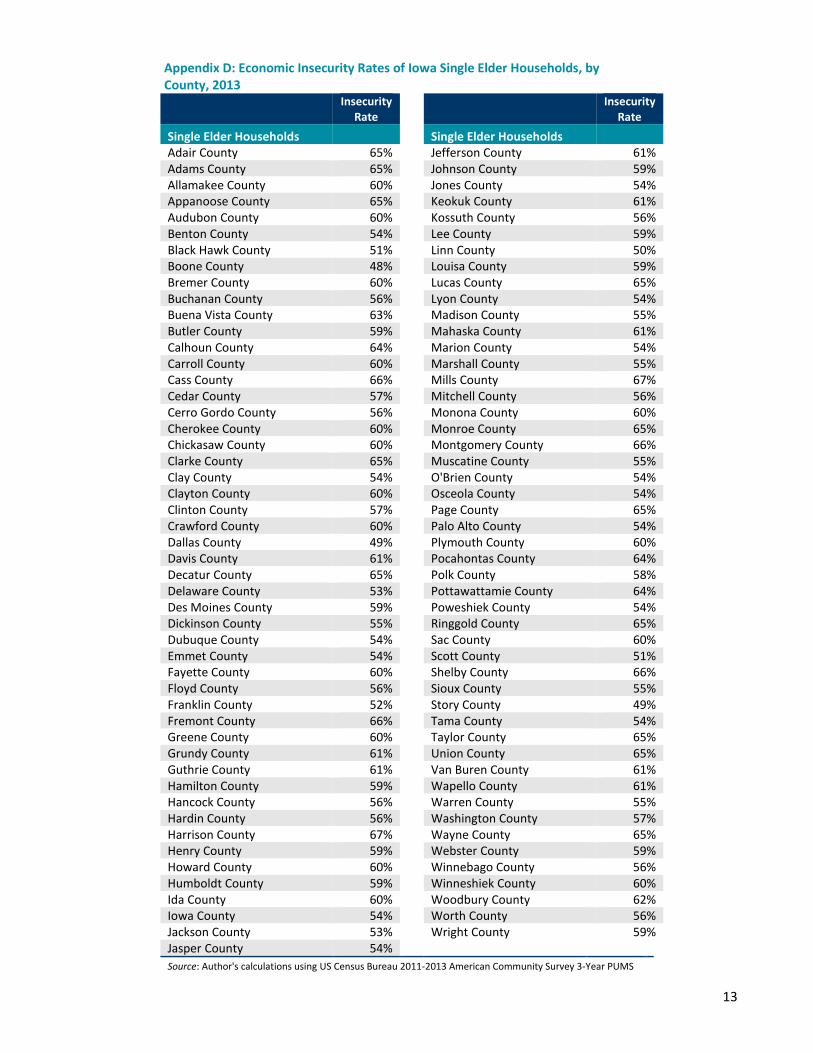
Appendix D: Economic Insecurity Rates of Iowa Single Elder Households, by County, 2013
Insecurity Rate
Insecurity Rate
Single Elder Households
Single Elder Households Adair County 65%
Jefferson County 61%
Adams County 65%
Johnson County 59% Allamakee County 60%
Jones County 54%
Appanoose County 65%
Keokuk County 61% Audubon County 60%
Kossuth County 56%
Benton County 54%
Lee County 59% Black Hawk County 51%
Linn County 50%
Boone County 48%
Louisa County 59% Bremer County 60%
Lucas County 65%
Buchanan County 56%
Lyon County 54% Buena Vista County 63%
Madison County 55%
Butler County 59%
Mahaska County 61% Calhoun County 64%
Marion County 54%
Carroll County 60%
Marshall County 55% Cass County 66%
Mills County 67%
Cedar County 57%
Mitchell County 56% Cerro Gordo County 56%
Monona County 60%
Cherokee County 60%
Monroe County 65% Chickasaw County 60%
Montgomery County 66%
Clarke County 65%
Muscatine County 55% Clay County 54%
O'Brien County 54%
Clayton County 60%
Osceola County 54% Clinton County 57%
Page County 65%
Crawford County 60%
Palo Alto County 54% Dallas County 49%
Plymouth County 60%
Davis County 61%
Pocahontas County 64% Decatur County 65%
Polk County 58%
Delaware County 53%
Pottawattamie County 64% Des Moines County 59%
Poweshiek County 54%
Dickinson County 55%
Ringgold County 65% Dubuque County 54%
Sac County 60%
Emmet County 54%
Scott County 51% Fayette County 60%
Shelby County 66%
Floyd County 56%
Sioux County 55% Franklin County 52%
Story County 49%
Fremont County 66%
Tama County 54% Greene County 60%
Taylor County 65%
Grundy County 61%
Union County 65% Guthrie County 61%
Van Buren County 61%
Hamilton County 59%
Wapello County 61% Hancock County 56%
Warren County 55%
Hardin County 56%
Washington County 57% Harrison County 67%
Wayne County 65%
Henry County 59%
Webster County 59% Howard County 60%
Winnebago County 56%
Humboldt County 59%
Winneshiek County 60% Ida County 60%
Woodbury County 62%
Iowa County 54%
Worth County 56% Jackson County 53%
Wright County 59%
Jasper County 54% Source: Author's calculations using US Census Bureau 2011-2013 American Community Survey 3-Year PUMS
14
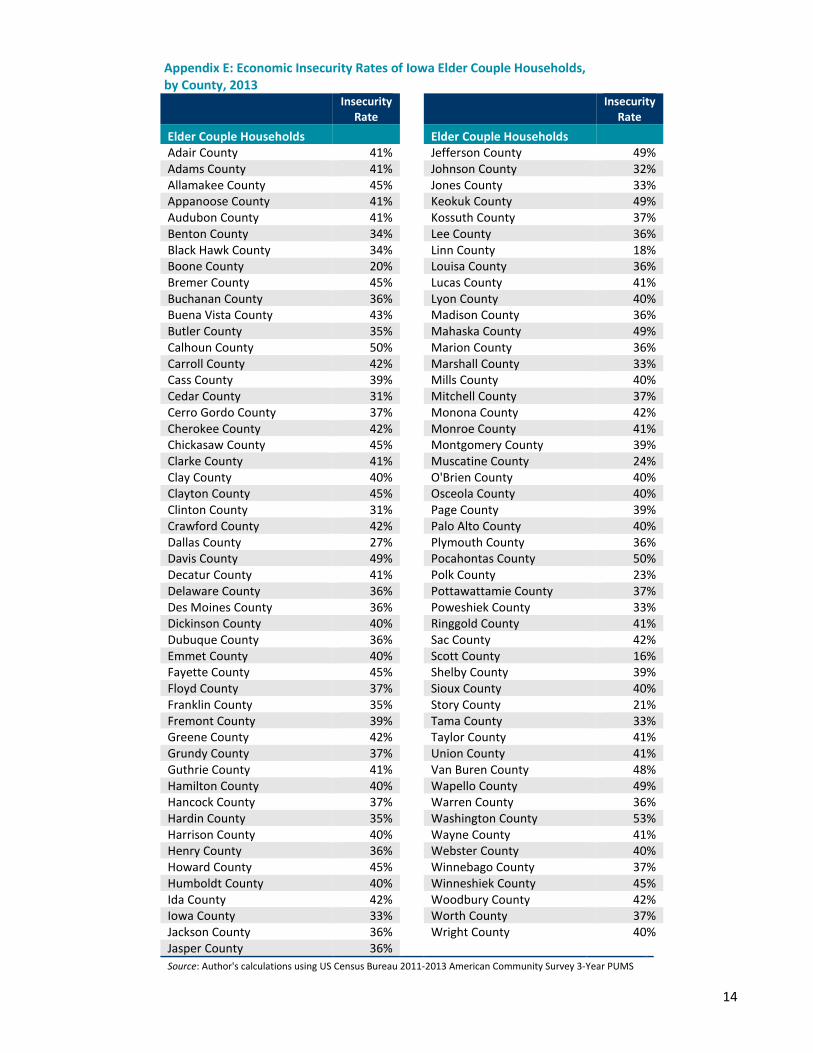
Appendix E: Economic Insecurity Rates of Iowa Elder Couple Households, by County, 2013
Insecurity Rate
Insecurity Rate
Elder Couple Households
Elder Couple Households Adair County 41%
Jefferson County 49%
Adams County 41%
Johnson County 32% Allamakee County 45%
Jones County 33%
Appanoose County 41%
Keokuk County 49% Audubon County 41%
Kossuth County 37%
Benton County 34%
Lee County 36% Black Hawk County 34%
Linn County 18%
Boone County 20%
Louisa County 36% Bremer County 45%
Lucas County 41%
Buchanan County 36%
Lyon County 40% Buena Vista County 43%
Madison County 36%
Butler County 35%
Mahaska County 49% Calhoun County 50%
Marion County 36%
Carroll County 42%
Marshall County 33% Cass County 39%
Mills County 40%
Cedar County 31%
Mitchell County 37% Cerro Gordo County 37%
Monona County 42%
Cherokee County 42%
Monroe County 41% Chickasaw County 45%
Montgomery County 39%
Clarke County 41%
Muscatine County 24% Clay County 40%
O'Brien County 40%
Clayton County 45%
Osceola County 40% Clinton County 31%
Page County 39%
Crawford County 42%
Palo Alto County 40% Dallas County 27%
Plymouth County 36%
Davis County 49%
Pocahontas County 50% Decatur County 41%
Polk County 23%
Delaware County 36%
Pottawattamie County 37% Des Moines County 36%
Poweshiek County 33%
Dickinson County 40%
Ringgold County 41% Dubuque County 36%
Sac County 42%
Emmet County 40%
Scott County 16% Fayette County 45%
Shelby County 39%
Floyd County 37%
Sioux County 40% Franklin County 35%
Story County 21%
Fremont County 39%
Tama County 33% Greene County 42%
Taylor County 41%
Grundy County 37%
Union County 41% Guthrie County 41%
Van Buren County 48%
Hamilton County 40%
Wapello County 49% Hancock County 37%
Warren County 36%
Hardin County 35%
Washington County 53% Harrison County 40%
Wayne County 41%
Henry County 36%
Webster County 40% Howard County 45%
Winnebago County 37%
Humboldt County 40%
Winneshiek County 45% Ida County 42%
Woodbury County 42%
Iowa County 33%
Worth County 37% Jackson County 36%
Wright County 40%
Jasper County 36% Source: Author's calculations using US Census Bureau 2011-2013 American Community Survey 3-Year PUMS
15
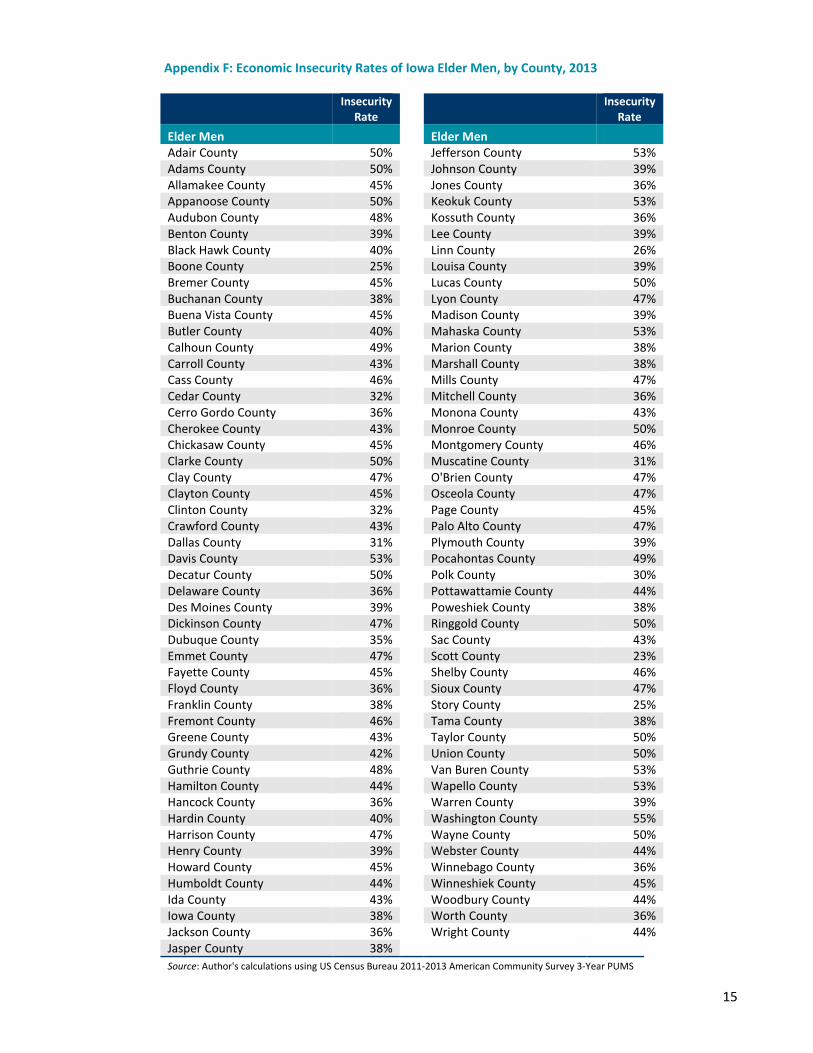
Appendix F: Economic Insecurity Rates of Iowa Elder Men, by County, 2013
Insecurity Rate
Insecurity Rate
Elder Men
Elder Men Adair County 50%
Jefferson County 53%
Adams County 50%
Johnson County 39% Allamakee County 45%
Jones County 36%
Appanoose County 50%
Keokuk County 53% Audubon County 48%
Kossuth County 36%
Benton County 39%
Lee County 39% Black Hawk County 40%
Linn County 26%
Boone County 25%
Louisa County 39% Bremer County 45%
Lucas County 50%
Buchanan County 38%
Lyon County 47% Buena Vista County 45%
Madison County 39%
Butler County 40%
Mahaska County 53% Calhoun County 49%
Marion County 38%
Carroll County 43%
Marshall County 38% Cass County 46%
Mills County 47%
Cedar County 32%
Mitchell County 36% Cerro Gordo County 36%
Monona County 43%
Cherokee County 43%
Monroe County 50% Chickasaw County 45%
Montgomery County 46%
Clarke County 50%
Muscatine County 31% Clay County 47%
O'Brien County 47%
Clayton County 45%
Osceola County 47% Clinton County 32%
Page County 45%
Crawford County 43%
Palo Alto County 47% Dallas County 31%
Plymouth County 39%
Davis County 53%
Pocahontas County 49% Decatur County 50%
Polk County 30%
Delaware County 36%
Pottawattamie County 44% Des Moines County 39%
Poweshiek County 38%
Dickinson County 47%
Ringgold County 50% Dubuque County 35%
Sac County 43%
Emmet County 47%
Scott County 23% Fayette County 45%
Shelby County 46%
Floyd County 36%
Sioux County 47% Franklin County 38%
Story County 25%
Fremont County 46%
Tama County 38% Greene County 43%
Taylor County 50%
Grundy County 42%
Union County 50% Guthrie County 48%
Van Buren County 53%
Hamilton County 44%
Wapello County 53% Hancock County 36%
Warren County 39%
Hardin County 40%
Washington County 55% Harrison County 47%
Wayne County 50%
Henry County 39%
Webster County 44% Howard County 45%
Winnebago County 36%
Humboldt County 44%
Winneshiek County 45% Ida County 43%
Woodbury County 44%
Iowa County 38%
Worth County 36% Jackson County 36%
Wright County 44%
Jasper County 38% Source: Author's calculations using US Census Bureau 2011-2013 American Community Survey 3-Year PUMS
16
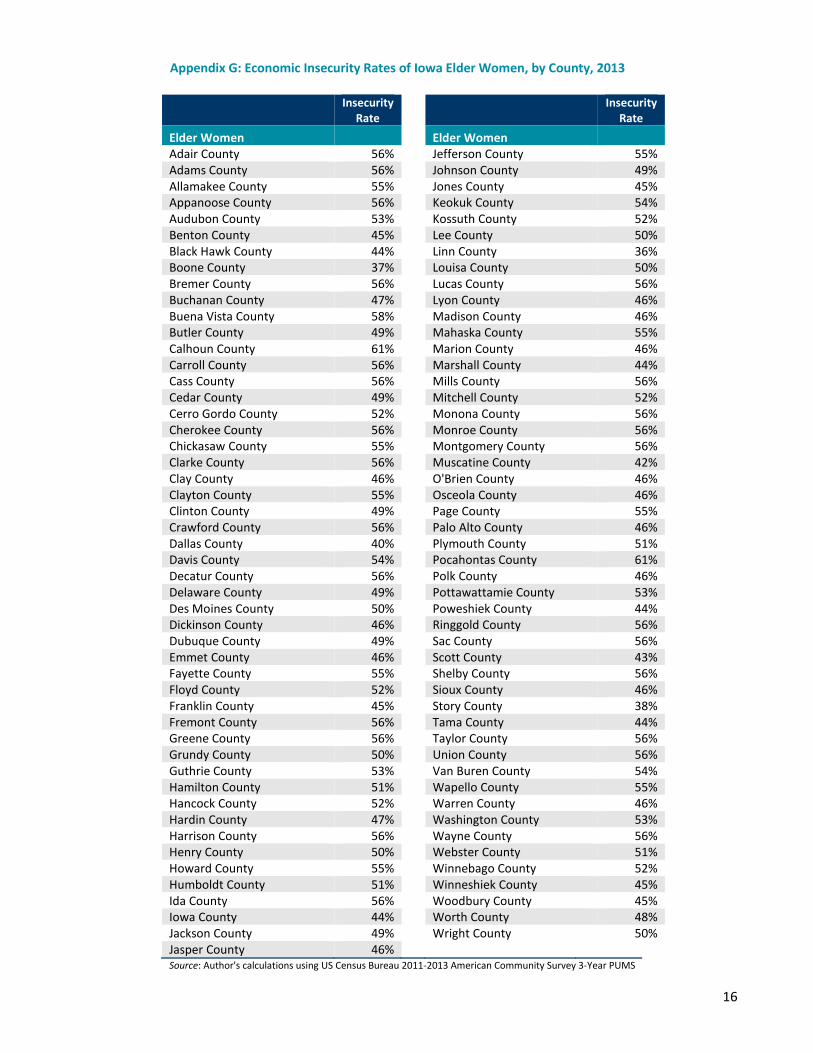
Appendix G: Economic Insecurity Rates of Iowa Elder Women, by County, 2013
Insecurity Rate
Insecurity Rate
Elder Women Elder Women Adair County 56%
Jefferson County 55%
Adams County 56%
Johnson County 49% Allamakee County 55%
Jones County 45%
Appanoose County 56%
Keokuk County 54% Audubon County 53%
Kossuth County 52%
Benton County 45%
Lee County 50% Black Hawk County 44%
Linn County 36%
Boone County 37%
Louisa County 50% Bremer County 56%
Lucas County 56%
Buchanan County 47%
Lyon County 46% Buena Vista County 58%
Madison County 46%
Butler County 49%
Mahaska County 55% Calhoun County 61%
Marion County 46%
Carroll County 56%
Marshall County 44% Cass County 56%
Mills County 56%
Cedar County 49%
Mitchell County 52% Cerro Gordo County 52%
Monona County 56%
Cherokee County 56%
Monroe County 56% Chickasaw County 55%
Montgomery County 56%
Clarke County 56%
Muscatine County 42% Clay County 46%
O'Brien County 46%
Clayton County 55%
Osceola County 46% Clinton County 49%
Page County 55%
Crawford County 56%
Palo Alto County 46% Dallas County 40%
Plymouth County 51%
Davis County 54%
Pocahontas County 61% Decatur County 56%
Polk County 46%
Delaware County 49%
Pottawattamie County 53% Des Moines County 50%
Poweshiek County 44%
Dickinson County 46%
Ringgold County 56% Dubuque County 49%
Sac County 56%
Emmet County 46%
Scott County 43% Fayette County 55%
Shelby County 56%
Floyd County 52%
Sioux County 46% Franklin County 45%
Story County 38%
Fremont County 56%
Tama County 44% Greene County 56%
Taylor County 56%
Grundy County 50%
Union County 56% Guthrie County 53%
Van Buren County 54%
Hamilton County 51%
Wapello County 55% Hancock County 52%
Warren County 46%
Hardin County 47%
Washington County 53% Harrison County 56%
Wayne County 56%
Henry County 50%
Webster County 51% Howard County 55%
Winnebago County 52%
Humboldt County 51%
Winneshiek County 45% Ida County 56%
Woodbury County 45%
Iowa County 44%
Worth County 48% Jackson County 49%
Wright County 50%
Jasper County 46% Source: Author's calculations using US Census Bureau 2011-2013 American Community Survey 3-Year PUMS
17
METHODOLOGY
This brief compares annual incomes required for
basic economic security, as defined by the Elder
Index, to 2011-2013 3-year American Community
Survey PUMS data. The study sample is limited to
households for which Elder Index values are
calculated—households composed of either a
single adult age 65 or older or an elder couple
where both adults are age 65 or older. All adults
are fully retired (reporting zero earnings and no
work in the past year). The incomes of individuals
living in homes they do not own and for which
they do not pay rent are compared to the
statewide Iowa Elder Index value for renters.
When elders’ incomes are compared to Elder
Index values, payments from cash-equivalent
public assistance programs and Supplemental
Security Income (SSI) are excluded from elder
incomes.8
1 Elder-only households include those composed of single adults age 65 and older who live alone, and elder couples who
reside alone, with no additional family members or unrelated individuals. Older adults who live in group quarters,
including institutional settings, and those who reside with other family members or unrelated roommates are not
included in this analysis, as it is not possible to determine an economic security budget or who within a household pays
for expenses. 2 Basic economic security is defined as having enough income to meet basic needs without public or private assistance.
For more information on the Elder Index methodology, see The National Elder Economic Security Standard Index
(Boston: University of Massachusetts Boston. 2012). While public supports, particularly food support programs and
energy assistance, are critical to helping many elders address the gap between income and economic security needs,
elders who depend on public assistance programs are not considered secure. 3 Vincent, Grayson K. and Victoria A. Velkhoff. The Next Four Decades: The Older Population in the United States: 2010 to
2050. Washington, DC: US Census Bureau, Government Printing Office, 2010. 4 US Census Bureau. American Community Survey, 2013 American Community Survey 1-Year Estimates, Table S0103;
using American FactFinder. http://factfinder2.census.gov. (22 February 2014). 5 US Census Bureau. American Community Survey, 2013 American Community Survey 1-Year Estimates, Table QT-P1;
using American FactFinder. http://factfinder2.census.gov. (23 February 2014). 6 US Government Accountability Office. Retirement Security: Women Still Face Challenges. Washington, DC: Government
Accountability Office, 2012. 7 These calculations determine Social Security as a percentage of total personal income, not total household income,
and refer specifically to the population studied in the brief. 8 Nationally, approximately 1% of households studied received income from a public (cash) assistance program (not
including Social Security, Social Security Disability Insurance or Supplemental Security Income). Approximately 4% of
households studied received income from Supplemental Security Income.
1001 Connecticut Avenue, NW, Suite 930 Washington, DC 20036
202-464-1596 Fax: 202-464-1660
www.wowonline.org