Embed Size (px)
Citation preview

“The Decline and Fall of the Roman Empire”
Live Webcast hosted by:
Jeffrey Gundlach
Chief Executive Officer
February 14, 2011

Fund Offerings
Retail and Institutional ClassNo Load Mutual Fund
Retail and Institutional ClassNo Load Mutual Fund
Total Return Bond Fund Core Fixed Income Fund
Retail Inst.N‐share I‐share
Retail Inst.N‐share I‐share
Ticker DLTNX DBLTXMin Investment $2,000 $100,000Min IRA Investment $500 $5,000Net Expense Ratio 0.74% 0.49%
Ticker DLFNX DBLFXMin Investment $2,000 $100,000Min IRA Investment $500 $5,000Net Expense Ratio 0.74% 0.49%
The Funds’ investment objectives, risks, charges and expenses must be considered carefully before investing. The prospectus contains this and other important information about the Funds, and it may be obtained by calling 1 (877) 354‐6311/ 1 (877) DLINE11, or visiting www.doublelinefunds.com. Read it carefully before investing.Investments in debt securities typically decrease in value when interest rates rise. This risk is usually greater for longer‐term debt securities.In estments in Asset Backed and Mortgage Backed Sec rities incl de additional risks that in estors sho ld be a are of s ch as credit risk prepa ment risk possible illiq idit and defa lt as ell asInvestments in Asset‐Backed and Mortgage‐Backed Securities include additional risks that investors should be aware of such as credit risk, prepayment risk, possible illiquidity and default, as well as increased susceptibility to adverse economic developments. Investments in lower rated and non‐rated securities present a greater risk of loss to principal and interest than higher‐rated securities. The Fund invests in foreign securities which involve greater volatility and political, economic and currency risks and differences in accounting methods. Opinions expressed are subject to change at any time, are not forecasts and should not be considered investment advice.DoubleLine Funds are distributed by Quasar Distributors, LLC.While the Funds are no‐load, management fees and other expenses still apply. Please refer to the prospectus for further details.Past Performance does not guarantee future results. Index performance is not illustrative of fund performance. An investment cannot be made in an index.
1

PerformanceDoubleLine Total Return Bond Fund – Quarter Ending December 31, 2011
Dec 4Q20111 Year
(Annualized)
Since Inception Annualized
(4‐6‐10 to 12‐31‐11)
I‐share 0.44% 0.61% 9.51% 15.09%N‐share 0.33% 0.46% 9.16% 14.78%Barclays US Aggregate Index 1.10% 1.12% 7.84% 7.57%
As of December 31, 2011 I‐share N‐shareGross SEC 30‐Day Yield 8.19% 7.94%Net SEC 30‐Day Yield 8.21% 7.96%
Morningstar Intermediate Term Bond Fund Rankings*
As of December 31, 2011 I‐share N‐share1‐Year (Absolute Rank) 24 of 1,195 31 of 1,195
I‐share N‐shareGross Expense Ratio 0.54% 0.79%
Net Expense Ratio 0.49% 0.74%
( ) , ,1‐Year (% Rank) 2% 3%For the period ending 12‐31‐11, Morningstar ranked the Total Return
Bond Fund in the top 2% and 3% (for the I and N‐share classes, respectively) among the 1,195 Funds in the Intermediate‐Term Bond Fund category based
on total returns
Performance data quoted represents past performance; past performance does not guarantee future results. The investment return and principal value of an investment will fluctuate so that an investor's shares, when redeemed, may be worth more or less than the original cost. Current performance of the fund may be lower or higher than the performance quoted. Performance data current to the most recent month‐end may be obtained by calling 213‐633‐8200 or by visiting www.doublelinefunds.com. The Advisor has contractually agreed to waive fees through July 24 2012
on total returns.
The Advisor has contractually agreed to waive fees through July 24, 2012.Barclays US Aggregate Index represents securities that are SEC‐registered, taxable, and dollar denominated. The index covers the US investment grade fixed rate bond market, with index components for government and corporate securities, mortgage pass‐through securities, and asset‐backed securities. These major sectors are subdivided into more specific indices that are calculated and reported on a regular basis. It is not possible to invest in an index.Past Performance does not guarantee future results. Index performance is not illustrative of fund performance. An investment cannot be made in an index.*Morningstar rankings (% Rank) represent a fund's total‐return percentile rank relative to all funds that have the same Morningstar category. The highest percentile rank is 1 and the lowest is 100. Morningstar Rankings (Absolute) represent a fund’s total return rank relative to all funds that have the same Morningstar
2
Category. The highest rank is 1 and the lowest is based on the total number of funds in the category. It is based on Morningstar total return, which includes both income and capital gains or losses and is not adjusted for sales charges or redemption fees.© 2011 Morningstar Inc. All Right Reserved. The information contained herein: (1) is proprietary to Morningstar; (2) may not be copied or distributed; and (3) is not warranted to be accurate, complete or timely. Neither Morningstar nor its content providers are responsible for any damages or losses arising from any use of this information.

PerformanceDoubleLine Core Fixed Income Fund – Quarter Ending December 31, 2011
Dec 4Q20111‐Year
(Annualized)
Since Inception Annualized
(6‐1‐10 to 12‐31‐11)
I‐share 1.20% 1.80% 11.45% 12.09%
N‐share 1.09% 1.74% 11.12% 11.80%
As of December 31, 2011 I‐share N‐share
Gross SEC 30‐Day Yield 4.69% 4.44%
Net SEC 30‐Day Yield 4.74% 4.49%
Morningstar Intermediate Term Bond Fund Rankings*
As of December 31, 2011 I‐share N‐share
1‐Year (Absolute Rank) 2 of 1 195 3 of 1 195
Barclays US Aggregate Index 1.10% 1.12% 7.84% 6.67%
I‐share N‐share
Gross Expense Ratio 0.85% 1.10%
Net Expense Ratio 0.49% 0.74%
1 Year (Absolute Rank) 2 of 1,195 3 of 1,195
1‐Year (% Rank) 1% 1%
For the period ending 12‐31‐11, Morningstar ranked the Core Fixed Income
Bond Fund in the top 1% among the 1,195 Funds in the Intermediate‐Term
Bond Fund category based on total returns.
Performance data quoted represents past performance; past performance does not guarantee future results. The investment return and principal value of an investment will fluctuate so that an investor's shares, when redeemed, may be worth more or less than the original cost. Current performance of the fund may be lower or higher than the performance quoted. Performance data current to the most recent month‐end may be obtained by calling 213‐633‐8200 or by visiting www.doublelinefunds.com. The Advisor has contractually agreed to waive fees through July 24 2012
g y
The Advisor has contractually agreed to waive fees through July 24, 2012.Barclays US Aggregate Index represents securities that are SEC‐registered, taxable, and dollar denominated. The index covers the US investment grade fixed rate bond market, with index components for government and corporate securities, mortgage pass‐through securities, and asset‐backed securities. These major sectors are subdivided into more specific indices that are calculated and reported on a regular basis. It is not possible to invest in an index.Past Performance does not guarantee future results. Index performance is not illustrative of fund performance. An investment cannot be made in an index.*Morningstar rankings (% Rank) represent a fund's total‐return percentile rank relative to all funds that have the same Morningstar category. The highest percentile rank is 1 and the lowest is 100. Morningstar Rankings (Absolute) represent a fund’s total return rank relative to all funds that have the same Morningstar
3
Category. The highest rank is 1 and the lowest is based on the total number of funds in the category. It is based on Morningstar total return, which includes both income and capital gains or losses and is not adjusted for sales charges or redemption fees.© 2012 Morningstar Inc. All Right Reserved. The information contained herein: (1) is proprietary to Morningstar; (2) may not be copied or distributed; and (3) is not warranted to be accurate, complete or timely. Neither Morningstar nor its content providers are responsible for any damages or losses arising from any use of this information.

Announcements
Webcast News –
Luz Padilla – March 6, 2012Emerging Markets Fixed Income FundMarch 6, 2012 1:15 pm PT
Philip Barach – March 13, 2012Philip Barach March 13, 2012Low Duration Bond FundMarch 13, 2012 1:15 pm PT
Jeffrey Gundlach – March 20 2012Jeffrey Gundlach March 20, 2012Aston/DoubleLine Core Plus Fixed Income FundMarch 20, 2012 1:00 pm PT/4:00 pm ETPlease visit www.astonfunds.com
To Receive Presentation Slides:You can email [email protected]@doubleline.com
4References to other mutual funds should not be interpreted as an offer of these securities. The Aston/DoubleLine Core Plus Fixed Income Fund is not distributed by Quasar Distributors, LLC.

“The Decline and Fall of the Roman Empire”
Live Webcast hosted by:
Jeffrey Gundlach
Chief Executive Officer
February 14, 2012

TAB I“ di ”“Government Spending”

Years of Soaring National DebtThe Great Prosperity: 1947‐1979
Source: NY Times “The Dangerous Notion That Debt Doesn’t Matter, January 20,2012 http://www.nytimes.com/2011/09/04/opinion/sunday/jobs‐will‐follow‐a‐strengthening‐of‐the‐middle‐class.html?_r=1
7

The Great Prosperity: 1947‐1979
U.S. Military Expenditures vs. Other Countries
The World’s Top 5 Largest Military Budgets Rank Country 2010 Spending ($ b.)
Share of 2010 GDP (%)
World Share (%)
— World Total 1 630 2.6 100World Total 1 630 2.6 100
1 United States 698 4.8 432 Chinaa 119 2.1 7.3
3 United Kingdom 59.6 2.7 3.7
4 France 59.3 2.3 3.6
5 Russiaa 58.7 4.0 3.5
6 Japan 54.5 1.0 3.3
7 Germanya 45.2 1.3 2.8
7 Saudi Arabiab 45.2 10.4 2.8
9 India 41.3 2.7 2.5
10 Italya 37.0 1.8 2.3
11 Brazil 33.5 1.6 2.1
12 South Korea 27.6 2.8 1.7
13 Australia 24.0 2.0 1.5
14 C d 22 8 1 5 1 414 Canadaa 22.8 1.5 1.4
15 Turkeya 17.5 2.4 1.1
8Source: United Nations Security Council. Figures sourced by Stockholm International Peace Research Institute (SIPRI).

The Great Prosperity: 1947‐1979
U.S. Military Defense Outlays
9Source: US Office of Management & Budget

The Great Prosperity: 1947‐1979
U.S. Healthcare and Medicare Outlays
10Source: US Office of Management & Budget

The Great Prosperity: 1947‐1979
U.S. Defense vs. Healthcare & Medicare
11Source: US Office of Management & Budget
The Great Prosperity: 1947‐1979
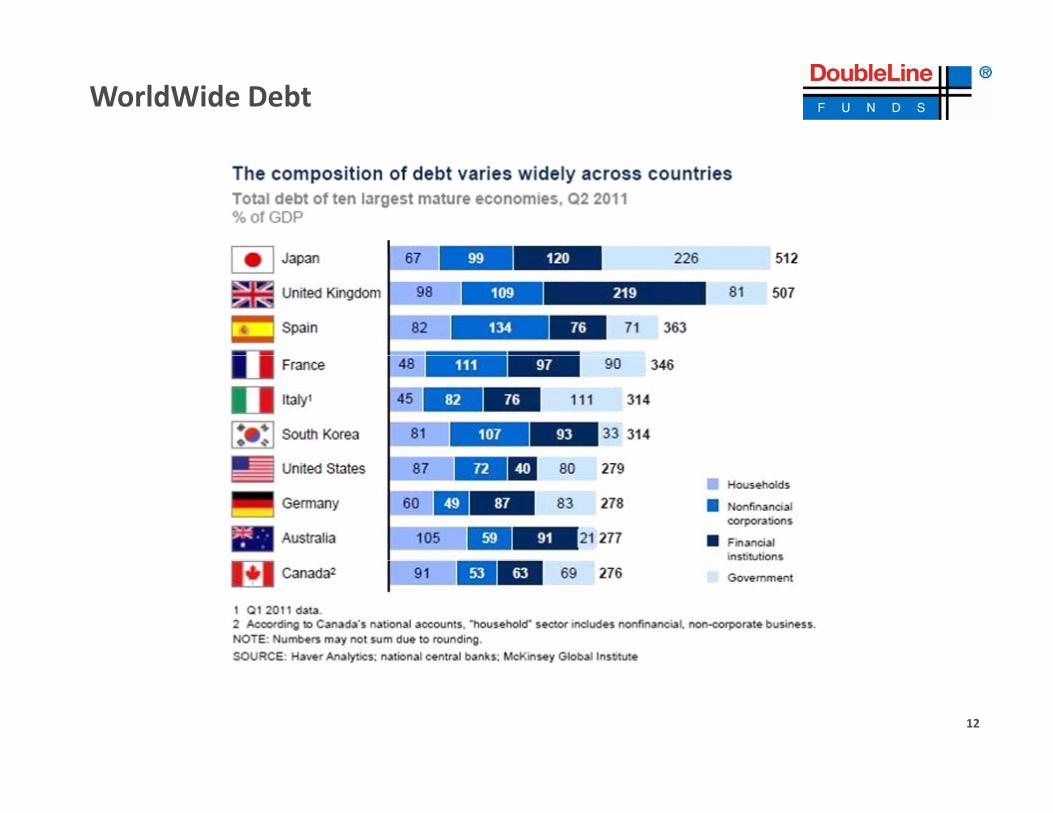
WorldWide Debt
12

The Great Prosperity: 1947‐1979
2012 Debt Rollovers and Interest Payments
Country2012 Bond, Bill Redemptions ($) Coupon Payments ($)
Japan 3000 billion 117 billionU.S. 2783 billion 212 billionItaly 428 billion 72 billionFrance 367 billion 54 billionFrance 367 billion 54 billionGermany 285 billion 45 billionCanada 221 billion 14 billionBrazil 169 billion 31 billionU.K. 165 billion 67 billionChina 121 billion 41 billionIndia 57 billion 39 billionRussia 13 billion 9 billion
13Source: MISH’s Global Economic Trend Analysis, Tuesday January 3, 2012http://globaleconomicanalysis.blogspot.com/2012/01/worlds‐biggest‐economies‐face‐76t‐debt.html

The Great Prosperity: 1947‐1979
Central Bank Balance Sheets
10/31/1113.20
12/31/0810 12
13.20
11/30/1010.87
10.12
2/28/098.95
5/31/064.99
8/31/087.23
14Source: Bianco Research, LLC, February 2, 2012ECB = European Central Bank

The Great Prosperity: 1947‐1979
What Happens When the Stimulus Ends?
15
Source: http://www.ritholtz.com/blog/2012/02/who‐took‐my‐easy‐button/PIDSDCWT Index = US Disposable Personal Income chained 2005 dollars seasonally adjusted PIDSPINX Index = US Personal income excluding transfer receipts chained 2005 dollars seasonal adjusted annual rateAn investment cannot be made directly in an index..

The Great Prosperity: 1947‐1979
When Will The Fed Hike Rates?
• The Fed announced the Fund’s rate would stay between 0% and 0.25% until 2014
• However, the chart shows 11 out of 17 members expect policy firming before the end of 2014.
1111
16Source: Bianco Research, LLC, February 2, 2012

Percent of Job Losses in Post WWII Recessions
17Source: http://www.crgraphs.com/2011/10/employment‐graphs.html

Employment‐to‐Population RatioDecember 1965 through January 2012
66%
62
64
58
60
56
58
54
Dec‐65
May‐67
Oct‐68
Mar‐70
Aug
‐71
Jan‐73
Jun‐74
Nov‐75
Apr‐77
Sep‐78
Feb‐80
Jul‐8
1
Nov‐82
Apr‐84
Sep‐85
Feb‐87
Jul‐8
8
Nov‐89
Apr‐91
Sep‐92
Feb‐94
Jul‐9
5
Nov‐96
Apr‐98
Sep‐99
Feb‐01
Jul‐0
2
Nov‐03
Apr‐05
Sep‐06
Feb‐08
Jul‐0
9
Nov‐10
18Source: Bureau of Labor Statistics, DoubleLine Capital.
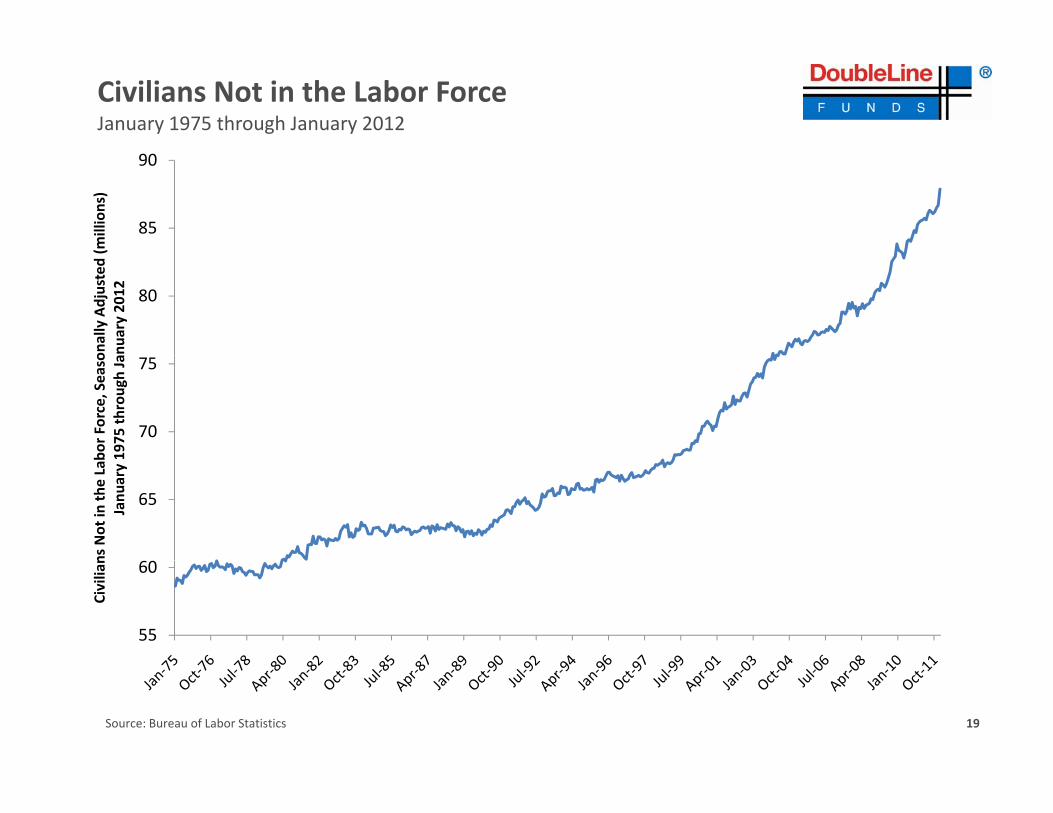
Civilians Not in the Labor Force January 1975 through January 2012
85
90
(millions)
80
onally Adjusted (
nuary 2012
70
75
bor Force, Seaso
1975
throu
gh Ja
65
ns Not in
the Lab
Janu
ary 1
55
60
Civilian
Source: Bureau of Labor Statistics 19

U.S. Food Stamp Participation
20Source: Zero Hedge http://www.zerohedge.com/sites/default/files/images/user5/imageroot/draghi/June SNAP.png

Labor Force Participation Rate by Age GroupJanuary 1948 through January 2012
90 %
70
80
50
60
30
40
20
30
Jan‐48
Nov‐49
Sep‐51
Jul‐5
3
May‐55
Mar‐57
Jan‐59
Nov‐60
Sep‐62
Jul‐6
4
May‐66
Mar‐68
Jan‐70
Nov‐71
Sep‐73
Jul‐7
5
May‐77
Mar‐79
Jan‐81
Nov‐82
Sep‐84
Jul‐8
6
May‐88
Mar‐90
Jan‐92
Nov‐93
Sep‐95
Jul‐9
7
May‐99
Mar‐01
Jan‐03
Nov‐04
Sep‐06
Jul‐0
8
May‐10
16‐19 20‐24 25‐34 35‐44 45‐54 55+
21Source: Bureau of Labor Statistics, DoubleLine Capital.
J N S M M J N S M M J N S M M J N S M M J N S M M J N S M

Union Affiliation of Employed Workers
22

Federal Workers vs. Private Sector
23Source: http://www.cato‐at‐liberty.org/federal‐pay‐continues‐rapid‐ascent/

Average Compensation (Wages & Benefits) 2008
24
Source: http://www.cato‐at‐liberty.org/federal‐pay‐continues‐rapid‐ascent/

TAB II“Bl dl V di f h M k ”“Bloodless Verdict of the Market”
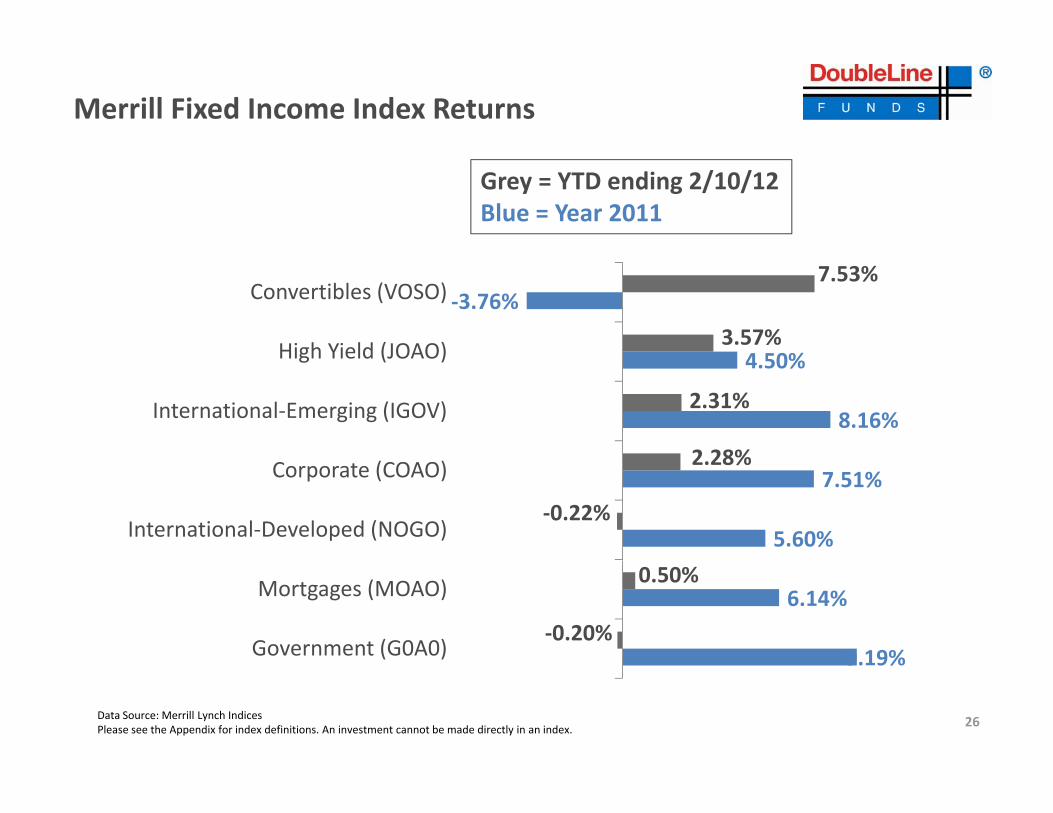
Merrill Fixed Income Index Returns
Grey = YTD ending 2/10/12Blue = Year 2011
4 50%
‐3.76%
3.57%
7.53%
High Yield (JOAO)
Convertibles (VOSO)
8.16%
4.50%
2 28%
2.31%International‐Emerging (IGOV)
High Yield (JOAO)
5.60%
7.51%‐0.22%
2.28%
International‐Developed (NOGO)
Corporate (COAO)
9.19%
6.14%
‐0.20%
0.50%
Government (G0A0)
Mortgages (MOAO)
26Data Source: Merrill Lynch IndicesPlease see the Appendix for index definitions. An investment cannot be made directly in an index.
9.19%

Merrill Fixed Income Index Returns
G YTD di 2/10/12
5.67%
Grey = YTD ending 2/10/12Blue = Year 2011
6.12%
‐1.33%
3.13%
5.67%
BB‐Rated High Yield Credit (JOA1)
CCC‐Rated High Yield (JOA3)
4.72%
2 67%
3.33%
BBB R t d C dit (COA4)
B‐Rated High Yield (JOA2)
7.39%
8.12%
2.24%
2.67%
A‐Rated Credit (COA3)
BBB‐Rated Credit (COA4)
9.11%0.23%AAA‐Rated Credit (COA1)
Investment Grade = Indices rated AAA to BBB‐ (shown above) are considered to be investment grade. A bond is considered investment grade if its credit rating is BBB‐ of hi h b S d d & P ’ B 3 b M d ’ Th hi h h i h lik l h b d i b k /$100 h d ll AAA i id d h hi h
27
higher by Standard & Poor’s or Baa3 by Moody’s. The higher the rating, the more likely the bond is to pay back at par/$100 cents on the dollar. AAA is considered the highest quality and the lowest degree of risk. They are considered to be extremely stable and dependable.Below Investment Grade = Also known as “junk bond” (shown above) is a security rated below investment grade having a rating of BBB‐ or below. These bonds are seen as having higher default risk or other adverse credit events, but typically pay higher yields than better quality bonds in order to make them attractive. They are less likely to pay back at par/$100 cents on the dollar.Source: Merrill Lynch Indices. An investment cannot be made directly in an index.

2‐Year US Treasury YieldYear‐End 2007 through February 13, 2012
Source: Bloomberg Financial ServicesPlease see the appendix for definition.
28

5‐Year US Treasury YieldYear‐End 2007 through February 13, 2012
2929Source: Bloomberg Financial ServicesPlease see the appendix for definition.

10‐Year US Treasury YieldYear‐End 2007 through February 13, 2012
30Source: Bloomberg Financial ServicesPlease see the appendix for definition.
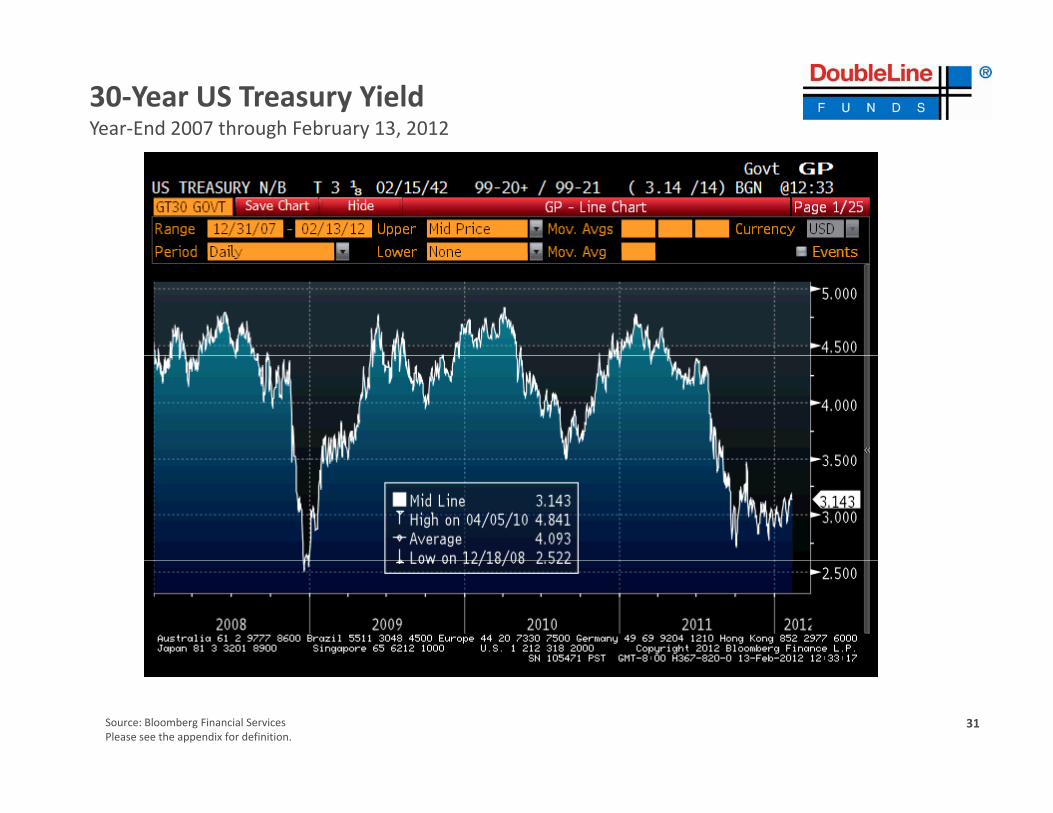
30‐Year US Treasury YieldYear‐End 2007 through February 13, 2012
31Source: Bloomberg Financial ServicesPlease see the appendix for definition.

The Great Prosperity: 1947‐1979
What If Inflation Becomes A Problem
32Source: Bianco Research, LLC, February 2, 2012

The Great Prosperity: 1947‐1979
10 Year Treasury Inflation‐Protected Securities (TIPS)
33Source: Bianco Research, LLC, February 2, 2012

The Great Prosperity: 1947‐1979
U.S. Treasury Monthly Average Yields
34Source: Marc Faber, Gloom and Doom, February 1, 2012

U.S. Treasury Inflation Protected Securities (TIPS) Peaks‐to‐Trough During and Post Credit CrisisPeaks to Trough During and Post Credit Crisis
June 12, 2007 ‐ December 18, 2008 (Rates down 3.22%)
BarCap BarCap BarCap Dow CS BarCap BarCap BarCap Citi ML ML
5yr TIPS 10yr TIPS 20yr TIPS 10yr TIPS Agg Credit MBS TIPS 10yr Tsy 30yr Tsy
Return 10 24% 11 27% 14 70% 11 42% 8 27% 1 22% 10 14% 8 63% 23 04% 42 47%Return 10.24% 11.27% 14.70% 11.42% 8.27% 1.22% 10.14% 8.63% 23.04% 42.47%
Std Dev 6.81% 11.15% 17.12% 11.19% 5.39% 6.88% 5.42% 9.19% 10.08% 17.27%
December 18, 2008 ‐ April 5, 2010 (Rates up 1.91%)
BarCap BarCap BarCap Dow CS BarCap BarCap BarCap Citi ML ML
5yr TIPS 10yr TIPS 20yr TIPS 10yr TIPS Agg Credit MBS TIPS 10yr Tsy 30yr Tsy
Return 3.50% 2.10% ‐1.46% 1.92% 5.57% 14.41% 5.35% 5.35% ‐8.92% ‐23.86%Return 3.50% 2.10% 1.46% 1.92% 5.57% 14.41% 5.35% 5.35% 8.92% 23.86%
Std Dev 4.28% 9.23% 15.78% 9.26% 4.22% 6.37% 2.74% 7.43% 10.40% 20.42%
April 5, 2010 ‐ Oct 7, 2010 (Rates down 1.60%)
BarCap BarCap BarCap BarCap Dow CS Dow CS BarCap BarCap BarCap Citi ML ML
5yr TIPS 10yr TIPS 20yr TIPS 30yr TIPS 10yr TIPS 30yr TIPS Agg Credit MBS TIPS 10yr Tsy 30yr Tsy
Return 5.76% 13.52% 17.72% 20.47% 13.58% 20.59% 7.40% 9.62% 4.92% 9.41% 15.91% 22.55%
Std Dev 3.35% 6.83% 11.41% 16.58% 6.76% 16.84% 3.48% 5.37% 2.10% 5.57% 8.27% 17.82%
Oct 7, 2010 ‐ February 8, 2011 (Rates up 1.35%)
BarCap BarCap BarCap BarCap Dow CS Dow CS BarCap BarCap BarCap Citi ML ML
5yr TIPS 10yr TIPS 20yr TIPS 30yr TIPS 10yr TIPS 30yr TIPS Agg Credit MBS TIPS 10yr Tsy 30yr Tsy
Return ‐1.30% ‐6.16% ‐9.81% ‐13.64% ‐6.26% ‐13.87% ‐3.02% ‐3.49% ‐1.56% ‐4.20% ‐9.49% ‐14.99%
Std Dev 4.36% 8.91% 13.19% 18.46% 9.10% 19.70% 4.54% 6.03% 3.58% 7.17% 9.86% 17.69%
February 8, 2011 ‐ February 6, 2012 (Rates down 1.83%)
BarCap BarCap BarCap BarCap Dow CS Dow CS BarCap BarCap BarCap Citi ML ML
5yr TIPS 10yr TIPS 20yr TIPS 30yr TIPS 10yr TIPS 30yr TIPS Agg Credit MBS TIPS 10yr Tsy 30yr Tsy
Return 10.30% 22.85% 32.86% 46.99% 23.04% 46.71% 9.90% 11.68% 7.96% 18.26% 20.82% 39.19%
Source: Bloomberg Financial Services, DoubleLine Capital LPBarCap = Barclays Capital. Dow CS = Dow Jones, Credit Suisse Index. Citi = Citigroup Index. ML = BofA Merrill LynchNote: TIPS are a treasury security that is indexed to inflation in an effort to protect investors from the negative effects of inflation Please see the appendix for further index definitions.An investment cannot be made directly in an index
35
Std Dev 3.61% 7.48% 12.65% 19.69% 7.58% 20.77% 3.74% 5.35% 2.41% 6.71% 8.74% 20.42%

Composition of the U.S. Bond Market
36

U.S. Dollar Index Spot –Year‐End 2007 through February 13, 2012
Source: Bloomberg Financial Services, DoubleLine Capital LPDXY = DXY is the US Dollar Index (USDX) indicates the general value of the US dollar. Average exchange rates between the Us dollar and six major world currencies.An investment cannot be made directly in an index.
37

Gold Index Spot –Year‐End 2007 through February 13, 2012
Source: Bloomberg Financial Services, DoubleLine Capital LPNote: The Gold Spot price is quoted as US Dollar per Troy Ounce.An investment cannot be made directly in an index.
38

CRB Commodity Index Year‐End 2006 through February 13, 2012
Source: Bloomberg Financial Services, DoubleLine Capital LPThe TR/J CRB Commodity Excess Return index is an arithmetic average of commodity futures prices with monthly rebalancing. It is an equal‐weighted geometric average of commodity price levels relative to the base year average price.An investment cannot be made directly in an index.
39

S&P 500 Index and Shanghai IndexYear‐End 2007 through February 13, 2012
5000
6000
1400
1600
4000
5000
1000
1200
ite Feb
ruary 13
, 201
2
Feb
ruary 13
, 201
2
2000
3000
600
800
SH Com
posi
er 31, 200
7 through
S&P 50
0er 31, 200
7 through
1000200
400
Decem
be
Decem
be
S&P 500 Shanghai Composite Index
S Bl b Fi i l S i D bl Li C i l LP
00
Source: Bloomberg Financial Services, DoubleLine Capital LPS&P 500 index is a basket of 500 stocks that are considered to be widely held. It is weighted by market value and its performance is thought to be representative of the stock market as a whole.The Shanghai Stock Exchange Composite is a capitalization‐weighted index tracking daily price performance of all A and B‐shares listed on the Shanghai Stock Exchange. This index was developed December 19, 1990 with a base value of 100.An investment cannot be made directly in an index.
40

TAB IIIT bl i h ETrouble in the Eurozone
Roman EmpireRoman Empire

PIIGS 10 –Year Sovereign Debt Spread to German Bund
35%
40%
n Bu
nd2
High Date
Portugal 15.60% 30‐Jan‐12
25%
30%
Spread
to German
h Februa
ry 13, 201
2 g
Italy 5.53% 9‐Nov‐11
Ireland 11.43% 18‐Jul‐11
Greece 33.84% 21‐Dec‐11
Spain 4.69% 22‐Nov‐11
15%
20%
overeign
Deb
t Yield
ry 01, 201
0 throug
0%
5%
10%
10‐Year S
oJanu
a
0%
Jan‐10
Feb‐10
Mar‐10
Apr‐10
May‐10
Jun‐10
Jul‐1
0
Aug
‐10
Sep‐10
Oct‐10
Nov‐10
Dec‐10
Jan‐11
Feb‐11
Mar‐11
Apr‐11
May‐11
Jun‐11
Jul‐1
1
Aug
‐11
Sep‐11
Oct‐11
Nov‐11
Dec‐11
Jan‐12
Feb‐12
Portugal Italy Ireland Greece Spaing y p
Source: Bloomberg Financial Services.PIIGS 10 = Portugal, Ireland, Italy, Greece and Spain 10‐year Treasury Yield spreads versus the German Bund 10‐Year Treasury yield.
42

EuroZone Unemployment
43
Source: http://globaleconomicanalysis.blogspot.com/2012/01/money‐supply‐figures‐suggests‐italy.html?utm_source=feedburner&utm_mediumEurozone includes 27 member states: Austria, Belgium, Bulgaria, Cyprus, Czech Republic, Denmark, Estonia, Finland, France, Germany, Greece, Hungary, Ireland, Italy, Latvia, Lithuania, Luxembourg, Malta, Netherlands, Poland, Portugal, Romania, Slovakia, Slovenia, Spain, Spain, Sweden and the United Kingdom.

EuroZone GDPYear Period Ending 12/12/11
YearsYears
44
Eurozone includes 27 member states: Austria, Belgium, Bulgaria, Cyprus, Czech Republic, Denmark, Estonia, Finland, France, Germany, Greece, Hungary, Ireland, Italy, Latvia, Lithuania, Luxembourg, Malta, Netherlands, Poland, Portugal, Romania, Slovakia, Slovenia, Spain, Spain, Sweden and the United Kingdom.GDP = Refers to the gross Domestic Product or market value of all final goods and services produced within a country in a given period.

Italy’s Debt Schedule
Source: Bianco Research, LLC, December 2, 2011 45

Workers Per Retiree
46Source: Zerohedge

TAB IVHousing and MBS Market Trends

U.S. Homeownership Rate
70%
60%
65%
Rate
010
‐4.2% drop from 1930‐1940
‐2.7% drop from 2004 2010
55%
meo
wne
rship
900 through 20 2004‐2010
peak–to‐trough
45%
50%Hom 19
40%
Source: U.S. Census Bureau
*1900‐1960 based on Decennial Census Data; 1965‐2010 Annual Census Data
4848

Home Price Index Levels and Year‐Over‐Year (YoY)Change( o )C a ge
210
230 Home Price Index LevelsJanuary 2000 through September 2011
15%
20%Home Price Year‐over‐Year Change
January 2001 through September 2011
130
150
170
190
0%
5%
10%
% Cha
nge
70
90
110
130
S&P Case‐Shiller 20‐City NSA
Core Logic National HPI ‐20%
‐15%
‐10%
‐5%
YoY %
S&P Case‐Shiller 20‐City NSA
Core Logic National HPI
50
Jan‐00
Sep‐00
May‐01
Jan‐02
Sep‐02
May‐03
Jan‐04
Sep‐04
May‐05
Jan‐06
Sep‐06
May‐07
Jan‐08
Sep‐08
May‐09
Jan‐10
Sep‐10
May‐11
‐25%
Jan‐01
Aug
‐01
Mar‐02
Oct‐02
May‐03
Dec‐03
Jul‐0
4
Feb‐05
Sep‐05
Apr‐06
Nov‐06
Jun‐07
Jan‐08
Aug
‐08
Mar‐09
Oct‐09
May‐10
Dec‐10
Jul‐1
1
Source: Bloomberg Financial Services, Case‐ShillerS&P/Case‐Shiller Home Price Index is comprised of price changes within the following subset of 20 metropolitan markets: 10 –City Index Boston, Chicago, Denver, Las Vegas, Los Angeles, Miami, New York, San Diego, San Francisco and Washington DC. In addition to the 10‐City Index it includes: Atlanta, Charlotte, Cleveland, Dallas, Detroit, Minneapolis,
4949
Phoenix, Portland, Seattle, and Tampa.Core Logic National Housing Price Index (HPI) = Core Logic is a leading provider of information and analytics. This index covers 6,208 zip codes, 572 statistical areas and 1,027 counties located in all 50 states and District of Columbia. It is a national average.An investment cannot be made directly in an index.

Median Single‐Family Home Price Relative to Gold1970‐20121970 2012
50Source: Marc Faber, Gloom and Doom, February 1, 2012

Housing Price Declines from Peak by Year & City
Source: U.S. Census Bureau
*1900‐1960 based on Decennial Census Data; 1965‐2010 Annual Census Data
5151
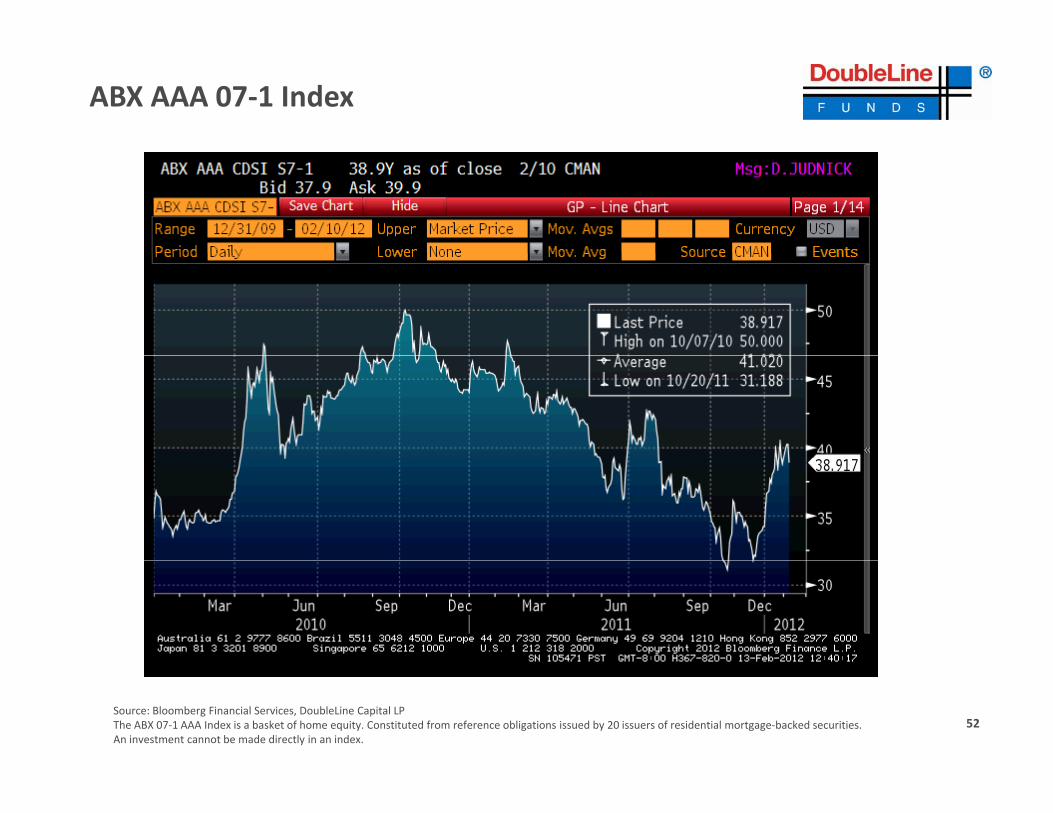
ABX AAA 07‐1 Index
Source: Bloomberg Financial Services, DoubleLine Capital LPThe ABX 07‐1 AAA Index is a basket of home equity. Constituted from reference obligations issued by 20 issuers of residential mortgage‐backed securities.An investment cannot be made directly in an index.
52

Serious Non‐Agency Mortgage DelinquenciesJanuary 31, 2005 through January 31, 2012January 31, 2005 through January 31, 2012
50%
60%
Prime
Alt‐A43.1%
40%
50%
uencies
anua
ry 201
2
Alt A
Subprime
26.7%
20%
30%
0++ Seriou
s Delinq
ary 20
05 th
rough Ja
11.6%
10%
20%6Janu
a
0%
Source: Loan Performance, Vichara, DoubleLine Capital LP
Serious Delinquencies is defined by mortgages that are 60++ delinquency rates defined as loans 60 or 90 days late in mortgage payments, or already in foreclosure or REO status.Prime defined as FICO > 725 and LTV < 75Alt‐A defined as FICO 675‐725; or FICO > 725 and LTV >= 75Subprime defined as FICO < 675
53

Conditional Non‐Agency Mortgage Default RatesJanuary 31, 2005 through January 31, 2012
16%
18%
Prime
Alt‐A
10%
12%
14%
Janu
ary 2012
Subprime
8.8%
8.8%
6%
8%
10%
CDR
ry 2005 through
3.6%
2%
4%Janu
ar
0%
Source: Loan Performance, Vichara, DoubleLine Capital LP
54
Serious Delinquencies is defined by mortgages that are 60++ delinquency rates defined as loans 60 or 90 days late in mortgage payments, or already in foreclosure or REO status.Prime defined as FICO > 725 and LTV < 75Alt‐A defined as FICO 675‐725; or FICO > 725 and LTV >= 75Subprime defined as FICO < 675

Historical Conditional Non‐Agency Mortgage Repayment Rates (CRR)January 31, 2005 through January 31, 2012
40%
45%
Prime
30%
35%
nuary 20
12
Alt‐A
Subprime
15.9%20%
25%
CRR
ry 200
5 through Jan
6.0%
5%
10%
15%
Janu
ar
2.1%
0%
5%
Source: Loan Performance, Vichara, DoubleLine Capital LP
Prime defined as FICO > 725 and LTV < 75Alt‐A defined as FICO 675‐725; or FICO > 725 and LTV >= 75Subprime defined as FICO < 675First lien only
55

Historical Non‐Agency Mortgage Loss SeverityJanuary 31, 2005 through January 31, 2012
75.2%
70%
80%
Prime
Alt‐A
61.7%
50%
60%
uary 2012
Subprime
48.4%
30%
40%
Loss Severity
005 through Janu
10%
20%
Janu
ary 20
0%
Source: Loan Performance, Vichara, DoubleLine Capital LP
Prime defined as FICO > 725 and LTV < 75Alt‐A defined as FICO 675‐725; or FICO > 725 and LTV >= 75Subprime defined as FICO < 675First lien only 56

bl i d i
TAB VDoubleLine Funds Overview

Total Return Bond Fund Portfolio Statistics
Total Return Bond Fund
Barclays Capital U.S. Aggregate Index
Average Price $96.94 $109.55
Duration 2.35 4.86
Average Life 4.61 7.02
Portfolio statistics as of January 31, 2012 based on market weighted averages. Subject to change without notice.
Average price = A measure of the weighted average price paid for the securities calculated by taking the prices and dividing by the number of securities and does not include cash. Average price should not be confused with net asset value.Average Duration = Duration is used as a risk measure. It measures the price volatility of a security given a change in interest rate movements.Average Life = The average number of years that each dollar of unpaid principal due on the mortgage remains outstanding. Average life is computed as the weighted average time to g g y p p p g g g g p g gthe receipt of all future cash flows, using as the weights the dollar amounts of the principal paydowns.
Source: DoubleLine Capital LP
58

Total Return Bond Fund Portfolio Composition –By Security Type
Cash19%
CMBS4%
Non Agency Residential
MBS
Agency Passthrough
MBS31%
12%
Agency CMO
Portfolio composition as of January 31, 2012. Subject to change without notice.Source: DoubleLine Capital LP. Sector allocations are subject to change and should not be considered a recommendation to buy or sell any security.
Cash = The value of assets that can be converted into cash immediately. Can include marketable securities, such as government bonds, banker's acceptances, cash equivalents on balance sheets that may include securities that mature within 90 days
29%
sheets that may include securities that mature within 90 days.Agency Pass‐Throughs = Mortgage pass‐through securities whose principal and interest guaranteed by the U.S. Government agency including Fannie Mae (FNMA) or Freddie Mac (FHLMC).Agency CMO = Collateralized Mortgage Obligation (CMO) is a financial debt vehicle/special purpose entity called a “pool”. Investors buy bonds issued by the entity and receive payments according to a defined set of rules. The mortgages themselves are the collateral, the bonds are the tranches (also called classes), and the set of rules that dictates how money is received from the collateral will be distributed is called the structure. The legal entity, collateral and structure are collectively referred to as the deal.Non‐Agency RMBS = Residential Mortgages Bond Securities are a type of bond backed by residential mortgages. Non‐Agency means they were issued by a private issuer.CMBS = Commercial Mortgage‐Backed Securities. Securitized loans made on commercial rather than residential property.
59

Total Return Bond Fund Portfolio Composition –Agency vs. Non‐Agency Residential Mortgage‐Backed Securities (RMBS)
CashCMBS3.6% Cash
19.2%
Non Agency3 %
3.6%
31.4%
AgencyAgency45.8%
Portfolio composition as of January 31, 2012. Subject to change without notice.Source DoubleLine Capital LP Sector allocations are subject to change and should not be considered a recommendation to buy or sell any securitySource: DoubleLine Capital LP. Sector allocations are subject to change and should not be considered a recommendation to buy or sell any security.
Agency RMBS = Residential mortgage loans guaranteed by the U.S. Government agency including Fannie Mae (FNMA) or Freddie Mac (FHLMC).Non‐Agency RMBS = Residential mortgage‐backed securities are a type of bond backed by residential mortgages. Non‐agency means they were issued by a private issuer.CMBS = Commercial Mortgage‐Backed Securities. Securitized loans made on commercial rather than residential property. 60

Total Return Bond Fund Portfolio Composition –By Security Type
CashCMO Locked
16.7%
IO Current2.3%
IO Locked0.1%
19.2%%
Inverse Floater4 7%CMO Current 4.7%
Pass‐Through17.1%
CMO Current4.9%
Portfolio composition as of January 31, 2012. Subject to change without notice.Source: DoubleLine Capital LP. Sector allocations are subject to change and should not be considered a recommendation to buy or sell any security.
Cash = The value of assets that can be converted into cash immediately. Can include marketable securities, such as government bonds, banker's acceptances, cash equivalents on balance sheets that may include securities that mature within 90 days.Agency Pass‐Throughs = Mortgage pass‐through securities whose principal and interest guaranteed by the U.S. Government agency including Fannie Mae (FNMA) or Freddie Mac (FHLMC).A CMO C ll t li d M t Obli ti (CMO) i fi i l d bt hi l / i l tit ll d “ l” I t b b d i d b th tit d i tAgency CMO = Collateralized Mortgage Obligation (CMO) is a financial debt vehicle/special purpose entity called a “pool”. Investors buy bonds issued by the entity and receive payments according to a defined set of rules. The mortgages themselves are the collateral, the bonds are the tranches (also called classes), and the set of rules that dictates how money is received from the collateral will be distributed is called the structure. The legal entity, collateral and structure are collectively referred to as the deal.IO = Interest Only mortgage pools in which the borrower’s monthly payment is only toward the interest on the loan. A non‐amortized loan.Inverse Floater = A mortgage pool that has a yield that is inversely related to interest rates.Current pay = Loans that are currently receiving principal payments.Locked Out = Loans that for a set period of time will not receive principal payments.
61

Total Return Bond Fund Portfolio –Non‐Agency RMBS Breakdown By Original Rating
AA
A1% NR
13%1%
13%
AAA85%
Portfolio composition and credit ratings as of security origination. Portfolio composition is subject to change without notice. There are some non‐rated securities in the Fund as shown in the graph above. Credit distribution is determined from the highest available credit rating from any Nationally Recognized Statistical Rating Organization (S&P, Moody’s, and Fitch).
Investment Grade = Securities rated AAA to BBB‐ are considered to be investment grade. A bond is considered investment grade if its credit rating is BBB‐ or higher by Standard & $Poor’s or Baa3 by Moody’s. Ratings based on corporate bond model. The higher the rating, the more likely the bond is to pay back at par/$100 cents on the dollar. AAA is considered the
highest quality and the lowest degree of risk. They are considered to be extremely stable and dependable.Below Investment Grade = Also known as “junk bond” is a security rated below investment grade having a rating of BBB‐ or below. These bonds are seen as having higher default risk or other adverse credit events, but typically pay higher yields than better quality bonds in order to make them attractive. They are less likely to pay back at par/$100 cents on the dollar.NR = Not Rated . Securities that are not rated by the three rating agencies.Credit quality may be assessed by different agencies for different bonds for reasons beyond the control of the Fund. Source: DoubleLine Capital LP as of January 31, 2012.
62
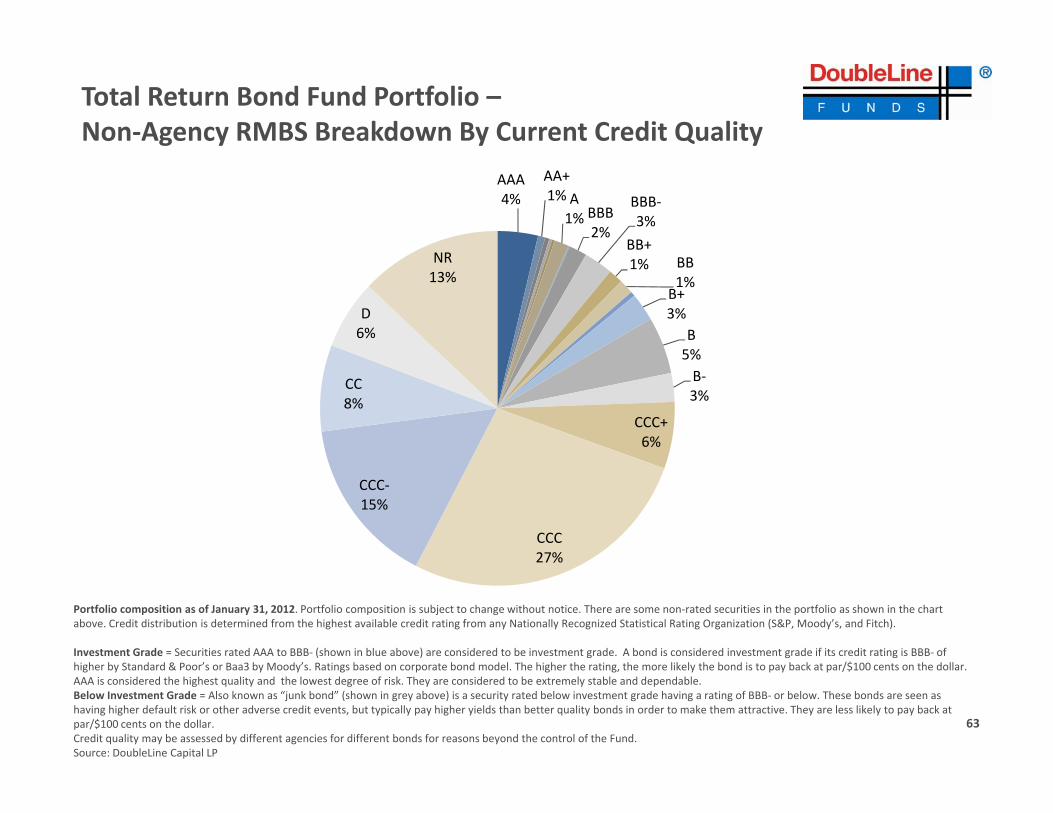
Total Return Bond Fund Portfolio –Non‐Agency RMBS Breakdown By Current Credit Quality
AAA4%
AA+1% A
1% BBB2%
BBB‐3%
BB+NR 1% BB
1%B+3%
B5%
D6%
NR13%
5%B‐3%
CCC+6%
CC8%
CCC27%
CCC‐15%
Portfolio composition as of January 31, 2012. Portfolio composition is subject to change without notice. There are some non‐rated securities in the portfolio as shown in the chart above. Credit distribution is determined from the highest available credit rating from any Nationally Recognized Statistical Rating Organization (S&P, Moody’s, and Fitch).
Investment Grade = Securities rated AAA to BBB‐ (shown in blue above) are considered to be investment grade. A bond is considered investment grade if its credit rating is BBB‐ of hi h b S d d & P ’ B 3 b M d ’ R i b d b d d l Th hi h h i h lik l h b d i b k /$100 h d ll
27%
higher by Standard & Poor’s or Baa3 by Moody’s. Ratings based on corporate bond model. The higher the rating, the more likely the bond is to pay back at par/$100 cents on the dollar. AAA is considered the highest quality and the lowest degree of risk. They are considered to be extremely stable and dependable.Below Investment Grade = Also known as “junk bond” (shown in grey above) is a security rated below investment grade having a rating of BBB‐ or below. These bonds are seen as having higher default risk or other adverse credit events, but typically pay higher yields than better quality bonds in order to make them attractive. They are less likely to pay back at par/$100 cents on the dollar.Credit quality may be assessed by different agencies for different bonds for reasons beyond the control of the Fund. Source: DoubleLine Capital LP
63
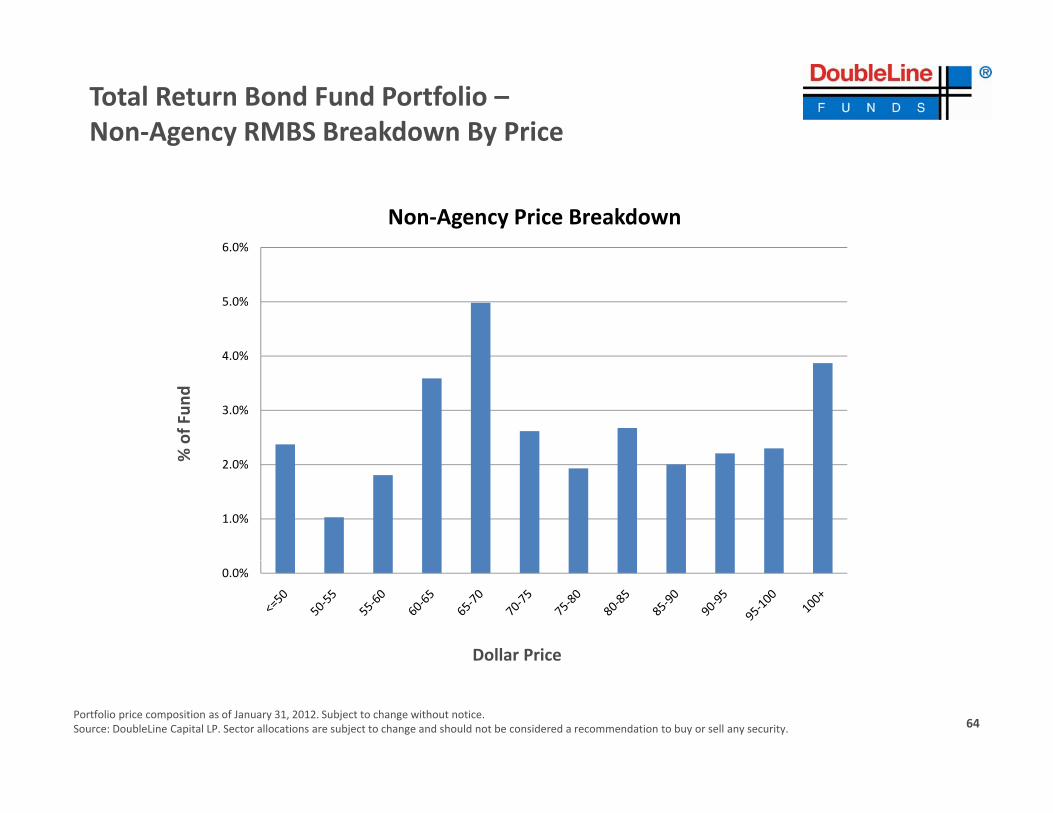
Total Return Bond Fund Portfolio –Non‐Agency RMBS Breakdown By Price
6.0%
Non‐Agency Price Breakdown
4 0%
5.0%
% of Fun
d
3.0%
4.0%
%
1.0%
2.0%
Dollar Price
0.0%
Portfolio price composition as of January 31, 2012. Subject to change without notice. Source: DoubleLine Capital LP. Sector allocations are subject to change and should not be considered a recommendation to buy or sell any security. 64

Core Fixed Income Fund Portfolio Statistics
Core Fixed Income Fund
Barclays Capital U.S Aggregate Index
Average Price $104.35 $109.55
Duration 4.48 4.86
Average Life 6.49 7.02
Portfolio statistics as of January 31, 2012 based on market weighted averages. Subject to change without notice.
Average price = A measure of the weighted average price paid for the securities calculated by taking the prices and dividing by the number of securities and does not include cash. Average price should not be confused with net asset value.Average Duration = Duration is used as a risk measure. It measures the price volatility of a security given a change in interest rate movements. Average Life = The average number of years that each dollar of unpaid principal due on the mortgage remains outstanding. Average life is computed as the weighted average time to g g y p p p g g g g p g gthe receipt of all future cash flows, using as the weights the dollar amounts of the principal paydowns.
Source: DoubleLine Capital LP
65

Core Fixed Income Fund Portfolio CompositionC i l
Cash5%
I t t G d
Commercial Mortgage‐Backed
Securities2%
Government21%
Investment Grade Corporate
22%
Emerging Markets10%
Mortgage‐Backed Securities
41%
Portfolio composition as of January 31, 2012. Subject to change without notice.
Cash = Cash holdings are les than 1% at 0.33% and therefore are not reflected in the chart above. Cash holding include the value of assets that can be converted into cash immediately. Can include marketable securities, such as government bonds, banker's acceptances, cash equivalents on balance sheets that may include securities that mature within 90 days.Government = Government debt (also known as public debt or national debt) is money (or credit) owed by any level of government; either central government, federal government, municipal government or local government. Mortgage‐Backed Securities = A mortgage‐backed security (MBS) is an asset‐backed security or debt obligation that represents a claim on the cash flows from mortgage loans, most
l id i lcommonly on residential propertyEmerging Markets Fixed Income = Emerging market debt (EMD) is a term used to encompass bonds issued by less developed countries.Investment Grade and High Yield Corporates = Investment grade and non‐investment grade corporate credit. Bonds issued by corporations to raise money in order to expand its business. Credit distribution is determined from the highest available credit rating from any Nationally Recognized Statistical Rating Organization (S&P, Moody’s, and Fitch). A bond rated BBB or higher would be considered Investment Grade. Any bond rated BBB or below would be High Yield.Source: DoubleLine Capital LP. Sector allocations are subject to change and should not be considered a recommendation to buy or sell any security.
66

Core Fixed Income Fund Portfolio Credit Quality Breakdown
UnratedCash4.6%
Below Investment
Grade14.2%
Unrated Securities1.4%
Government20.6%
Agency
Investment Grade34 0%
25.2%34.0%
Portfolio composition and credit ratings as of January 31, 2012. Portfolio composition is subject to change without notice. Credit distribution is determined from the highest available credit rating from any Nationally Recognized Statistical Rating Organization (S&P, Moody’s, and Fitch).
Cash = The value of assets that can be converted into cash immediately. Can include marketable securities, such as government bonds, banker's acceptances, cash equivalents on balance sheets that may include securities that mature within 90 days.Government = Government debt (also known as public debt or national debt) is money (or credit) owed by any level of government; either central government, federal government, municipal government or local government. A M t iti h i i l d i t t ff ti l t d b th U S G t i l di F i M (FNMA) F ddi M (FHLMC)Agency = Mortgage securities whose principal and interest are effectively guaranteed by the U.S. Government agency including Fannie Mae (FNMA) or Freddie‐Mac (FHLMC).Investment Grade = A bond is considered investment grade if its credit rating is BBB‐ of higher by Standard & Poor’s or Baa3 by Moody’s. Ratings based on corporate bond model. The higher the rating, the more likely the bond is to pay back at par/$100 cents on the dollar.Below Investment Grade = Also known as “junk bond” is a security rated below investment grade. These bonds are seen as having higher default risk or other adverse credit events, but typically pay higher yields than better quality bonds in order to make them attractive. They are less likely to pay back at par/$100 cents on the dollar.Credit quality may be assessed by different agencies for different bonds for reasons beyond the control of the Fund. Source: DoubleLine Capital LP.
67

“The Decline and Fall of the Roman Empire”
Live Webcast hosted by:
Jeffrey Gundlach
Chief Executive Officer
February 14, 2011

Announcements
Webcast News –
Luz Padilla – March 6, 2012Emerging Markets Fixed Income FundMarch 6, 2012 1:15 pm PT
Philip Barach – March 13, 2012Philip Barach March 13, 2012Low Duration Bond FundMarch 13, 2012 1:15 pm PT
Jeffrey Gundlach – March 20 2012Jeffrey Gundlach March 20, 2012Aston/DoubleLine Core Plus Fixed Income FundMarch 20, 2012 1:00 pm PT/4:00 pm ETPlease visit www.astonfunds.com
To Receive Presentation Slides:You can [email protected]@doubleline.com
69References to other mutual funds should not be interpreted as an offer of these securities. The Aston/DoubleLine Core Plus Fixed Income Fund is not distributed by Quasar Distributors, LLC.

TAB VIAppendixTAB VI
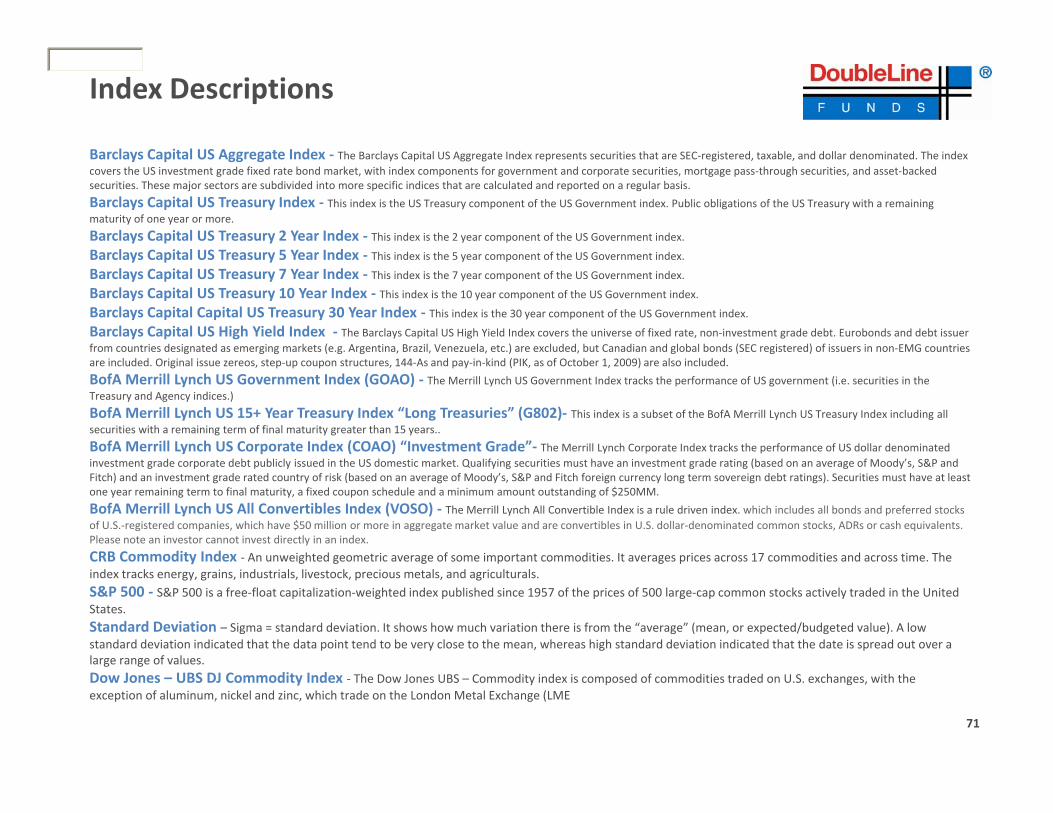
Index Descriptions
B l C it l US A t I dBarclays Capital US Aggregate Index ‐ The Barclays Capital US Aggregate Index represents securities that are SEC‐registered, taxable, and dollar denominated. The index covers the US investment grade fixed rate bond market, with index components for government and corporate securities, mortgage pass‐through securities, and asset‐backed securities. These major sectors are subdivided into more specific indices that are calculated and reported on a regular basis.
Barclays Capital US Treasury Index ‐ This index is the US Treasury component of the US Government index. Public obligations of the US Treasury with a remaining maturity of one year or more.
Barclays Capital US Treasury 2 Year Index ‐ This index is the 2 year component of the US Government index.
Barclays Capital US Treasury 5 Year Index Thi i d i th 5 t f th US G t i dBarclays Capital US Treasury 5 Year Index ‐ This index is the 5 year component of the US Government index.
Barclays Capital US Treasury 7 Year Index ‐ This index is the 7 year component of the US Government index.
Barclays Capital US Treasury 10 Year Index ‐ This index is the 10 year component of the US Government index.
Barclays Capital Capital US Treasury 30 Year Index ‐ This index is the 30 year component of the US Government index.
Barclays Capital US High Yield Index ‐ The Barclays Capital US High Yield Index covers the universe of fixed rate, non‐investment grade debt. Eurobonds and debt issuerfrom countries designated as emerging markets (e.g. Argentina, Brazil, Venezuela, etc.) are excluded, but Canadian and global bonds (SEC registered) of issuers in non‐EMG countries are included. Original issue zereos, step‐up coupon structures, 144‐As and pay‐in‐kind (PIK, as of October 1, 2009) are also included.
BofA Merrill Lynch US Government Index (GOAO) ‐ The Merrill Lynch US Government Index tracks the performance of US government (i.e. securities in the Treasury and Agency indices.)
BofA Merrill Lynch US 15+ Year Treasury Index “Long Treasuries” (G802)‐ This index is a subset of the BofA Merrill Lynch US Treasury Index including all securities with a remaining term of final maturity greater than 15 years..
BofA Merrill Lynch US Corporate Index (COAO) “Investment Grade”‐ The Merrill Lynch Corporate Index tracks the performance of US dollar denominated investment grade corporate debt publicly issued in the US domestic market. Qualifying securities must have an investment grade rating (based on an average of Moody’s, S&P and Fitch) and an investment grade rated country of risk (based on an average of Moody’s, S&P and Fitch foreign currency long term sovereign debt ratings). Securities must have at least one year remaining term to final maturity, a fixed coupon schedule and a minimum amount outstanding of $250MM.
BofA Merrill Lynch US All Convertibles Index (VOSO) ‐ The Merrill Lynch All Convertible Index is a rule driven index. which includes all bonds and preferred stocks of U.S.‐registered companies, which have $50 million or more in aggregate market value and are convertibles in U.S. dollar‐denominated common stocks, ADRs or cash equivalents. Please note an investor cannot invest directly in an index.
CRB Commodity Index ‐ An unweighted geometric average of some important commodities. It averages prices across 17 commodities and across time. TheCRB Commodity Index An unweighted geometric average of some important commodities. It averages prices across 17 commodities and across time. The index tracks energy, grains, industrials, livestock, precious metals, and agriculturals.S&P 500 ‐ S&P 500 is a free‐float capitalization‐weighted index published since 1957 of the prices of 500 large‐cap common stocks actively traded in the United States.Standard Deviation – Sigma = standard deviation. It shows how much variation there is from the “average” (mean, or expected/budgeted value). A lowstandard deviation indicated that the data point tend to be very close to the mean, whereas high standard deviation indicated that the date is spread out over a large range of values.large range of values.Dow Jones – UBS DJ Commodity Index ‐ The Dow Jones UBS – Commodity index is composed of commodities traded on U.S. exchanges, with the exception of aluminum, nickel and zinc, which trade on the London Metal Exchange (LME
71
getIndexA1U.S. AggrIWS?requBack to In

Index DescriptionsB fA M ill L h US D ll E i M k t S i Pl I d (IGOV)BofA Merrill Lynch US Dollar Emerging Markets Sovereign Plus Index (IGOV)This index tracks the performance of US dollar denominated emerging market and cross‐over sovereign debt publicly issued in the eurobond or US domestic market. Qualifying countries must have a BB1 or lower foreign currency long‐term sovereign debt rating (based on an average of Moody’s, S&P, and Fitch).
BofA Merrill Lynch U.S. High Yield Cash Pay Index (J0A0) “Below Investment Grade”‐The Merrill Lynch High Yield Index tracks the performance of US dollar denominated below investment grade corporate debt, currently in a coupon paying period, that is publicly issued in the US domestic market. Qualifying securities must have a below investment grade rating (based on an average of Moody’s, S&P and Firth foreign currency long term sovereign debt ratings). Must have one year remaining to final maturity and a minimum outstanding amount of $100MM.g ) y g y g $
BofA Merrill Lynch International Government Index (NOGO)The Merrill Lynch International Index tracks the performance of Australia, Canadian, French, German, Japan, Dutch, Swiss and UK investment grade sovereign debt publicly issued and denominated in the issuer’s own domestic market and currency. Qualifying securities must have at least one year remaining term to final maturity, a fixed coupon schedule and a minimum amount outstanding.
BofA Merrill Lynch Mortgage‐Backed Securities Index (MOA0)This index tracks the performance of US dollar denominated fixed rate and hybrid residential mortgage pass‐through securities publicly issued by US agencies in the US domestic
k t 30 20 15 d i t t l fi d t t l i l d d i th I d id d th h t l t i i t t fi l t it dmarket. 30‐year, 20‐year, 15‐year and interest only fixed rate mortgage pools are included in the Index provided they have at least one year remaining term to final maturity and a minimum amount outstanding of at least $5 billion per generic coupon and $250MM per production year within each generic coupon.
BofA Merrill Lynch U.S. Municipal Securities Index (UOA0)This index tracks the performance of US dollar denominated investment grade tax‐exempt debt publicly issued by US states and territories, and their political subdivisions, in the US domestic market. Qualifying securities must have at least one year remaining term to final maturity, a fixed coupon schedule and an investment grade rating (based on Moody’s, S&P and Fitch). Minimum size vary based on the initial term to final maturity at time of issuance.
Barclays Capital Global Emerging Markets Index ‐ The Barclays Capital Global Emerging Markets Index represents the union of the USD‐denominated US Emerging y p g g y p g g p g gMarkets index and the predominately EUR‐denominated Pan Euro Emerging Markets Index, covering emerging markets in the following regions: Americas, Europe, Middle East, Africa, and Asia. As with other fixed income benchmarks provided by Barclays Capital, the index is rules‐based, which allows for an unbiased view of the marketplace and easy replicability.
JP Morgan Investment Grade Corporate Index ‐ JP Morgan Investment Grade Corporate Index includes performance of US dollar denominated investment grade corporate debt publicly issued in the US domestic market. Qualifying securities must have an investment grade rating (based on an average of Moody’s, S&P and Fitch) and an investment grade rated country of risk (based on an average of Moody’s, S&P and Fitch foreign currency long term sovereign debt ratings). Securities must have at least one year
remaining term to final maturity, a fixed coupon schedule and a minimum amount outstanding of $250MM.Draw Down ‐ The peak‐to‐trough decline during a specific record period of an investment, fund or commodity. A drawdown is usually quoted as the percentage between the peak and the trough.
NAV – A mutual fund's price per share or exchange‐traded fund's (ETF) per‐share value. In both cases, the per‐share dollar amount of the fund is calculated by dividing the total value of all the securities in its portfolio, less any liabilities, by the number of fund shares outstanding.
CMO – A type of mortgage‐backed security that creates separate pools of pass‐through rates for different classes of bondholders with varying maturities, called tranches. The repayments from the pool of pass‐through securities are used to retire the bonds in the order specified by the bonds' prospectus
TIPSTIPS– Treasury Inflation Protection. A treasury security that is indexed to inflation in order to protect investors from the negative effects of inflation. TIPS are considered an extremely low‐risk investment since they are backed by the U.S. government and since their par value rises with inflation, as measured by the Consumer Price Index, while their interest rate remains fixed.
CPI– Consumer Price Index. A measure that examines the weighted average of prices of a basket of consumer goods and services, such as transportation, food and medical care.Cash Flow – Cash flow measures the cash generating capability of a company by adding non‐cash charges (e.g. depreciation) and interest expense to pretax income.
72
getIndexA1U.S. AggrIWS?requBack to In

Index DescriptionsBofA Merrill Lynch US Treasury Index (G0Q0) ‐The Merrill Lynch US Treasury Index tracks the performance of US dollar denominated sovereign debt publicly issued by the US government in its domestic market. Qualifying securities must have at least one year remaining term to final maturity, a fixed coupon schedule y g y g y g y pand a minimum amount outstanding of $1 billion.BofA Merrill Lynch US 10‐15 Year Treasury Index “Long Treasury”‐The Merrill Lynch US 10‐15 Treasury Index tracks the performance of US dollar denominated 10‐15 year sovereign debt publicly issued by the US government in its domestic market. It is a subset of the BofA Merrill Lynch U.S. Treasury Index (GOQO).BofA/Merrill Lynch High Yield Cash Pay CCC –rated Index (JOA3) – .A component of the BofA/Merrill Lynch High Yield Cash Pay Index concentrating on CCC rated High Yield credit only. BofA/Merrill Lynch High Yield Cash Pay BB–rated Index (JOA1) – .A component of the BofA/Merrill Lynch High Yield Cash Pay Index concentrating on BB rated Hi h Yi ld dit lHigh Yield credit only.BofA/Merrill Lynch High Yield Cash Pay B–rated Index (JOA2) – .A component of the BofA/Merrill Lynch High Yield Cash Pay Index concentrating on B rated High Yield credit only.BofA/Merrill Lynch Credit Index BBB‐rated Index (COA4) – .A component of the BofA/Merrill Lynch Credit Index concentrating on the lower rated BBB investment grade credits.BofA/Merrill Lynch Credit Index A–rated Index (COA3) – . A component of the BofA/Merrill Lynch Credit Index concentrating on the A rated investment grade credits.credits.BofA/Merrill Lynch Credit Index AAA –rated Index (COA1) – . A component of the BofA/Merrill Lynch Credit Index concentrating on the highest rated AAA investment grade credits.Dow Jones – UBS Commodity Index ‐ The Dow Jones UBS – Commodity index is composed of commodities traded on U.S. exchanges, with the exception of aluminum, nickel and zinc, which trade on the London Metal Exchange (LME).Shanghai Index ‐ The Shanghai Stock Exchange Composite is a capitalization‐weighted index tracking daily price performance of all A and B‐shares listed on the Shanghai Stock Exchange. This index was developed December 19, 1990 with a base value of 100.
/S&P/Case‐Shiller Composite Home Price Index ‐ The Case‐Shiller Home Price Indices, one comprised of price changes within all 20 metropolitan markets, and another comprised of price changes within the following subset of 10 metropolitan markets: Boston, Chicago, Denver, Las Vegas, Los Angeles, Miami, New York, San Diego, San Francisco and Washington DC. In addition to those 10 markets, the 20‐Home Price index reflects price changes for Atlanta, Charlotte, Dallas, Detroit, Minneapolis, Phoenix, Portland, Seattle and Tampa.Dow Jones Industrial Average – Also known as the “DOW” is a stock market index that includes 30 large publically owned companies based in the U.S. have traded during a standard trading session in the stock market.NASDAQ‐ A computerized system that facilitates trading and provides price quotations on more than 5 000 of the more actively traded over the counter stocksNASDAQ A computerized system that facilitates trading and provides price quotations on more than 5,000 of the more actively traded over the counter stocks. Created in 1971, the Nasdaq was the world's first electronic stock market.Transports‐ The Industrials Sector includes companies whose businesses are dominated by one of the following activities: The manufacture and distribution of capital goods, including aerospace & defense, construction, engineering & building products, electrical equipment and industrial machineryUtilities‐ A public utility is a business that furnishes an everyday necessity to the public at large. Public utilities provide water, electricity, natural gas, telephone service, and other essentials. Utilities may be publicly or privately owned, but most are operated as private businesses.Basis Point‐ A basis point is a unit that is equal to 1/100th of 1%, and is used to denote the change in a financial instrument.REIT‐ Real Estate Trust. A security that sells like a stock on the major exchanges and invests in real estate directly, either through properties or mortgagesDuration – Duration is a commonly used measure of the potential volatility of the price of a debt security, or the aggregate market value of a portfolio of debt securities, prior to maturity. Securities with a longer duration generally have more volatile prices than securities of comparable quality with a shorter duration.Book Value – Book value is the net asset value of a company, calculated by subtracting total liabilities form total assets.Prime X Index – Prime X is an index offered by Markit. It allows investors to synthetically gain exposure to non‐agency Prime residential mortgage collateral. An investment cannot be made directly in and index.
73
getIndexA1U.S. AggrIWS?requBack to In

Index DescriptionsBofA Merrill Lynch 10 Year US Treasury Index (G0Q0) ‐ The Merrill Lynch US 10 year Treasury Index tracks the performance of US dollar denominated 10 year sovereign debt publicly issued by the US government in its domestic market It is a subset of the BofA Merrill Lynch U S Treasury Index (GOQO)sovereign debt publicly issued by the US government in its domestic market. It is a subset of the BofA Merrill Lynch U.S. Treasury Index (GOQO).BofA Merrill Lynch US 30 Year Treasury Index The Merrill Lynch US 30 year Treasury Index tracks the performance of US dollar denominated 30 year sovereign debt publicly issued by the US government in its domestic market. It is a subset of the BofA Merrill Lynch U.S. Treasury Index (GOQO).Dow Jones, Credit Suisse Index (DJCSIN10) – .Aims to reflect changes in the long‐term inflation expectations embedded in the US government bond market by tracking a long position in on‐the‐run 10‐year TIPS bonds, and a duration‐adjusted short position in the closest maturity Treasury to the OTR TIPS.. Citigroup TIPS (SBUSILSI)– . It measures the returns of the inflation‐linked bonds with fixed‐rate coupon payments that are linked to an inflation index. The price of each issue in the USLSI is adjusted by using an index ratio. The index ratio is determined by dividing the current inflation index level by the inflation index level at the time of issue of the security. The inflation index is published on a monthly basis, and the intra‐month index ratio is calculated using linear interpolation.Barclays Capital 5 Year TIPS (BXIIUL05) – .Barclays Capital 5‐year TIPS on‐the‐run index quoted in US Dollars traded intraday.Barclays Capital 10 Year TIPS (BXIIUL10) – . Barclays Capital 10‐year TIPS on‐the‐run index quoted in US Dollars traded intradayBarclays Capital 20 Year TIPS (BXIIUL20)– . Barclays Capital 20‐year TIPS on‐the‐run index quoted in US Dollars traded intradayBarclays Capital US MBS Index ‐ covers the mortgage‐backed pass‐through securities of Ginnie Mae (GNMA), Fannie Mae (FNMA), and Freddie Mac (FHLMC). The MBS Index is formed by grouping the universe of over 600 000 individual fixed rate MBS pools into approximately 3 500 generic aggregatesMBS Index is formed by grouping the universe of over 600,000 individual fixed rate MBS pools into approximately 3,500 generic aggregates.Barclays Capital US 30 Year TIPS Index ‐ . Barclays Capital 30‐year TIPS on‐the‐run index quoted in US Dollars traded intraday
74
getIndexA1U.S. AggrIWS?requBack to In

Disclaimer
Important Information Regarding This ReportIssue selection processes and tools illustrated throughout this presentation are samples and may be modified periodically. Such charts are not the only tools used by the investment teams, are extremely sophisticated, may not always produce the intended results and are not intended for use by non‐professionals.DoubleLine has no obligation to provide revised assessments in the event of changed circumstances. While we have gathered this information from sources believed to be reliable, DoubleLine cannot guarantee the accuracy of the information provided. Securities discussed are not recommendations and are presented as examples of issue selection or portfolio management processes They have been picked for comparison or illustration purposes only No security presentedas examples of issue selection or portfolio management processes. They have been picked for comparison or illustration purposes only. No security presented within is either offered for sale or purchase. DoubleLine reserves the right to change its investment perspective and outlook without notice as market conditions dictate or as additional information becomes available.Important Information Regarding Risk FactorsInvestment strategies may not achieve the desired results due to implementation lag, other timing factors, portfolio management decision‐making, economic or market conditions or other unanticipated factors. The views and forecasts expressed in this material are as of the date indicated, are subject to change without notice, may not come to pass and do not represent a recommendation or offer of any particular security, strategy, or investment. Past performance is no , y p p y p y, gy, pguarantee of future results.Important Information Regarding DoubleLineIn preparing the client reports (and in managing the portfolios), DoubleLine and its vendors price separate account portfolio securities using various sources, including independent pricing services and fair value processes such as benchmarking. To receive a complimentary copy of DoubleLine’s current Form ADV Part II (which contains important additional disclosure information), a copy of the DoubleLine’s proxy voting policies and procedures, or to obtain additional information on DoubleLine’s proxy voting decisions, please contact DoubleLine’s Client Services. Important Information Regarding DoubleLine’s Investment StyleDoubleLine seeks to maximize investment results consistent with our interpretation of client guidelines and investment mandate. While DoubleLine seeks to maximize returns for our clients consistent with guidelines, DoubleLine cannot guarantee that DoubleLine will outperform a client's specified benchmark. Additionally, the nature of portfolio diversification implies that certain holdings and sectors in a client's portfolio may be rising in price while others are falling; or, that some issues and sectors are outperforming while others are underperforming. Such out or underperformance can be the result of many factors, such as but not limited to duration/interest rate exposure, yield curve exposure, bond sector exposure, or news or rumors specific to a single name.D bl Li i ti d ill dj t th iti f li t’ tf li i t t ith i t t t ’ j d t i k tDoubleLine is an active manager and will adjust the composition of client’s portfolios consistent with our investment team’s judgment concerning market conditions and any particular security. The construction of DoubleLine portfolios may differ substantially from the construction of any of a variety of bond market indices. As such, a DoubleLine portfolio has the potential to underperform or outperform a bond market index. Since markets can remain inefficiently priced for long periods, DoubleLine’s performance is properly assessed over a full multi‐year market cycle.
References to other Funds should not be interpreted as an offer of those securities.Diversification does not assure a profit or protect against a loss in a declining market.Diversification does not assure a profit or protect against a loss in a declining market.Opinions expressed are subject to change at any time, are not a guarantee and should not be considered investment advice.
© 2012 DoubleLine Capital LP75
Announcements
Webcast News –
Luz Padilla – March 6, 2012Emerging Markets Fixed Income FundMarch 6, 2012 1:15 pm PT
Philip Barach – March 13, 2012Philip Barach March 13, 2012Low Duration Bond FundMarch 13, 2012 1:15 pm PT
Jeffrey Gundlach – March 20 2012Jeffrey Gundlach March 20, 2012Aston/DoubleLine Core Plus Fixed Income FundMarch 20, 2012 1:00 pm PT/4:00 pm ETPlease visit www.astonfunds.com
To Receive Presentation Slides:You can [email protected]@doubleline.com
76References to other mutual funds should not be interpreted as an offer of these securities. The Aston/DoubleLine Core Plus Fixed Income Fund is not distributed by Quasar Distributors, LLC.