Embed Size (px)
Citation preview

Semi-Annual ReportMarch 31, 2017
DoubleLine Opportunistic Credit FundNYSE: DBL
DoubleLine Capital LP 333 S. Grand Avenue18th FloorLos Angeles, California 90071
doubleline.com
DoubleLineF U N D S
®
Table of Contents
Page
Chairman’s Letter 4
Financial Markets Highlights 5
Management’s Discussion of Fund Performance 6
Standardized Performance Summary 8
Schedule of Investments 9
Statement of Assets and Liabilities 13
Statement of Operations 14
Statements of Changes in Net Assets 15
Statement of Cash Flows 16
Financial Highlights 17
Notes to Financial Statements 18
Evaluation of Advisory Agreement by the Board of Trustees 26
Federal Tax Information 30
Additional Information Regarding the Fund’s Investment Activities 31
Portfolio Managers 33
Information About Proxy Voting 33
Information About Portfolio Holdings 33
Householding — Important Notice Regarding Delivery of Shareholder Documents 33
Fund Certification 33
Proxy Results 33
Dividend Reinvestment Plan 34
Privacy Notice 36
Semi-Annual Report March 31, 2017 3
Chairman’s Letter(Unaudited)
March 31, 2017
DoubleLineF U N D S
®
Dear Shareholder,
On behalf of the team at DoubleLine, I am pleased to deliver the Semi-Annual Report for the DoubleLine OpportunisticCredit Fund (NYSE: DBL, the “Fund”) for the 6-month period ended March 31, 2017. On the following pages, you will findspecific information regarding the Fund’s operations and holdings. In addition, we discuss the Fund’s investmentperformance and the main drivers of that performance during the reporting period.
If you have any questions regarding the Fund, please don’t hesitate to call us at 877-DLine11 (877-354-6311), or visit ourwebsite www.doublelinefunds.com where our investment management team offers deeper insights and analysis onrelevant capital market activity impacting investors today. We value the trust that you have placed with us, and we willcontinue to strive to offer thoughtful investment solutions to our shareholders.
Sincerely,
Ronald R. Redell, CFAChairman of the Board of TrusteesDoubleLine Opportunistic Credit FundMay 1, 2017
4 DoubleLine Opportunistic Credit Fund
Financial Markets Highlights(Unaudited)
March 31, 2017
Š Agency Mortgage-Backed Securities (Agency MBS)
For the 6-month period ended March 31, 2017, the Bloomberg Barclays U.S. MBS Index had a return of -1.51% with its durationextending from 2.50 to 4.95 years. During the period, U.S. Treasury yields increased across the curve with 2-year yields increasing by0.49% and 10-year yields increasing by 0.79%. Aggregate prepayment speeds for Ginnie Mae, Fannie Mae, and Freddie Mac declined byabout 42%. Though this appears to be a large decline nominally, speeds only declined by about 8 CPR (Conditional Prepayment Rate)and still remain on the slower end of the range historically. Total gross Agency MBS issuance has been roughly $800 billion sinceSeptember 2016, which was largely attributable to the high volume of issuance towards the latter half of 2016, with borrowers takingadvantage of historically low 30-year mortgage rates (based on Freddie Mac U.S. 30-year Commitment Rates). Overall refinancingactivity, as measured by Mortgage Bankers Association (MBA) U.S. Refinancing Index Seasonally-Adjusted, declined, while purchasingactivity, as measured by MBA Purchase Index Seasonally-Adjusted, increased during this time. Coupon spreads against U.S. Treasury5-year and 10-year yields were at the tightest at the end of 2016 and continue to be range bound for most of 2017 thus far, fueled bystrong demand from domestic banks, and foreign investors with the Federal Reserve (Fed) continuing to reinvest their paydowns ofmortgages.
Š Non-Agency Mortgage-Backed Securities (Non-Agency MBS)
For the 6-month period ended March 31, 2017, non-Agency MBS spreads continued to tighten in conjunction with a tightening incredit spreads in general. Investment Grade Corporate, High Yield (HY), and Structured Products all tightened during the reportingperiod. Contributing to the tightening of spreads has been an improvement in housing fundamentals, primarily home priceappreciation, and the technicals of the non-Agency MBS market where no new securities have been created since the financial crisis,leading to a supply and demand imbalance.
Š Commercial Mortgage-Backed Securities (CMBS)
For the 6-month period ended March 31, 2017, new issue CMBS spreads tightened alongside broader credit and equity indices. Duringthe period, the Bloomberg Barclays U.S. CMBS Index ERISA Eligible Total Return Value returned -2.19%, underperforming the broaderBloomberg Barclays U.S. Aggregate Bond Index return of -2.18%. While the post-election, risk-on sentiment led to spread tighteningdue to a lower required risk premium, CMBS yields were mixed for the period given a rise in 10-year swap yields. Both indices sawnegative returns for the reporting period as cash was allocated away from fixed income products and into equities. For the reportingperiod, 10-year AAA last cash flows (LCFs) tightened by 0.21% to 0.94% over swaps while BBB- bonds tightened by 1.35% to 4.40% overswaps. Seven private label transactions priced in March 2017, which was 1.6 times higher than February 2017 and roughly in line withMarch 2016. The delinquency rate for U.S. Commercial Real Estate loans is now 5.37%, up 0.59% over the period, and 1.15% year-over-year as 10-year loans originated in 2006/2007 face difficulty refinancing at maturity.
Š Collateralized Loan Obligations (CLOs)
For the 6-month period ended March 31, 2017, CLOs saw a surge in issuance as we approached year-end and then a lull at thebeginning of 2017. On average, each month during the reporting period saw about $7 billion in monthly issuance, bringing the totalissuance to $43 billion for the period. The resurgence in the new issue market generally can be attributed to both the strength in theloan market and managers trying to issue deals ahead of the implementation of the Dodd-Frank Risk Retention rules at the end of2016. The CLO refinancing and resetting remained extremely active over the period. Refinancing and resetting allows managers to takeadvantage of cheaper financing without the cost of ramping an entirely new deal. Spreads continued to tighten over the period,especially in the mezzanine space during the first quarter of 2017.
Semi-Annual Report March 31, 2017 5
Management’s Discussion of Fund Performance(Unaudited)
March 31, 2017
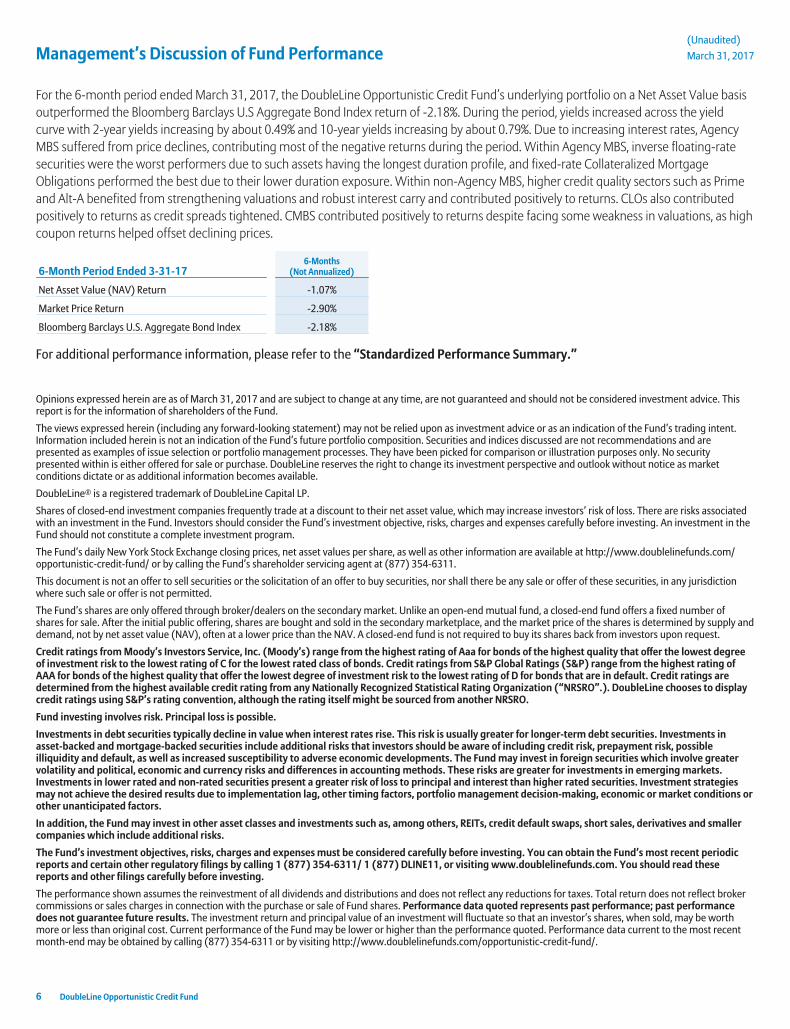
For the 6-month period ended March 31, 2017, the DoubleLine Opportunistic Credit Fund’s underlying portfolio on a Net Asset Value basisoutperformed the Bloomberg Barclays U.S Aggregate Bond Index return of -2.18%. During the period, yields increased across the yieldcurve with 2-year yields increasing by about 0.49% and 10-year yields increasing by about 0.79%. Due to increasing interest rates, AgencyMBS suffered from price declines, contributing most of the negative returns during the period. Within Agency MBS, inverse floating-ratesecurities were the worst performers due to such assets having the longest duration profile, and fixed-rate Collateralized MortgageObligations performed the best due to their lower duration exposure. Within non-Agency MBS, higher credit quality sectors such as Primeand Alt-A benefited from strengthening valuations and robust interest carry and contributed positively to returns. CLOs also contributedpositively to returns as credit spreads tightened. CMBS contributed positively to returns despite facing some weakness in valuations, as highcoupon returns helped offset declining prices.
6-Month Period Ended 3-31-176-Months
(Not Annualized)
Net Asset Value (NAV) Return -1.07%
Market Price Return -2.90%
Bloomberg Barclays U.S. Aggregate Bond Index -2.18%
For additional performance information, please refer to the “Standardized Performance Summary.”
Opinions expressed herein are as of March 31, 2017 and are subject to change at any time, are not guaranteed and should not be considered investment advice. Thisreport is for the information of shareholders of the Fund.
The views expressed herein (including any forward-looking statement) may not be relied upon as investment advice or as an indication of the Fund’s trading intent.Information included herein is not an indication of the Fund’s future portfolio composition. Securities and indices discussed are not recommendations and arepresented as examples of issue selection or portfolio management processes. They have been picked for comparison or illustration purposes only. No securitypresented within is either offered for sale or purchase. DoubleLine reserves the right to change its investment perspective and outlook without notice as marketconditions dictate or as additional information becomes available.
DoubleLine® is a registered trademark of DoubleLine Capital LP.
Shares of closed-end investment companies frequently trade at a discount to their net asset value, which may increase investors’ risk of loss. There are risks associatedwith an investment in the Fund. Investors should consider the Fund’s investment objective, risks, charges and expenses carefully before investing. An investment in theFund should not constitute a complete investment program.
The Fund’s daily New York Stock Exchange closing prices, net asset values per share, as well as other information are available at http://www.doublelinefunds.com/opportunistic-credit-fund/ or by calling the Fund’s shareholder servicing agent at (877) 354-6311.
This document is not an offer to sell securities or the solicitation of an offer to buy securities, nor shall there be any sale or offer of these securities, in any jurisdictionwhere such sale or offer is not permitted.
The Fund’s shares are only offered through broker/dealers on the secondary market. Unlike an open-end mutual fund, a closed-end fund offers a fixed number ofshares for sale. After the initial public offering, shares are bought and sold in the secondary marketplace, and the market price of the shares is determined by supply anddemand, not by net asset value (NAV), often at a lower price than the NAV. A closed-end fund is not required to buy its shares back from investors upon request.
Credit ratings from Moody’s Investors Service, Inc. (Moody’s) range from the highest rating of Aaa for bonds of the highest quality that offer the lowest degreeof investment risk to the lowest rating of C for the lowest rated class of bonds. Credit ratings from S&P Global Ratings (S&P) range from the highest rating ofAAA for bonds of the highest quality that offer the lowest degree of investment risk to the lowest rating of D for bonds that are in default. Credit ratings aredetermined from the highest available credit rating from any Nationally Recognized Statistical Rating Organization (“NRSRO”.). DoubleLine chooses to displaycredit ratings using S&P’s rating convention, although the rating itself might be sourced from another NRSRO.
Fund investing involves risk. Principal loss is possible.
Investments in debt securities typically decline in value when interest rates rise. This risk is usually greater for longer-term debt securities. Investments inasset-backed and mortgage-backed securities include additional risks that investors should be aware of including credit risk, prepayment risk, possibleilliquidity and default, as well as increased susceptibility to adverse economic developments. The Fund may invest in foreign securities which involve greatervolatility and political, economic and currency risks and differences in accounting methods. These risks are greater for investments in emerging markets.Investments in lower rated and non-rated securities present a greater risk of loss to principal and interest than higher rated securities. Investment strategiesmay not achieve the desired results due to implementation lag, other timing factors, portfolio management decision-making, economic or market conditions orother unanticipated factors.
In addition, the Fund may invest in other asset classes and investments such as, among others, REITs, credit default swaps, short sales, derivatives and smallercompanies which include additional risks.
The Fund’s investment objectives, risks, charges and expenses must be considered carefully before investing. You can obtain the Fund’s most recent periodicreports and certain other regulatory filings by calling 1 (877) 354-6311/ 1 (877) DLINE11, or visiting www.doublelinefunds.com. You should read thesereports and other filings carefully before investing.
The performance shown assumes the reinvestment of all dividends and distributions and does not reflect any reductions for taxes. Total return does not reflect brokercommissions or sales charges in connection with the purchase or sale of Fund shares. Performance data quoted represents past performance; past performancedoes not guarantee future results. The investment return and principal value of an investment will fluctuate so that an investor’s shares, when sold, may be worthmore or less than original cost. Current performance of the Fund may be lower or higher than the performance quoted. Performance data current to the most recentmonth-end may be obtained by calling (877) 354-6311 or by visiting http://www.doublelinefunds.com/opportunistic-credit-fund/.
6 DoubleLine Opportunistic Credit Fund
(Unaudited)
March 31, 2017
This material may include statements that constitute “forward-looking statements” under the U.S. securities laws. Forward-looking statements include, among otherthings, projections, estimates, and information about possible or future results related to the Fund, market or regulatory developments. The views expressed herein arenot guarantees of future performance or economic results and involve certain risks, uncertainties and assumptions that could cause actual outcomes and results todiffer materially from the views expressed herein. The views expressed herein are subject to change at any time based upon economic, market, or other conditions andDoubleLine undertakes no obligation to update the views expressed herein. While we have gathered this information from sources believed to be reliable, DoubleLinecannot guarantee the accuracy of the information provided. Any discussions of specific securities should not be considered a recommendation to buy or sell thosesecurities. For a complete list of Fund holdings, please refer to the Schedule of Investments provided in this report.
Fund holdings and sector allocations are subject to change and are not a recommendation to buy or sell any security. Please refer to the Schedule of Investments for acomplete list of Fund holdings.
Bloomberg Barclays U.S. Aggregate Bond Index—This index represents securities that are SEC-registered, taxable, and dollar denominated. The index covers the U.S.investment grade fixed rate bond market, with index components for government and corporate securities, mortgage pass-through securities, and asset-backedsecurities. These major sectors are subdivided into more specific indices that are calculated and reported on a regular basis.
Bloomberg Barclays U.S. CMBS Index ERISA Eligible Total Return Value—This index measures the performance of investment grade commercial mortgage-backedsecurities, which are classes of securities that represent interests in pools of commercial mortgages, and includes only ERISA-eligible CMBS.
Bloomberg Barclays U.S. MBS Index—This index measures the performance of investment grade fixed-rate mortgage-backed pass-through securities of theGovernment-Sponsored Enterprises (GSEs): Ginnie Mae (GNMA), Fannie Mae (FNMA), and Freddie Mac (FHLMC).
Duration—A measure of the sensitivity of a price of a fixed income investment to a change in interest rates, expressed as a number of years.
Freddie Mac U.S. 30-year Commitment Rates—The interest rate charged by Freddie Mac to lend money to a qualified borrower on a 30-year fixed-rate mortgageloan.
Investment Grade—Securities rated AAA to BBB- are considered to be investment grade. A bond is considered investment grade if its credit rating is BBB- or higher byStandard & Poor’s or Baa3 by Moody’s. Ratings based on the corporate bond model. The higher the rating, the more likely the bond is to pay back at par/$100 cents onthe dollar. AAA is considered the highest quality and the lowest degree of risk. They are considered to be extremely stable and dependable.
Last Cash Flow (LCF)—The last revenue stream paid to a bond over a given period.
Mortgage Bankers Association U.S. Refinancing Index Seasonally-Adjusted—An index that covers all mortgage applications to refinance an existing mortgageadjusted to take into account changes in data due to seasonality. It includes conventional and government refinances.
Mortgage Bankers Association Purchase Index Seasonally-Adjusted—An index that includes all mortgage applications for purchases of single-family homesadjusted to take into account changes in data due to seasonality. It covers the entire market, both conventional and government loans and all products.
Spread—The difference between yields on differing debt instruments, calculated by deducting the yield of one instrument from another. The higher the yield spread,the greater the difference between the yields offered by each instrument. The spread can be measured between debt instruments of differing maturities, credit ratingsand risk.
A direct investment cannot be made in an index. The performance of any index mentioned in this commentary has not been adjusted for ongoing management,distribution and operating expenses applicable to mutual fund investments.
Quasar Distributors, LLC provides filing administration for DoubleLine Capital LP.
Semi-Annual Report March 31, 2017 7
Standardized Performance Summary(Unaudited)
March 31, 2017
DBL
Opportunistic Credit FundReturns as of March 31, 2017
6-Months(Not Annualized) 1-Year
3-YearAnnualized
5-YearAnnualized
Since InceptionAnnualized
(1-27-12 to 3-31-17)
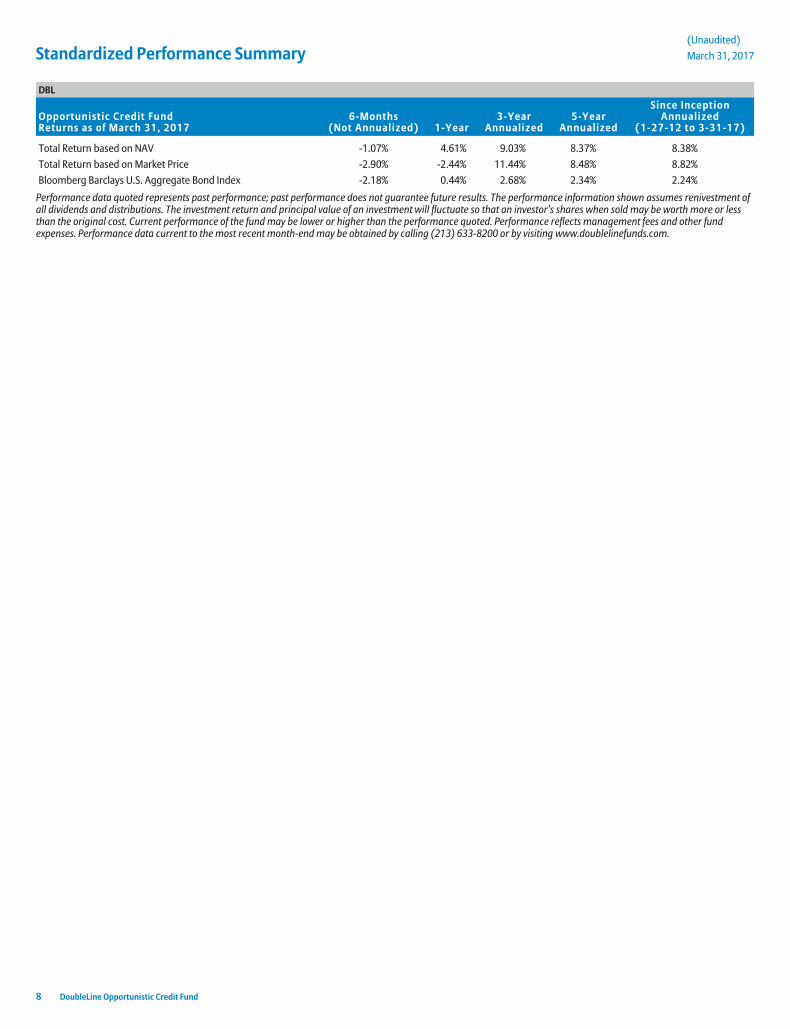
Total Return based on NAV -1.07% 4.61% 9.03% 8.37% 8.38%
Total Return based on Market Price -2.90% -2.44% 11.44% 8.48% 8.82%
Bloomberg Barclays U.S. Aggregate Bond Index -2.18% 0.44% 2.68% 2.34% 2.24%
Performance data quoted represents past performance; past performance does not guarantee future results. The performance information shown assumes renivestment ofall dividends and distributions. The investment return and principal value of an investment will fluctuate so that an investor’s shares when sold may be worth more or lessthan the original cost. Current performance of the fund may be lower or higher than the performance quoted. Performance reflects management fees and other fundexpenses. Performance data current to the most recent month-end may be obtained by calling (213) 633-8200 or by visiting www.doublelinefunds.com.
8 DoubleLine Opportunistic Credit Fund
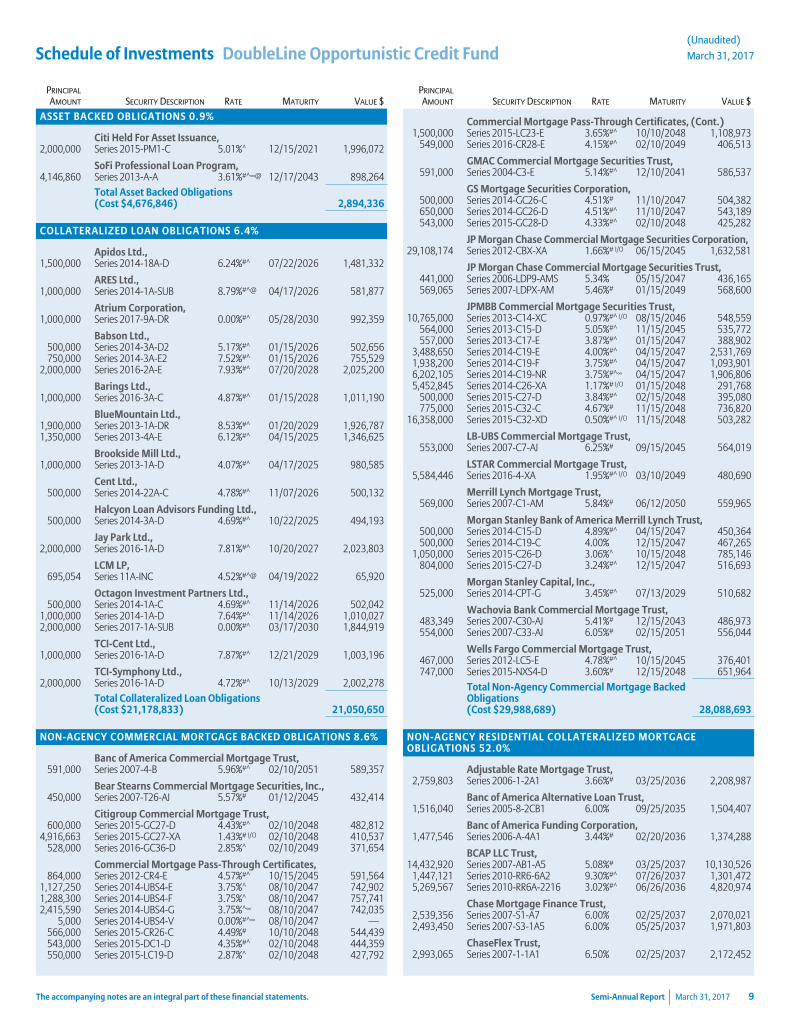
Schedule of Investments DoubleLine Opportunistic Credit Fund(Unaudited)
March 31, 2017
PRINCIPAL
AMOUNT SECURITY DESCRIPTION RATE MATURITY VALUE $
ASSET BACKED OBLIGATIONS 0.9%
Citi Held For Asset Issuance,2,000,000 Series 2015-PM1-C 5.01%^ 12/15/2021 1,996,072
SoFi Professional Loan Program,4,146,860 Series 2013-A-A 3.61%#^∞@ 12/17/2043 898,264
Total Asset Backed Obligations(Cost $4,676,846) 2,894,336
COLLATERALIZED LOAN OBLIGATIONS 6.4%
Apidos Ltd.,1,500,000 Series 2014-18A-D 6.24%#^ 07/22/2026 1,481,332
ARES Ltd.,1,000,000 Series 2014-1A-SUB 8.79%#^@ 04/17/2026 581,877
Atrium Corporation,1,000,000 Series 2017-9A-DR 0.00%#^ 05/28/2030 992,359
Babson Ltd.,500,000 Series 2014-3A-D2 5.17%#^ 01/15/2026 502,656750,000 Series 2014-3A-E2 7.52%#^ 01/15/2026 755,529
2,000,000 Series 2016-2A-E 7.93%#^ 07/20/2028 2,025,200
Barings Ltd.,1,000,000 Series 2016-3A-C 4.87%#^ 01/15/2028 1,011,190
BlueMountain Ltd.,1,900,000 Series 2013-1A-DR 8.53%#^ 01/20/2029 1,926,7871,350,000 Series 2013-4A-E 6.12%#^ 04/15/2025 1,346,625
Brookside Mill Ltd.,1,000,000 Series 2013-1A-D 4.07%#^ 04/17/2025 980,585
Cent Ltd.,500,000 Series 2014-22A-C 4.78%#^ 11/07/2026 500,132
Halcyon Loan Advisors Funding Ltd.,500,000 Series 2014-3A-D 4.69%#^ 10/22/2025 494,193
Jay Park Ltd.,2,000,000 Series 2016-1A-D 7.81%#^ 10/20/2027 2,023,803
LCM LP,695,054 Series 11A-INC 4.52%#^@ 04/19/2022 65,920
Octagon Investment Partners Ltd.,500,000 Series 2014-1A-C 4.69%#^ 11/14/2026 502,042
1,000,000 Series 2014-1A-D 7.64%#^ 11/14/2026 1,010,0272,000,000 Series 2017-1A-SUB 0.00%#^ 03/17/2030 1,844,919
TCI-Cent Ltd.,1,000,000 Series 2016-1A-D 7.87%#^ 12/21/2029 1,003,196
TCI-Symphony Ltd.,2,000,000 Series 2016-1A-D 4.72%#^ 10/13/2029 2,002,278
Total Collateralized Loan Obligations(Cost $21,178,833) 21,050,650
NON-AGENCY COMMERCIAL MORTGAGE BACKED OBLIGATIONS 8.6%
Banc of America Commercial Mortgage Trust,591,000 Series 2007-4-B 5.96%#^ 02/10/2051 589,357
Bear Stearns Commercial Mortgage Securities, Inc.,450,000 Series 2007-T26-AJ 5.57%# 01/12/2045 432,414
Citigroup Commercial Mortgage Trust,600,000 Series 2015-GC27-D 4.43%#^ 02/10/2048 482,812
4,916,663 Series 2015-GC27-XA 1.43%# I/O 02/10/2048 410,537528,000 Series 2016-GC36-D 2.85%^ 02/10/2049 371,654
Commercial Mortgage Pass-Through Certificates,864,000 Series 2012-CR4-E 4.57%#^ 10/15/2045 591,564
1,127,250 Series 2014-UBS4-E 3.75%^ 08/10/2047 742,9021,288,300 Series 2014-UBS4-F 3.75%^ 08/10/2047 757,7412,415,590 Series 2014-UBS4-G 3.75%^∞ 08/10/2047 742,035
5,000 Series 2014-UBS4-V 0.00%#^∞ 08/10/2047 —566,000 Series 2015-CR26-C 4.49%# 10/10/2048 544,439543,000 Series 2015-DC1-D 4.35%#^ 02/10/2048 444,359550,000 Series 2015-LC19-D 2.87%^ 02/10/2048 427,792
PRINCIPAL
AMOUNT SECURITY DESCRIPTION RATE MATURITY VALUE $
Commercial Mortgage Pass-Through Certificates, (Cont.)1,500,000 Series 2015-LC23-E 3.65%#^ 10/10/2048 1,108,973
549,000 Series 2016-CR28-E 4.15%#^ 02/10/2049 406,513
GMAC Commercial Mortgage Securities Trust,591,000 Series 2004-C3-E 5.14%#^ 12/10/2041 586,537
GS Mortgage Securities Corporation,500,000 Series 2014-GC26-C 4.51%# 11/10/2047 504,382650,000 Series 2014-GC26-D 4.51%#^ 11/10/2047 543,189543,000 Series 2015-GC28-D 4.33%#^ 02/10/2048 425,282
JP Morgan Chase Commercial Mortgage Securities Corporation,29,108,174 Series 2012-CBX-XA 1.66%# I/O 06/15/2045 1,632,581
JP Morgan Chase Commercial Mortgage Securities Trust,441,000 Series 2006-LDP9-AMS 5.34% 05/15/2047 436,165569,065 Series 2007-LDPX-AM 5.46%# 01/15/2049 568,600
JPMBB Commercial Mortgage Securities Trust,10,765,000 Series 2013-C14-XC 0.97%#^ I/O 08/15/2046 548,559
564,000 Series 2013-C15-D 5.05%#^ 11/15/2045 535,772557,000 Series 2013-C17-E 3.87%#^ 01/15/2047 388,902
3,488,650 Series 2014-C19-E 4.00%#^ 04/15/2047 2,531,7691,938,200 Series 2014-C19-F 3.75%#^ 04/15/2047 1,093,9016,202,105 Series 2014-C19-NR 3.75%#^∞ 04/15/2047 1,906,8065,452,845 Series 2014-C26-XA 1.17%# I/O 01/15/2048 291,768
500,000 Series 2015-C27-D 3.84%#^ 02/15/2048 395,080775,000 Series 2015-C32-C 4.67%# 11/15/2048 736,820
16,358,000 Series 2015-C32-XD 0.50%#^ I/O 11/15/2048 503,282
LB-UBS Commercial Mortgage Trust,553,000 Series 2007-C7-AJ 6.25%# 09/15/2045 564,019
LSTAR Commercial Mortgage Trust,5,584,446 Series 2016-4-XA 1.95%#^ I/O 03/10/2049 480,690
Merrill Lynch Mortgage Trust,569,000 Series 2007-C1-AM 5.84%# 06/12/2050 559,965
Morgan Stanley Bank of America Merrill Lynch Trust,500,000 Series 2014-C15-D 4.89%#^ 04/15/2047 450,364500,000 Series 2014-C19-C 4.00% 12/15/2047 467,265
1,050,000 Series 2015-C26-D 3.06%^ 10/15/2048 785,146804,000 Series 2015-C27-D 3.24%#^ 12/15/2047 516,693
Morgan Stanley Capital, Inc.,525,000 Series 2014-CPT-G 3.45%#^ 07/13/2029 510,682
Wachovia Bank Commercial Mortgage Trust,483,349 Series 2007-C30-AJ 5.41%# 12/15/2043 486,973554,000 Series 2007-C33-AJ 6.05%# 02/15/2051 556,044
Wells Fargo Commercial Mortgage Trust,467,000 Series 2012-LC5-E 4.78%#^ 10/15/2045 376,401747,000 Series 2015-NXS4-D 3.60%# 12/15/2048 651,964
Total Non-Agency Commercial Mortgage BackedObligations(Cost $29,988,689) 28,088,693
NON-AGENCY RESIDENTIAL COLLATERALIZED MORTGAGEOBLIGATIONS 52.0%
Adjustable Rate Mortgage Trust,2,759,803 Series 2006-1-2A1 3.66%# 03/25/2036 2,208,987
Banc of America Alternative Loan Trust,1,516,040 Series 2005-8-2CB1 6.00% 09/25/2035 1,504,407
Banc of America Funding Corporation,1,477,546 Series 2006-A-4A1 3.44%# 02/20/2036 1,374,288
BCAP LLC Trust,14,432,920 Series 2007-AB1-A5 5.08%# 03/25/2037 10,130,526
1,447,121 Series 2010-RR6-6A2 9.30%#^ 07/26/2037 1,301,4725,269,567 Series 2010-RR6A-2216 3.02%#^ 06/26/2036 4,820,974
Chase Mortgage Finance Trust,2,539,356 Series 2007-S1-A7 6.00% 02/25/2037 2,070,0212,493,450 Series 2007-S3-1A5 6.00% 05/25/2037 1,971,803
ChaseFlex Trust,2,993,065 Series 2007-1-1A1 6.50% 02/25/2037 2,172,452
The accompanying notes are an integral part of these financial statements. Semi-Annual Report March 31, 2017 9
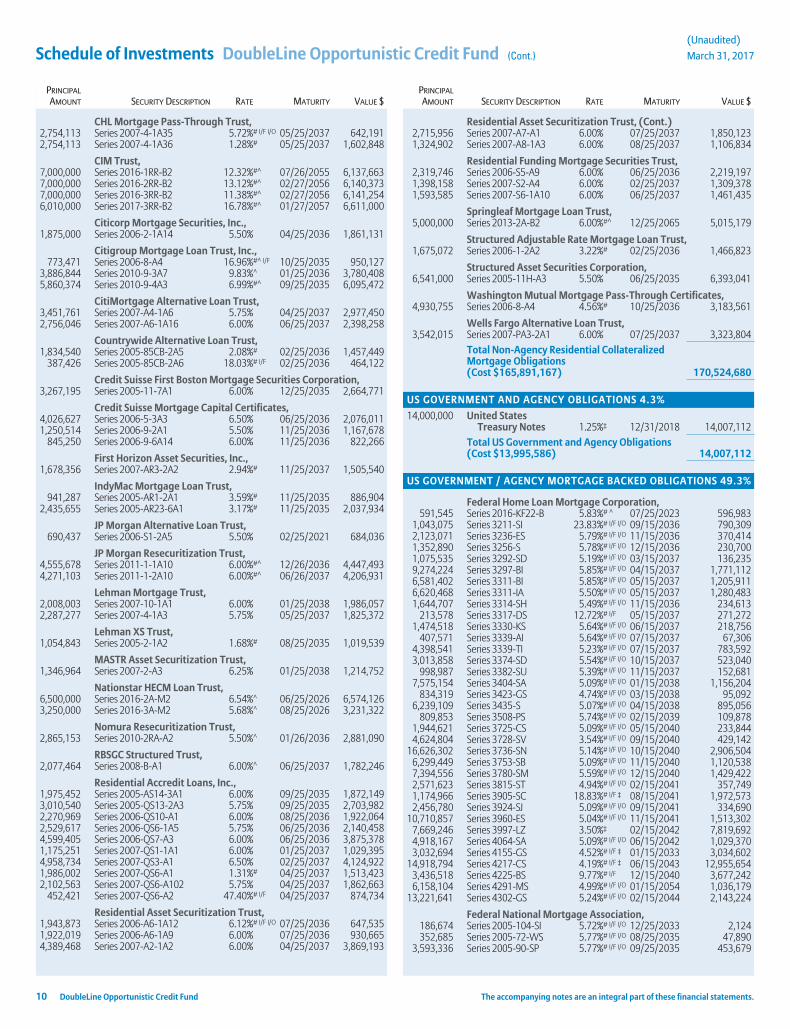
Schedule of Investments DoubleLine Opportunistic Credit Fund (Cont.)(Unaudited)
March 31, 2017
PRINCIPAL
AMOUNT SECURITY DESCRIPTION RATE MATURITY VALUE $
CHL Mortgage Pass-Through Trust,2,754,113 Series 2007-4-1A35 5.72%# I/F I/O 05/25/2037 642,1912,754,113 Series 2007-4-1A36 1.28%# 05/25/2037 1,602,848
CIM Trust,7,000,000 Series 2016-1RR-B2 12.32%#^ 07/26/2055 6,137,6637,000,000 Series 2016-2RR-B2 13.12%#^ 02/27/2056 6,140,3737,000,000 Series 2016-3RR-B2 11.38%#^ 02/27/2056 6,141,2546,010,000 Series 2017-3RR-B2 16.78%#^ 01/27/2057 6,611,000
Citicorp Mortgage Securities, Inc.,1,875,000 Series 2006-2-1A14 5.50% 04/25/2036 1,861,131
Citigroup Mortgage Loan Trust, Inc.,773,471 Series 2006-8-A4 16.96%#^ I/F 10/25/2035 950,127
3,886,844 Series 2010-9-3A7 9.83%^ 01/25/2036 3,780,4085,860,374 Series 2010-9-4A3 6.99%#^ 09/25/2035 6,095,472
CitiMortgage Alternative Loan Trust,3,451,761 Series 2007-A4-1A6 5.75% 04/25/2037 2,977,4502,756,046 Series 2007-A6-1A16 6.00% 06/25/2037 2,398,258
Countrywide Alternative Loan Trust,1,834,540 Series 2005-85CB-2A5 2.08%# 02/25/2036 1,457,449
387,426 Series 2005-85CB-2A6 18.03%# I/F 02/25/2036 464,122
Credit Suisse First Boston Mortgage Securities Corporation,3,267,195 Series 2005-11-7A1 6.00% 12/25/2035 2,664,771
Credit Suisse Mortgage Capital Certificates,4,026,627 Series 2006-5-3A3 6.50% 06/25/2036 2,076,0111,250,514 Series 2006-9-2A1 5.50% 11/25/2036 1,167,678
845,250 Series 2006-9-6A14 6.00% 11/25/2036 822,266
First Horizon Asset Securities, Inc.,1,678,356 Series 2007-AR3-2A2 2.94%# 11/25/2037 1,505,540
IndyMac Mortgage Loan Trust,941,287 Series 2005-AR1-2A1 3.59%# 11/25/2035 886,904
2,435,655 Series 2005-AR23-6A1 3.17%# 11/25/2035 2,037,934
JP Morgan Alternative Loan Trust,690,437 Series 2006-S1-2A5 5.50% 02/25/2021 684,036
JP Morgan Resecuritization Trust,4,555,678 Series 2011-1-1A10 6.00%#^ 12/26/2036 4,447,4934,271,103 Series 2011-1-2A10 6.00%#^ 06/26/2037 4,206,931
Lehman Mortgage Trust,2,008,003 Series 2007-10-1A1 6.00% 01/25/2038 1,986,0572,287,277 Series 2007-4-1A3 5.75% 05/25/2037 1,825,372
Lehman XS Trust,1,054,843 Series 2005-2-1A2 1.68%# 08/25/2035 1,019,539
MASTR Asset Securitization Trust,1,346,964 Series 2007-2-A3 6.25% 01/25/2038 1,214,752
Nationstar HECM Loan Trust,6,500,000 Series 2016-2A-M2 6.54%^ 06/25/2026 6,574,1263,250,000 Series 2016-3A-M2 5.68%^ 08/25/2026 3,231,322
Nomura Resecuritization Trust,2,865,153 Series 2010-2RA-A2 5.50%^ 01/26/2036 2,881,090
RBSGC Structured Trust,2,077,464 Series 2008-B-A1 6.00%^ 06/25/2037 1,782,246
Residential Accredit Loans, Inc.,1,975,452 Series 2005-AS14-3A1 6.00% 09/25/2035 1,872,1493,010,540 Series 2005-QS13-2A3 5.75% 09/25/2035 2,703,9822,270,969 Series 2006-QS10-A1 6.00% 08/25/2036 1,922,0642,529,617 Series 2006-QS6-1A5 5.75% 06/25/2036 2,140,4584,599,405 Series 2006-QS7-A3 6.00% 06/25/2036 3,875,3781,175,251 Series 2007-QS1-1A1 6.00% 01/25/2037 1,029,3954,958,734 Series 2007-QS3-A1 6.50% 02/25/2037 4,124,9221,986,002 Series 2007-QS6-A1 1.31%# 04/25/2037 1,513,4232,102,563 Series 2007-QS6-A102 5.75% 04/25/2037 1,862,663
452,421 Series 2007-QS6-A2 47.40%# I/F 04/25/2037 874,734
Residential Asset Securitization Trust,1,943,873 Series 2006-A6-1A12 6.12%# I/F I/O 07/25/2036 647,5351,922,019 Series 2006-A6-1A9 6.00% 07/25/2036 930,6654,389,468 Series 2007-A2-1A2 6.00% 04/25/2037 3,869,193
PRINCIPAL
AMOUNT SECURITY DESCRIPTION RATE MATURITY VALUE $
Residential Asset Securitization Trust, (Cont.)2,715,956 Series 2007-A7-A1 6.00% 07/25/2037 1,850,1231,324,902 Series 2007-A8-1A3 6.00% 08/25/2037 1,106,834
Residential Funding Mortgage Securities Trust,2,319,746 Series 2006-S5-A9 6.00% 06/25/2036 2,219,1971,398,158 Series 2007-S2-A4 6.00% 02/25/2037 1,309,3781,593,585 Series 2007-S6-1A10 6.00% 06/25/2037 1,461,435
Springleaf Mortgage Loan Trust,5,000,000 Series 2013-2A-B2 6.00%#^ 12/25/2065 5,015,179
Structured Adjustable Rate Mortgage Loan Trust,1,675,072 Series 2006-1-2A2 3.22%# 02/25/2036 1,466,823
Structured Asset Securities Corporation,6,541,000 Series 2005-11H-A3 5.50% 06/25/2035 6,393,041
Washington Mutual Mortgage Pass-Through Certificates,4,930,755 Series 2006-8-A4 4.56%# 10/25/2036 3,183,561
Wells Fargo Alternative Loan Trust,3,542,015 Series 2007-PA3-2A1 6.00% 07/25/2037 3,323,804
Total Non-Agency Residential CollateralizedMortgage Obligations(Cost $165,891,167) 170,524,680
US GOVERNMENT AND AGENCY OBLIGATIONS 4.3%
14,000,000 United StatesTreasury Notes 1.25%‡ 12/31/2018 14,007,112
Total US Government and Agency Obligations(Cost $13,995,586) 14,007,112
US GOVERNMENT / AGENCY MORTGAGE BACKED OBLIGATIONS 49.3%
Federal Home Loan Mortgage Corporation,591,545 Series 2016-KF22-B 5.83%# ^ 07/25/2023 596,983
1,043,075 Series 3211-SI 23.83%# I/F I/O 09/15/2036 790,3092,123,071 Series 3236-ES 5.79%# I/F I/O 11/15/2036 370,4141,352,890 Series 3256-S 5.78%# I/F I/O 12/15/2036 230,7001,075,535 Series 3292-SD 5.19%# I/F I/O 03/15/2037 136,2359,274,224 Series 3297-BI 5.85%# I/F I/O 04/15/2037 1,771,1126,581,402 Series 3311-BI 5.85%# I/F I/O 05/15/2037 1,205,9116,620,468 Series 3311-IA 5.50%# I/F I/O 05/15/2037 1,280,4831,644,707 Series 3314-SH 5.49%# I/F I/O 11/15/2036 234,613
213,578 Series 3317-DS 12.72%# I/F 05/15/2037 271,2721,474,518 Series 3330-KS 5.64%# I/F I/O 06/15/2037 218,756
407,571 Series 3339-AI 5.64%# I/F I/O 07/15/2037 67,3064,398,541 Series 3339-TI 5.23%# I/F I/O 07/15/2037 783,5923,013,858 Series 3374-SD 5.54%# I/F I/O 10/15/2037 523,040
998,987 Series 3382-SU 5.39%# I/F I/O 11/15/2037 152,6817,575,154 Series 3404-SA 5.09%# I/F I/O 01/15/2038 1,156,204
834,319 Series 3423-GS 4.74%# I/F I/O 03/15/2038 95,0926,239,109 Series 3435-S 5.07%# I/F I/O 04/15/2038 895,056
809,853 Series 3508-PS 5.74%# I/F I/O 02/15/2039 109,8781,944,621 Series 3725-CS 5.09%# I/F I/O 05/15/2040 233,8444,624,804 Series 3728-SV 3.54%# I/F I/O 09/15/2040 429,142
16,626,302 Series 3736-SN 5.14%# I/F I/O 10/15/2040 2,906,5046,299,449 Series 3753-SB 5.09%# I/F I/O 11/15/2040 1,120,5387,394,556 Series 3780-SM 5.59%# I/F I/O 12/15/2040 1,429,4222,571,623 Series 3815-ST 4.94%# I/F I/O 02/15/2041 357,7491,174,966 Series 3905-SC 18.83%# I/F ‡ 08/15/2041 1,972,5732,456,780 Series 3924-SJ 5.09%# I/F I/O 09/15/2041 334,690
10,710,857 Series 3960-ES 5.04%# I/F I/O 11/15/2041 1,513,3027,669,246 Series 3997-LZ 3.50%‡ 02/15/2042 7,819,6924,918,167 Series 4064-SA 5.09%# I/F I/O 06/15/2042 1,029,3703,032,694 Series 4155-GS 4.52%# I/F ‡ 01/15/2033 3,034,602
14,918,794 Series 4217-CS 4.19%# I/F ‡ 06/15/2043 12,955,6543,436,518 Series 4225-BS 9.77%# I/F 12/15/2040 3,677,2426,158,104 Series 4291-MS 4.99%# I/F I/O 01/15/2054 1,036,179
13,221,641 Series 4302-GS 5.24%# I/F I/O 02/15/2044 2,143,224
Federal National Mortgage Association,186,674 Series 2005-104-SI 5.72%# I/F I/O 12/25/2033 2,124352,685 Series 2005-72-WS 5.77%# I/F I/O 08/25/2035 47,890
3,593,336 Series 2005-90-SP 5.77%# I/F I/O 09/25/2035 453,679
10 DoubleLine Opportunistic Credit Fund The accompanying notes are an integral part of these financial statements.
(Unaudited)
March 31, 2017
PRINCIPAL
AMOUNT SECURITY DESCRIPTION RATE MATURITY VALUE $
Federal National Mortgage Association, (Cont.)1,414,370 Series 2006-117-SQ 5.57%# I/F I/O 12/25/2036 181,428
929,787 Series 2006-119-HS 5.67%# I/F I/O 12/25/2036 137,4499,246,824 Series 2006-123-CI 5.76%# I/F I/O 01/25/2037 1,801,7504,068,588 Series 2006-60-YI 5.59%# I/F I/O 07/25/2036 933,1504,363,795 Series 2007-15-BI 5.72%# I/F I/O 03/25/2037 763,2811,604,109 Series 2007-20-S 5.76%# I/F I/O 03/25/2037 220,962
890,214 Series 2007-21-SD 5.50%# I/F I/O 03/25/2037 127,0081,920,249 Series 2007-30-IE 5.76%# I/F I/O 04/25/2037 425,0614,722,769 Series 2007-32-SA 5.12%# I/F I/O 04/25/2037 721,5152,275,627 Series 2007-40-SA 5.12%# I/F I/O 05/25/2037 361,006
528,982 Series 2007-48-SE 5.12%# I/F I/O 05/25/2037 67,7021,189,886 Series 2007-64-LI 5.58%# I/F I/O 07/25/2037 162,833
414,662 Series 2007-68-SA 5.67%# I/F I/O 07/25/2037 53,73711,296,857 Series 2007-75-PI 5.56%# I/F I/O 08/25/2037 2,067,153
6,382,930 Series 2008-33-SA 5.02%# I/F I/O 04/25/2038 946,0344,911,179 Series 2008-42-SC 4.92%# I/F I/O 05/25/2038 785,8631,075,533 Series 2008-5-GS 5.27%# I/F I/O 02/25/2038 190,1613,420,146 Series 2008-62-SD 5.07%# I/F I/O 07/25/2038 521,4482,307,489 Series 2008-68-SB 5.12%# I/F I/O 08/25/2038 386,983
934,673 Series 2009-111-SE 5.27%# I/F I/O 01/25/2040 137,1192,222,202 Series 2009-12-CI 5.62%# I/F I/O 03/25/2036 465,654
601,544 Series 2009-26-SM 5.37%# I/F I/O 08/25/2038 17,113859,075 Series 2009-47-SA 5.12%# I/F I/O 07/25/2039 96,503709,228 Series 2009-48-WS 4.97%# I/F I/O 07/25/2039 75,590350,134 Series 2009-67-SA 4.17%# I/F I/O 07/25/2037 39,871989,710 Series 2009-87-SA 5.02%# I/F I/O 11/25/2049 131,522
1,987,249 Series 2009-91-SD 5.17%# I/F I/O 11/25/2039 299,741332,945 Series 2010-109-BS 46.37%# I/F 10/25/2040 1,251,555705,934 Series 2010-115-SD 5.62%# I/F I/O 11/25/2039 111,295
1,374,066 Series 2010-11-SC 3.82%# I/F I/O 02/25/2040 137,0204,177,556 Series 2010-134-SE 5.67%# I/F I/O 12/25/2025 486,784
11,098,442 Series 2010-142-SC 5.62%# I/F I/O 12/25/2040 2,220,9754,419,242 Series 2010-150-MS 5.55%# I/F I/O 01/25/2041 855,2842,081,207 Series 2010-15-SL 3.97%# I/F I/O 03/25/2040 244,875
612,052 Series 2010-19-SA 4.42%# I/F I/O 03/25/2050 68,2861,817,087 Series 2010-31-SB 4.02%# I/F I/O 04/25/2040 196,6712,834,783 Series 2010-39-SL 4.69%# I/F I/O 05/25/2040 398,556
56,364 Series 2010-40-EI 4.50% I/O 05/25/2024 9752,276 Series 2010-8-US 3.82%# I/F I/O 02/25/2040 75,269
1,077,591 Series 2010-9-GS 3.77%# I/F I/O 02/25/2040 101,0752,644,874 Series 2011-114-S 5.02%# I/F I/O 09/25/2039 386,2362,655,914 Series 2011-146-US 5.63%# I/F ‡ 01/25/2042 2,405,782
157,371 Series 2011-40-SA 7.55%# I/F 09/25/2040 176,8943,238,231 Series 2011-55-BZ 3.50% 06/25/2041 3,287,0552,263,574 Series 2011-58-SA 5.57%# I/F I/O 07/25/2041 415,2631,627,307 Series 2011-5-PS 5.42%# I/F I/O 11/25/2040 202,1354,900,266 Series 2012-22-AZ 4.00%‡ 03/25/2042 5,110,2311,123,024 Series 2012-29-SG 5.02%# I/F I/O 04/25/2042 151,4678,902,297 Series 2012-56-SN 5.07%# I/F I/O 06/25/2042 1,309,7448,584,193 Series 2012-76-SC 5.02%# I/F I/O 07/25/2042 1,453,2831,062,705 Series 2012-82-SC 6.15%# I/F ‡ 08/25/2042 1,075,0276,666,782 Series 2013-17-MS 4.46%# I/F 03/25/2043 6,162,2734,134,825 Series 2013-18-BS 4.22%# I/F ‡ 03/25/2043 3,891,6152,668,267 Series 2013-41-SC 4.53%# I/F ‡ 05/25/2043 2,374,0793,426,699 Series 2013-51-SH 4.53%# I/F 05/25/2033 3,119,662
10,316,596 Series 2013-55-KS 4.53%# I/F ‡ 06/25/2043 9,423,4393,762,505 Series 2013-61-ZN 3.00%‡ 06/25/2033 3,668,427
10,296,216 Series 2013-83-US 4.02%# I/F ‡ 08/25/2043 8,753,737534,614 Series 374-19 6.50% I/O 09/25/2036 126,295
PRINCIPAL
AMOUNT $/SHARES SECURITY DESCRIPTION RATE MATURITY VALUE $
Government National Mortgage Association,1,393,309 Series 2009-104-SD 5.42%# I/F I/O 11/16/2039 240,749
435,277 Series 2010-98-IA 5.81%# I/O 03/20/2039 49,6141,179,537 Series 2011-56-BS 5.17%# I/F I/O 11/16/2036 27,5442,208,742 Series 2011-56-KS 5.17%# I/F I/O 08/16/2036 88,4081,838,560 Series 2011-69-SB 4.37%# I/F I/O 05/20/2041 246,2699,982,226 Series 2011-70-WS 7.74%# I/F ‡ 12/20/2040 10,731,3882,759,519 Series 2011-71-SG 4.42%# I/F I/O 05/20/2041 384,9133,201,906 Series 2011-72-AS 4.40%# I/F I/O 05/20/2041 433,2133,719,911 Series 2011-89-SA 4.47%# I/F I/O 06/20/2041 489,4951,728,974 Series 2012-34-LI 6.00%# I/F I/O 12/16/2039 397,7798,906,732 Series 2013-119-TZ 3.00%‡ 08/20/2043 8,453,5887,366,795 Series 2013-188-MS 4.62%# I/F I/O 12/16/2043 1,225,543
57,330,206 Series 2013-39-HS 3.77%# I/F I/O 03/20/2041 6,272,54910,532,358 Series 2014-39-SK 5.22%# I/F I/O 03/20/2044 1,674,39113,844,470 Series 2014-59-DS 5.32%# I/F I/O 04/16/2044 2,280,642
9,061,613 Series 2014-63-SD 4.57%# I/F I/O 04/20/2044 1,667,9729,752,769 Series 2014-69-ST 5.17%# I/F I/O 12/16/2039 1,612,239
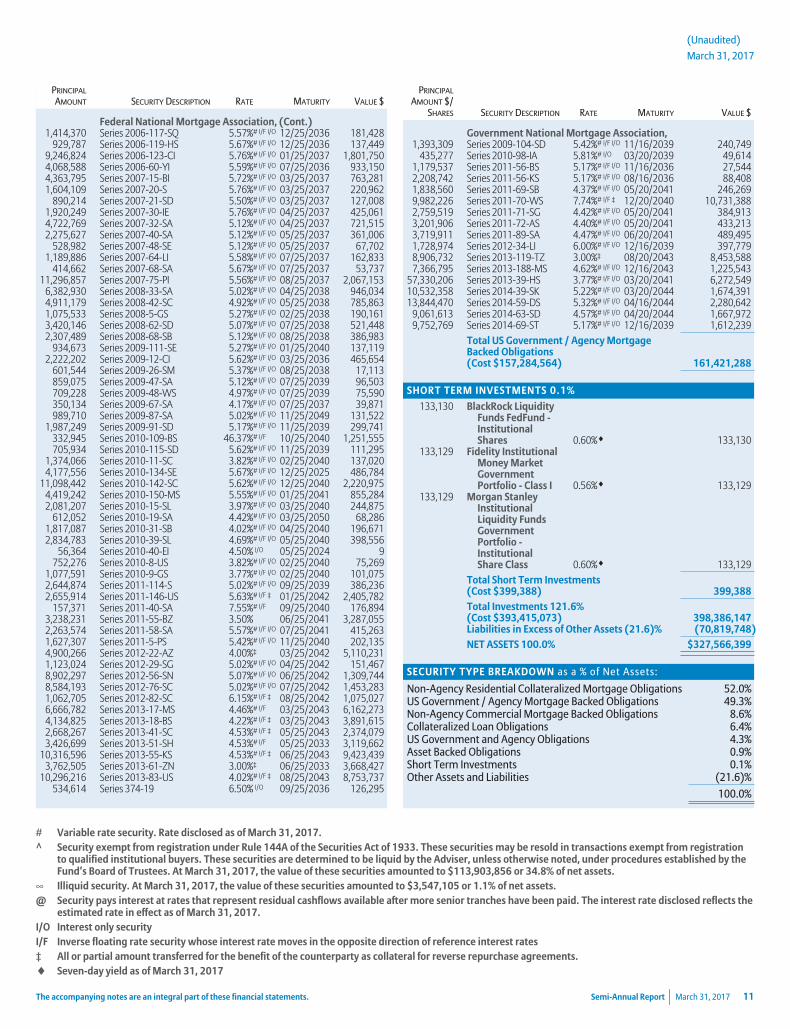
Total US Government / Agency MortgageBacked Obligations(Cost $157,284,564) 161,421,288
SHORT TERM INVESTMENTS 0.1%
133,130 BlackRock LiquidityFunds FedFund -InstitutionalShares 0.60%/ 133,130
133,129 Fidelity InstitutionalMoney MarketGovernmentPortfolio - Class I 0.56%/ 133,129
133,129 Morgan StanleyInstitutionalLiquidity FundsGovernmentPortfolio -InstitutionalShare Class 0.60%/ 133,129
Total Short Term Investments(Cost $399,388) 399,388Total Investments 121.6%(Cost $393,415,073) 398,386,147Liabilities in Excess of Other Assets (21.6)% (70,819,748)NET ASSETS 100.0% $327,566,399
SECURITY TYPE BREAKDOWN as a % of Net Assets:
Non-Agency Residential Collateralized Mortgage Obligations 52.0%US Government / Agency Mortgage Backed Obligations 49.3%Non-Agency Commercial Mortgage Backed Obligations 8.6%Collateralized Loan Obligations 6.4%US Government and Agency Obligations 4.3%Asset Backed Obligations 0.9%Short Term Investments 0.1%Other Assets and Liabilities (21.6)%
100.0%
# Variable rate security. Rate disclosed as of March 31, 2017.^ Security exempt from registration under Rule 144A of the Securities Act of 1933. These securities may be resold in transactions exempt from registration
to qualified institutional buyers. These securities are determined to be liquid by the Adviser, unless otherwise noted, under procedures established by theFund’s Board of Trustees. At March 31, 2017, the value of these securities amounted to $113,903,856 or 34.8% of net assets.
∞ Illiquid security. At March 31, 2017, the value of these securities amounted to $3,547,105 or 1.1% of net assets.@ Security pays interest at rates that represent residual cashflows available after more senior tranches have been paid. The interest rate disclosed reflects the
estimated rate in effect as of March 31, 2017.I/O Interest only securityI/F Inverse floating rate security whose interest rate moves in the opposite direction of reference interest rates‡ All or partial amount transferred for the benefit of the counterparty as collateral for reverse repurchase agreements./ Seven-day yield as of March 31, 2017
The accompanying notes are an integral part of these financial statements. Semi-Annual Report March 31, 2017 11
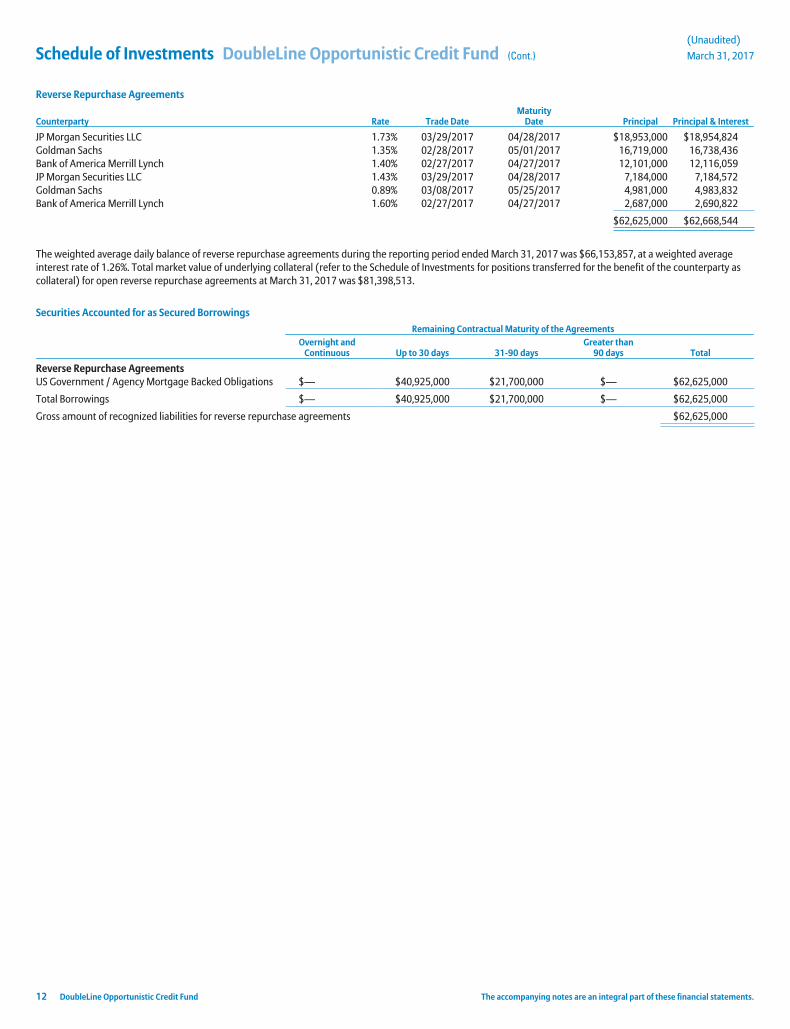
Schedule of Investments DoubleLine Opportunistic Credit Fund (Cont.)(Unaudited)
March 31, 2017
Reverse Repurchase Agreements
Counterparty Rate Trade DateMaturity
Date Principal Principal & Interest
JP Morgan Securities LLC 1.73% 03/29/2017 04/28/2017 $18,953,000 $18,954,824Goldman Sachs 1.35% 02/28/2017 05/01/2017 16,719,000 16,738,436Bank of America Merrill Lynch 1.40% 02/27/2017 04/27/2017 12,101,000 12,116,059JP Morgan Securities LLC 1.43% 03/29/2017 04/28/2017 7,184,000 7,184,572Goldman Sachs 0.89% 03/08/2017 05/25/2017 4,981,000 4,983,832Bank of America Merrill Lynch 1.60% 02/27/2017 04/27/2017 2,687,000 2,690,822
$62,625,000 $62,668,544
The weighted average daily balance of reverse repurchase agreements during the reporting period ended March 31, 2017 was $66,153,857, at a weighted averageinterest rate of 1.26%. Total market value of underlying collateral (refer to the Schedule of Investments for positions transferred for the benefit of the counterparty ascollateral) for open reverse repurchase agreements at March 31, 2017 was $81,398,513.
Securities Accounted for as Secured Borrowings
Remaining Contractual Maturity of the AgreementsOvernight and
Continuous Up to 30 days 31-90 daysGreater than
90 days Total
Reverse Repurchase AgreementsUS Government / Agency Mortgage Backed Obligations $— $40,925,000 $21,700,000 $— $62,625,000
Total Borrowings $— $40,925,000 $21,700,000 $— $62,625,000
Gross amount of recognized liabilities for reverse repurchase agreements $62,625,000
12 DoubleLine Opportunistic Credit Fund The accompanying notes are an integral part of these financial statements.
Statement of Assets and Liabilities(Unaudited)
March 31, 2017
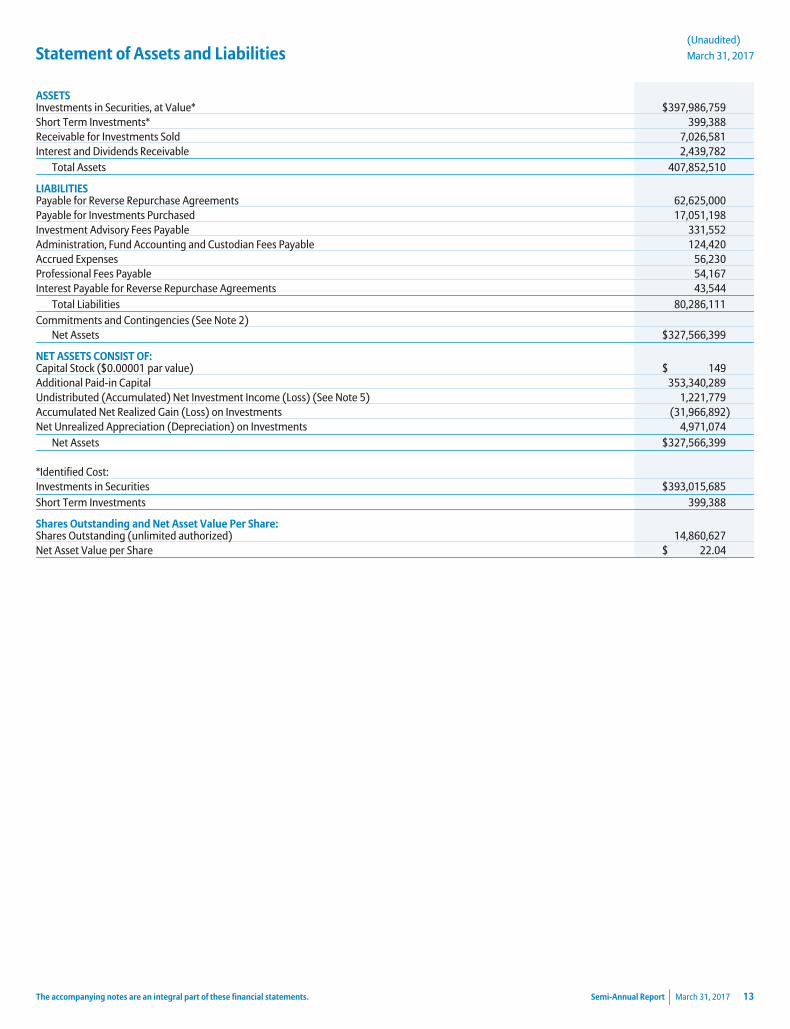
ASSETSInvestments in Securities, at Value* $397,986,759Short Term Investments* 399,388Receivable for Investments Sold 7,026,581Interest and Dividends Receivable 2,439,782
Total Assets 407,852,510
LIABILITIESPayable for Reverse Repurchase Agreements 62,625,000Payable for Investments Purchased 17,051,198Investment Advisory Fees Payable 331,552Administration, Fund Accounting and Custodian Fees Payable 124,420Accrued Expenses 56,230Professional Fees Payable 54,167Interest Payable for Reverse Repurchase Agreements 43,544
Total Liabilities 80,286,111Commitments and Contingencies (See Note 2)
Net Assets $327,566,399
NET ASSETS CONSIST OF:Capital Stock ($0.00001 par value) $ 149Additional Paid-in Capital 353,340,289Undistributed (Accumulated) Net Investment Income (Loss) (See Note 5) 1,221,779Accumulated Net Realized Gain (Loss) on Investments (31,966,892)Net Unrealized Appreciation (Depreciation) on Investments 4,971,074
Net Assets $327,566,399
*Identified Cost:Investments in Securities $393,015,685Short Term Investments 399,388
Shares Outstanding and Net Asset Value Per Share:Shares Outstanding (unlimited authorized) 14,860,627Net Asset Value per Share $ 22.04
The accompanying notes are an integral part of these financial statements. Semi-Annual Report March 31, 2017 13
Statement of Operations(Unaudited)
For the Period Ended March 31, 2017
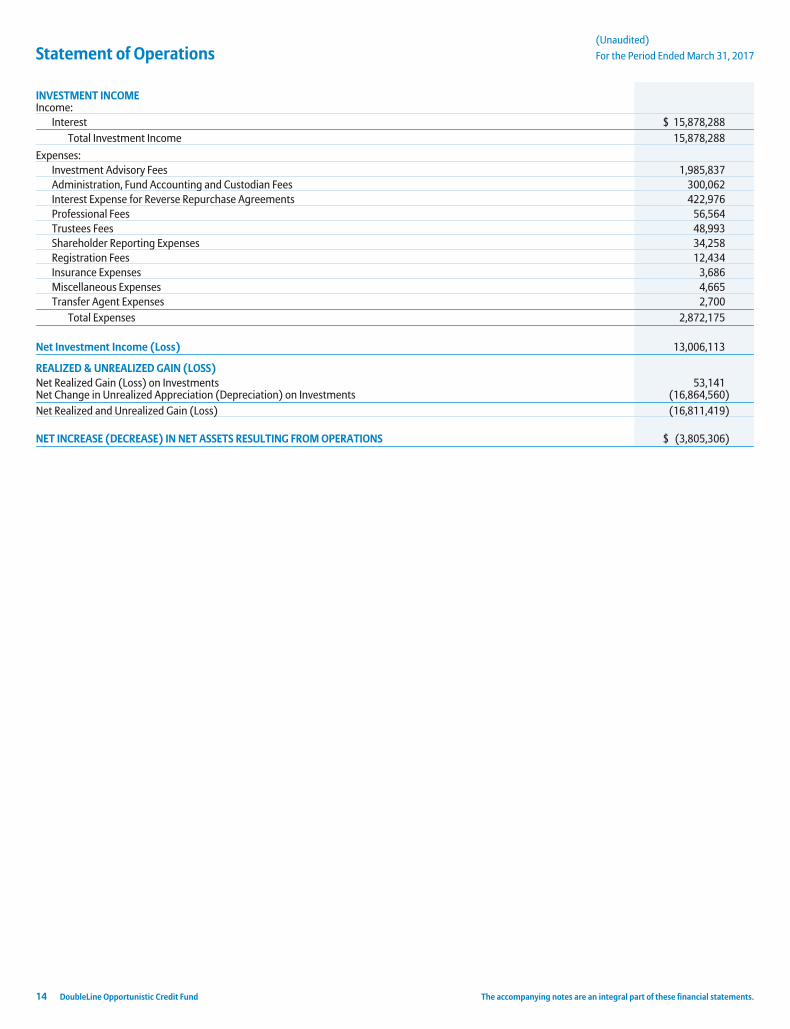
INVESTMENT INCOMEIncome:
Interest $ 15,878,288Total Investment Income 15,878,288
Expenses:Investment Advisory Fees 1,985,837Administration, Fund Accounting and Custodian Fees 300,062Interest Expense for Reverse Repurchase Agreements 422,976Professional Fees 56,564Trustees Fees 48,993Shareholder Reporting Expenses 34,258Registration Fees 12,434Insurance Expenses 3,686Miscellaneous Expenses 4,665Transfer Agent Expenses 2,700
Total Expenses 2,872,175
Net Investment Income (Loss) 13,006,113
REALIZED & UNREALIZED GAIN (LOSS)Net Realized Gain (Loss) on Investments 53,141Net Change in Unrealized Appreciation (Depreciation) on Investments (16,864,560)Net Realized and Unrealized Gain (Loss) (16,811,419)
NET INCREASE (DECREASE) IN NET ASSETS RESULTING FROM OPERATIONS $ (3,805,306)
14 DoubleLine Opportunistic Credit Fund The accompanying notes are an integral part of these financial statements.
Statements of Changes in Net Assets For the Period Ended March 31, 2017
Period EndedMarch 31, 2017
(Unaudited)Year Ended
September 30, 2016
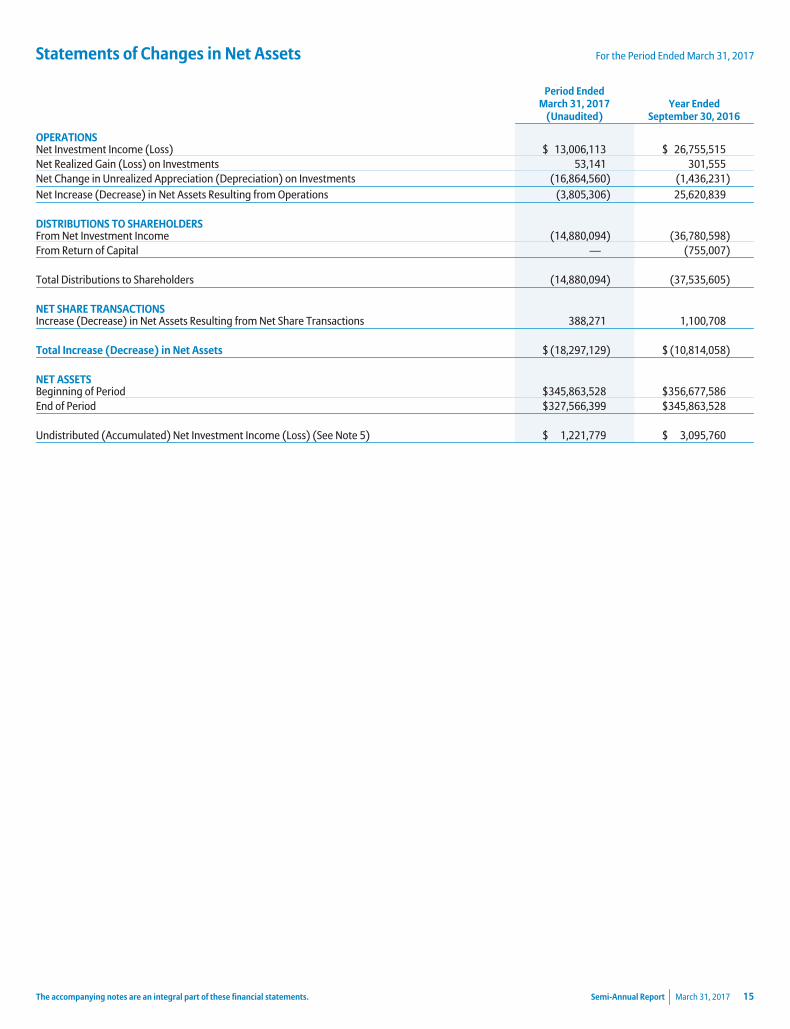
OPERATIONSNet Investment Income (Loss) $ 13,006,113 $ 26,755,515Net Realized Gain (Loss) on Investments 53,141 301,555Net Change in Unrealized Appreciation (Depreciation) on Investments (16,864,560) (1,436,231)Net Increase (Decrease) in Net Assets Resulting from Operations (3,805,306) 25,620,839
DISTRIBUTIONS TO SHAREHOLDERSFrom Net Investment Income (14,880,094) (36,780,598)From Return of Capital — (755,007)
Total Distributions to Shareholders (14,880,094) (37,535,605)
NET SHARE TRANSACTIONSIncrease (Decrease) in Net Assets Resulting from Net Share Transactions 388,271 1,100,708
Total Increase (Decrease) in Net Assets $ (18,297,129) $ (10,814,058)
NET ASSETSBeginning of Period $345,863,528 $356,677,586End of Period $327,566,399 $345,863,528
Undistributed (Accumulated) Net Investment Income (Loss) (See Note 5) $ 1,221,779 $ 3,095,760
The accompanying notes are an integral part of these financial statements. Semi-Annual Report March 31, 2017 15
Statement of Cash Flows(Unaudited)
For the Period Ended March 31, 2017
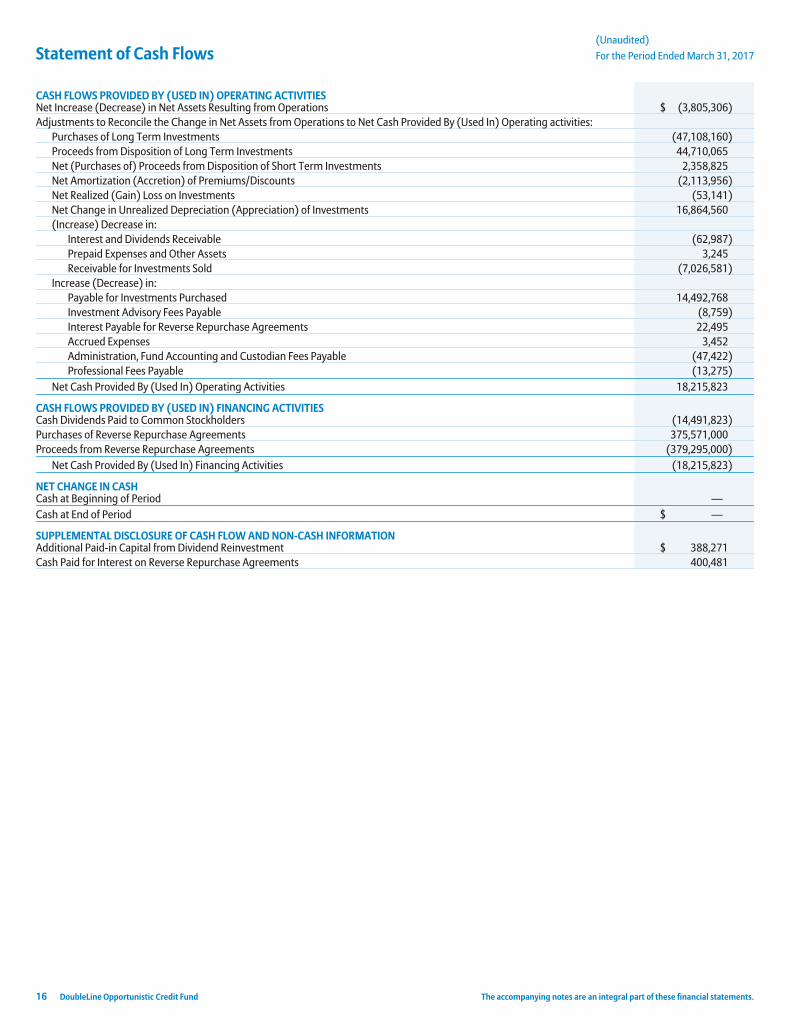
CASH FLOWS PROVIDED BY (USED IN) OPERATING ACTIVITIESNet Increase (Decrease) in Net Assets Resulting from Operations $ (3,805,306)Adjustments to Reconcile the Change in Net Assets from Operations to Net Cash Provided By (Used In) Operating activities:
Purchases of Long Term Investments (47,108,160)Proceeds from Disposition of Long Term Investments 44,710,065Net (Purchases of) Proceeds from Disposition of Short Term Investments 2,358,825Net Amortization (Accretion) of Premiums/Discounts (2,113,956)Net Realized (Gain) Loss on Investments (53,141)Net Change in Unrealized Depreciation (Appreciation) of Investments 16,864,560(Increase) Decrease in:
Interest and Dividends Receivable (62,987)Prepaid Expenses and Other Assets 3,245Receivable for Investments Sold (7,026,581)
Increase (Decrease) in:Payable for Investments Purchased 14,492,768Investment Advisory Fees Payable (8,759)Interest Payable for Reverse Repurchase Agreements 22,495Accrued Expenses 3,452Administration, Fund Accounting and Custodian Fees Payable (47,422)Professional Fees Payable (13,275)
Net Cash Provided By (Used In) Operating Activities 18,215,823
CASH FLOWS PROVIDED BY (USED IN) FINANCING ACTIVITIESCash Dividends Paid to Common Stockholders (14,491,823)Purchases of Reverse Repurchase Agreements 375,571,000Proceeds from Reverse Repurchase Agreements (379,295,000)
Net Cash Provided By (Used In) Financing Activities (18,215,823)
NET CHANGE IN CASHCash at Beginning of Period —Cash at End of Period $ —
SUPPLEMENTAL DISCLOSURE OF CASH FLOW AND NON-CASH INFORMATIONAdditional Paid-in Capital from Dividend Reinvestment $ 388,271Cash Paid for Interest on Reverse Repurchase Agreements 400,481
16 DoubleLine Opportunistic Credit Fund The accompanying notes are an integral part of these financial statements.
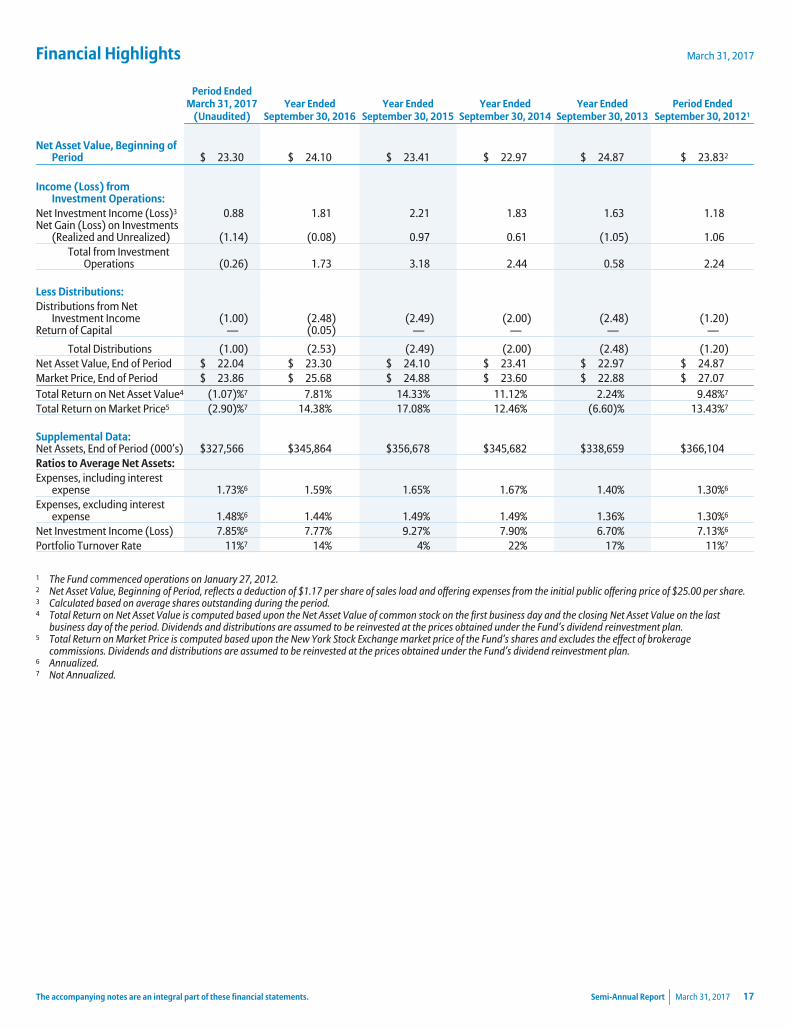
Financial Highlights March 31, 2017
Period EndedMarch 31, 2017
(Unaudited)Year Ended
September 30, 2016Year Ended
September 30, 2015Year Ended
September 30, 2014Year Ended
September 30, 2013Period Ended
September 30, 20121
Net Asset Value, Beginning ofPeriod $ 23.30 $ 24.10 $ 23.41 $ 22.97 $ 24.87 $ 23.832
Income (Loss) fromInvestment Operations:
Net Investment Income (Loss)3 0.88 1.81 2.21 1.83 1.63 1.18Net Gain (Loss) on Investments
(Realized and Unrealized) (1.14) (0.08) 0.97 0.61 (1.05) 1.06Total from Investment
Operations (0.26) 1.73 3.18 2.44 0.58 2.24
Less Distributions:Distributions from Net
Investment Income (1.00) (2.48) (2.49) (2.00) (2.48) (1.20)Return of Capital — (0.05) — — — —
Total Distributions (1.00) (2.53) (2.49) (2.00) (2.48) (1.20)Net Asset Value, End of Period $ 22.04 $ 23.30 $ 24.10 $ 23.41 $ 22.97 $ 24.87Market Price, End of Period $ 23.86 $ 25.68 $ 24.88 $ 23.60 $ 22.88 $ 27.07Total Return on Net Asset Value4 (1.07)%7 7.81% 14.33% 11.12% 2.24% 9.48%7
Total Return on Market Price5 (2.90)%7 14.38% 17.08% 12.46% (6.60)% 13.43%7
Supplemental Data:Net Assets, End of Period (000’s) $327,566 $345,864 $356,678 $345,682 $338,659 $366,104Ratios to Average Net Assets:Expenses, including interest
expense 1.73%6 1.59% 1.65% 1.67% 1.40% 1.30%6
Expenses, excluding interestexpense 1.48%6 1.44% 1.49% 1.49% 1.36% 1.30%6
Net Investment Income (Loss) 7.85%6 7.77% 9.27% 7.90% 6.70% 7.13%6
Portfolio Turnover Rate 11%7 14% 4% 22% 17% 11%7
1 The Fund commenced operations on January 27, 2012.2 Net Asset Value, Beginning of Period, reflects a deduction of $1.17 per share of sales load and offering expenses from the initial public offering price of $25.00 per share.3 Calculated based on average shares outstanding during the period.4 Total Return on Net Asset Value is computed based upon the Net Asset Value of common stock on the first business day and the closing Net Asset Value on the last
business day of the period. Dividends and distributions are assumed to be reinvested at the prices obtained under the Fund’s dividend reinvestment plan.5 Total Return on Market Price is computed based upon the New York Stock Exchange market price of the Fund’s shares and excludes the effect of brokerage
commissions. Dividends and distributions are assumed to be reinvested at the prices obtained under the Fund’s dividend reinvestment plan.6 Annualized.7 Not Annualized.
The accompanying notes are an integral part of these financial statements. Semi-Annual Report March 31, 2017 17
Notes to Financial Statements(Unaudited)
March 31, 2017
1. Organization
DoubleLine Opportunistic Credit Fund (the “Fund”) was formed as a closed-end management investment company registeredunder the Investment Company Act of 1940, as amended (the “1940 Act”), and originally classified as a non-diversified fund. TheFund is currently operating as a diversified fund. The Fund has previously operated as a non-diversified fund and may operate as anon-diversified fund in the future to the extent permitted by applicable law. The Fund was organized as a Massachusetts businesstrust on July 22, 2011 and commenced operations on January 27, 2012. The Fund is listed on the New York Stock Exchange(“NYSE”) under the symbol “DBL”. The Fund’s investment objective is to seek high total investment return by providing a high levelof current income and the potential for capital appreciation.
2. Significant Accounting Policies
The Fund is an investment company that applies the accounting and reporting guidance issued in Topic 946, “Financial Services—Investment Companies”, by the Financial Accounting Standards Board (“FASB”). The following is a summary of the significantaccounting policies of the Fund. These policies are in conformity with accounting principles generally accepted in the United Statesof America (“US GAAP”).
A. Security Valuation. The Fund has adopted US GAAP fair value accounting standards which establish a definition of fair value andset out a hierarchy for measuring fair value. These standards require additional disclosures about the various inputs and valuationtechniques used to develop the measurements of fair value and a discussion of changes in valuation techniques and related inputsduring the period. These inputs are summarized in the three broad levels listed below:
• Level 1—Unadjusted quoted market prices in active markets for identical securities
• Level 2—Quoted prices for identical or similar assets in markets that are not active, or inputs derived from observablemarket data
• Level 3—Significant unobservable inputs (including the reporting entity’s estimates and assumptions)
Assets and liabilities may be transferred between levels. The Fund uses end of period timing recognition to account for anytransfers.
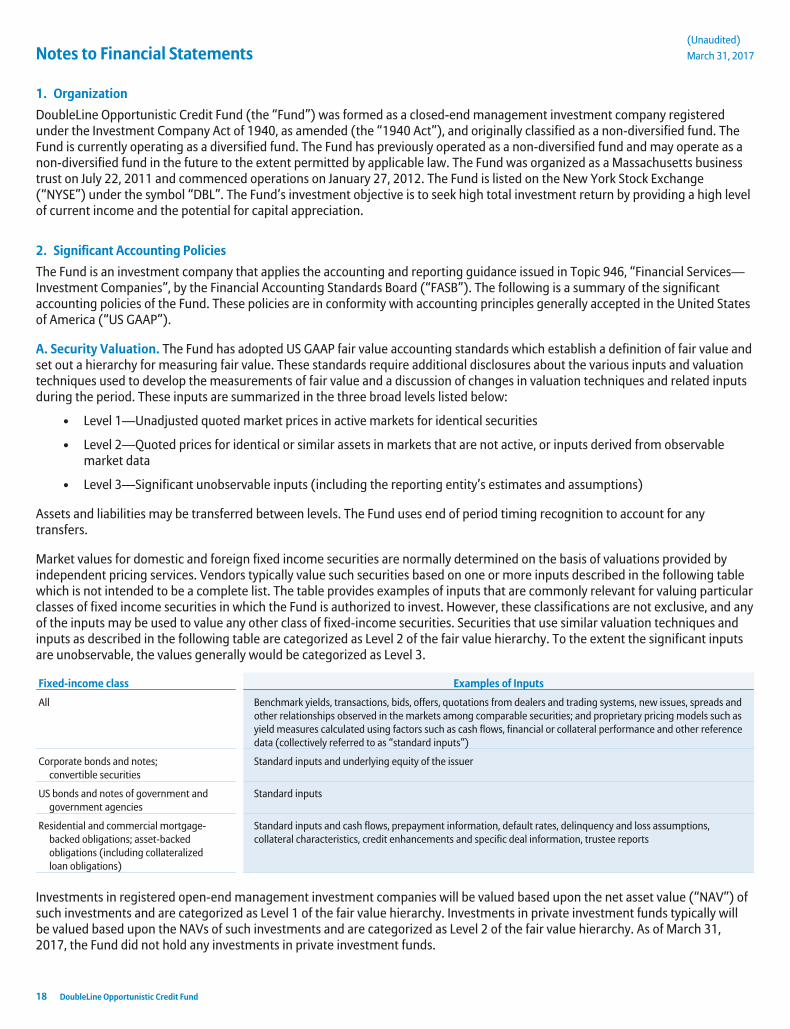
Market values for domestic and foreign fixed income securities are normally determined on the basis of valuations provided byindependent pricing services. Vendors typically value such securities based on one or more inputs described in the following tablewhich is not intended to be a complete list. The table provides examples of inputs that are commonly relevant for valuing particularclasses of fixed income securities in which the Fund is authorized to invest. However, these classifications are not exclusive, and anyof the inputs may be used to value any other class of fixed-income securities. Securities that use similar valuation techniques andinputs as described in the following table are categorized as Level 2 of the fair value hierarchy. To the extent the significant inputsare unobservable, the values generally would be categorized as Level 3.
Fixed-income class Examples of Inputs
All Benchmark yields, transactions, bids, offers, quotations from dealers and trading systems, new issues, spreads andother relationships observed in the markets among comparable securities; and proprietary pricing models such asyield measures calculated using factors such as cash flows, financial or collateral performance and other referencedata (collectively referred to as “standard inputs”)
Corporate bonds and notes;convertible securities
Standard inputs and underlying equity of the issuer
US bonds and notes of government andgovernment agencies
Standard inputs
Residential and commercial mortgage-backed obligations; asset-backedobligations (including collateralizedloan obligations)
Standard inputs and cash flows, prepayment information, default rates, delinquency and loss assumptions,collateral characteristics, credit enhancements and specific deal information, trustee reports
Investments in registered open-end management investment companies will be valued based upon the net asset value (“NAV”) ofsuch investments and are categorized as Level 1 of the fair value hierarchy. Investments in private investment funds typically willbe valued based upon the NAVs of such investments and are categorized as Level 2 of the fair value hierarchy. As of March 31,2017, the Fund did not hold any investments in private investment funds.
18 DoubleLine Opportunistic Credit Fund
(Unaudited)
March 31, 2017
The Fund may enter into reverse repurchase agreements. In a reverse repurchase agreement, the Fund sells to a financialinstitution a security that it holds with an agreement to repurchase the same security at an agreed-upon price and date. A reverserepurchase agreement involves the risk that the market value of the security may decline below the repurchase price of thesecurity. The Fund will segregate assets determined to be liquid by the Adviser or otherwise cover its obligations under reverserepurchase agreements. Due to the short term nature of the reverse repurchase agreements, face value approximates fair value atMarch 31, 2017.
Securities may be fair valued in accordance with the fair valuation procedures approved by the Board of Trustees (the “Board”). Thevaluation committee is generally responsible for overseeing the day to day valuation processes and reports periodically to theBoard. The valuation committee and the pricing group are authorized to make all necessary determinations of the fair values ofportfolio securities and other assets for which market quotations are not readily available or if it is deemed that the prices obtainedfrom brokers and dealers or independent pricing services are deemed to be unreliable indicators of market or fair value.
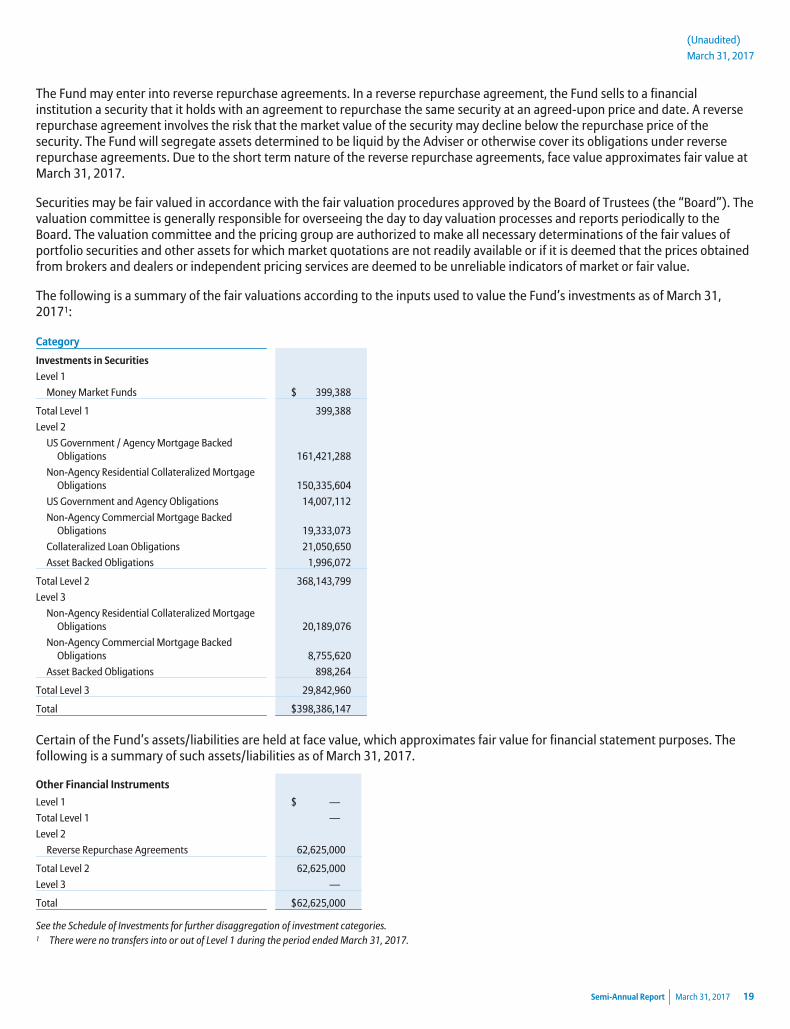
The following is a summary of the fair valuations according to the inputs used to value the Fund’s investments as of March 31,20171:
Category
Investments in Securities
Level 1
Money Market Funds $ 399,388
Total Level 1 399,388
Level 2
US Government / Agency Mortgage BackedObligations 161,421,288
Non-Agency Residential Collateralized MortgageObligations 150,335,604
US Government and Agency Obligations 14,007,112
Non-Agency Commercial Mortgage BackedObligations 19,333,073
Collateralized Loan Obligations 21,050,650
Asset Backed Obligations 1,996,072
Total Level 2 368,143,799
Level 3
Non-Agency Residential Collateralized MortgageObligations 20,189,076
Non-Agency Commercial Mortgage BackedObligations 8,755,620
Asset Backed Obligations 898,264
Total Level 3 29,842,960
Total $398,386,147
Certain of the Fund’s assets/liabilities are held at face value, which approximates fair value for financial statement purposes. Thefollowing is a summary of such assets/liabilities as of March 31, 2017.
Other Financial Instruments
Level 1 $ —
Total Level 1 —
Level 2
Reverse Repurchase Agreements 62,625,000
Total Level 2 62,625,000
Level 3 —
Total $62,625,000
See the Schedule of Investments for further disaggregation of investment categories.1 There were no transfers into or out of Level 1 during the period ended March 31, 2017.
Semi-Annual Report March 31, 2017 19
Notes to Financial Statements (Cont.)(Unaudited)
March 31, 2017
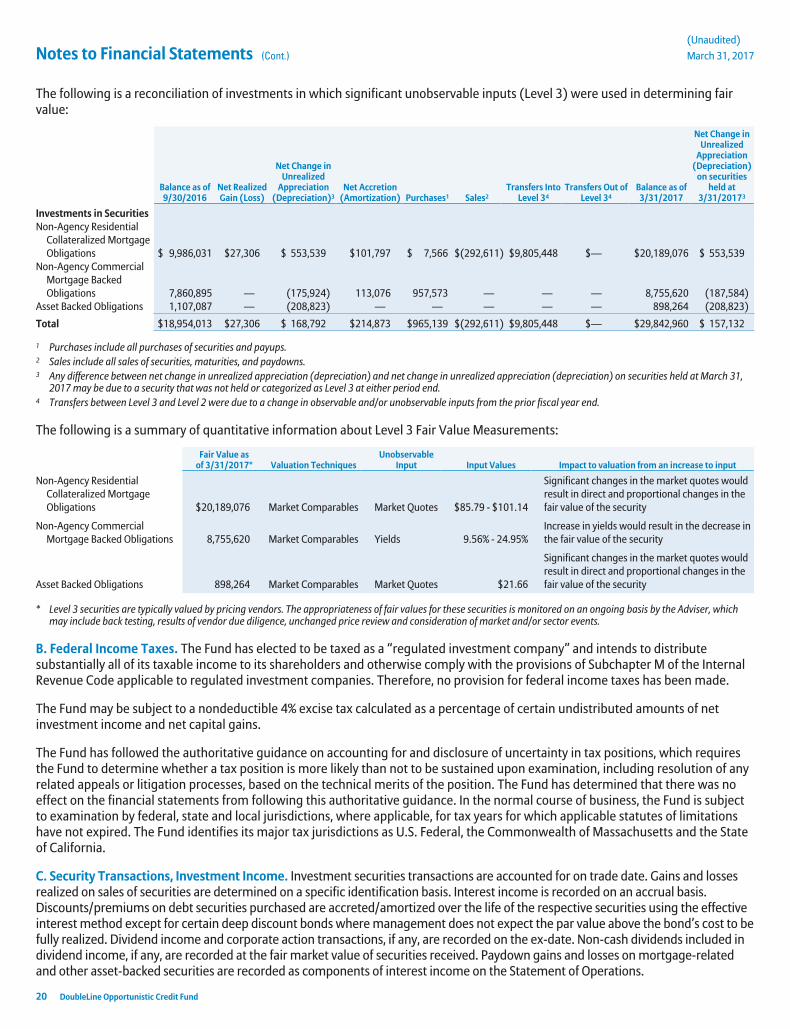
The following is a reconciliation of investments in which significant unobservable inputs (Level 3) were used in determining fairvalue:
Balance as of9/30/2016
Net RealizedGain (Loss)
Net Change inUnrealized
Appreciation(Depreciation)3
Net Accretion(Amortization) Purchases1 Sales2
Transfers IntoLevel 34
Transfers Out ofLevel 34
Balance as of3/31/2017
Net Change inUnrealized
Appreciation(Depreciation)
on securitiesheld at
3/31/20173
Investments in SecuritiesNon-Agency Residential
Collateralized MortgageObligations $ 9,986,031 $27,306 $ 553,539 $101,797 $ 7,566 $(292,611) $9,805,448 $— $20,189,076 $ 553,539
Non-Agency CommercialMortgage BackedObligations 7,860,895 — (175,924) 113,076 957,573 — — — 8,755,620 (187,584)
Asset Backed Obligations 1,107,087 — (208,823) — — — — — 898,264 (208,823)
Total $18,954,013 $27,306 $ 168,792 $214,873 $965,139 $(292,611) $9,805,448 $— $29,842,960 $ 157,132
1 Purchases include all purchases of securities and payups.2 Sales include all sales of securities, maturities, and paydowns.3 Any difference between net change in unrealized appreciation (depreciation) and net change in unrealized appreciation (depreciation) on securities held at March 31,
2017 may be due to a security that was not held or categorized as Level 3 at either period end.4 Transfers between Level 3 and Level 2 were due to a change in observable and/or unobservable inputs from the prior fiscal year end.
The following is a summary of quantitative information about Level 3 Fair Value Measurements:
Fair Value asof 3/31/2017* Valuation Techniques
UnobservableInput Input Values Impact to valuation from an increase to input
Non-Agency ResidentialCollateralized MortgageObligations $20,189,076 Market Comparables Market Quotes $85.79 - $101.14
Significant changes in the market quotes wouldresult in direct and proportional changes in thefair value of the security
Non-Agency CommercialMortgage Backed Obligations 8,755,620 Market Comparables Yields 9.56% - 24.95%
Increase in yields would result in the decrease inthe fair value of the security
Asset Backed Obligations 898,264 Market Comparables Market Quotes $21.66
Significant changes in the market quotes wouldresult in direct and proportional changes in thefair value of the security
* Level 3 securities are typically valued by pricing vendors. The appropriateness of fair values for these securities is monitored on an ongoing basis by the Adviser, whichmay include back testing, results of vendor due diligence, unchanged price review and consideration of market and/or sector events.
B. Federal Income Taxes. The Fund has elected to be taxed as a “regulated investment company” and intends to distributesubstantially all of its taxable income to its shareholders and otherwise comply with the provisions of Subchapter M of the InternalRevenue Code applicable to regulated investment companies. Therefore, no provision for federal income taxes has been made.
The Fund may be subject to a nondeductible 4% excise tax calculated as a percentage of certain undistributed amounts of netinvestment income and net capital gains.
The Fund has followed the authoritative guidance on accounting for and disclosure of uncertainty in tax positions, which requiresthe Fund to determine whether a tax position is more likely than not to be sustained upon examination, including resolution of anyrelated appeals or litigation processes, based on the technical merits of the position. The Fund has determined that there was noeffect on the financial statements from following this authoritative guidance. In the normal course of business, the Fund is subjectto examination by federal, state and local jurisdictions, where applicable, for tax years for which applicable statutes of limitationshave not expired. The Fund identifies its major tax jurisdictions as U.S. Federal, the Commonwealth of Massachusetts and the Stateof California.
C. Security Transactions, Investment Income. Investment securities transactions are accounted for on trade date. Gains and lossesrealized on sales of securities are determined on a specific identification basis. Interest income is recorded on an accrual basis.Discounts/premiums on debt securities purchased are accreted/amortized over the life of the respective securities using the effectiveinterest method except for certain deep discount bonds where management does not expect the par value above the bond’s cost to befully realized. Dividend income and corporate action transactions, if any, are recorded on the ex-date. Non-cash dividends included individend income, if any, are recorded at the fair market value of securities received. Paydown gains and losses on mortgage-relatedand other asset-backed securities are recorded as components of interest income on the Statement of Operations.
20 DoubleLine Opportunistic Credit Fund
(Unaudited)
March 31, 2017
D. Dividends and Distributions to Shareholders. Dividends from net investment income will be declared and paid monthly. The Fundwill distribute any net realized long or short-term capital gains at least annually. Distributions are recorded on the ex-dividend date.
Income and capital gain distributions are determined in accordance with income tax regulations which may differ from US GAAP.Permanent book and tax basis differences relating to shareholder distributions will result in reclassifications between paid-incapital, undistributed (accumulated) net investment income (loss), and/or undistributed (accumulated) realized gain (loss).Undistributed (accumulated) net investment income or loss may include temporary book and tax basis differences which willreverse in a subsequent period. Any taxable income or capital gain remaining at fiscal year end is distributed in the following year.
E. Use of Estimates. The preparation of financial statements in conformity with US GAAP requires management to make estimatesand assumptions that affect the reported amounts of assets and liabilities and disclosure of contingent assets and liabilities at thedate of the financial statements, as well as the reported amounts of revenues and expenses during the period. Actual results coulddiffer from those estimates.
F. Share Valuation. The NAV per share of the Fund is calculated by dividing the sum of the value of the securities held by the Fund,plus cash and other assets, minus all liabilities (including estimated accrued expenses) by the total number of shares outstanding,rounded to the nearest cent. The Fund’s NAV is calculated on days when the NYSE opens for regular trading (except that the Funddoes not calculate its NAV on holidays when the principal U.S. bond markets are closed, such as Columbus Day and Veterans Day).
G. Guarantees and Indemnifications. Under the Fund’s organizational documents, each Trustee and officer of the Fund isindemnified, to the extent permitted by the 1940 Act, against certain liabilities that may arise out of performance of their duties to theFund. Additionally, in the normal course of business, the Fund enters into contracts that contain a variety of indemnification clauses.The Fund’s maximum exposure under these arrangements is unknown as this would involve future claims that may be made againstthe Fund that have not yet occurred. However, the Fund has not had prior claims or losses pursuant to these contracts.
3. Related Party Transactions
DoubleLine Capital LP (the “Adviser”) provides the Fund with investment management services under an Investment ManagementAgreement (the “Agreement”). Under the Agreement, the Adviser manages the investment of the assets of the Fund, places orders forthe purchase and sale of its portfolio securities and is responsible for providing certain resources to assist with the day-to-daymanagement of the Fund’s business affairs. As compensation for its services, the Adviser is entitled to a monthly fee at the annual rateof 1.00% of the average daily total managed assets of the Fund. Total managed assets means the total assets of the Fund (includingassets attributable to any reverse repurchase agreements, dollar roll transactions or similar transactions, borrowings, and/or preferredshares that may be outstanding) minus accrued liabilities (other than liabilities in respect of reverse repurchase agreements, dollar rolltransactions or similar transactions, and borrowings). An affiliate of the Adviser owned 6,744 shares of the Fund as of March 31, 2017.The Adviser has arrangements with DoubleLine Group LP to provide personnel and other resources to the Fund.
4. Purchases and Sales of Securities
For the period ended March 31, 2017, purchases and sales of investments, excluding short term investments, were $47,108,160and $44,710,065 respectively. There were no transactions in U.S. Government securities (defined as long-term U.S. Treasury bills,notes and bonds) during the period.
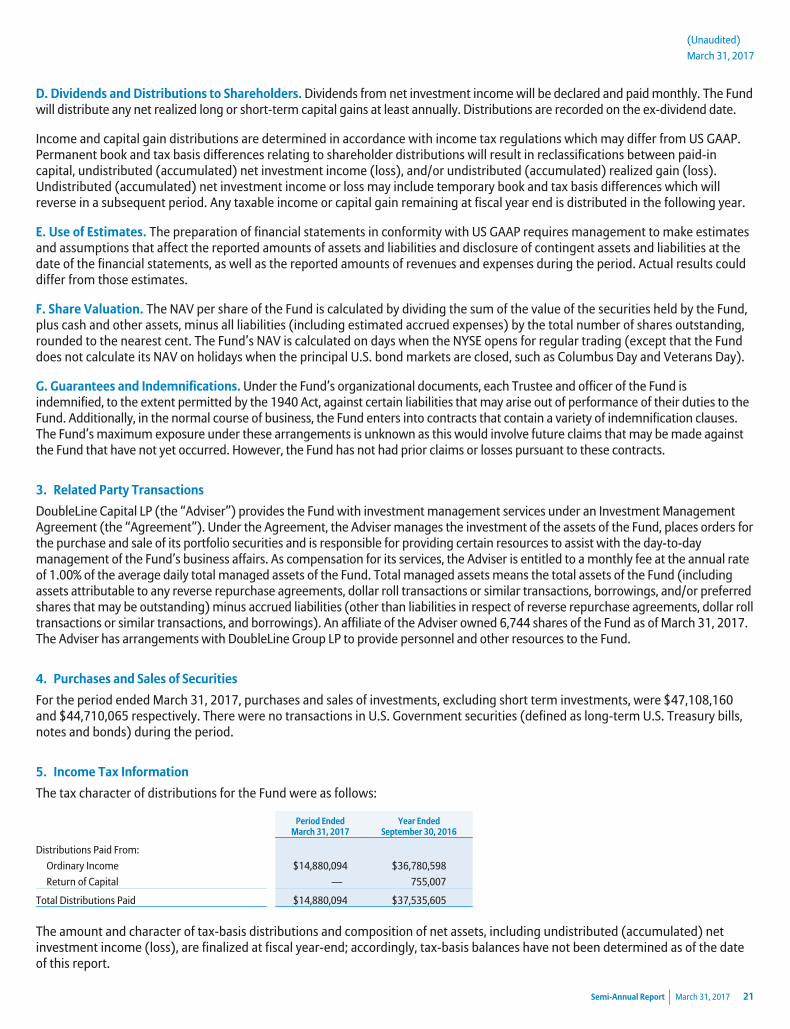
5. Income Tax Information
The tax character of distributions for the Fund were as follows:
Period EndedMarch 31, 2017
Year EndedSeptember 30, 2016
Distributions Paid From:
Ordinary Income $14,880,094 $36,780,598
Return of Capital — 755,007
Total Distributions Paid $14,880,094 $37,535,605
The amount and character of tax-basis distributions and composition of net assets, including undistributed (accumulated) netinvestment income (loss), are finalized at fiscal year-end; accordingly, tax-basis balances have not been determined as of the dateof this report.
Semi-Annual Report March 31, 2017 21
Notes to Financial Statements (Cont.)(Unaudited)
March 31, 2017
The Fund designated as long-term capital gain dividend, pursuant to Internal Revenue Code Section 852(b)(3), the amountnecessary to reduce the earnings and profits of the Fund related to net capital gain to zero for the tax year endedSeptember 30, 2016.
The cost basis of investments for federal income tax purposes as of March 31, 2017, was as follows:
Tax Cost of Investments $392,322,681
Gross Tax Unrealized Appreciation 21,384,522
Gross Tax Unrealized Depreciation (15,321,056)
Net Tax Unrealized Appreciation (Depreciation) $ 6,063,466
As of September 30, 2016, the components of accumulated earnings (losses) for income tax purposes were as follows:
Net Tax Unrealized Appreciation (Depreciation) $ 22,928,026
Undistributed Ordinary Income —
Total Distributable Earnings —
Other Accumulated Gains (Losses) (30,016,665)
Total Accumulated Earnings (Losses) $ (7,088,639)
As of September 30, 2016, the following capital loss carryforward was available:
Capital LossCarryforward Expires
$26,129,016 Indefinite
The Fund may elect to defer to the first day of the next taxable year all or part of any late-year ordinary loss or post-October capitalloss. As of September 30, 2016, the Fund deferred, on a tax basis, qualified late year losses of $3,885,650.
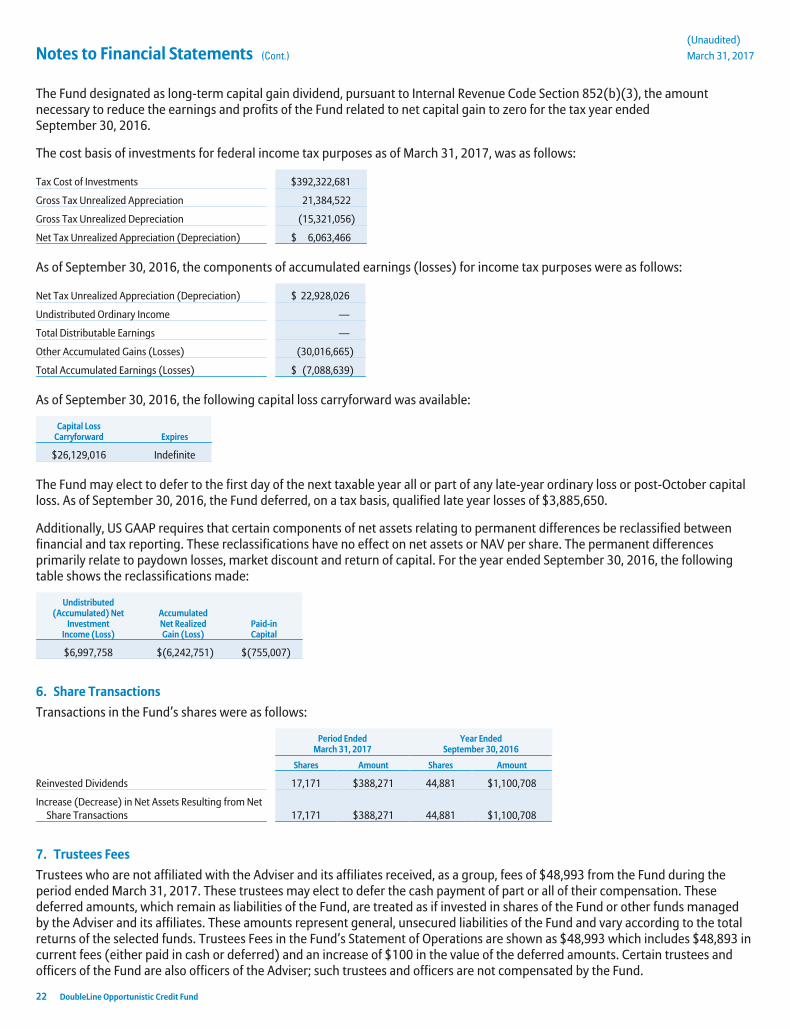
Additionally, US GAAP requires that certain components of net assets relating to permanent differences be reclassified betweenfinancial and tax reporting. These reclassifications have no effect on net assets or NAV per share. The permanent differencesprimarily relate to paydown losses, market discount and return of capital. For the year ended September 30, 2016, the followingtable shows the reclassifications made:
Undistributed(Accumulated) Net
InvestmentIncome (Loss)
AccumulatedNet RealizedGain (Loss)
Paid-inCapital
$6,997,758 $(6,242,751) $(755,007)
6. Share Transactions
Transactions in the Fund’s shares were as follows:
Period EndedMarch 31, 2017
Year EndedSeptember 30, 2016
Shares Amount Shares Amount
Reinvested Dividends 17,171 $388,271 44,881 $1,100,708
Increase (Decrease) in Net Assets Resulting from NetShare Transactions 17,171 $388,271 44,881 $1,100,708
7. Trustees Fees
Trustees who are not affiliated with the Adviser and its affiliates received, as a group, fees of $48,993 from the Fund during theperiod ended March 31, 2017. These trustees may elect to defer the cash payment of part or all of their compensation. Thesedeferred amounts, which remain as liabilities of the Fund, are treated as if invested in shares of the Fund or other funds managedby the Adviser and its affiliates. These amounts represent general, unsecured liabilities of the Fund and vary according to the totalreturns of the selected funds. Trustees Fees in the Fund’s Statement of Operations are shown as $48,993 which includes $48,893 incurrent fees (either paid in cash or deferred) and an increase of $100 in the value of the deferred amounts. Certain trustees andofficers of the Fund are also officers of the Adviser; such trustees and officers are not compensated by the Fund.
22 DoubleLine Opportunistic Credit Fund
(Unaudited)
March 31, 2017
8. Principal Risks
Below are summaries of some, but not all, of the principal risks of investing in the Fund, each of which could adversely affect theFund’s NAV, market price, yield, and total return. The Fund’s prospectus provided additional information regarding these and otherrisks of investing in the Fund at the time of the initial public offering of the Fund’s shares.
• market discount risk: The price of the Fund’s common shares of beneficial interest will fluctuate with market conditionsand other factors. Shares of closed-end management investment companies frequently trade at a discount from their netasset value.
• issuer risk: The value of securities may decline for a number of reasons that directly relate to the issuer, such as its financialstrength, management performance, financial leverage and reduced demand for the issuer’s goods and services, as well asthe historical and prospective earnings of the issuer and the value of its assets.
• investment and market risk: An investment in the Fund is subject to the risk of loss. The value of the Fund’s securities andfinancial assets may move up or down, sometimes rapidly and unpredictably. Further, the value of securities held by theFund may decline in value due to factors affecting securities markets generally or particular industries. Securities marketsmay, in response to governmental actions or intervention, economic or market developments, or other external factors,experience periods of high volatility and reduced liquidity. Certain securities may be difficult to value during such periods.These risks may be heightened for fixed income securities due to the current historically low interest rate environment.
• collateralized debt obligations risk: The risks of an investment in a collateralized debt obligation (“CDO”) depend largelyon the quality and type of the collateral and the tranche of the CDO in which the Fund invests. Normally, collateralized bondobligations (“CBOs”), CLOs and other CDOs are privately offered and sold, and thus are not registered under the securitieslaws. As a result, investments in CDOs may be characterized by the Fund as illiquid securities; however, an active dealermarket, or other relevant measures of liquidity, may exist for CDOs allowing a CDO potentially to be deemed liquid by theAdviser under liquidity policies approved by the Board. In addition to the risks associated with debt instruments (e.g., interestrate risk and credit risk), CDOs carry additional risks including, but not limited to: (i) the possibility that distributions fromcollateral will not be adequate to make interest or other payments; (ii) the quality of the collateral may decline in value ordefault; (iii) the possibility that the Fund may invest in CDOs that are subordinate to other classes; and (iv) the complexstructure of the security may not be fully understood at the time of investment and may produce disputes with the issuer orunexpected investment results.
• credit risk: Credit risk is the risk that one or more of the Fund’s investments in debt securities or other instruments willdecline in price, or fail to pay interest, liquidation value or principal when due, because the issuer of the obligation or theissuer of a reference security experiences an actual or perceived decline in its financial status.
• mortgage-backed securities risk: The risk that borrowers may default on their mortgage obligations or the guaranteesunderlying the mortgage-backed securities will default or otherwise fail and that, during periods of falling interest rates,mortgage-backed securities will be called or prepaid, which may result in the Fund having to reinvest proceeds in otherinvestments at a lower interest rate. During periods of rising interest rates, the average life of a mortgage-backed securitymay extend, which may lock in a below-market interest rate, increase the security’s duration, and reduce the value of thesecurity. Enforcing rights against the underlying assets or collateral may be difficult, or the underlying assets or collateralmay be insufficient if the issuer defaults. The values of certain types of mortgage-backed securities, such as inverse floatersand interest-only and principal-only securities, may be extremely sensitive to changes in interest rates and prepaymentrates.
• sovereign debt obligations risk: Investments in countries’ government debt obligations involve special risks. The issuer orgovernmental entity that controls the repayment of sovereign debt may not be able or willing to repay the principal and/orinterest when due in accordance with the terms of such debt or otherwise in a timely manner.
• loan risk: Investments in loans are in many cases subject to the risks associated with below-investment grade securities.Investments in loans are also subject to special risks, including, among others, the risk that (i) if the Fund holds a loanthrough another financial institution, or relies on a financial institution to administer the loan, the Fund’s receipt of principaland interest on the loan is subject to the credit risk of that financial institution; (ii) loans in which the Fund invests typicallypay interest at floating rates, and the borrower may have the ability to change or adjust the interest rate on a loan or undercircumstances that would be unfavorable to the Fund; (iii) it is possible that any collateral securing a loan may be insufficientor unavailable to the Fund; (iv) investments in highly leveraged loans or loans of stressed, distressed, or defaulted issuersmay be subject to significant credit and liquidity risk; (v) transactions in loans may settle on a delayed basis, and the Fundpotentially may not receive the proceeds from the sale of a loan for a substantial period of time after the sale; and (vi) loansmay be difficult to value and may be illiquid, which may adversely affect an investment in the Fund. It is unclear whether the
Semi-Annual Report March 31, 2017 23
Notes to Financial Statements (Cont.)(Unaudited)
March 31, 2017
protections of the securities laws against fraud and misrepresentation extend to loans and other forms of directindebtedness. In the absence of definitive regulatory guidance, the Fund relies on the Adviser’s research in an attempt toavoid situations where fraud or misrepresentation could adversely affect the Fund. There can be no assurance that theAdviser’s efforts in this regard will be successful.
• inverse floaters and related securities risk: Investments in inverse floaters, residual interest tender option bonds andsimilar instruments expose the Fund to the same risks as investments in debt securities and derivatives, as well as other risks,including those associated with leverage and increased volatility. An investment in these securities typically will involvegreater risk than an investment in a fixed rate security. Distributions on inverse floaters, residual interest tender optionbonds and similar instruments will typically bear an inverse relationship to short term interest rates and typically will bereduced or, potentially, eliminated as interest rates rise.
• high yield risk: The risk that debt instruments rated below investment grade or debt instruments that are unrated anddetermined by the Adviser to be of comparable quality are predominantly speculative. These instruments, commonly knownas “junk bonds,” have a higher degree of default risk and may be less liquid than higher-rated bonds. These instruments maybe subject to greater price volatility due to such factors as specific corporate developments, interest rate sensitivity, negativeperceptions of high yield investments generally, and less secondary market liquidity.
• interest rate risk: Interest rate risk is the risk that debt obligations and other instruments in the Fund’s portfolio will changein value because of changes in market interest rates. The value of an instrument with a longer duration (whether positive ornegative) will be more sensitive to changes in interest rates than a similar instrument with a shorter duration. As of the dateof this report, interest rates in the U.S. are at or near historically low levels, increasing the exposure of bond investors to therisks associated with rising interest rates.
• foreign (non-U.S.) investment risk: The Fund’s investments in and exposure to foreign securities involve special risks. Forexample, the value of these investments may decline in response to unfavorable political and legal developments, unreliableor untimely information or economic and financial instability. Foreign securities may experience more rapid and extremechanges in value than investments in securities of U.S. issuers. Investing in securities of issuers based or doing business inemerging markets entails all of the risks of investing in securities of foreign issuers, but to a heightened degree. To theextent that the investments are made in a limited number of countries, events in those countries will have a more significantimpact on the Fund. If the Fund buys securities denominated in a foreign currency, receives income in foreign currencies orholds foreign currencies from time to time, the value of the Fund’s assets, as measured in U.S. dollars, can be affectedunfavorably by changes in exchange rates relative to the U.S. dollar or other foreign currencies. Foreign markets are alsosubject to the risk that a foreign government could restrict foreign exchange transactions or otherwise implementunfavorable currency regulations.
• foreign currency risk: The Fund’s investments in or exposure to foreign currencies or in securities or instruments thattrade, or receive revenues, in foreign currencies are subject to the risk that those currencies will decline in value relative tothe U.S. dollar or, in the case of hedging positions (if used), that the U.S. dollar will decline in value relative to the currencybeing hedged.
• emerging markets risk: Investing in emerging market countries involves substantial risk due to the potential to havelimited information compared to what may be available or required by more developed countries; higher brokerage costs;different accounting, auditing and financial reporting standards; different clearing and settlement procedures and custodialservices; the potential for less developed legal systems and thinner trading markets as compared to those in developedcountries; currency blockages or transfer restrictions; an emerging market country’s dependence on revenue from particularcommodities or international aid; and expropriation, nationalization or other adverse political or economic developments.
• credit default swaps risk: Credit default swaps involve greater risks than investing in the reference obligation directly aswell as liquidity risk, counterparty risk and credit risk. A buyer will lose its investment and recover nothing should no event ofdefault occur. When the Fund acts as a seller of a credit default swap, it is exposed to many of the same risks of leveragedescribed herein since if an event of default occurs the seller must pay the buyer the full notional value of the referenceobligation.
• leverage risk: Leverage is a speculative technique that may expose the Fund to greater risk and increased costs. Whenleverage is used, the net asset value and market price of the Fund’s shares and the Fund’s investment return will likely bemore volatile.
• derivatives risk: Derivatives are subject to a number of risks applicable to other investments, such as liquidity risk, issuerrisk, credit risk, interest rate risk, leverage risk, counterparty risk, management risk and, if applicable, smaller company risk.
24 DoubleLine Opportunistic Credit Fund
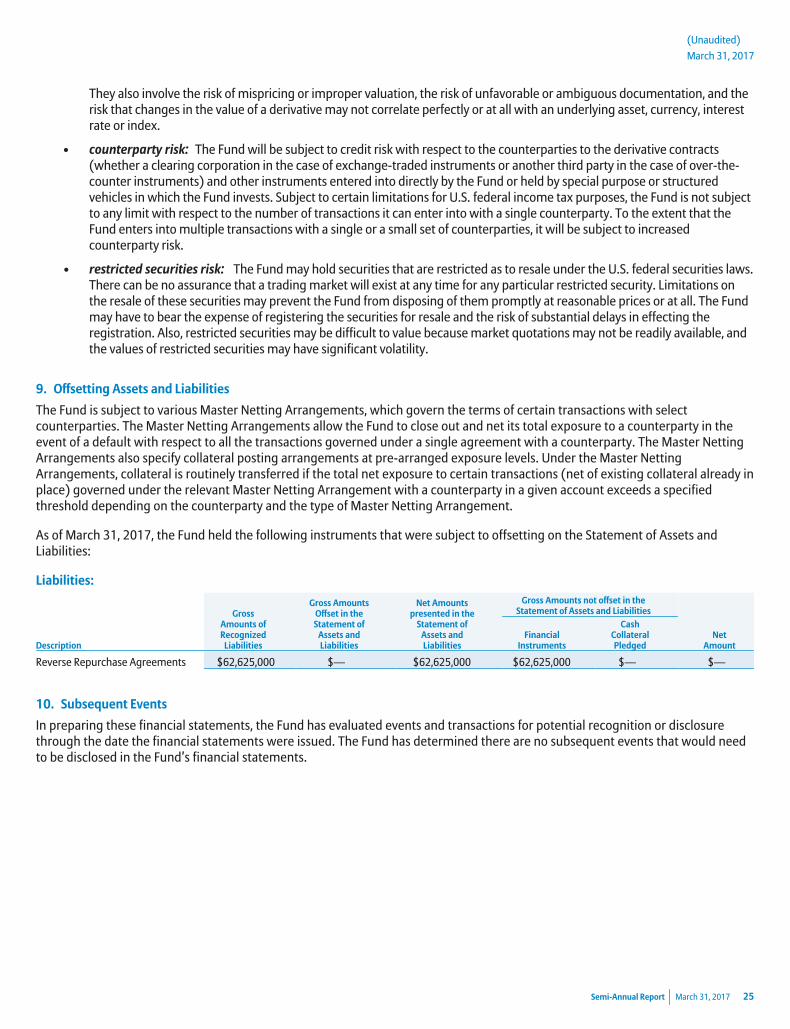
(Unaudited)
March 31, 2017
They also involve the risk of mispricing or improper valuation, the risk of unfavorable or ambiguous documentation, and therisk that changes in the value of a derivative may not correlate perfectly or at all with an underlying asset, currency, interestrate or index.
• counterparty risk: The Fund will be subject to credit risk with respect to the counterparties to the derivative contracts(whether a clearing corporation in the case of exchange-traded instruments or another third party in the case of over-the-counter instruments) and other instruments entered into directly by the Fund or held by special purpose or structuredvehicles in which the Fund invests. Subject to certain limitations for U.S. federal income tax purposes, the Fund is not subjectto any limit with respect to the number of transactions it can enter into with a single counterparty. To the extent that theFund enters into multiple transactions with a single or a small set of counterparties, it will be subject to increasedcounterparty risk.
• restricted securities risk: The Fund may hold securities that are restricted as to resale under the U.S. federal securities laws.There can be no assurance that a trading market will exist at any time for any particular restricted security. Limitations onthe resale of these securities may prevent the Fund from disposing of them promptly at reasonable prices or at all. The Fundmay have to bear the expense of registering the securities for resale and the risk of substantial delays in effecting theregistration. Also, restricted securities may be difficult to value because market quotations may not be readily available, andthe values of restricted securities may have significant volatility.
9. Offsetting Assets and Liabilities
The Fund is subject to various Master Netting Arrangements, which govern the terms of certain transactions with selectcounterparties. The Master Netting Arrangements allow the Fund to close out and net its total exposure to a counterparty in theevent of a default with respect to all the transactions governed under a single agreement with a counterparty. The Master NettingArrangements also specify collateral posting arrangements at pre-arranged exposure levels. Under the Master NettingArrangements, collateral is routinely transferred if the total net exposure to certain transactions (net of existing collateral already inplace) governed under the relevant Master Netting Arrangement with a counterparty in a given account exceeds a specifiedthreshold depending on the counterparty and the type of Master Netting Arrangement.
As of March 31, 2017, the Fund held the following instruments that were subject to offsetting on the Statement of Assets andLiabilities:
Liabilities:
GrossAmounts ofRecognized
Liabilities
Gross AmountsOffset in theStatement of
Assets andLiabilities
Net Amountspresented in the
Statement ofAssets andLiabilities
Gross Amounts not offset in theStatement of Assets and Liabilities
DescriptionFinancial
Instruments
CashCollateralPledged
NetAmount
Reverse Repurchase Agreements $62,625,000 $— $62,625,000 $62,625,000 $— $—
10. Subsequent Events
In preparing these financial statements, the Fund has evaluated events and transactions for potential recognition or disclosurethrough the date the financial statements were issued. The Fund has determined there are no subsequent events that would needto be disclosed in the Fund’s financial statements.
Semi-Annual Report March 31, 2017 25
Evaluation of Advisory Agreement by the Board of Trustees(Unaudited)
March 31, 2017
DoubleLine Total Return Bond FundDoubleLine Core Fixed Income Fund
DoubleLine Emerging Markets Fixed Income FundDoubleLine Multi-Asset Growth Fund
DoubleLine Cayman Multi Asset Growth Fund I Ltd.DoubleLine Low Duration Bond Fund
DoubleLine Floating Rate FundDoubleLine Shiller Enhanced CAPE®
DoubleLine Flexible Income FundDoubleLine Low Duration Emerging Markets Fixed Income Fund
DoubleLine Long Duration Total Return Bond FundDoubleLine Selective Credit Fund
DoubleLine Strategic Commodity FundDoubleLine Strategic Commodity Ltd.
DoubleLine Global Bond FundDoubleLine Opportunistic Credit Fund
DoubleLine Income Solutions Fund
At the February 9, 2017 meeting (the “Meeting”) of the Boards of Trustees of DoubleLine Funds Trust (“DFT”), DoubleLineOpportunistic Credit Fund (“DBL”), and DoubleLine Income Solutions Fund (“DSL” which, together with DBL, are the “Closed-EndFunds” and, together with DFT and DBL, are the “Trusts”), including in respect of each of DFT’s series of shares of beneficial interest(each, an “Open-End Fund” and, collectively with the Closed-End Funds, the “Funds”), the Board of Trustees, including the Trusteeswho are not “interested persons” (as defined in the Investment Company Act of 1940, as amended) of the Trusts (“IndependentTrustees”) voting separately, approved the renewal of the Investment Advisory and Management Agreements (the “DFT AdvisoryAgreements”) between DoubleLine Capital LP (“DoubleLine Capital” or an “Adviser” or “DoubleLine”) and DFT, in respect of each ofDoubleLine Total Return Bond Fund (“Total Return”), DoubleLine Core Fixed Income Fund (“Core Fixed Income”), DoubleLineEmerging Markets Fixed Income Fund (“EMFI”), DoubleLine Multi-Asset Growth Fund (“MAG”), DoubleLine Cayman Multi AssetGrowth Fund I Ltd., DoubleLine Low Duration Fund (“Low Duration”), DoubleLine Floating Rate Fund (“Floating Rate”), DoubleLineShiller Enhanced CAPE® (“CAPE”), DoubleLine Flexible Income Fund (“Flexible Income”), DoubleLine Low Duration EmergingMarkets Fixed Income Fund (“LDEMFI”), DoubleLine Selective Credit Fund (“Selective Credit”), DoubleLine Long Duration TotalReturn Bond Fund (“LD Total Return”), and DoubleLine Global Bond Fund (“Global Bond”) (collectively, with DoubleLine StrategicCommodity Fund (“Strategic Commodity”), the “DFT 15(c) Funds”), for an additional one-year period; the InvestmentManagement Agreements (the “Commodity Advisory Agreements”) between DoubleLine Alternatives LP (formerly, DoubleLineCommodity LP) (“DoubleLine Alternatives” or an “Adviser” or “DoubleLine”) and DFT, in respect of each of Strategic Commodityand DoubleLine Strategic Commodity Ltd., as applicable, for an additional one-year period; the Investment ManagementAgreement (the “DBL Advisory Agreement”) between DoubleLine Capital and DBL for an additional one-year period; and theInvestment Management Agreement between DoubleLine Capital and DSL (the “DSL Advisory Agreement” and together with theDFT Advisory Agreements, the Commodity Advisory Agreements, and the DBL Advisory Agreement, the “Advisory Agreements”) foran additional one-year period.
The Trustees meet over the course of the year with investment advisory personnel from the Advisers and regularly review detailedinformation, presented both orally and in writing, regarding the investment program, performance and operations of each Fund.The Trustees noted that they would consider the proposed renewal of each Fund’s Advisory Agreement and any informationpresented anew, but that their deliberations and conclusions may be informed, at least in part, by their other recent deliberations,as well as the information gathered over the course of the year.
The Trustees’ determination to approve the continuance of each Advisory Agreement was made on the basis of each Trustee’sbusiness judgment after an evaluation of all of the information provided to the Trustees, both for the February 9, 2017 meeting andat prior meetings. Those meetings include meetings held by the Independent Trustees outside the presence of management andmeetings held on February 1, 2017, February 3, 2017 and February 7, 2017 specifically to review and consider materials related tothe proposed continuance of each Advisory Agreement. This summary describes a number, but not necessarily all, of the mostimportant factors considered by the Board and the Independent Trustees. Individual Trustees may have given different weights tocertain factors and assigned various degrees of materiality to information received in connection with the approval process. Nosingle factor was determined to be decisive. In all of their deliberations, the Independent Trustees were advised by independentcounsel.
26 DoubleLine Opportunistic Credit Fund
(Unaudited)
March 31, 2017
The Trustees considered the nature, extent, and quality of the services provided and expected to be provided by the Adviser to eachFund, including the expertise and experience of its investment personnel. In this regard, the Trustees considered that the Adviserprovides a full investment program for the Funds it advises, and noted the Adviser’s representation that it seeks to provideattractive returns with a strong emphasis on risk management. In respect of each Fund, the Board considered the difficulty ofmanaging debt-related portfolios, noting that managing such portfolios requires a portfolio management team to balance anumber of factors, which may include, among others, varying maturities, prepayments, collateral management, counterpartymanagement, pay-downs, credit events, workouts and net new issuances.
The Trustees reviewed reports (the “Strategic Insight Reports”) provided by Strategic Insight, an Asset International Company(“Strategic Insight”), that compared the DFT 15(c) Funds’ advisory fee rates, total expense ratios (Class I shares), and performancerecords (Class I shares) for the three-month, six-month and one-year periods ended December 31, 2016 and, where applicable, theperformance records (Class I shares) for the three- and five-year periods ended December 31, 2016 against a group of eachDFT 15(c) Fund’s peer funds selected by Strategic Insight. The Independent Trustees met with Strategic Insight representatives toreceive a report regarding Strategic Insight’s selection of peer groups, including the views of Strategic Insight regarding thechallenges Strategic Insight encountered in assembling a peer group of funds with investment strategies substantially similar tothose of certain 15(c) Funds, such as CAPE, LDEMFI and MAG.
With respect to the comparative performance information in the Strategic Insight Reports, the Trustees noted in particular thateach DFT 15(c) Fund, other than Total Return, LDEMFI, Selective Credit, Floating Rate and Global Bond, was in the first or secondperformance quartile relative to its respective peer group over the one-year period ending December 31, 2016, and that eachDFT 15(c) Fund with a sufficiently long track record was in the first or second performance quartile relative to its respective peersfor the three- and five-year periods ended December 31, 2016 (other than MAG, which was in the second and third performancequartiles for the three- and five-year periods, respectively, and Floating Rate, which was in the third quartile for the three-yearperiod). The Trustees noted the reasons provided by management for the relative underperformance of each Fund that performedin the third or fourth performance quartile over the one- or three-year period ending December 31, 2016 (as applicable), includingFloating Rate’s relatively low exposure to lower quality credits and Total Return’s and Selective Credit’s relative underweight tocorporate bonds. The Trustees also considered management’s explanation of the unique investment strategies of MAG and LDEMFIin evaluating their performance relative to the peer groups as presented by Strategic Insight. The Trustees further noted thereasons provided by management for the relative underperformance of Global Bond during its initial period of operations and theyconsidered that the Fund has only a short operating history.
The Trustees considered the portion of the Strategic Insight Reports covering the DFT 15(c) Funds’ expenses and advisory fees,noting that the reports showed that each DFT 15(c) Fund, other than CAPE and EMFI, had a net total expense ratio in the first orsecond quartile of its peer group. The Trustees noted that each DFT 15(c) Fund, other than EMFI and MAG, had a net managementfee ratio in the first or second quartile relative to its respective peer group. The Trustees noted that CAPE’s net total expense ratiowas only slightly above the median of its peer group. They noted that EMFI’s net total expense ratio was near the median of its peergroup, that EMFI’s net management fee, though above the median, was below a number of its peers, and that EMFI’s performancewas in the first quartile of its peer group over each period shown in the Strategic Insight Reports. The Trustees noted that MAG’snet management fee was only slightly above median and that MAG’s net total expense ratio was below the median of its peergroup. The Trustees also noted DoubleLine’s commitment, effective April 1, 2017, to reduce MAG’s investment advisory fee from1.00% to 0.95%, and make a commensurate reduction in MAG’s expense limitation agreement for a period of at least one year.
The Trustees evaluated each DFT 15(c) Fund’s net management fee rate in light of its asset size, noting that a number of theDFT 15(c) Funds had achieved significant scale. The Trustees noted that the net management fee rates of the DFT 15(c) Funds withsignificant scale were generally attractive or at least highly competitive relative to their peer groups and appeared to be consistentwith DoubleLine’s general pricing philosophy of setting a Fund’s initial management fee rate at a level that generally reflectsreasonably foreseeable economies of scale instead of relying on breakpoints in a Fund’s management fee rate.
The Trustees considered the Strategic Insight Report regarding DBL that compared the Fund’s management fees (based onmanaged assets and net assets (i.e., not including those assets attributable to borrowings and certain other forms of leverage)),total expense ratio (both inclusive and exclusive of investment related expenses (“IRE”)) also based on managed assets and netassets, and the performance record based on net asset value for the three-year, one-year, six-month, and three-month periodsended December 31, 2016 against a group of DBL’s peer funds. The Trustees noted that DBL had performed in the top quartile of itsMorningstar category as presented by Strategic Insight for the three-year period shown, but that DBL’s performance had been inthe fourth quartile over the one-year period. The Trustees noted that DBL’s net management fee ratio based on managed assetswas above the median of its peer group, but that DBL’s net total expense ratios (both on a managed assets and net asset basis andincluding IRE in both instances) were below DBL’s peer group medians, as was DBL’s net management fee based on net assets.
Semi-Annual Report March 31, 2017 27
Evaluation of Advisory Agreement by the Board of Trustees (Cont.)(Unaudited)
March 31, 2017
The Trustees considered the Strategic Insight Report regarding DSL, noting that DSL had performed in the top quartile of itsMorningstar category as presented by Strategic Insight for each of the three-month, six-month, one-year, and three-year periodsshown. The Trustees noted that DSL’s management fee (both on a managed assets and net asset basis) was above median andnear the highest in its peer group on a managed assets basis, and that DSL’s net operating expense ratios (both on a managedassets and net asset basis and including investment related expenses in each case) were above, but near the median of DSL’s peergroup.
In evaluating DBL’s and DSL’s comparative management fees and expenses, the Trustees considered they had received reportsfrom DoubleLine supporting the conclusion that DBL’s and DSL’s total return performance had generally benefitted from the use ofleverage notwithstanding the expenses associated with it. The Trustees noted also DSL’s first quartile performance across allperiods shown, and DoubleLine’s representations that DBL invests more heavily in mortgage-related investments than other fundsincluded in the peer group. The Trustees also acknowledged comments from DoubleLine that DBL’s lack of exposure to high yieldand other corporate debt contributed to its recent relative underperformance. In evaluating the comparative net managementfees, the Trustees also considered DoubleLine’s statement that the Adviser had attempted to set each Fund’s fees at each Fund’sinception at rates that reflect competitive market levels, but that also reflect the experience and expertise the Adviser brings tomanaging the Funds.
The Trustees noted that both DBL and DSL employed leverage during the period ended December 31, 2016. They noted furtherthat the use of such leverage increases total assets and thus the absolute amount of fees received by the Adviser under DBL’s andDSL’s Advisory Agreements (because the fees are calculated based on total managed assets, including assets attributable toborrowings, reverse repurchase agreements and other forms of leverage outstanding). The Trustees noted that, in this regard, theAdviser has a financial incentive for DBL and DSL to continue to use leverage, which may create a conflict of interest between theAdviser, on the one hand, and DBL’s and DSL’s common shareholders, respectively, on the other. The Trustees consideredinformation from DoubleLine, including discussions with management, regarding the reasons why the Adviser believes DBL’s andDSL’s use of leverage has benefitted the total return performance of DBL and DSL and continues to be appropriate and in the bestinterests of each Fund’s common shareholders under current market conditions.
The Trustees considered that DoubleLine provides a variety of other services to the Funds in addition to investment advisoryservices, including, among others, a number of back-office services, valuation services, compliance services, certain forms ofinformation technology services (such as internal reporting), assistance with accounting and distribution services and supervisionand monitoring of the Funds’ other service providers. The Trustees reviewed DoubleLine’s ongoing efforts to keep the Trusteesinformed about matters relevant to the Trusts and their shareholders. The Trustees also considered the nature, extent, andstructure of the Funds’ compliance program, including the policies and procedures of the Funds and their various service providers(including the Advisers). The Trustees considered the quality of those non-investment advisory services and determined that theirquality supported the renewal of the Funds’ arrangements with DoubleLine.
The Trustees also considered DoubleLine’s reports, provided at the Board’s regular meetings, that it had continued to hireadditional resources to support DoubleLine’s ability to provide services. The Trustees concluded that it appeared that DoubleLinecontinued to have sufficient quality and depth of personnel, resources, and investment methods.
The Trustees considered materials relating to the fees charged by DoubleLine to non-Fund clients, including institutional separateaccounts and mutual funds for which DoubleLine serves as sub-adviser, where DoubleLine employs investment strategiessubstantially similar to one or more Funds’ investment strategies. The Trustees noted the information management providedregarding certain large institutional separate accounts and funds sub-advised by DoubleLine that are subject to fee schedules thatdiffer from, including some that are lower than, the rates paid by a Fund with substantially similar investment strategies. TheTrustees noted DoubleLine’s representations that administrative, compliance, operational, legal, and other burdens of providinginvestment advice to mutual funds exceed in many respects those required to provide advisory services to non-mutual fund clients,such as institutional accounts for retirement or pension plans, which may have differing contractual requirements. The Trusteesnoted DoubleLine’s representations that there are substantially greater legal and other responsibilities and risks to DoubleLine inmanaging and sponsoring public mutual funds than in managing private accounts or in sub-advising mutual funds sponsored byothers, and that the services and resources required of DoubleLine when it sub-advises mutual funds sponsored by others generallyare less than in the case of the Funds because many of the sponsorship, operational, and compliance responsibilities related to theadvisory function are retained by the primary adviser.
The Trustees reviewed the financial and profitability information for DoubleLine, including information as to each Adviser’sprofitability with respect to each Fund. The Trustees considered information provided by management regarding themethodologies, estimates, and assumptions that had been used in compiling those reports. The Trustees also reviewed information
28 DoubleLine Opportunistic Credit Fund
(Unaudited)
March 31, 2017
concerning the profitability to DoubleLine of its service arrangements with the Funds and took into account both the direct andindirect benefits to DoubleLine from managing the Funds. The Trustees also noted other benefits that DoubleLine reported it andits affiliates receive as a result of DoubleLine’s relationship with the Funds, including possible ancillary benefits to DoubleLine’sinstitutional investment management business due to the reputation and market penetration of the Funds. In evaluatingDoubleLine’s profitability, the Trustees considered that DoubleLine presented profitability information that was reduced by certaindistributions made to the DoubleLine’s employee owners that may be comparable to the ordinary compensation expense incurredby investment advisers that are not closely-held by their employees. The Trustees considered DoubleLine’s compensation practicesand considered DoubleLine’s representation that those compensation and incentive policies and practices enable DoubleLine toretain, motivate, and attract highly qualified and experienced employees. The Trustees noted that the Adviser’s profitability inrespect of each 15(c) Fund was shown both before and after certain distribution and shareholder servicing payments made by theAdviser. They noted that they would consider the profitability margins before distribution and shareholder servicing paymentsborne by DoubleLine for purposes of evaluating whether to continue each Advisory Agreement for another one-year period. TheTrustees noted that DoubleLine had significant profitability in respect of certain of the Funds, but noted that in those cases it wouldbe appropriate to consider that in light of other considerations they might find relevant, such as the nature and quality of theservices provided by DoubleLine, the efficiency and cost structure of DoubleLine, and the competitiveness of the management feesand total operating expenses of the Funds.
The Trustees considered the potential benefits that DoubleLine could receive in respect of certain soft dollar credits generated bythe brokerage commissions paid by the DoubleLine funds, and they noted DoubleLine’s representations that soft dollararrangements are not currently in place for any of the Funds. The Trustees separately considered that DoubleLine was continuingto invest in its business to maintain its ability to provide high quality services for the Funds, and noted DoubleLine’s need to investin technology, infrastructure and staff to continue to provide services and accommodate rapidly changing regulatory requirements.
The Trustees considered statements from management that DoubleLine did not believe that implementation of breakpoints or feereductions would be appropriate at this time, for a number of reasons, including DoubleLine’s general approach to investmentadvisory fees, which was to seek to set a fee from a Fund’s inception at a rate that reflected reasonably foreseeable economies ofscale. They noted statements from management that that approach has facilitated the Open-End Funds’ asset raising efforts andallowed the Open-End Funds to compete with peer funds with larger asset bases from inception notwithstanding, in some cases,the Open-End Funds’ smaller asset bases. The Trustees further noted that the Adviser was still subsidizing the expenses of anumber of the Funds. The Trustees also noted the Adviser’s rapid growth and changes to the regulatory environment, whichrequired DoubleLine to re-invest significantly in its business and infrastructure.
With regard to the Closed-End Funds, the Trustees noted that they have not increased in assets significantly from their initialoffering due principally to their status as closed-end investment companies. They noted that there were no substantial increases ineconomies of scale realized with respect to the Closed-End Funds since their inception and that, in the Adviser’s view, the levels ofthe firm’s profitability in respect of DBL and DSL are appropriate in light of the investment the firm has made in the products, thequality of the investment management and other teams provided by the firm, and the continued investments by the firm in its ownbusiness.
The Trustees noted that, due to tax rules applicable to companies seeking to qualify as regulated investment companies, MAG andStrategic Commodity made certain investments through subsidiaries organized as a Cayman Islands exempted company (the“Subsidiaries”) in order to obtain certain desired investment exposure without eliminating its ability to qualify as a regulatedinvestment company under the Internal Revenue Code. The Trustees considered the advisory arrangements for the Subsidiariesgenerally in the same manner as they had considered the advisory arrangements for MAG and Strategic Commodity.
On the basis of these considerations as well as others and in the exercise of their business judgment, the Trustees determined thatthey were satisfied with the nature, extent and the quality of the services provided to each Fund under its Advisory Agreement; thatit appeared that the management fees paid by each Fund to DoubleLine were generally within the range of management fees paidby its peer funds, and with respect to some Funds lower than the median management fees paid by their peer funds, and generallyreasonable in light of the services provided, the quality of the portfolio management teams and each Fund’s performance to date;that the fees paid by each Fund did not appear inconsistent with the fee schedules charged to DoubleLine’s other clients (whereapplicable) in light of the differences in the services provided and the risks borne by DoubleLine; that the profitability of each Fundto DoubleLine did not appear excessive or such as to preclude renewal of any Fund’s Advisory Agreement; and that it did not appearthat implementation of breakpoints for any of the Funds would be appropriate at this time, although the Trustees would continueto consider the topic over time; and that it would be appropriate to approve each Advisory Agreement for an additional one-yearperiod.
Semi-Annual Report March 31, 2017 29
Federal Tax Information(Unaudited)
March 31, 2017
For the fiscal year ended September 30, 2016, certain dividends paid by the Fund may be subject to a maximum tax rate of 15%(20% for taxpayers with taxable income greater than $400,000 for single individuals and $450,000 for married couples filingjointly), as provided for by the Jobs and Growth Tax Relief Reconciliation Act of 2003 and the American Taxpayer Relief Act of 2012.The percentage of dividends declared from ordinary income designated as qualified dividend income was as follows:
Qualified Dividend Income 0.00%
For corporate shareholders, the percent of ordinary income distributions qualifying for the corporate dividends received deductionfor the fiscal year ended September 30, 2016, was as follows:
Dividends Received Deduction 0.00%
The percentage of taxable ordinary income distributions that are designated as short-term capital gain distributions under InternalRevenue Section 871(k)(2)(c) for the fiscal year ended September 30, 2016, was as follows:
Qualified Short-term Gains 0.00%
The percentage of taxable ordinary income distributions that are designated as interest related dividends under Internal RevenueSection 871(k)(1)(c) for the fiscal year ended September 30, 2016, was as follows:
Qualified Interest Income 100.00%
Shareholders are advised to consult their own tax adviser with respect to the tax consequences of their investment in the Fund.
30 DoubleLine Opportunistic Credit Fund
Additional Information Regarding the Fund’s Investment Activities(Unaudited)
March 31, 2017
Investments in Pools of Loans: The Fund may invest in pools of loans through mortgage- or other asset-backed securities, where atrust or other entity issues interests in the loans, some of which interests may be senior to others. Alternatively, the Fund mayinvest directly in pools of loans, itself or with other clients of the Adviser or their related parties. The Fund’s direct investments inpools of loans present risks that may differ from the Fund’s investments in mortgage- and other asset-backed securities. Forexample, if it were to invest directly in such a pool without any co-investors, the Fund would incur all losses incurred on the loansacquired in the pool. However, if the Fund were to invest in a senior tranche of a mortgage- or other asset-backed security, it mighthave a more limited exposure to losses on the loans. In connection with the Fund’s direct purchase of certain loan portfolios, theFund will incur costs, which may include the costs of various diligence-related services. The diligence-related services the Fund mayrequire in connection with such investments may include, without limitation, loan file review, underwriting documentation review,and site visits. The Adviser would typically rely on information and analyses furnished as part of these diligence-related services indetermining whether to invest in a particular loan portfolio. The costs associated with investments in a pool of loans may besignificant and will reduce the performance contribution of such investments. The Fund may invest in pools of loans throughcollateralized debt obligations (“CDOs”) and other structured products sponsored or managed by, or otherwise affiliated with, theAdviser or related parties of the Adviser. Such investments may include investments in debt or equity interests issued of the CDO orstructured product as well as investments purchased on the secondary market, and the Fund may invest in any tranche of the CDOor structured product, including an equity tranche.
Original Issuance, Subordinated Tranche Investments: The Fund may invest in any level of the capital structure of an issuer ofmortgage-backed or asset-backed securities, including the equity or “first loss” tranche. Senior tranche investments in mortgage-backed or asset-backed securities are paid from the cash flows from the underlying assets before the junior tranches and equity or“first loss” tranches. Any losses on the underlying assets are first borne by the equity tranches, next by less junior tranches, andfinally by the senior tranches. Accordingly, subordinated tranche investments, and especially “first loss” tranches, involve greaterrisk of loss than more senior tranches. The subordinated tranches the Fund may buy include those rated below investment grade orunrated instruments of similar credit quality. Below investment grade bonds are high yield, high risk bonds, commonly known asjunk bonds.
The Adviser may aggregate the Fund’s order for an investment in, or sale of, an interest in a subordinated tranche, includinginvestments at original issuance, with orders of one or more other DoubleLine funds or other DoubleLine accounts. Certaindiligence-related or structuring costs and expenses will be allocated to all of the accounts, including the Fund, participating in theaggregated transaction pro rata based on the amount of investment made by each account participating in the transaction. TheFund’s participation in any such aggregated transaction will be subject to a number of conditions intended to result in the fair andequitable treatment of each participating account, including the Fund. For example, the Fund will not incur diligence- orstructuring-related expenses in connection with any such transaction in excess of 0.50% of the value of the Fund’s investment inthe structured product without the Fund’s Board of Trustees review of those expenses. The Adviser may advance diligence- orstructuring-related expenses relating to such transactions on behalf of the Fund and seek to receive reimbursement (withoutinterest) of any such expenses advanced on behalf of the Fund at a later date.
Affiliated Investments: The Adviser is, and may be in the future, affiliated with certain large financial institutions (“affiliates”) thathold interests in an entity that are of a different class or type than the class or type of interest held by the Fund. Conflicts may arisein cases where the Fund and affiliates invest in different parts of an issuer’s capital structure, such as when an affiliate holdssecurities in an entity that are senior or junior to the securities held by the Fund, which could mean that the affiliate will be entitledto different payments or other rights, or that in a workout or other distressed scenario the interests of the affiliate might be adverseto those of the Fund and the affiliate and the Fund might have disparate investment outcomes. For example, an affiliate mayacquire a loan, loan participation, or a loan assignment of a particular borrower in which one or more Funds have an equityinvestment. In negotiating the terms and conditions of any such investments, or any subsequent amendments or waivers, theAdviser may find that its own interests, the interests of an affiliate, and/or the interests of the Fund could conflict. The Adviser mayseek to avoid such conflicts in certain circumstances when investing on behalf of its clients, including the Fund, and, as a result, theAdviser may choose not to make certain investments on behalf of the Fund and/or its other clients. Those foregone investmentopportunities may adversely affect the Fund’s performance if similarly attractive opportunities are not available or cannot beidentified.
Stapled Securities: The Fund may invest in stapled securities, which are financial instruments comprised of two or more differentinstruments that are contractually bound to form a single salable unit; they cannot be bought or sold separately. Stapled securitiesmay often include a share in a company and a unit in a trust related to that company. The resulting security is influenced by bothparts, and must be treated as one unit at all times, such as when buying or selling a security. The value of stapled securities and theincome, if any, derived from them may fall as well as rise. The market for stapled securities may be illiquid at times, even for thosesecurities that are listed on a domestic or foreign exchange.
Semi-Annual Report March 31, 2017 31

Additional Information Regarding the Fund’s Investment Activities (Cont.)(Unaudited)
March 31, 2017
Capital Controls: Capital controls are measures a nation’s government can use to regulate capital entering and/or exiting a countryand may include residency-based measures such as transaction taxes, limits or outright prohibitions on the transfer of currencies,securities or other assets. These measures may be economy-wide, sector-specific (usually the financial sector), or industry specific(for example, “strategic” industries). They may apply to all flows, or may differentiate by type or duration of the flow (debt, equity,direct investment; short-term vs. medium- and long-term). Types of capital controls include exchange controls that prevent orlimit the buying and selling of a national currency at the market rate, caps on the allowed volume for the international sale orpurchase of various financial assets, transaction taxes, minimum stay requirements, requirements for mandatory approval, or evenlimits on the amount of money a private citizen is allowed to remove from the country. The imposition of capital controls by agovernment of a country in which the Fund invests may significantly and adversely affect the values and liquidity of a Fund’sinvestments in the affected jurisdiction and may prevent indefinitely the repatriation of a Fund’s assets from the affectedjurisdiction.
32 DoubleLine Opportunistic Credit Fund
Portfolio Managers(Unaudited)
March 31, 2017
Effective January 1, 2017, the portfolio managers for the Fund are Jeffrey E. Gundlach, Philip A. Barach, Luz M. Padilla and Joel A.Damiani. Each of them has served as a portfolio manager of the Fund since the Fund’s inception.
Information About Proxy Voting
Information about how the Fund voted proxies relating to portfolio securities held during the most recent twelve month periodended June 30th is available no later than the following August 31st without charge, upon request, by calling 877-DLine11(877-354-6311) and on the Securities and Exchange Commission’s (the “SEC”) website at www.sec.gov.
A description of the Fund’s proxy voting policies and procedures is available (i) without charge, upon request, by calling877-DLine11 (877-354-6311); and (ii) on the commission’s website at www.sec.gov.
Information About Portfolio Holdings
The Fund intends to disclose its portfolio holdings on a quarterly basis by posting the holdings on the Fund’s website. Thedisclosure will be made by posting the Annual, Semi-Annual and Form N-Q regulatory filings on the Fund’s website.
The Fund is required to file its complete schedule of portfolio holdings with the SEC for its first and third fiscal quarters onForm N-Q. The Fund’s Forms N-Q are available on the SEC’s website at www.sec.gov. You can also review and obtain copies of theForms N-Q at the SEC’s Public Reference Room in Washington, DC (information on the operation of Public Reference Room may beobtained by calling 1-800-SEC-0330).
Householding — Important Notice Regarding Delivery of Shareholder Documents
In an effort to conserve resources, the Fund intends to reduce the number of duplicate Annual and Semi-Annual Reports youreceive by sending only one copy of each to addresses where we reasonably believe two or more accounts are from the samefamily. If you would like to discontinue householding of your accounts, please call toll-free 877-DLine11 (877-354-6311) to requestindividual copies of these documents. We will begin sending individual copies thirty days after receiving your request to stophouseholding.
Fund Certification
The Fund is listed for trading on the NYSE and has filed with the NYSE its annual chief executive officer certification regardingcompliance with the NYSE’s listing standards. The Fund filed with the SEC the certification of its chief executive officer and principalfinancial officer required by section 302 of the Sarbanes-Oxley Act.
Proxy Results
The Annual Meeting of Shareholders was held on February 24, 2017 for shareholders of record as of the close of business onDecember 16, 2016 to re-elect John C. Salter, a Class II trustee nominee, for the Fund. The nominee was elected with 12,654,002,affirmative votes and 299,477 votes withheld. For the Fund, Trustees whose terms of office continued after the Annual Meeting ofShareholders because they were not up for re-election are Joseph J. Ciprari, Raymond B.Woolson and Ronald R. Redell.
Semi-Annual Report March 31, 2017 33
Dividend Reinvestment Plan(Unaudited)
March 31, 2017
Unless the registered owner of Common Shares elects to receive cash by contacting U.S. Bancorp Fund Services, LLC (the “PlanAdministrator”), all dividends, capital gains and returns of capital, if any, declared on Common Shares will be automaticallyreinvested by the Plan Administrator for shareholders in the Fund’s Automatic Dividend Reinvestment Plan (the “Plan”), inadditional Common Shares. Common Shareholders who elect not to participate in the Plan will receive all dividends and otherdistributions payable in cash directly to the shareholder of record (or, if the Common Shares are held in street or other nomineename, then to such nominee) by the Plan Administrator as dividend disbursing agent. Participation in the Plan is completelyvoluntary and may be terminated or resumed at any time without penalty by providing notice in writing to the Plan Administratorat least 5 days prior to the dividend/distribution record date; otherwise such termination or resumption will be effective withrespect to any subsequently declared dividend or other distribution.
Whenever the Fund declares an income dividend, a capital gain distribution or other distribution (collectively referred to as“dividends”) payable either in shares or cash, non-participants in the Plan will receive cash and participants in the Plan will receivea number of Common Shares, determined in accordance with the following provisions. The Common Shares will be acquired by thePlan Administrator for the participants’ accounts, depending upon the circumstances described below, either (i) through receipt ofadditional unissued but authorized Common Shares from the Fund (“Newly Issued Common Shares”) or (ii) by purchase ofoutstanding Common Shares on the open market (“Open- Market Purchases”) on the New York Stock Exchange or elsewhere. If, onthe payment date for any Dividend, the market price per Common Share plus estimated brokerage trading fees is equal to orgreater than the NAV per Common Share (such condition is referred to here as “market premium”), the Plan Administrator shallreceive Newly Issued Common Shares, including fractions of shares from the Fund for each Plan participant’s account. The numberof Newly Issued Common Shares to be credited to each participant’s account will be determined by dividing the dollar amount ofthe Dividend by the NAV per Common Share on the date of issuance; provided that, if the NAV per Common Share is less than orequal to 95% of the current market value on the date of issuance, the dollar amount of the Dividend will be divided by 95% of themarket price per Common Share on the date of issuance for purposes of determining the number of shares issuable under the Plan.If, on the payment date for any Dividend, the NAV per Common Share is greater than the market value plus estimated brokeragetrading fees (such condition being referred to here as a “market discount”), the Plan Administrator will seek to invest the Dividendamount in Common Shares acquired on behalf of the participants in Open-Market Purchases.
In the event of a market discount on the payment date for any Dividend, the Plan Administrator will have until the last business daybefore the next date on which the Common Shares trade on an “ex-dividend” basis or in no event more than 30 days after therecord date for such Dividend, whichever is sooner (the “Last Purchase Date”), to invest the Dividend amount in Common Sharesacquired in Open-Market Purchases. It is contemplated that the Fund will pay monthly Dividends. If, before the Plan Administratorhas completed its Open-Market Purchases, the market price per Common Share exceeds the NAV per Common Share, the averageper Common Share purchase price paid by the Plan Administrator may exceed the NAV of the Common Shares, resulting in theacquisition of fewer Common Shares than if the Dividend had been paid in Newly Issued Common Shares on the Dividend paymentdate. If the Plan Administrator is unable to invest the full Dividend amount in Open-Market Purchases during the purchase periodor if the market discount shifts to a market premium during the purchase period, the Plan Administrator may cease making Open-Market Purchases and may instead receive the Newly Issued Common Shares from the Fund for each participant’s account, inrespect of the uninvested portion of the Dividend, at the NAV per Common Share at the close of business on the Last Purchase Dateprovided that, if the NAV is less than or equal to 95% of the then current market price per Common Share, the dollar amount of theDividend will be divided by 95% of the market price on the date of issuance for purposes of determining the number of sharesissuable under the Plan.
The Plan Administrator maintains all registered shareholders’ accounts in the Plan and furnishes written confirmation of alltransactions in the accounts, including information needed by shareholders for tax records. Common Shares in the account of eachPlan participant will be held by the Plan Administrator in non-certificated form in the name of the Plan participant, and eachshareholder proxy will include those shares purchased or received pursuant to the Plan. The Plan Administrator will forward allproxy solicitation materials to participants and vote proxies for shares held under the Plan in accordance with the instructions ofthe participants.
In the case of Common Shares owned by a beneficial owner but registered with the Plan Administrator in the name of a nominee,such as a bank, a broker or other financial intermediary (each, a “Nominee”), the Plan Administrator will administer the Plan on thebasis of the number of Common Shares certified from time to time by the Nominee as participating in the Plan. The PlanAdministrator will not take instructions or elections from a beneficial owner whose Common Shares are registered with the PlanAdministrator in the name of a Nominee. If a beneficial owner’s Common Shares are held through a Nominee and are notregistered with the Plan Administrator as participating in the Plan, neither the beneficial owner nor the Nominee will beparticipants in or have distributions reinvested under the Plan with respect to those Common Shares. If a beneficial owner of
34 DoubleLine Opportunistic Credit Fund

(Unaudited)
March 31, 2017
Common Shares held in the name of a Nominee wishes to participate in the Plan, and the Shareholder’s Nominee is unable orunwilling to become a registered shareholder and a Plan participant with respect to those Common Shares on the beneficialowner’s behalf, the beneficial owner may request that the Nominee arrange to have all or a portion of his or her Common Sharesregistered with the Plan Administrator in the beneficial owner’s name so that the beneficial owner may be enrolled as a participantin the Plan with respect to those Common Shares. Please contact your Nominee for details or for other possible alternatives.Participants whose shares are registered with the Plan Administrator in the name of one Nominee may not be able to transfer theshares to another firm or Nominee and continue to participate in the Plan.
There will be no brokerage charges with respect to Common Shares issued directly by the Fund as a result of dividends payableeither in Common Shares or in cash. However, each participant will pay a pro rata share of brokerage trading fees incurred inconnection with Open-Market Purchases. The automatic reinvestment of Dividends will not relieve participants of any federal, stateor local income tax that may be payable (or required to be withheld) on such Dividends. Participants that request a sale ofCommon Shares through the Plan Administrator are subject to brokerage commissions.
The Fund reserves the right to amend or terminate the Plan. There is no direct service charge to participants with regard topurchases in the Plan; however, the Fund reserves the right to amend the Plan to include a service charge payable by theparticipants.
All correspondence, questions, or requests for additional information concerning the Plan should be directed to the PlanAdministrator by calling toll-free (877) DLine11 (877-354-6311) or by writing to U.S. Bancorp Fund Services, LLC at P.O. Box 701,Milwaukee, WI 53201. Be sure to include your name, address, daytime phone number, Social Security or tax I.D. number and areference to DoubleLine Opportunistic Credit Fund on all correspondence.
Semi-Annual Report March 31, 2017 35
Privacy Notice(Unaudited)
March 31, 2017
What Does DoubleLine Do With Your Personal Information?Financial companies choose how they share your personal information. This notice provides information about how we collect,share, and protect your personal information, and how you might choose to limit our ability to share certain information about you.Please read this notice carefully.
All financial companies need to share customers’ personal information to run their everyday businesses. Accordingly, information,confidential and proprietary, plays an important role in the success of our business. However, we recognize that you have entrustedus with your personal and financial data, and we recognize our obligation to keep this information secure. Maintaining your privacyis important to us, and we hold ourselves to a high standard in its safekeeping and use. Most importantly, DoubleLine does not sellits customers’ non-public personal information to any third parties. DoubleLine uses its customers’ non-public personalinformation primarily to complete financial transactions that its customers request or to make its customers aware of otherfinancial products and services offered by a DoubleLine affiliated company.
DoubleLine may collect non-public information about you from the following sources:
• Information we receive about you on applications or other forms;• Information you may give us orally;• Information about your transactions with us or others;• Information you submit to us in correspondence, including emails or other electronic communications; and• Information about any bank account you use for transfers between your bank account and any Fund account, including
information provided when effecting wire transfers.
The types of personal information DoubleLine collects and shares depend on the product or service you have with us. Thisinformation may include:
• Social Security Number;• account balances;• transaction or loss history;• assets;• investment experience;• account transactions;• risk tolerance.
DoubleLine does not disclose any non-public personal information about our customers or former customers without thecustomer’s authorization, except that we may disclose the information listed above, as follows:
• to provide information to nonaffiliated third parties in connection with our performance of the services we have agreed toprovide you. For example, it might be necessary to do so in order to process transactions and maintain accounts.
• DoubleLine will release any of the non-public information listed above about a customer if directed to do so by thatcustomer or if DoubleLine is authorized by law to do so, such as in the case of a court order, legal investigation, or otherproperly executed governmental request.
• to alert a customer to other financial products and services offered by DoubleLine or an affiliate, DoubleLine may shareinformation with an affiliate, including companies using the DoubleLine name. Such products and services may include, forexample, other investment products offered by a DoubleLine company. If you prefer that we not disclose non-publicpersonal information about you to our affiliates for this purpose, you may direct us not to make such disclosures (other thandisclosures permitted by law) by calling 877-DLine11 (877-354-6311). If you limit this sharing and you have a joint account,your decision will be applied to all owners of the account.
We have procedures designed to limit access to your personal account information to those agents and vendors who need to know thatinformation to provide products and services to you. Your information is not provided by us to nonaffiliated third parties for marketingpurposes. We seek to maintain physical, electronic, and procedural safeguards to guard your non-public personal information.
Information Collected from Websites. Websites maintained by DoubleLine or its service providers may use a variety of technologiesto collect information that help DoubleLine and its service providers understand how the website is used. Information collectedfrom your web browser (including small files stored on your device that are commonly referred to as “cookies”) allow the websitesto recognize your web browser and help to personalize and improve your user experience and enhance navigation of the website.You can change your cookie preferences by changing the setting on your web browser to delete or reject cookies. If you delete orreject cookies, some website pages may not function properly. Certain portions of doublelinefunds.com are maintained orcontrolled by third parties, each of which has privacy policies which may differ, in some cases significantly, from the privacy policiesdescribed in this notice. Please contact your DoubleLine representative if you would like to receive more information about theprivacy policies of third parties.
As required by federal law, DoubleLine will notify customers of DoubleLine’s Privacy Policy annually. DoubleLine reserves the right tomodify this policy at any time, but in the event that there is a change, DoubleLine will promptly inform its customers of that change.
36 DoubleLine Opportunistic Credit Fund
DoubleLine Capital LP 333 South Grand Avenue18th FloorLos Angeles, CA 90071
doubleline.com
[email protected]. 213. 633. 8200
Investment Adviser:DoubleLine Capital LP333 South Grand Avenue18th FloorLos Angeles, CA 90071
Administrator andTransfer Agent:U.S. Bancorp Fund Services, LLCP.O. Box 701Milwaukee, WI 53201
Custodian:U.S. Bank, N.A.1555 North River Center DriveSuite 302Milwaukee, WI 53212
Independent RegisteredPublic Accounting Firm:Deloitte & Touche LLP695 Town Center Drive Suite 1200Costa Mesa, CA 92626
Legal Counsel:Ropes & Gray LLPPrudential Tower800 Boylston StreetBoston, MA 02199
Contact Information:[email protected] or1-877-354-6311
DL-SEMI-DBL
DoubleLineF U N D S
®