Embed Size (px)
Citation preview
Live plants and products of floriculture
sector in the EU
Daniel VANDERELST/ Lucie ZOLICHOVA European Commission
DG Agriculture and Rural Development (DG AGRI)
Unit C.2. Wine, spirits, horticultural products, specialised crops
Civil Dialogue Group – Brussels – 2 October 2015
Live plants and products of floriculture 2
Structure of the presentation
1. Production
2. Land area
3. Trade
This statistical document has been prepared by Unit C.2 of DG AGRI, in order to stimulate
discussion at the Civil Dialogue Group. It is a mere working document. The European
Commission does not accept any responsibility in respect of the exactness of given data.
Live plants and products of floriculture 3
1. PRODUCTION
Live plants and products of floriculture 4
Production in the World
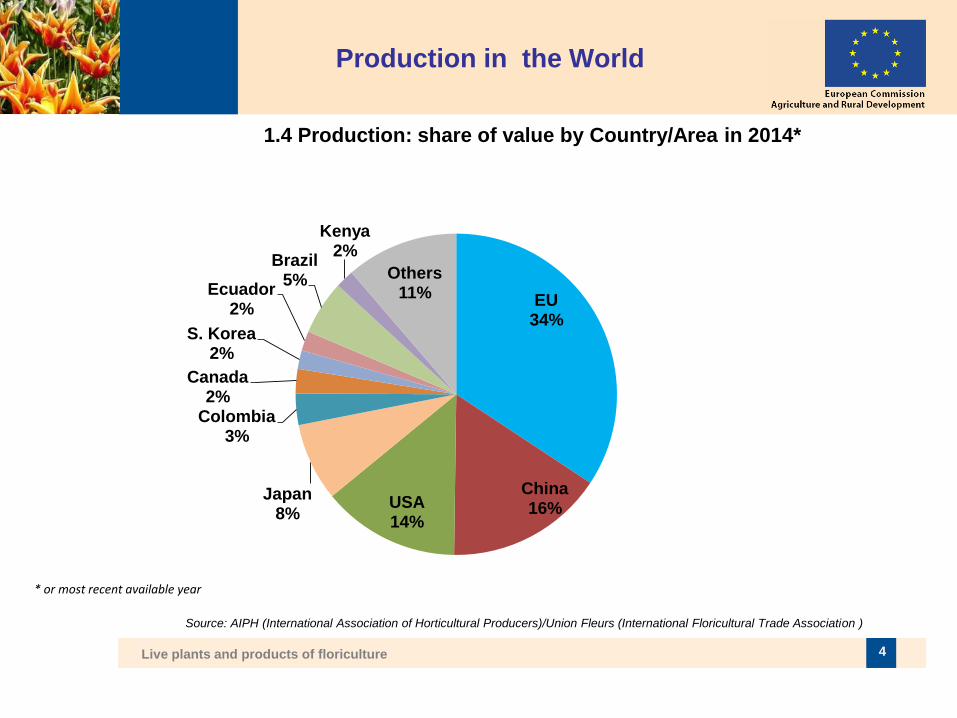
EU34%
China16%USA
14%
Japan8%
Colombia3%
Canada2%
S. Korea2%
Ecuador2%
Brazil5%
Kenya2%
Others11%
1.4 Production: share of value by Country/Area in 2014*
Source: AIPH (International Association of Horticultural Producers)/Union Fleurs (International Floricultural Trade Association )
* or most recent available year
Live plants and products of floriculture 5
Value of production in the EU
(evolution)
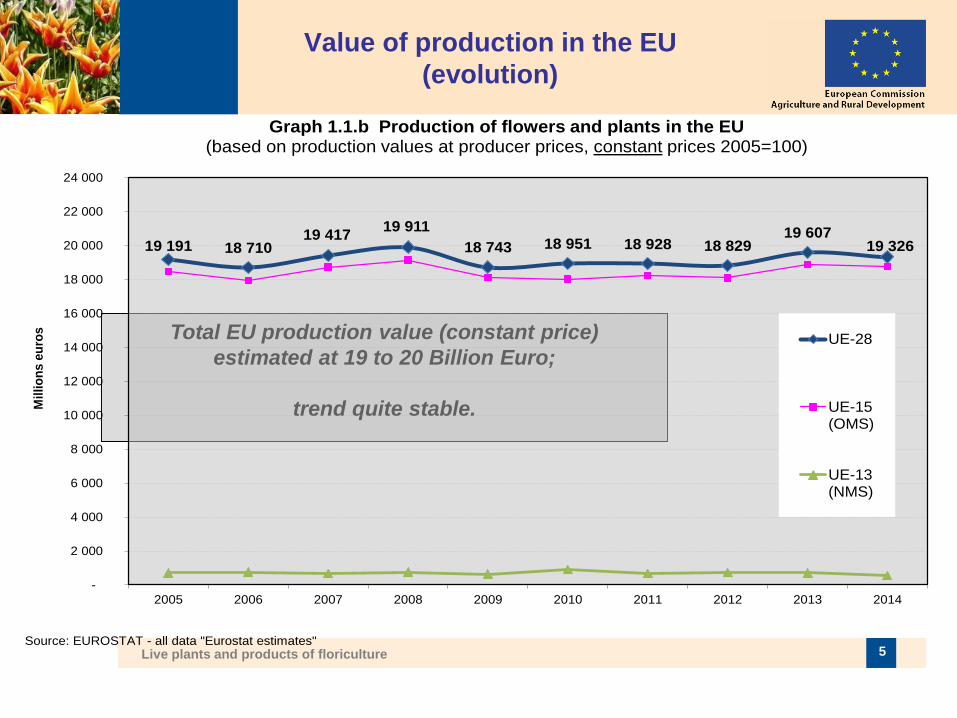
Total EU production value (constant price)
estimated at 19 to 20 Billion Euro;
trend quite stable.
19 191 18 71019 417
19 911
18 743 18 951 18 928 18 82919 607
19 326
-
2 000
4 000
6 000
8 000
10 000
12 000
14 000
16 000
18 000
20 000
22 000
24 000
2005 2006 2007 2008 2009 2010 2011 2012 2013 2014
Mil
lio
ns
eu
ros
Graph 1.1.b Production of flowers and plants in the EU(based on production values at producer prices, constant prices 2005=100)
UE-28
UE-15(OMS)
UE-13(NMS)
Source: EUROSTAT - all data "Eurostat estimates"
Live plants and products of floriculture 6
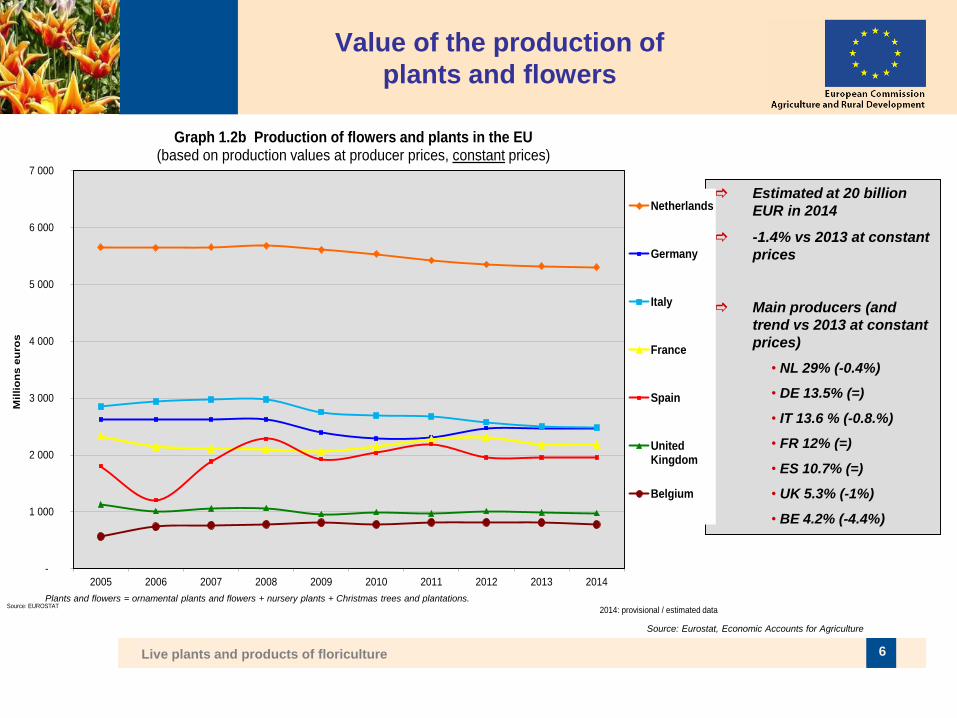
Value of the production of
plants and flowers
Plants and flowers = ornamental plants and flowers + nursery plants + Christmas trees and plantations.
Estimated at 20 billion
EUR in 2014
-1.4% vs 2013 at constant
prices
Main producers (and
trend vs 2013 at constant
prices)
• NL 29% (-0.4%)
• DE 13.5% (=)
• IT 13.6 % (-0.8.%)
• FR 12% (=)
• ES 10.7% (=)
• UK 5.3% (-1%)
• BE 4.2% (-4.4%)
Source: Eurostat, Economic Accounts for Agriculture
-
1 000
2 000
3 000
4 000
5 000
6 000
7 000
2005 2006 2007 2008 2009 2010 2011 2012 2013 2014
Mil
lio
ns
eu
ros
Graph 1.2b Production of flowers and plants in the EU(based on production values at producer prices, constant prices)
Netherlands
Germany
Italy
France
Spain
UnitedKingdom
Belgium
Source: EUROSTAT2014: provisional / estimated data
Live plants and products of floriculture 7
2. LAND AREA
Live plants and products of floriculture 8
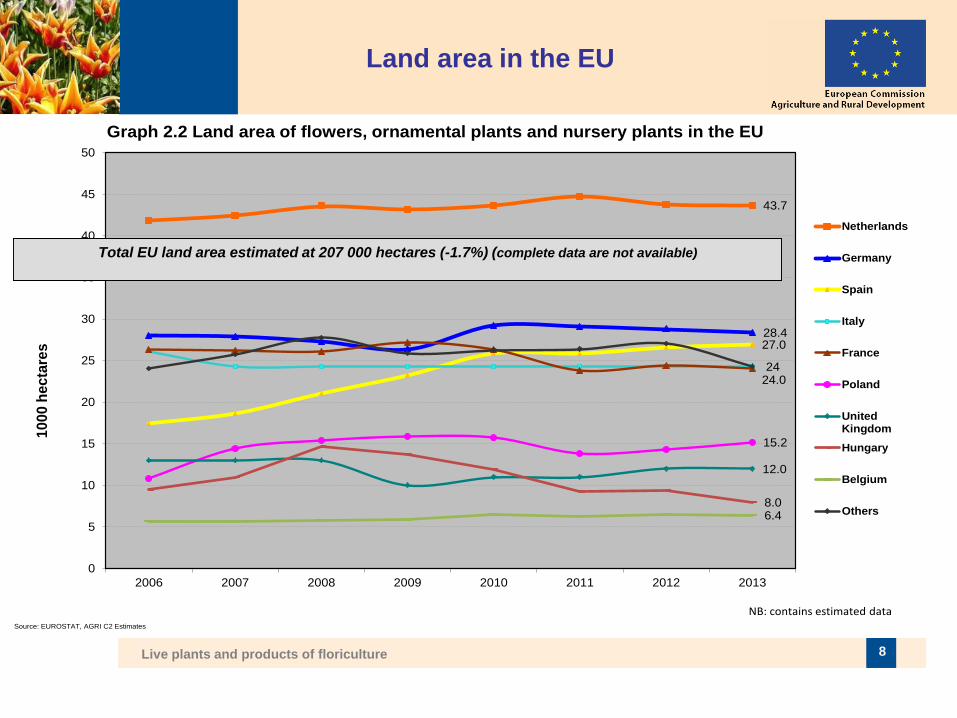
Land area in the EU
43.7
28.427.0
24.0
15.2
12.0
8.06.4
24
0
5
10
15
20
25
30
35
40
45
50
2006 2007 2008 2009 2010 2011 2012 2013
10
00
he
cta
res
Graph 2.2 Land area of flowers, ornamental plants and nursery plants in the EU
Netherlands
Germany
Spain
Italy
France
Poland
UnitedKingdom
Hungary
Belgium
Others
Source: EUROSTAT, AGRI C2 Estimates
NB: contains estimated data
Total EU land area estimated at 207 000 hectares (-1.7%) (complete data are not available)
Live plants and products of floriculture 9
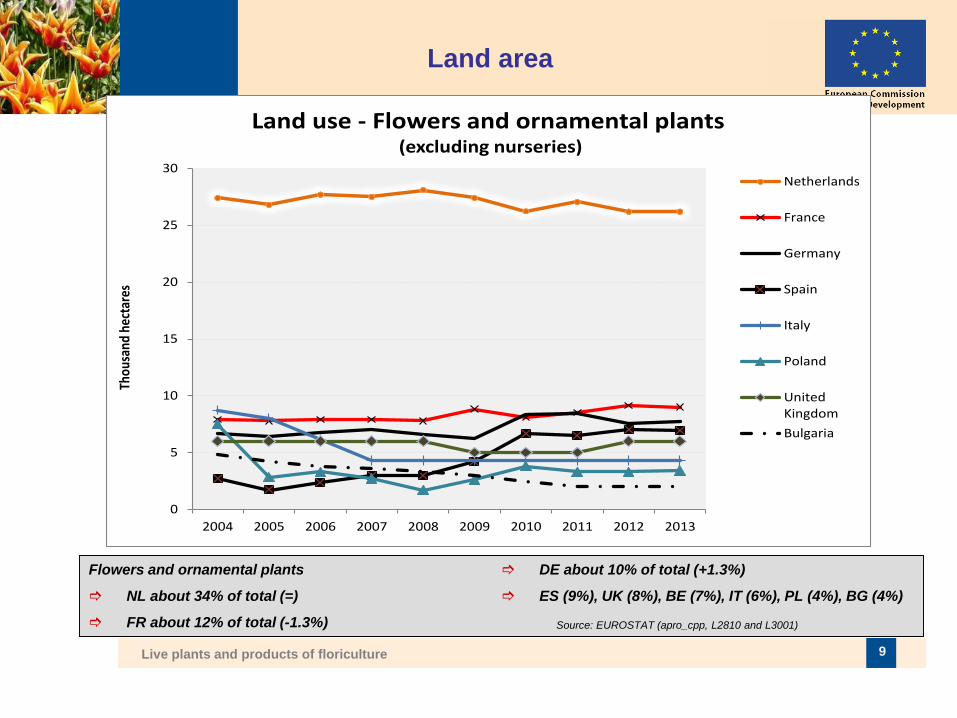
Land area
Flowers and ornamental plants
NL about 34% of total (=)
FR about 12% of total (-1.3%)
DE about 10% of total (+1.3%)
ES (9%), UK (8%), BE (7%), IT (6%), PL (4%), BG (4%)
Source: EUROSTAT (apro_cpp, L2810 and L3001)
0
5
10
15
20
25
30
2004 2005 2006 2007 2008 2009 2010 2011 2012 2013
Thou
sand
hec
tare
sLand use - Flowers and ornamental plants
(excluding nurseries)
Netherlands
France
Germany
Spain
Italy
Poland
UnitedKingdom
Bulgaria
Live plants and products of floriculture 10
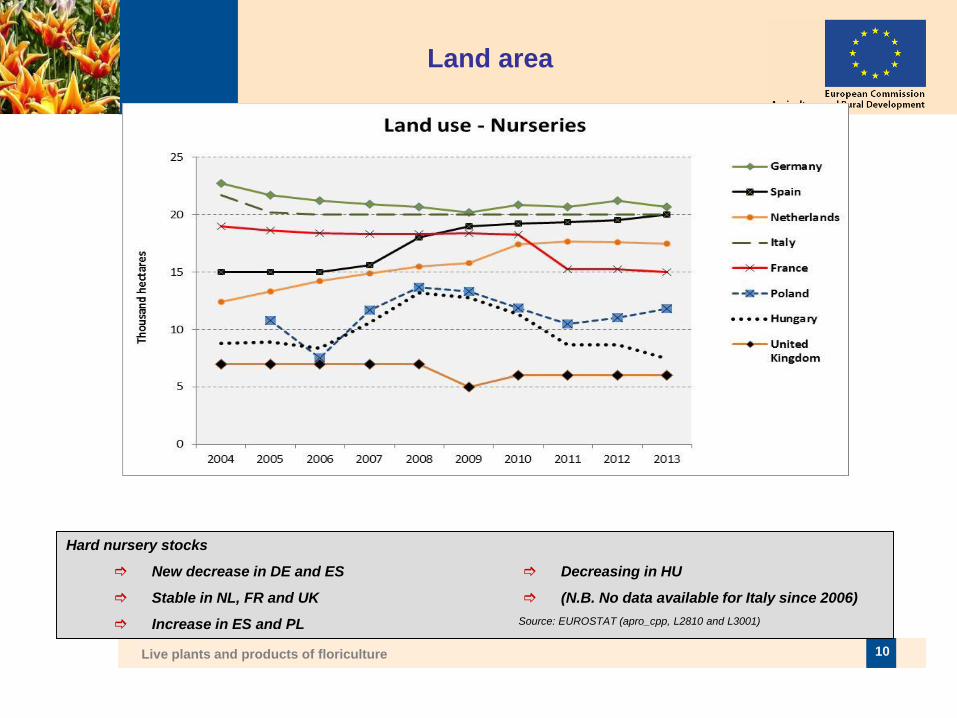
Land area
Hard nursery stocks
New decrease in DE and ES
Stable in NL, FR and UK
Increase in ES and PL
Decreasing in HU
(N.B. No data available for Italy since 2006)
Source: EUROSTAT (apro_cpp, L2810 and L3001)
Live plants and products of floriculture 11
3. TRADE
Live plants and products of floriculture 12
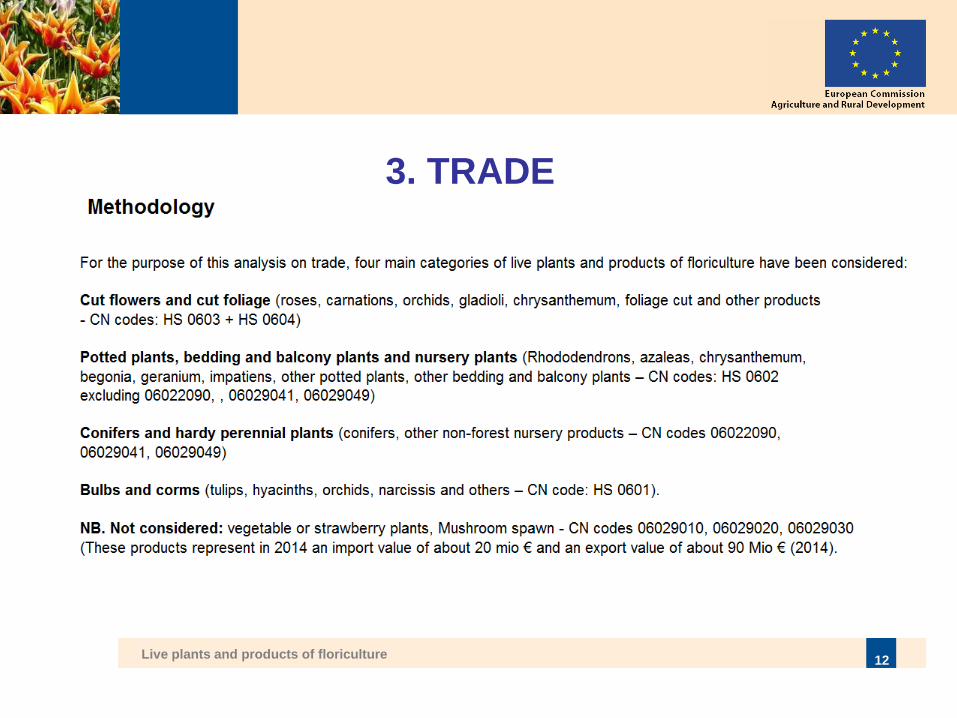
3. TRADE
Live plants and products of floriculture 13
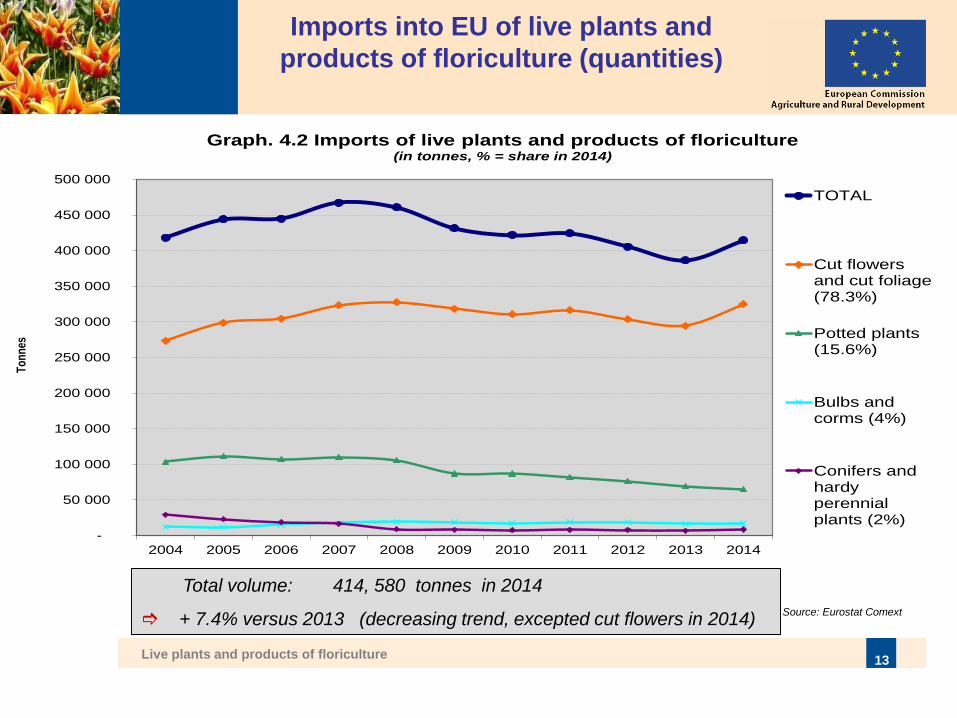
Imports into EU of live plants and
products of floriculture (quantities)
Source: Eurostat Comext
Total volume: 414, 580 tonnes in 2014
+ 7.4% versus 2013 (decreasing trend, excepted cut flowers in 2014)
-
50 000
100 000
150 000
200 000
250 000
300 000
350 000
400 000
450 000
500 000
2004 2005 2006 2007 2008 2009 2010 2011 2012 2013 2014
To
nn
es
Graph. 4.2 Imports of live plants and products of floriculture(in tonnes, % = share in 2014)
TOTAL
Cut flowersand cut foliage(78.3%)
Potted plants(15.6%)
Bulbs andcorms (4%)
Conifers andhardyperennialplants (2%)
Live plants and products of floriculture 14
Imports into EU of live plants and
products of floriculture (value)
Source: Eurostat Comext
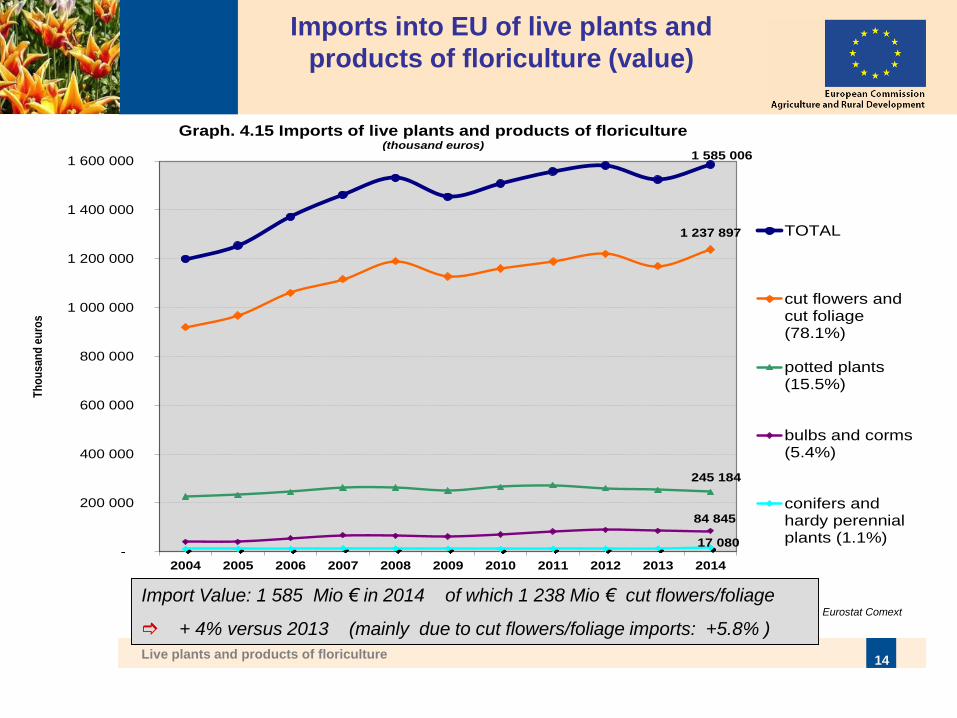
Import Value: 1 585 Mio € in 2014 of which 1 238 Mio € cut flowers/foliage
+ 4% versus 2013 (mainly due to cut flowers/foliage imports: +5.8% )
1 585 006
1 237 897
245 184
84 845
17 080 -
200 000
400 000
600 000
800 000
1 000 000
1 200 000
1 400 000
1 600 000
2004 2005 2006 2007 2008 2009 2010 2011 2012 2013 2014
Th
ou
san
d e
uro
s
Graph. 4.15 Imports of live plants and products of floriculture(thousand euros)
TOTAL
cut flowers andcut foliage(78.1%)
potted plants(15.5%)
bulbs and corms(5.4%)
conifers andhardy perennialplants (1.1%)
Live plants and products of floriculture 15
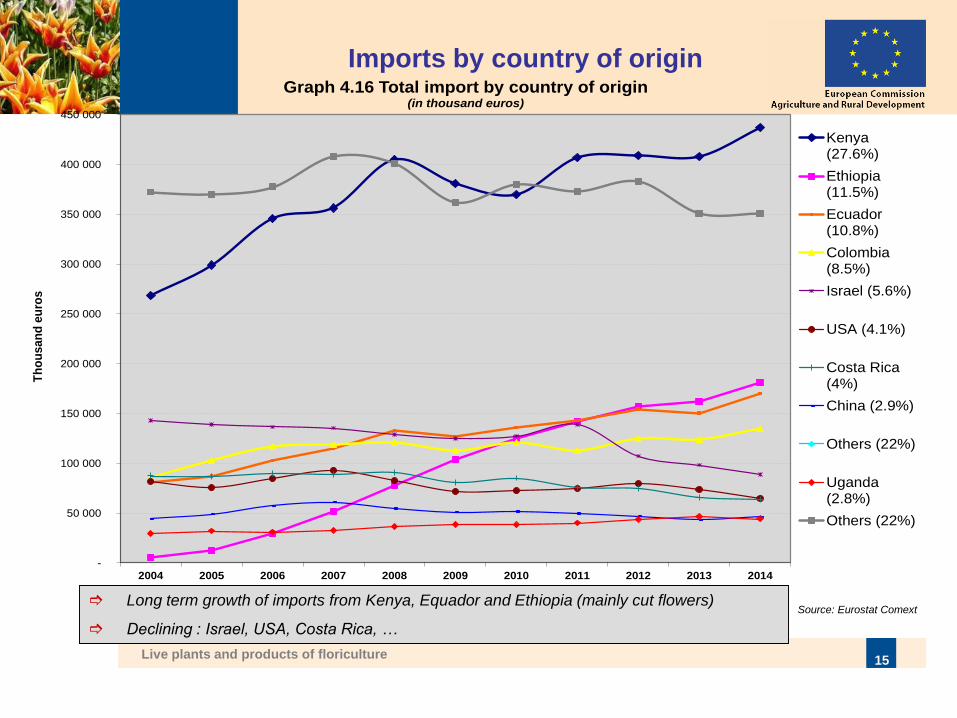
Imports by country of origin
Source: Eurostat Comext
Long term growth of imports from Kenya, Equador and Ethiopia (mainly cut flowers)
Declining : Israel, USA, Costa Rica, …
-
50 000
100 000
150 000
200 000
250 000
300 000
350 000
400 000
450 000
2004 2005 2006 2007 2008 2009 2010 2011 2012 2013 2014
Th
ou
san
d e
uro
s
Graph 4.16 Total import by country of origin (in thousand euros)
Kenya(27.6%)
Ethiopia(11.5%)
Ecuador(10.8%)
Colombia(8.5%)
Israel (5.6%)
USA (4.1%)
Costa Rica(4%)
China (2.9%)
Others (22%)
Uganda(2.8%)
Others (22%)
Live plants and products of floriculture 16
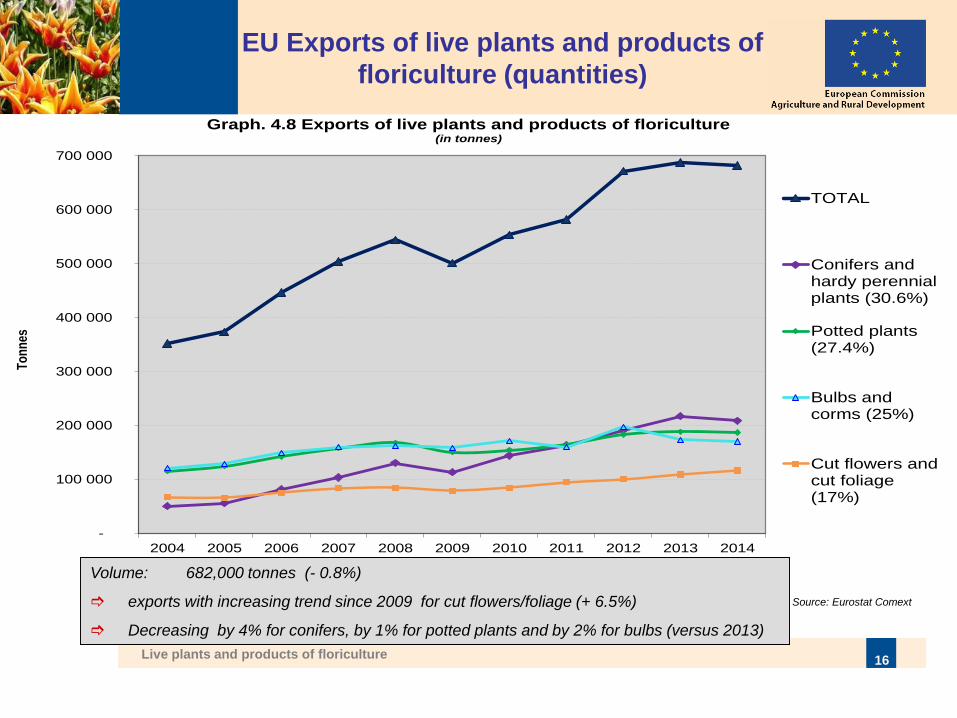
EU Exports of live plants and products of
floriculture (quantities)
Source: Eurostat Comext
Volume: 682,000 tonnes (- 0.8%)
exports with increasing trend since 2009 for cut flowers/foliage (+ 6.5%)
Decreasing by 4% for conifers, by 1% for potted plants and by 2% for bulbs (versus 2013)
-
100 000
200 000
300 000
400 000
500 000
600 000
700 000
2004 2005 2006 2007 2008 2009 2010 2011 2012 2013 2014
To
nn
es
Graph. 4.8 Exports of live plants and products of floriculture(in tonnes)
TOTAL
Conifers andhardy perennialplants (30.6%)
Potted plants(27.4%)
Bulbs andcorms (25%)
Cut flowers andcut foliage(17%)
Live plants and products of floriculture 17
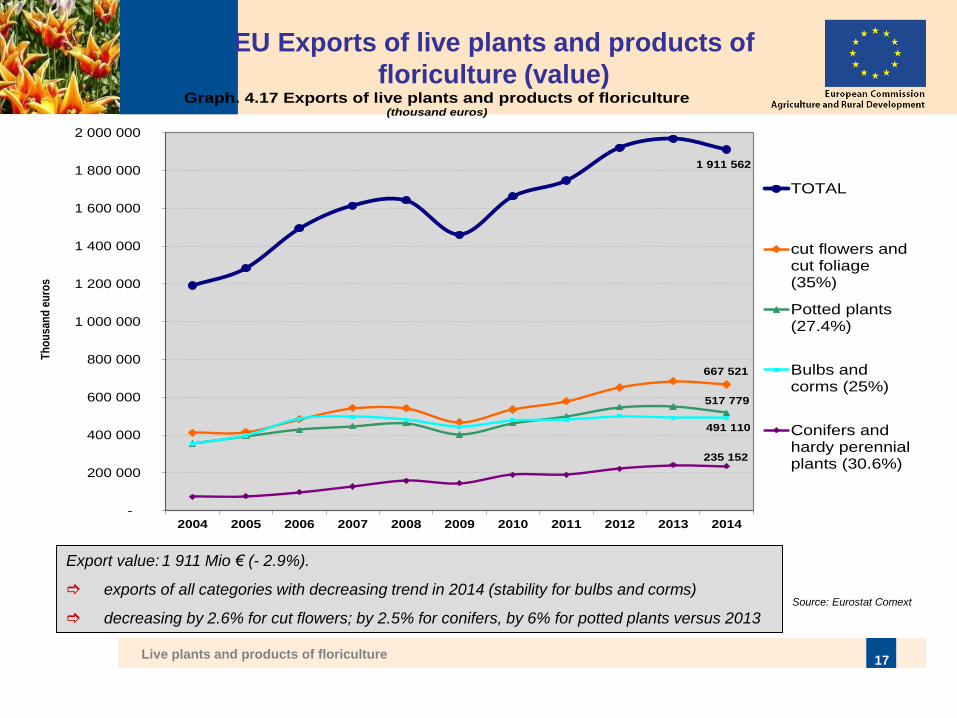
EU Exports of live plants and products of
floriculture (value)
Source: Eurostat Comext
Export value: 1 911 Mio € (- 2.9%).
exports of all categories with decreasing trend in 2014 (stability for bulbs and corms)
decreasing by 2.6% for cut flowers; by 2.5% for conifers, by 6% for potted plants versus 2013
1 911 562
667 521
517 779
491 110
235 152
-
200 000
400 000
600 000
800 000
1 000 000
1 200 000
1 400 000
1 600 000
1 800 000
2 000 000
2004 2005 2006 2007 2008 2009 2010 2011 2012 2013 2014
Th
ou
san
d e
uro
s
Graph. 4.17 Exports of live plants and products of floriculture(thousand euros)
TOTAL
cut flowers andcut foliage(35%)
Potted plants(27.4%)
Bulbs andcorms (25%)
Conifers andhardy perennialplants (30.6%)
Live plants and products of floriculture 18
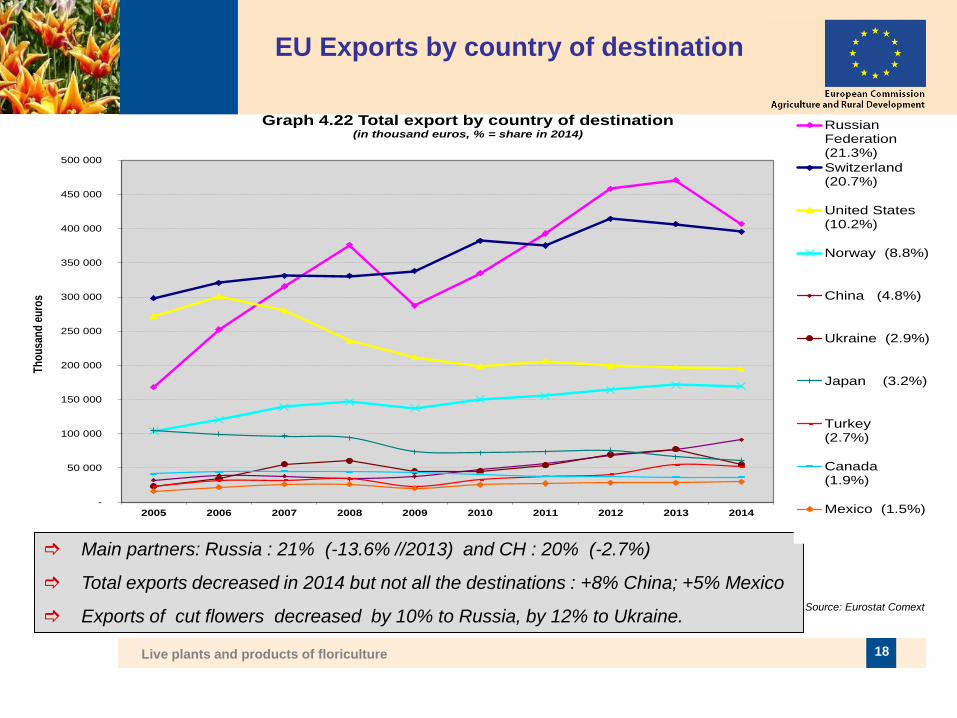
EU Exports by country of destination
Main partners: Russia : 21% (-13.6% //2013) and CH : 20% (-2.7%)
Total exports decreased in 2014 but not all the destinations : +8% China; +5% Mexico
Exports of cut flowers decreased by 10% to Russia, by 12% to Ukraine.
Source: Eurostat Comext
-
50 000
100 000
150 000
200 000
250 000
300 000
350 000
400 000
450 000
500 000
2005 2006 2007 2008 2009 2010 2011 2012 2013 2014
Th
ou
san
d e
uro
s
Graph 4.22 Total export by country of destination (in thousand euros, % = share in 2014)
RussianFederation(21.3%)
Switzerland(20.7%)
United States(10.2%)
Norway (8.8%)
China (4.8%)
Ukraine (2.9%)
Japan (3.2%)
Turkey(2.7%)
Canada(1.9%)
Mexico (1.5%)
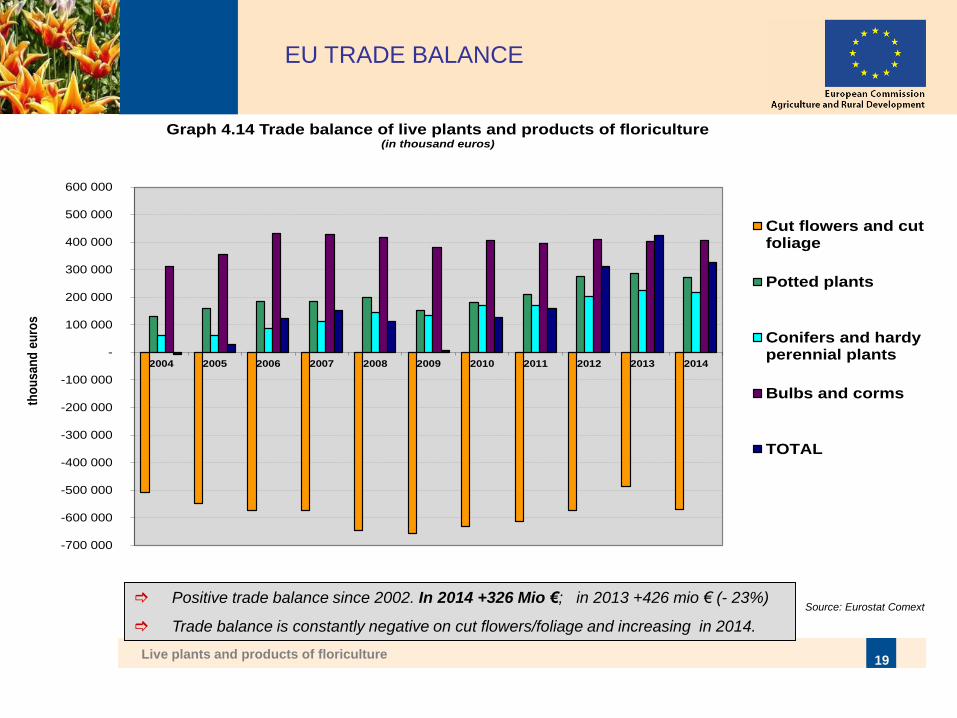
Live plants and products of floriculture 19
Positive trade balance since 2002. In 2014 +326 Mio €; in 2013 +426 mio € (- 23%)
Trade balance is constantly negative on cut flowers/foliage and increasing in 2014.
Source: Eurostat Comext
EU TRADE BALANCE
-700 000
-600 000
-500 000
-400 000
-300 000
-200 000
-100 000
-
100 000
200 000
300 000
400 000
500 000
600 000
2004 2005 2006 2007 2008 2009 2010 2011 2012 2013 2014
tho
us
an
d e
uro
s
Graph 4.14 Trade balance of live plants and products of floriculture (in thousand euros)
Cut flowers and cutfoliage
Potted plants
Conifers and hardyperennial plants
Bulbs and corms
TOTAL
Live plants and products of floriculture 20
Source: Eurostat Comext
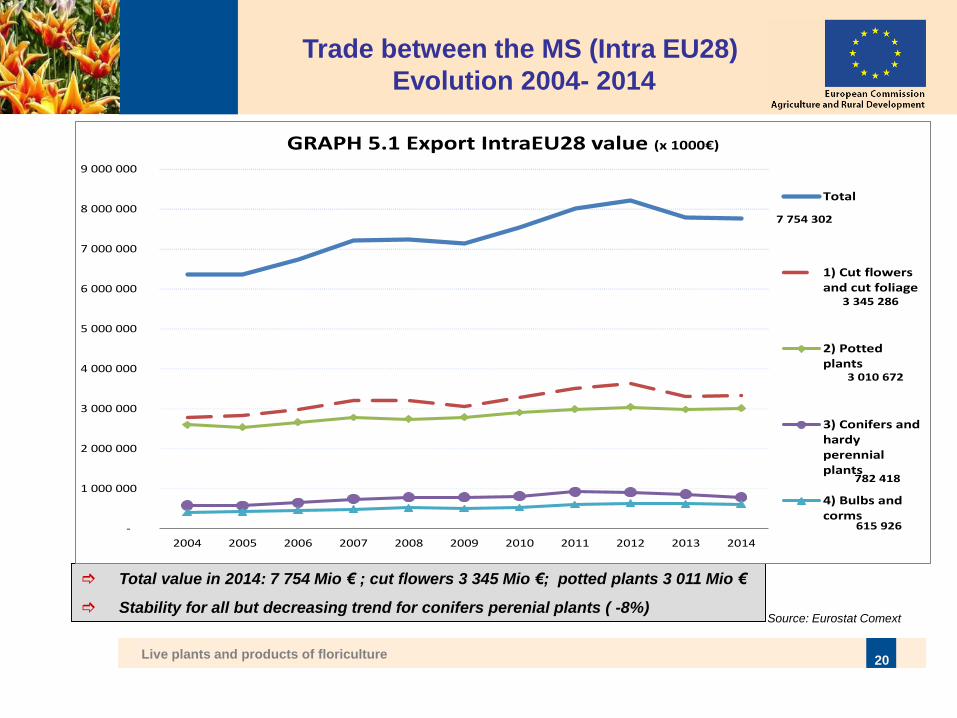
Trade between the MS (Intra EU28)
Evolution 2004- 2014
Total value in 2014: 7 754 Mio € ; cut flowers 3 345 Mio €; potted plants 3 011 Mio €
Stability for all but decreasing trend for conifers perenial plants ( -8%)
7 754 302
3 345 286
3 010 672
782 418
615 926 -
1 000 000
2 000 000
3 000 000
4 000 000
5 000 000
6 000 000
7 000 000
8 000 000
9 000 000
2004 2005 2006 2007 2008 2009 2010 2011 2012 2013 2014
GRAPH 5.1 Export IntraEU28 value (x 1000€)
Total
1) Cut flowersand cut foliage
2) Pottedplants
3) Conifers andhardyperennialplants
4) Bulbs andcorms
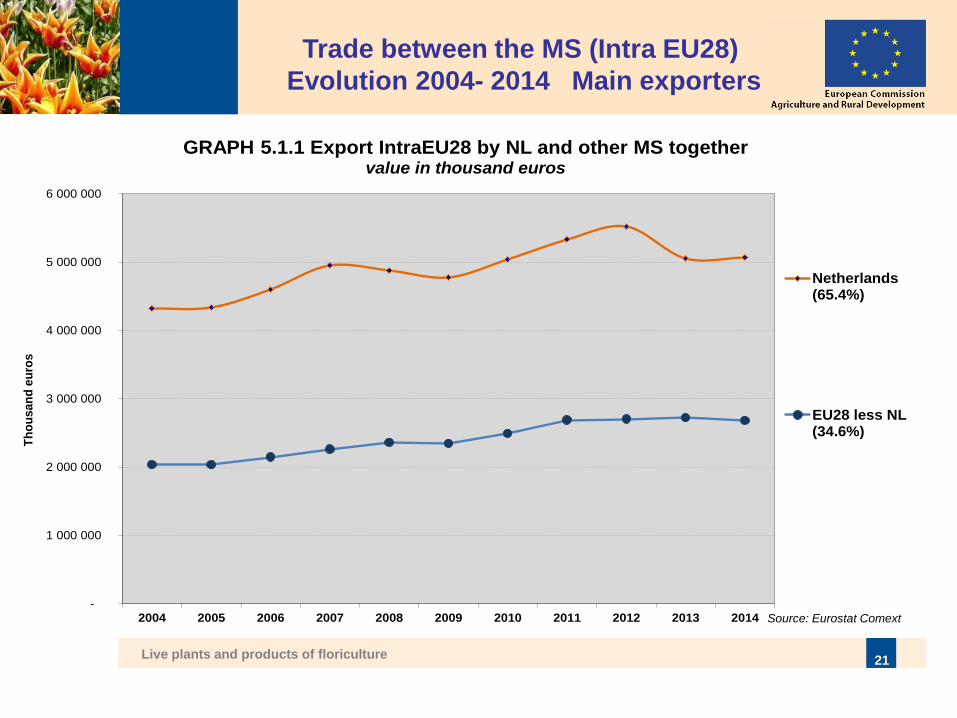
Live plants and products of floriculture 21
Source: Eurostat Comext
Trade between the MS (Intra EU28)
Evolution 2004- 2014 Main exporters
-
1 000 000
2 000 000
3 000 000
4 000 000
5 000 000
6 000 000
2004 2005 2006 2007 2008 2009 2010 2011 2012 2013 2014
Th
ou
san
d e
uro
s
GRAPH 5.1.1 Export IntraEU28 by NL and other MS together value in thousand euros
Netherlands(65.4%)
EU28 less NL(34.6%)
Live plants and products of floriculture 22
Source: Eurostat Comext
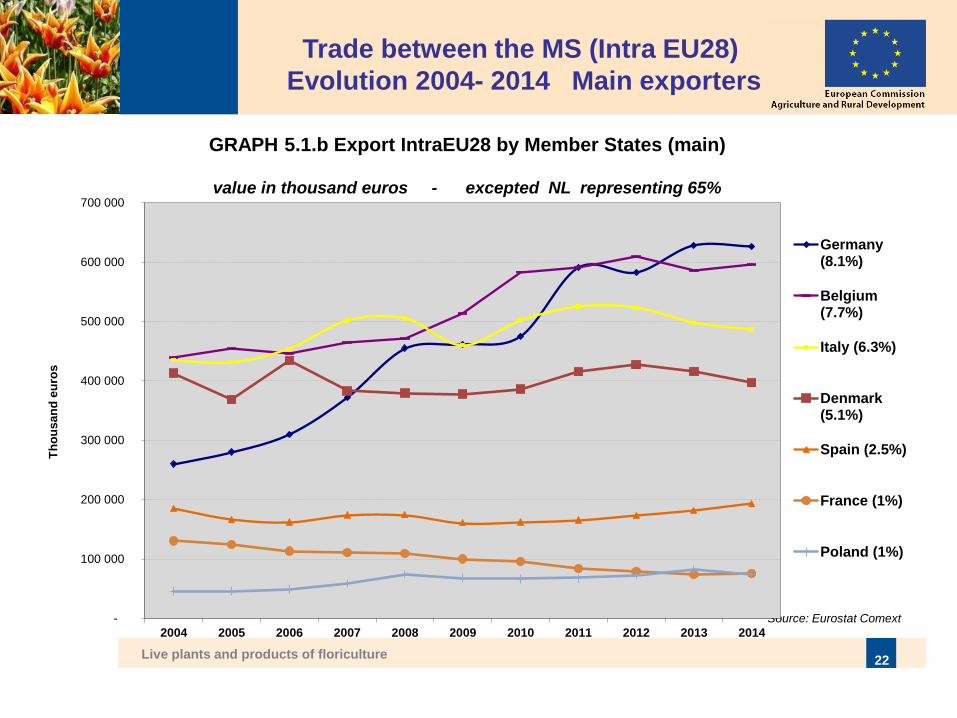
Trade between the MS (Intra EU28)
Evolution 2004- 2014 Main exporters
-
100 000
200 000
300 000
400 000
500 000
600 000
700 000
2004 2005 2006 2007 2008 2009 2010 2011 2012 2013 2014
Th
ou
san
d e
uro
s
GRAPH 5.1.b Export IntraEU28 by Member States (main)
value in thousand euros - excepted NL representing 65%
Germany(8.1%)
Belgium(7.7%)
Italy (6.3%)
Denmark(5.1%)
Spain (2.5%)
France (1%)
Poland (1%)
Live plants and products of floriculture 23
Source: Eurostat Comext
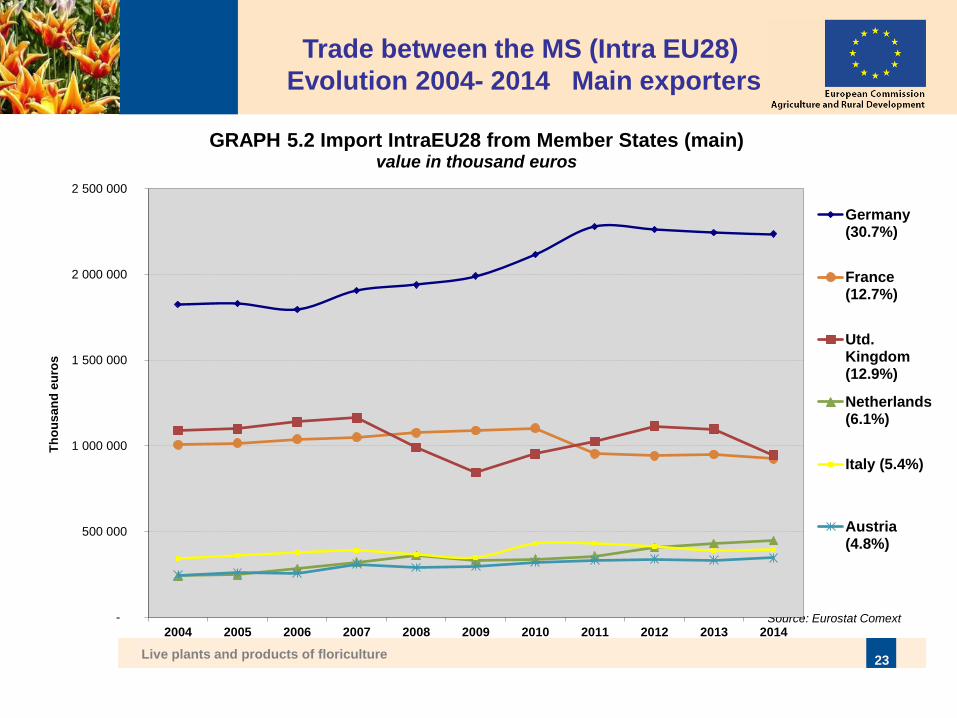
Trade between the MS (Intra EU28)
Evolution 2004- 2014 Main exporters
-
500 000
1 000 000
1 500 000
2 000 000
2 500 000
2004 2005 2006 2007 2008 2009 2010 2011 2012 2013 2014
Th
ou
san
d e
uro
s
GRAPH 5.2 Import IntraEU28 from Member States (main) value in thousand euros
Germany(30.7%)
France(12.7%)
Utd.Kingdom(12.9%)
Netherlands(6.1%)
Italy (5.4%)
Austria(4.8%)
Live plants and products of floriculture 24
TRADE of CUT FLOWERS (trends)
Live plants and products of floriculture 25
Source: Eurostat Comext
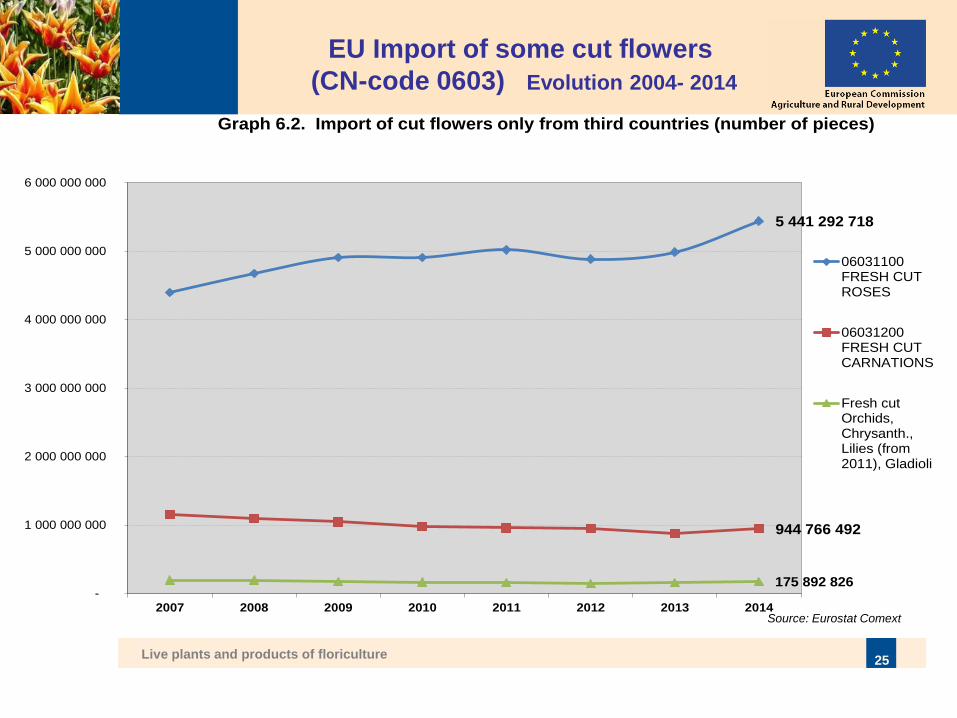
EU Import of some cut flowers
(CN-code 0603) Evolution 2004- 2014
5 441 292 718
944 766 492
175 892 826 -
1 000 000 000
2 000 000 000
3 000 000 000
4 000 000 000
5 000 000 000
6 000 000 000
2007 2008 2009 2010 2011 2012 2013 2014
Graph 6.2. Import of cut flowers only from third countries (number of pieces)
06031100FRESH CUTROSES
06031200FRESH CUTCARNATIONS
Fresh cutOrchids,Chrysanth.,Lilies (from2011), Gladioli
Live plants and products of floriculture 26
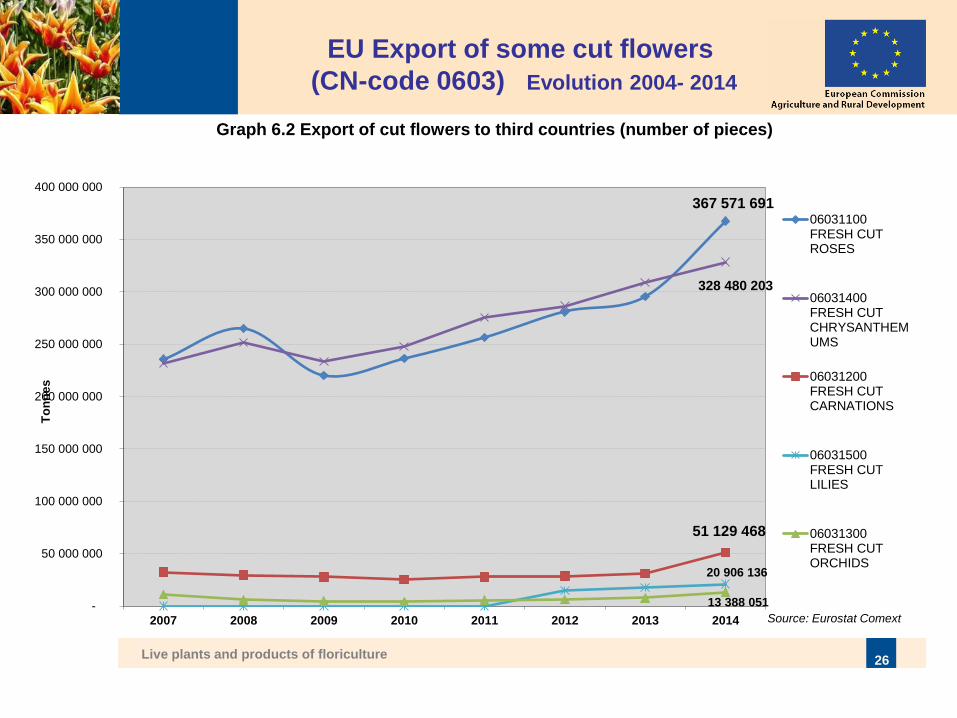
Source: Eurostat Comext
EU Export of some cut flowers
(CN-code 0603) Evolution 2004- 2014
367 571 691
328 480 203
51 129 468
20 906 136
13 388 051 -
50 000 000
100 000 000
150 000 000
200 000 000
250 000 000
300 000 000
350 000 000
400 000 000
2007 2008 2009 2010 2011 2012 2013 2014
To
nn
es
Graph 6.2 Export of cut flowers to third countries (number of pieces)
06031100FRESH CUTROSES
06031400FRESH CUTCHRYSANTHEMUMS
06031200FRESH CUTCARNATIONS
06031500FRESH CUTLILIES
06031300FRESH CUTORCHIDS
Live plants and products of floriculture 27
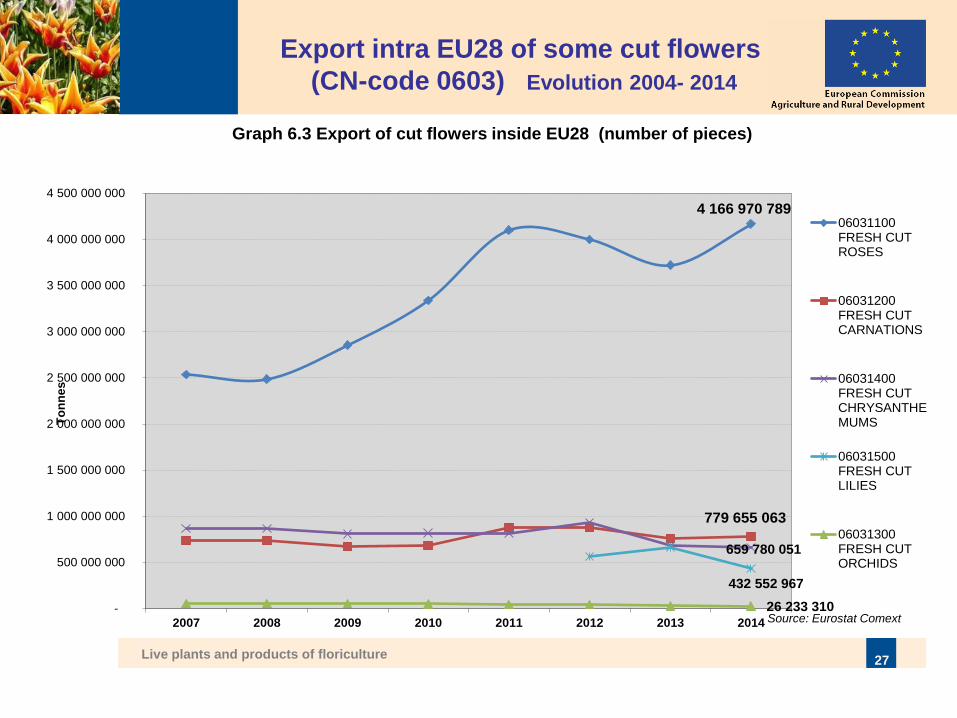
Source: Eurostat Comext
Export intra EU28 of some cut flowers
(CN-code 0603) Evolution 2004- 2014
4 166 970 789
779 655 063
659 780 051
432 552 967
26 233 310 -
500 000 000
1 000 000 000
1 500 000 000
2 000 000 000
2 500 000 000
3 000 000 000
3 500 000 000
4 000 000 000
4 500 000 000
2007 2008 2009 2010 2011 2012 2013 2014
To
nn
es
Graph 6.3 Export of cut flowers inside EU28 (number of pieces)
06031100FRESH CUTROSES
06031200FRESH CUTCARNATIONS
06031400FRESH CUTCHRYSANTHEMUMS
06031500FRESH CUTLILIES
06031300FRESH CUTORCHIDS