Embed Size (px)
Citation preview

Live Live plantsplants and and productsproducts of of floriculturefloriculturesectorsector in the EUin the EU
Aurora IERUGANEuropean CommissionDG Agriculture and Rural Development (DG AGRI)Unit C.2. Olive oil, horticultural products
Advisory group – Brussels – 12 October 2011

Live plants and products of floriculture 2
This statistical document has been prepared by Unit C.2 of DG AGRI, in order to stimulate discussion at the Flowers and ornamental plants Advisory Group. It is a mere working document. The European Commission does not accept any responsibility in respect of the exactness of given data.

Live plants and products of floriculture 3
Structure of the presentation
1. Land area
2. Production
3. Trade: imports, exports and balance

Live plants and products of floriculture 4
1. LAND AREA

Live plants and products of floriculture 5
Land area of flowers, ornamental plants and nursery plants
Source of data: EurostatNB: Data are not available for all the countries and years. Some of them are estimations (namely 2010)
0
5 000
10 000
15 000
20 000
25 000
30 000
35 000
40 000
45 000
50 000
2000 2001 2002 2003 2004 2005 2006 2007 2008 2009 2010 (p)
Hec
tare
s
NL
FR
DE
IT
PL
HU
UK
Others
] Estimated at 194,000 ha in 2010
] Highly concentrated in the Old Member States:
• NL 44,700 ha (23%),
• FR 26,600 ha (14%),
• DE 26,400 ha (14%),
• IT 24,520 ha (13%),
• PL 17,400 ha (9%).
] EU 27 + 1.3% vs. 2009
] Main changes: • NL + 3.5%, PL + 9.4%;
• UK – 9.1%, DK – 8.9%
] Long run declining trend, except for NL and HU.

Live plants and products of floriculture 6
2. PRODUCTION
Live plants and products of floriculture 7
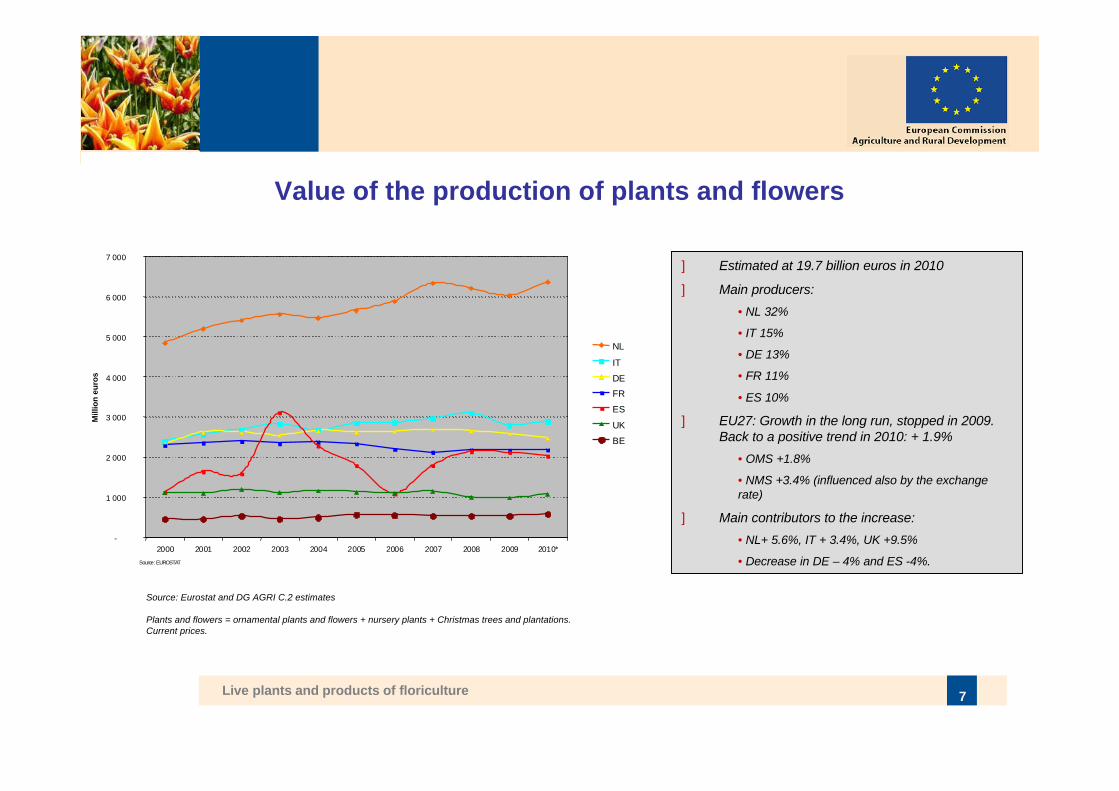
Value of the production of plants and flowers
Source: Eurostat and DG AGRI C.2 estimates
Plants and flowers = ornamental plants and flowers + nursery plants + Christmas trees and plantations.Current prices.
] Estimated at 19.7 billion euros in 2010
] Main producers:• NL 32%
• IT 15%
• DE 13%
• FR 11%
• ES 10%
] EU27: Growth in the long run, stopped in 2009. Back to a positive trend in 2010: + 1.9%
• OMS +1.8%
• NMS +3.4% (influenced also by the exchange rate)
] Main contributors to the increase: • NL+ 5.6%, IT + 3.4%, UK +9.5%
• Decrease in DE – 4% and ES -4%.
-
1 000
2 000
3 000
4 000
5 000
6 000
7 000
2000 2001 2002 2003 2004 2005 2006 2007 2008 2009 2010*
Mill
ion
euro
s
NL
IT
DEFR
ES
UK
BE
Source: EUROSTAT
Live plants and products of floriculture 8
3. TRADE

Live plants and products of floriculture 9
Global trade in 2010
Colombia (21%)€ 941 million
USA 76%
EU + Colombia + Ecuador + Kenya =
75% of the world exports
Source: GTA
USA
71%
Ecuador (10%)€ 449 million
EU (37%)€ 1.663 million
CH
23%
RUSSIA 20%
Kenya (7%)€ 295 million
EU 88%

Live plants and products of floriculture 10
Imports of live plants and products of floriculture
Source: Eurostat Comext
-
50 000
100 000
150 000
200 000
250 000
300 000
350 000
400 000
450 000
500 000
2000 2001 2002 2003 2004 2005 2006 2007 2008 2009 2010
Tonn
es
Cut flowers and cut foliage(73,5%)
Potted plants (20,6%)
Conifers and hardyperennial plants (1,7%)
Bulbs and corms (4,2%)
TOTAL
] 420,000 tonnes/1.5 billion euros in 2010
] Imports are focussed on cut flowers and cut foliage (73%) and potted plants (21%).
] After a long term growth, imports started decreasing in 2008.
] The decrease of 2.3% registered in 2010 vs. 2009 was mainly due to cut flowers and cut foliage (-2.6%).
] However, imports increased by 3.6% in terms of value in 2010.
First semester 2011:-0.1% vol, +4.6% val

Live plants and products of floriculture 11
32%
17%7%2%
2%
39%
1%060311:FRESH CUT ROSES AND BUDS, OF AKIND SUITABLE FORBOUQUETS OR FOR ORNAMENTAL PURPOSES
06049190:FOLIAGE, BRANCHES AND OTHER PARTS OF PLANTS,WITHOUT FLOWERS OR FLOWER BUDS, GRASSES, FRESH, FORBOUQUETS OR ORNAMENTAL PURPOSES (EXCL. CHRISTMASTREES AND CONIFER BRANCHES)060312:FRESH CUT CARNATIONS AND BUDS, OF AKIND SUITABLEFOR BOUQUETS OR FOR ORNAMENTAL PURPOSES
06049990:DYED, BLEACHED, IMPREGNATED OR OTHERWISEPREPARED FOLIAGE, BRANCHES AND OTHER PARTS OF PLANTS,WITHOUT FLOWERS OR BUDS, GRASSES, FOR BOUQUETS OR FORORNAMENTAL PURPOSES (EXCL. DRIED)
06049910:DRIED FOLIAGE, BRANCHES AND OTHER PARTS OFPLANTS, WITHOUT FLOWERS OR FLOWER BUDS, GRASSES, FORBOUQUETS OR ORNAMENTAL PURPOSES
OTHER CUT FLOWERS
OTHER CUT FOLIAGE
Imports of cut flowers and cut foliage (% in 2010)
Source: Eurostat Comext

Live plants and products of floriculture 12
Imports by country of origin
1 - Cut flowers and foliage:
2 - Potted plants:
3 - Conifers and hardyperennial pl.:4 - Bulbs and corms:
Kenya Costa Rica Ethiopia Others
Source: Eurostat Comext
-
20 000
40 000
60 000
80 000
100 000
120 000
140 000
160 000
2000 2001 2002 2003 2004 2005 2006 2007 2008 2009 2010
Tonn
es
Kenya (21,4%)Costa Rica (11,5%)Ethiopia (8,1%)Israel (6,3%)USA (6,3%)Colombia (5,8%)China (5,7%)Ecuador (5,6%)Guatemala (3%)Others (26,3%)
] Kenya is the main supplier, accounting for 21.4% of EU imports. Its offer is focussed on cut flowers (98%).
] Costa Rica represents 11.5% of EU imports (58% potted plants/42% cut flowers and cut foliage).
] Imports decreased from all countries of origin, except for Ethiopia (+14.7%) and Costa Rica (+5.8%).

Live plants and products of floriculture 13
Exports of live plants and products of floriculture
Source: Eurostat Comext
] 570,000 tonnes/1.66 billion euros in 2010
] After the drop-off in 2009 (mainlytowards Russia), exports of allcategories restarted to grow in 2010 (overall +9.8% in tonnes, +11.5% in value).
] The growth concerned all categories, in particular conifers and hardyperennial plants (+26%).
] In 2010, bulbs and corms became the first category exported (40.9%), followed by potted plants (38.4%).-
50 000
100 000
150 000
200 000
250 000
300 000
350 000
400 000
450 000
500 000
550 000
600 000
2000 2001 2002 2003 2004 2005 2006 2007 2008 2009 2010
Tonn
es
Cut flowers and cut foliage(20,9%)
Potted plants (38,4%)
Conifers and hardyperennial plants (35,0%)
Bulbs and corms (40,9%)
TOTAL
First semester 2011:+8.8 % vol, +8.6% val

Live plants and products of floriculture 14
Exports by country of destination
] Main partners: CH (20.4%) and Russia (20%)
] Exports increased in 2010 towards all the maindestinations.
] Significant recovery of exportsto Russia (+16.8%).
1 - Cut flowers and foliage:
2 - Potted plants:
3 - Conifers and hardy perennial pl.:
4 - Bulbs and corms:
CH Russia USA Others
Source: Eurostat Comext
-
20 000
40 000
60 000
80 000
100 000
120 000
140 000
2000 2001 2002 2003 2004 2005 2006 2007 2008 2009 2010
Tonn
es
Switzerland(20,4%)Russia (20,0%)
USA (9,3%)
Norway (8,0%)
Turkey (3,9%)
Ukraine (3,8%)
Japan (3,3%)
China (3,1%)
Croatia (2,8%)
Mexico (1,8%)
Others (23,6%)

Live plants and products of floriculture 15
Trade balance of live plants and products of floriculture
Source: Eurostat Comext
] Positive balance since 2006 in tonnes and since 2002 in value
] 148,000 tonnes/161 millioneuros in 2010
] EU27 is a net importer of cut flowers and cut foliage, and
] a net exporter of the othercategories
-250 000
-200 000
-150 000
-100 000
-50 000
-
50 000
100 000
150 000
200 000
2000 2001 2002 2003 2004 2005 2006 2007 2008 2009 2010
tonn
es
Cut flowers and cut foliage
Potted plants
Conifers and hardy perennialplantsBulbs and corms
TOTAL

Live plants and products of floriculture 16
Deliveries of live plants and products of floriculture to intra and extra EU countries
-
250 000
500 000
750 000
1 000 000
1 250 000
1 500 000
1 750 000
NL av.
2007
-2009
NL 2010
IT av. 2
007-2
009
IT 2010
DE av. 2
007-20
09
DE 2010
BE av. 2
007-2
009
BE 2010
ES av. 2
007-20
09
ES 2010
DK av. 2
007-20
09
DK 2010
FR av. 2
007-2
009
FR 2010
PL av. 200
7-200
9
PL 201
0
Others av
. 200
7-2009
Others 201
0
tonn
es
extra EUintra EU
Source: Eurostat Comext

Live plants and products of floriculture 17
NL85%
Others6%
UK2%DE
3%FR4%
NL31%
IT24%
ES12%
DE10%
BE8%
PL5%
Others10%
NL52%
IT17%
DE10%
BE6%
DK5%
ES4%
Others6%
NL69%
DK10%
PT3%
Others11%
IT3%
BE4%
Deliveries to intra and extra EU countries in 2010
Cut flowers and foliage Potted plants
Conifers and hardy perennial pl Bulbs and corms
Source: Eurostat Comext