Embed Size (px)
Citation preview
Live Cell Imaging of GPCR Dependent Second-Messenger Systems Using the Cytation™ 3 Cell Imaging Multi-Mode Reader to Image Genetically Encoded GPCR Reactive Sensors in Real Time
A p p l i c a t i o n N o t e
Cell Imaging
BioTek Instruments, Inc.P.O. Box 998, Highland Park, Winooski, Vermont 05404-0998 USAPhone: 888-451-5171 Outside the USA: 802-655-4740 Email: [email protected] www.biotek.comCopyright © 2014
Paul Held Ph. D. and Peter Banks, Ph. D., Applications Department, BioTek Instruments, Inc., Winooski, VT Paul Tewson, Anne Marie Quinn and Thom Hughes, Montana Molecular, Bozeman, MT
Key Words:
GPCR
Calcium Flux
Fluorescence
Biosensor
Live Cells
Imaging
GECO
Introduction
Cell signaling involves an integrated, multifaceted series of second-messenger systems that act in concert to transfer cell surface receptor mediated signals to a wide variety of intracellular processes. G-Protein Coupled Receptors (GPCRs) are the most notable initiators of the cell signaling cascade and are the targets of much of the drug discovery effort. Drug discovery screening of compound libraries relies on the ability to rapidly make assay determinations on large numbers of samples. At the same time phenotypic information is also desired to assess the true cellular response. To that end, a system having multiple sensors capable of simultaneously detecting different signaling components of the GPCR pathways is of particular importance.
The signaling cascades resulting from interaction of the GPCR and its ligand are multifaceted
Figure 1. Schematic diagram of a G-Protein Coupled Receptor (GPCR) Signal Pathway.
A significant proportion of academic and drug discovery research is devoted towards the elucidation of second messenger signaling cascades resulting from interactions between G-protein coupled receptors (GPCR) and their ligands. Because cell signaling involves the interaction of multiple second messenger pathways, multiplex sensors capable of simultaneously detecting different components of these pathways are of particular benefit in advancing biomedical research. Here we describe the use of the Cytation 3, a highly cost-effective combination cell imager and microplate reader, to rapidly image and analyze genetically encoded fluorescent biosensors to a number of GPCR related second messengers.
and complex. There are two signal transduction pathways involving the G protein-coupled receptors commonly targeted for investigation: the cAMP signal pathway and the phosphatidylinositol signal pathway [1]. The activated receptor catalyses the activation and dissociation of its heterotrimeric G-protein.
In the cAMP pathway, the activated Gαs subunit stimulates the transmembrane glycoprotein adenylate cyclase. Adenylate cyclase, in the presence of Mg++ or Mn++ cofactors, catalyzes the conversion of ATP to cAMP. cAMP then acts as a second messenger in cellular metabolism and is an allosteric activator to Protein kinase A (PKA), a holoenzyme consisting of regulatory subunit dimers, each being bound to a catalytic subunit (Figure 1).
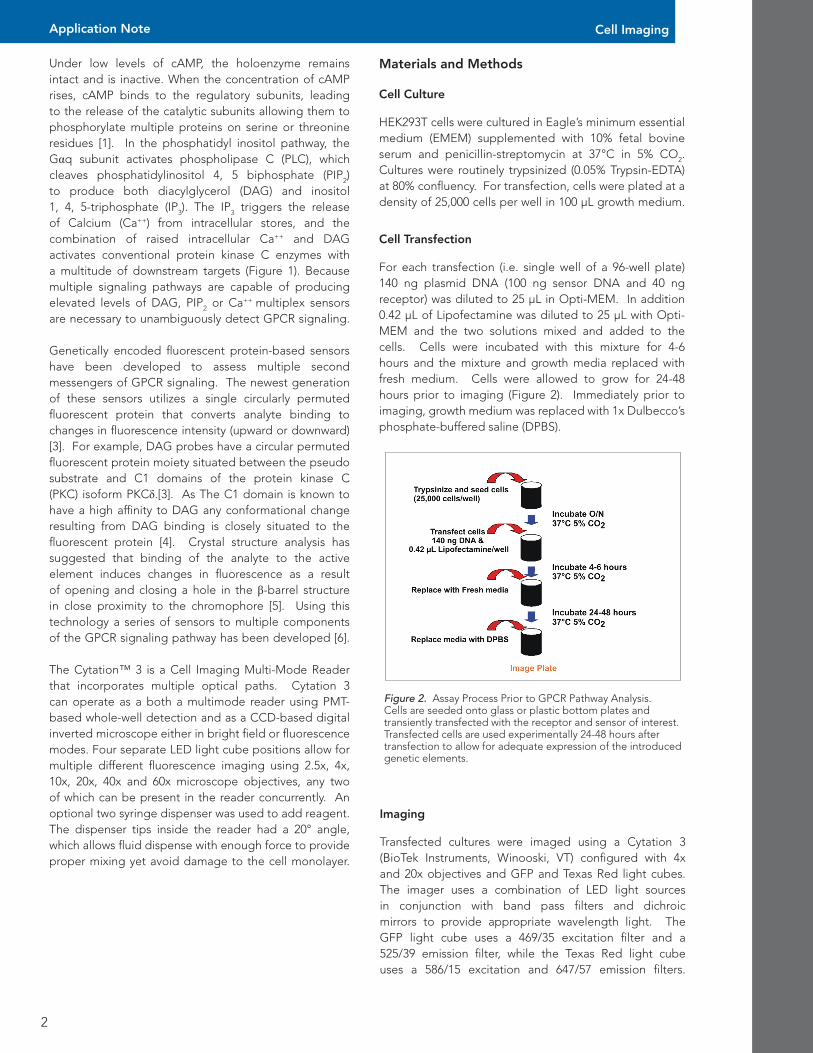
Under low levels of cAMP, the holoenzyme remains intact and is inactive. When the concentration of cAMP rises, cAMP binds to the regulatory subunits, leading to the release of the catalytic subunits allowing them to phosphorylate multiple proteins on serine or threonine residues [1]. In the phosphatidyl inositol pathway, the Gαq subunit activates phospholipase C (PLC), which cleaves phosphatidylinositol 4, 5 biphosphate (PIP2) to produce both diacylglycerol (DAG) and inositol 1, 4, 5-triphosphate (IP3). The IP3 triggers the release of Calcium (Ca++) from intracellular stores, and the combination of raised intracellular Ca++ and DAG activates conventional protein kinase C enzymes with a multitude of downstream targets (Figure 1). Because multiple signaling pathways are capable of producing elevated levels of DAG, PIP2 or Ca++ multiplex sensors are necessary to unambiguously detect GPCR signaling.
Genetically encoded fluorescent protein-based sensors have been developed to assess multiple second messengers of GPCR signaling. The newest generation of these sensors utilizes a single circularly permuted fluorescent protein that converts analyte binding to changes in fluorescence intensity (upward or downward) [3]. For example, DAG probes have a circular permuted fluorescent protein moiety situated between the pseudo substrate and C1 domains of the protein kinase C (PKC) isoform PKCδ.[3]. As The C1 domain is known to have a high affinity to DAG any conformational change resulting from DAG binding is closely situated to the fluorescent protein [4]. Crystal structure analysis has suggested that binding of the analyte to the active element induces changes in fluorescence as a result of opening and closing a hole in the β-barrel structure in close proximity to the chromophore [5]. Using this technology a series of sensors to multiple components of the GPCR signaling pathway has been developed [6].
The Cytation™ 3 is a Cell Imaging Multi-Mode Reader that incorporates multiple optical paths. Cytation 3 can operate as a both a multimode reader using PMT-based whole-well detection and as a CCD-based digital inverted microscope either in bright field or fluorescence modes. Four separate LED light cube positions allow for multiple different fluorescence imaging using 2.5x, 4x, 10x, 20x, 40x and 60x microscope objectives, any two of which can be present in the reader concurrently. An optional two syringe dispenser was used to add reagent. The dispenser tips inside the reader had a 20° angle, which allows fluid dispense with enough force to provide proper mixing yet avoid damage to the cell monolayer.
Materials and Methods
Cell Culture
HEK293T cells were cultured in Eagle’s minimum essential medium (EMEM) supplemented with 10% fetal bovine serum and penicillin-streptomycin at 37°C in 5% CO2. Cultures were routinely trypsinized (0.05% Trypsin-EDTA) at 80% confluency. For transfection, cells were plated at a density of 25,000 cells per well in 100 µL growth medium.
Cell Transfection
For each transfection (i.e. single well of a 96-well plate) 140 ng plasmid DNA (100 ng sensor DNA and 40 ng receptor) was diluted to 25 µL in Opti-MEM. In addition 0.42 µL of Lipofectamine was diluted to 25 µL with Opti-MEM and the two solutions mixed and added to the cells. Cells were incubated with this mixture for 4-6 hours and the mixture and growth media replaced with fresh medium. Cells were allowed to grow for 24-48 hours prior to imaging (Figure 2). Immediately prior to imaging, growth medium was replaced with 1x Dulbecco’s phosphate-buffered saline (DPBS).
2
Application Note Cell Imaging
Figure 2. Assay Process Prior to GPCR Pathway Analysis. Cells are seeded onto glass or plastic bottom plates and transiently transfected with the receptor and sensor of interest. Transfected cells are used experimentally 24-48 hours after transfection to allow for adequate expression of the introduced genetic elements.
Imaging
Transfected cultures were imaged using a Cytation 3 (BioTek Instruments, Winooski, VT) configured with 4x and 20x objectives and GFP and Texas Red light cubes. The imager uses a combination of LED light sources in conjunction with band pass filters and dichroic mirrors to provide appropriate wavelength light. The GFP light cube uses a 469/35 excitation filter and a 525/39 emission filter, while the Texas Red light cube uses a 586/15 excitation and 647/57 emission filters.
3
Application Note Cell Imaging
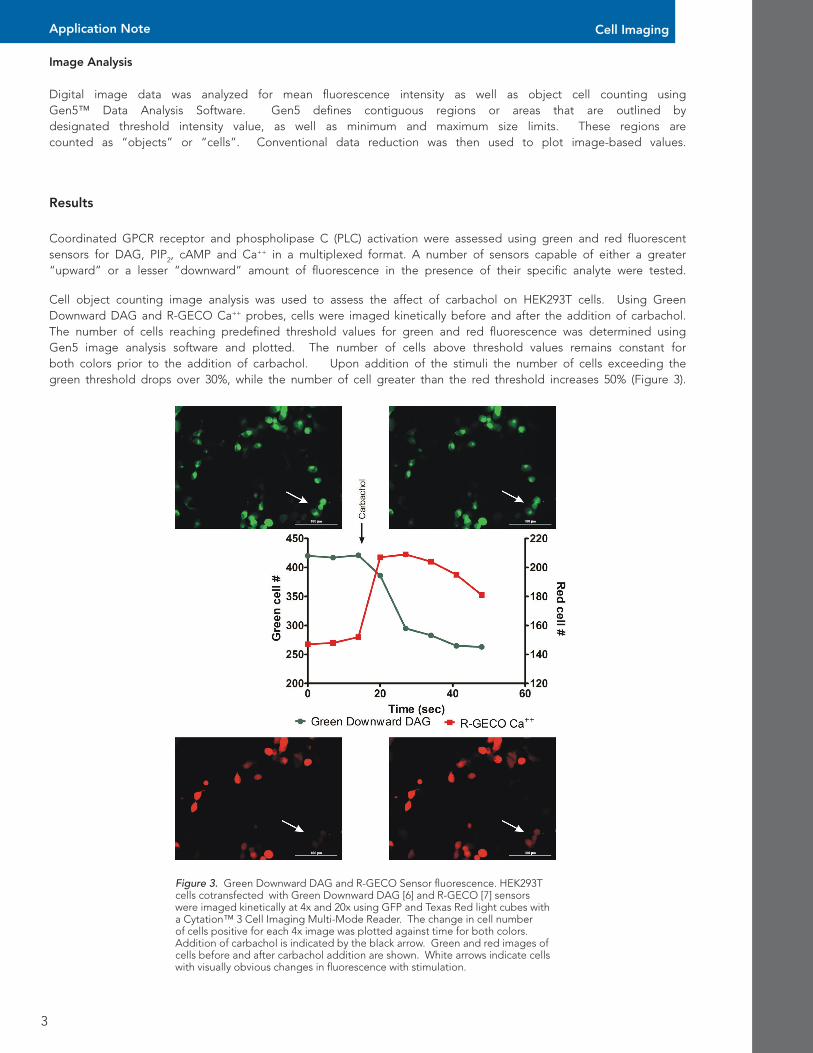
Figure 3. Green Downward DAG and R-GECO Sensor fluorescence. HEK293T cells cotransfected with Green Downward DAG [6] and R-GECO [7] sensors were imaged kinetically at 4x and 20x using GFP and Texas Red light cubes with a Cytation™ 3 Cell Imaging Multi-Mode Reader. The change in cell number of cells positive for each 4x image was plotted against time for both colors. Addition of carbachol is indicated by the black arrow. Green and red images of cells before and after carbachol addition are shown. White arrows indicate cells with visually obvious changes in fluorescence with stimulation.
Image Analysis
Digital image data was analyzed for mean fluorescence intensity as well as object cell counting using Gen5™ Data Analysis Software. Gen5 defines contiguous regions or areas that are outlined by designated threshold intensity value, as well as minimum and maximum size limits. These regions are counted as “objects” or “cells”. Conventional data reduction was then used to plot image-based values.
Results
Coordinated GPCR receptor and phospholipase C (PLC) activation were assessed using green and red fluorescent sensors for DAG, PIP2, cAMP and Ca++ in a multiplexed format. A number of sensors capable of either a greater “upward” or a lesser “downward” amount of fluorescence in the presence of their specific analyte were tested.
Cell object counting image analysis was used to assess the affect of carbachol on HEK293T cells. Using Green Downward DAG and R-GECO Ca++ probes, cells were imaged kinetically before and after the addition of carbachol. The number of cells reaching predefined threshold values for green and red fluorescence was determined using Gen5 image analysis software and plotted. The number of cells above threshold values remains constant for both colors prior to the addition of carbachol. Upon addition of the stimuli the number of cells exceeding the green threshold drops over 30%, while the number of cell greater than the red threshold increases 50% (Figure 3).
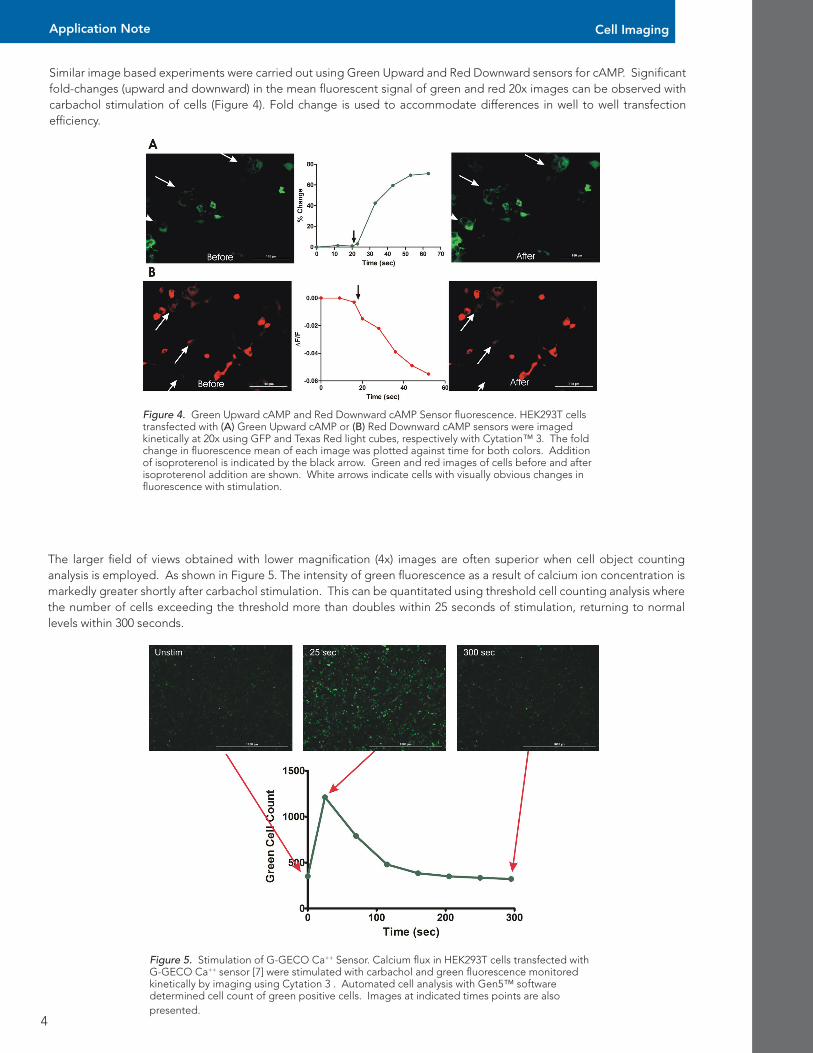
Similar image based experiments were carried out using Green Upward and Red Downward sensors for cAMP. Significant fold-changes (upward and downward) in the mean fluorescent signal of green and red 20x images can be observed with carbachol stimulation of cells (Figure 4). Fold change is used to accommodate differences in well to well transfection efficiency.
The larger field of views obtained with lower magnification (4x) images are often superior when cell object counting analysis is employed. As shown in Figure 5. The intensity of green fluorescence as a result of calcium ion concentration is markedly greater shortly after carbachol stimulation. This can be quantitated using threshold cell counting analysis where the number of cells exceeding the threshold more than doubles within 25 seconds of stimulation, returning to normal levels within 300 seconds.
4
Application Note Cell Imaging
Figure 4. Green Upward cAMP and Red Downward cAMP Sensor fluorescence. HEK293T cells transfected with (A) Green Upward cAMP or (B) Red Downward cAMP sensors were imaged kinetically at 20x using GFP and Texas Red light cubes, respectively with Cytation™ 3. The fold change in fluorescence mean of each image was plotted against time for both colors. Addition of isoproterenol is indicated by the black arrow. Green and red images of cells before and after isoproterenol addition are shown. White arrows indicate cells with visually obvious changes in fluorescence with stimulation.
Figure 5. Stimulation of G-GECO Ca++ Sensor. Calcium flux in HEK293T cells transfected with G-GECO Ca++ sensor [7] were stimulated with carbachol and green fluorescence monitored kinetically by imaging using Cytation 3 . Automated cell analysis with Gen5™ software determined cell count of green positive cells. Images at indicated times points are also presented.
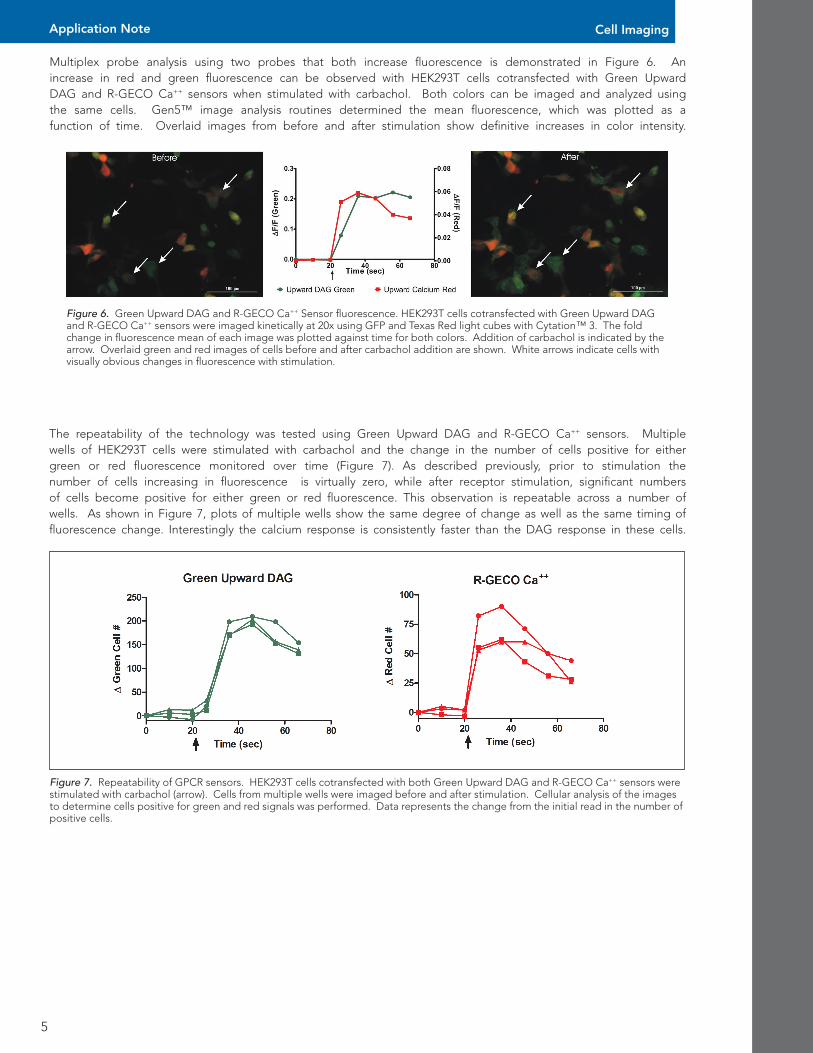
Multiplex probe analysis using two probes that both increase fluorescence is demonstrated in Figure 6. An increase in red and green fluorescence can be observed with HEK293T cells cotransfected with Green Upward DAG and R-GECO Ca++ sensors when stimulated with carbachol. Both colors can be imaged and analyzed using the same cells. Gen5™ image analysis routines determined the mean fluorescence, which was plotted as a function of time. Overlaid images from before and after stimulation show definitive increases in color intensity.
5
Application Note Cell Imaging
Figure 7. Repeatability of GPCR sensors. HEK293T cells cotransfected with both Green Upward DAG and R-GECO Ca++ sensors were stimulated with carbachol (arrow). Cells from multiple wells were imaged before and after stimulation. Cellular analysis of the images to determine cells positive for green and red signals was performed. Data represents the change from the initial read in the number of positive cells.
The repeatability of the technology was tested using Green Upward DAG and R-GECO Ca++ sensors. Multiple wells of HEK293T cells were stimulated with carbachol and the change in the number of cells positive for either green or red fluorescence monitored over time (Figure 7). As described previously, prior to stimulation the number of cells increasing in fluorescence is virtually zero, while after receptor stimulation, significant numbers of cells become positive for either green or red fluorescence. This observation is repeatable across a number of wells. As shown in Figure 7, plots of multiple wells show the same degree of change as well as the same timing of fluorescence change. Interestingly the calcium response is consistently faster than the DAG response in these cells.
Figure 6. Green Upward DAG and R-GECO Ca++ Sensor fluorescence. HEK293T cells cotransfected with Green Upward DAG and R-GECO Ca++ sensors were imaged kinetically at 20x using GFP and Texas Red light cubes with Cytation™ 3. The fold change in fluorescence mean of each image was plotted against time for both colors. Addition of carbachol is indicated by the arrow. Overlaid green and red images of cells before and after carbachol addition are shown. White arrows indicate cells with visually obvious changes in fluorescence with stimulation.
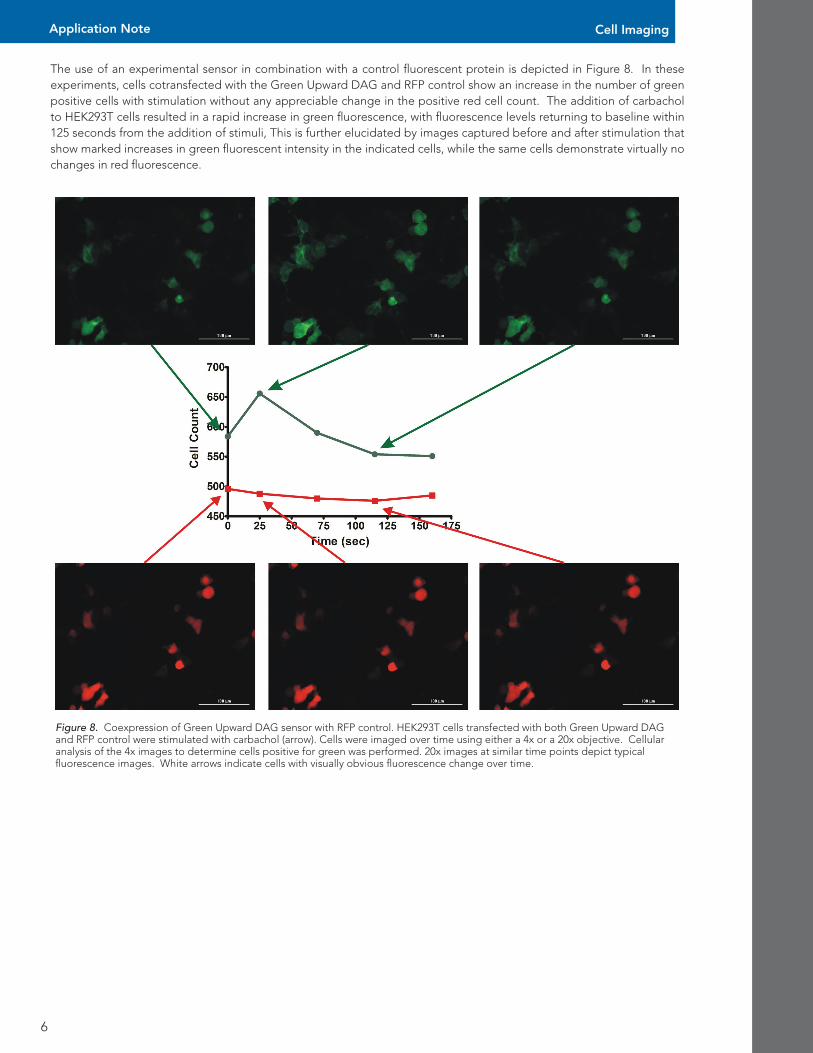
The use of an experimental sensor in combination with a control fluorescent protein is depicted in Figure 8. In these experiments, cells cotransfected with the Green Upward DAG and RFP control show an increase in the number of green positive cells with stimulation without any appreciable change in the positive red cell count. The addition of carbachol to HEK293T cells resulted in a rapid increase in green fluorescence, with fluorescence levels returning to baseline within 125 seconds from the addition of stimuli, This is further elucidated by images captured before and after stimulation that show marked increases in green fluorescent intensity in the indicated cells, while the same cells demonstrate virtually no changes in red fluorescence.
6
Application Note Cell Imaging
Figure 8. Coexpression of Green Upward DAG sensor with RFP control. HEK293T cells transfected with both Green Upward DAG and RFP control were stimulated with carbachol (arrow). Cells were imaged over time using either a 4x or a 20x objective. Cellular analysis of the 4x images to determine cells positive for green was performed. 20x images at similar time points depict typical fluorescence images. White arrows indicate cells with visually obvious fluorescence change over time.
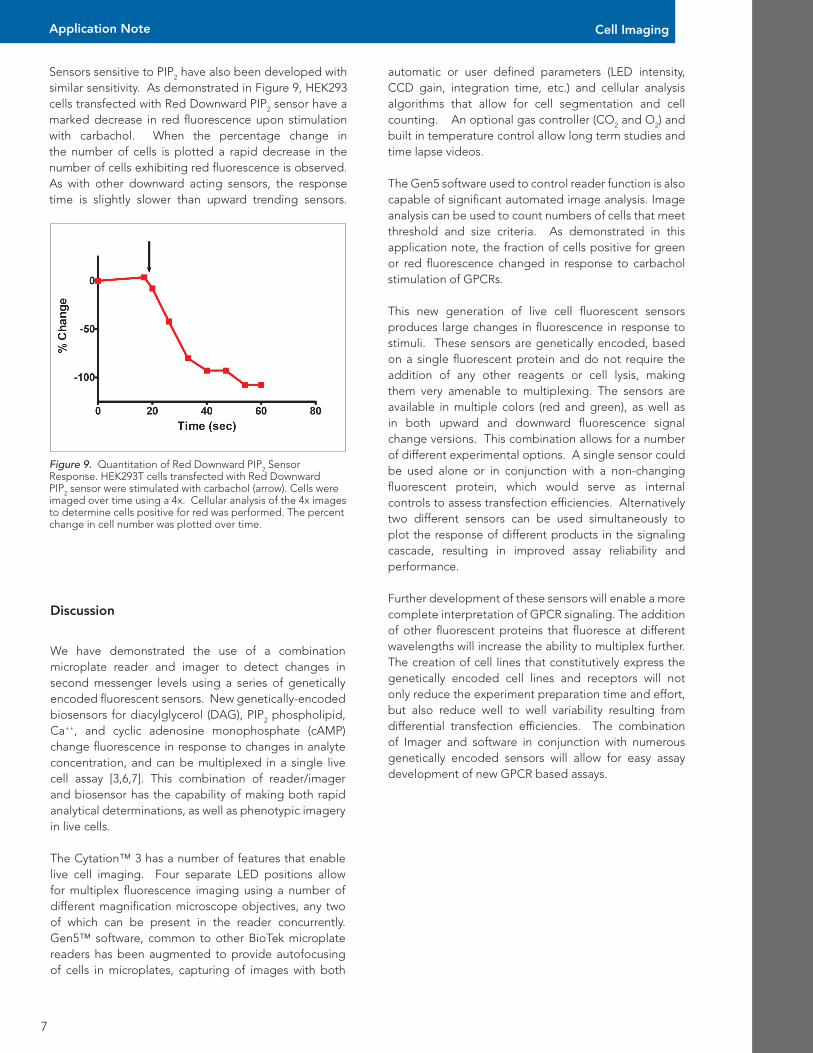
Sensors sensitive to PIP2 have also been developed with similar sensitivity. As demonstrated in Figure 9, HEK293 cells transfected with Red Downward PIP2 sensor have a marked decrease in red fluorescence upon stimulation with carbachol. When the percentage change in the number of cells is plotted a rapid decrease in the number of cells exhibiting red fluorescence is observed. As with other downward acting sensors, the response time is slightly slower than upward trending sensors.
7
Application Note Cell Imaging
automatic or user defined parameters (LED intensity, CCD gain, integration time, etc.) and cellular analysis algorithms that allow for cell segmentation and cell counting. An optional gas controller (CO2 and O2) and built in temperature control allow long term studies and time lapse videos.
The Gen5 software used to control reader function is also capable of significant automated image analysis. Image analysis can be used to count numbers of cells that meet threshold and size criteria. As demonstrated in this application note, the fraction of cells positive for green or red fluorescence changed in response to carbachol stimulation of GPCRs.
This new generation of live cell fluorescent sensors produces large changes in fluorescence in response to stimuli. These sensors are genetically encoded, based on a single fluorescent protein and do not require the addition of any other reagents or cell lysis, making them very amenable to multiplexing. The sensors are available in multiple colors (red and green), as well as in both upward and downward fluorescence signal change versions. This combination allows for a number of different experimental options. A single sensor could be used alone or in conjunction with a non-changing fluorescent protein, which would serve as internal controls to assess transfection efficiencies. Alternatively two different sensors can be used simultaneously to plot the response of different products in the signaling cascade, resulting in improved assay reliability and performance.
Further development of these sensors will enable a more complete interpretation of GPCR signaling. The addition of other fluorescent proteins that fluoresce at different wavelengths will increase the ability to multiplex further. The creation of cell lines that constitutively express the genetically encoded cell lines and receptors will not only reduce the experiment preparation time and effort, but also reduce well to well variability resulting from differential transfection efficiencies. The combination of Imager and software in conjunction with numerous genetically encoded sensors will allow for easy assay development of new GPCR based assays.
Figure 9. Quantitation of Red Downward PIP2 Sensor Response. HEK293T cells transfected with Red Downward PIP2 sensor were stimulated with carbachol (arrow). Cells were imaged over time using a 4x. Cellular analysis of the 4x images to determine cells positive for red was performed. The percent change in cell number was plotted over time.
Discussion
We have demonstrated the use of a combination microplate reader and imager to detect changes in second messenger levels using a series of genetically encoded fluorescent sensors. New genetically-encoded biosensors for diacylglycerol (DAG), PIP2 phospholipid, Ca++, and cyclic adenosine monophosphate (cAMP) change fluorescence in response to changes in analyte concentration, and can be multiplexed in a single live cell assay [3,6,7]. This combination of reader/imager and biosensor has the capability of making both rapid analytical determinations, as well as phenotypic imagery in live cells.
The Cytation™ 3 has a number of features that enable live cell imaging. Four separate LED positions allow for multiplex fluorescence imaging using a number of different magnification microscope objectives, any two of which can be present in the reader concurrently. Gen5™ software, common to other BioTek microplate readers has been augmented to provide autofocusing of cells in microplates, capturing of images with both
References
1. Gilman AG (1987). "G proteins: transducers of receptor-generated signals". Ann. Rev. Biochem. 56: 615–49.doi:10.1146/annurev.bi. 56. 070187. 003151. PMID 3113327.
2. Winder W.W. and D.G. Hardie (1999) AMP-activated protein kinase, a metabolic master switch: possible roles in type 2 diabetes. Am. J. Physiol. 277: E1-10.
3. Tewson, P. Westenberg, M. Zhao, Y., Campbell, R.E., Quinn, A.M., and Hughes, T.E. (2012) Simultaneous Detection of Ca2+ and Diacylglycerol Signaling in Living Cells. PLoS ONE 7(8):): e42791. doi:10.1371/journal.pone.0042791.
4. Giorgione, JR., L-H Lin, JA McCammon, and AC Newton (2006) Increased Membrane Affinity of the C1 domain of Protein Kinase Cdelta Compensates for the lack of Involvement of its C2 domain in Membrane Recruitment. J. Biol. Chem 281:1660-1669. Doi:10:1074/jbc.M510251200.
5. Akerboom, J., JDV Rivera, MMR Guilbe, ECA Malave, HH. Hernandez, L. Tian, SA Hires, JS Marvin, LL Looger, and ER Schreiter (2008) Crystal Structures of the GCaMP Calcium Sensor Reveal the Mechanism of Fluorescence Signal Change and Aid Rational Design. J. Biol. Chem. 284:6455-6464. Doi:10:1074/jbc.M807657200.
6. Tewson, P.H., Quinn, A.M., and Hughes, T.E. (2013). A Multiplexed Fluorescent Assay for Independent Second-Messenger Systems: Decoding GPCR Activation in Living Cells. Journal of Biomolecular Screening. DOI: 10.1177/1087057113485427
7. Zhao Y, Araki S, Wu J, Teramoto T, Chang YF, et al.. (2011) An Expanded Palette of Genetically Encoded Ca2+ Indicators. Science. doi:10.1126/science.1208592
Funding
This work was in part funded by the NSF. Genetically-encoded sensors for DAG, PIP2 and cAMP developed under NSF SBIR 1248138, NIH SBIRs R43MH096670 and R44NS082222. Montana SBIR Matching Funds (12-50-RC SBIR-006) awarded to Montana Molecular.
8
Application Note Cell Imaging
AN041413_05, Rev. 04/14/13