Embed Size (px)
Citation preview
at SciVerse ScienceDirect
Soil Biology & Biochemistry 47 (2012) 100e105
Contents lists available
Soil Biology & Biochemistry
journal homepage: www.elsevier .com/locate/soi lbio
Litter decomposition in fynbos vegetation, South Africa
Jan Bengtsson a,*, Charlene Janion b, Steven L. Chown b, Hans Petter Leinaas c
aDepartment of Ecology, Swedish University of Agricultural Sciences (SLU), Box 7044, SE 750 07 Uppsala, SwedenbCentre for Invasion Biology, Department of Botany and Zoology, Stellenbosch University, Private Bag X1, Matieland 7602, South Africac Integrative Biology Group, Department of Biology, University of Oslo, PO Box 1066, N-0136 Oslo, Norway
a r t i c l e i n f o
Article history:Received 29 November 2010Received in revised form25 November 2011Accepted 26 November 2011Available online 16 December 2011
Keywords:Litter mass lossLitter qualityNutrient contentProteaEricaRestioGalenia africana
* Corresponding author. Tel.: þ46 18 671516; fax: þE-mail address: [email protected] (J. Beng
0038-0717/$ e see front matter � 2011 Elsevier Ltd.doi:10.1016/j.soilbio.2011.11.023
a b s t r a c t
The Western Cape of South Africa is characterized by the hyperdiverse vegetation of the Fynbos biome.Typical fynbos vegetation is a fire-adapted sclerophyllous Mediterranean-type ecosystem on poor, sandyor stony soils. It is characterized by plants with low nutrient content producing slowly decomposinglitter. Fire is recognized as a major factor for carbon and nutrient cycling in this vegetation type. However,knowledge of biological decomposition processes in this biome is limited. We used litter-bags to measuremass loss and changes in chemical composition in litter from three species representing characteristictaxa in fynbos, a Protea exima hybrid, Erica multumbellifera, and Restio multiflorus, during approximately180 days. In addition, we used a standard litter of a species with high nutrient content, Galenia africana,and a mixture of Protea and Erica. We compare our results with a previous study from renosterveldincluding the geophyteWatsonia borbonica, which occurs in both vegetation types and occurs commonlyin the study area. We found that decomposition rate among the true fynbos plant species P. exima,E. multumbellifera, R. multiflorus and W. borbonica varied almost eight-fold. Litter decomposition wasstrongly correlated to litter stoichiometry, i.e. C/N and C/P-ratios. Most litters accumulated one or severalnutrients during the study period. The mixture of litters decomposed faster than expected from theresults of each litter separately. Our study indicates that biological decomposition may be moreimportant for carbon and nutrient cycling in fynbos than previously thought. These results are inaccordance with recent studies showing large variation in plant litter quality within vegetation types andbiomes. Such large variation in litter quality and decomposition rate suggests that some generalisationsabout ecosystem processes in the fynbos may need reevaluation.
� 2011 Elsevier Ltd. All rights reserved.
1. Introduction
Decomposition of plant litter is affected by variation in thesubstrate quality of litter, environmental conditions, and thecomposition of decomposer communities (Parton et al., 2007; Oslerand Sommerkorn, 2007; Cornwell et al., 2008; Jonsson andWardle,2008; Carrillo et al., 2011). In contrast to what has previously beenthought, recent studies have shown that decomposition ratesappear to be more strongly affected by plant quality than by vari-ation caused by environmental factors. Cornwell et al. (2008) founda 10.5-fold average difference in species decomposition rateswithin climate zones, which is twice as large as the variation indecomposition rate of common substrates attributable to differentclimate conditions. Large variation in leaf litter quality or decom-position among plant taxa has also been found locally within
46 18 672890.tsson).
All rights reserved.
vegetation types and climate zones (e.g. Hättenschwiler et al.,2008; Kazakou et al., 2009; Wardle et al., 2009; Bengtsson et al.,2011). This variation in decomposition rates among plant specieshas been attributed to variation in ecological traits, such as leafnutrient composition, associated with different plant strategies andphylogenetic groups (Cornwell et al., 2008). The dominant role ofplant leaf and litter traits implies that previous generalisationsabout decomposition processes may need reevaluation in a varietyof vegetation types and climatic regions.
The Western Cape of South Africa is characterized by the hyper-diverse vegetation of the Fynbos biome (Cowling and Lombard,2002; Linder, 2003; Mucina and Rutherford, 2006). Typical fynbosvegetation is fire-adapted, sclerophyllous and occurs on poor, sandyor stony soils (Mucina and Rutherford, 2006). It is characterized byProteaceae and Ericaceae shrubs, and the reed-like Restionaceae, butit also contains a diversityof geophytes, and in drier areas short-livedannuals (Manning, 2007). Several other vegetation types are found inthe Fynbos biome, one of which is the renosterveld, which occurs onricher soils and is also fire-prone (Rebelo et al., 2006). In a previous
J. Bengtsson et al. / Soil Biology & Biochemistry 47 (2012) 100e105 101
study, we found a 20-fold difference in decomposition rate betweenthree representative plant species from renosterveld (Bengtssonet al., 2011). Here we extend these results to the true fynbos vege-tation. Biological decomposition of typical fynbos plant species haspreviously been suggested to be very low, and carbon and nutrientdynamics dependent upon the periodic fires characteristic of fynbos(Mitchell et al., 1986; Witkowski, 1991; Stock and Allsopp, 1992).However, the considerable diversity of plant species and functionaltypeswithin a given area of fynbos (e.g. Cowling et al.,1997; Cowlingand Lombard, 2002) suggests that plant litter quality and hencebiological decomposition may vary between functional types ofplants within sites, in a way similar to that found in renosterveld(Bengtsson et al., 2011). As a consequence, biological decompositionby soil fauna and microbial communities may have been under-estimated and deserve more attention. For example, nutrient turn-over of plant litter with higher nutrient content may be much fasterand less dependent on fire than is the case for the previously studiednutrient-poor species in the Proteaceae and Restionaceae (e.g.Mitchell et al., 1986; Mitchell and Coley, 1987; Witkowski, 1991).
In this paper, we examine whether species-specific differencesin first-year decomposition rates of three representatives of majorfynbos taxa, as measured by organic matter mass loss, are related totheir nutrient content (carbon-to-nutrient ratios), as an indicator ofplant litter quality. The species we studied represent the naturalrange of litter nutrient content and life forms in this biome (seebelow and vanWilgen and le Maitre, 1981; Mucina and Rutherford,2006). We also investigate changes in nutrient content of thedifferent plant litters during decomposition, and whether litterfrom different plant species decomposes faster when placed invegetation dominated by their own functional type rather thanvegetation dominated by another functional type, i.e. if a home fieldadvantage (Ayres et al., 2009) exists. We compare these results witha standard litter used previously (Galenia africana) in our investi-gations of decomposition in renosterveld (Bengtsson et al., 2011).Finally, because plant litter seldomly occurs as a monoculture in thediverse fynbos vegetation, we determine whether a mixture oflitters from two characteristic fynbos taxa with different qualitydecomposes at rates different to those expected from the singlespecies litters. Increased decomposition would be expected if, forexample, nutrients such as nitrogen from the more nutrient-richlitter is used by decomposers utilizing the nutrient-poor litter(e.g. Gartner and Cardon, 2004).
2. Materials and methods
2.1. Study site, plant species and sampling methods
The study was carried out from mid-March to mid-September2008, during the South African winter, using methods describedin detail in Bengtsson et al. (2011). This part of South Africa hasa Mediterranean climate with cool, wet winters and hot, drysummers. While studying springtail (Collembola) abundance anddiversity, we also recorded mass loss and changes in chemicalcomposition of litter of four plant species placed in litter-bags.Three of the species represented three major components of thefynbos vegetation type in the Western Cape, South Africa, viz. Eri-caceae, Proteaceae and Restionaceae. In addition we used a shrubspecies characteristic of disturbed areas, G. africana, and a littermixture of the Ericaceae and Proteaceae species.
The four plant species used were: (1) The hybrid Proteaexima � Protea susannae, var. ‘silva’ and ‘cardinal’; (2) Erica mul-tumbellifera. For conservation reasons, as the study was carried outin a nature reserve, and to obtain litter of standard quality, E.multumbellifera was collected from Heuningkloof farm in Klein-mond, while the Protea was obtained from Flower Valley Farm,
Gansbaai. The plants from which we derived the litter may havereceived some fertilizer in a previous growing season, although noclear information on this was available; (3) Restio multiflorus, whichwas collected from a field site on Whitewater Lodge estate close toStanford; (4) G. africana (Aizoaceae), which is a common shrub inthe Western Cape, and an indicator of disturbance such as over-grazing (Allsopp, 1999; Todd and Hoffmann, 1999). It is toxic tosheep and goats (Van der Lugt et al., 1992; Vries et al., 2005) and hasbeen argued to enrich soils under its canopy with nitrogen andphosphorus (Allsopp,1999; Simons and Allsopp, 2007). This specieswas collected from an overgrazed rangeland west of the Paarlmountain. G. africana is usually not found in true fynbos, but weused it for two reasons: First, wewanted to have a standard litter tobe able to compare decomposition across sites and between years,and second because we wanted to include a nutrient-rich litter inthe fynbos study, in a similar way as done previously in renos-terveld (Bengtsson et al., 2011). All litters were obtained from liveplants at the end of the dry season, and hence partly senescent; forpractical reasons it was not possible to gather litter by litterfalltraps over an extended period.
The study site consisted of three plots in the Jonkershoek NatureReserve close to Stellenbosch, South Africa (S33� 58.8090, E18�
56.8620). All plots were situated in natural fynbos vegetation, but indifferent vegetation types, viz. proteoid, ericoid or restioid,respectively. The proteoid plot was dominated by Protea nitida, theericoid by Erica hirta, and the restioid plot by Elegia capensis. In eachplot we selected 10 shrubs or tufts along an L-shaped transect withapproximately 10 m between each shrub. Under each shrub (tuft) 5litter-bag traps filled with different litters were placed e four withsingle species and one with the mixture. The traps were placed inthe soil with the top of the trap at ground level, within 3e4 cm fromeach other and less than 40 cm from the shrub base on thesouth-west to south-east side to minimise sun exposure.
The litter-bags were individually numbered cylindrical plasticcontainerswith a height of 4 cmand a diameter of 7.5 cm (Bengtssonet al., 2011). The bottom consisted of a steel net with mesh size0.5 mm. The traps had a removable lid with 1.6 mm mesh size toallow animals to enter the trap. In the laboratory they were filledwith well-mixed air-dried litter up to approx. 3.5 cm, which hadbeen weighed to nearest 0.1 mg on an electronic balance (FA304T,Avery Berkel, Fairmont, USA). The litter was not compressed andwas allowed to maintain its normal volume and density.
The litter-bag traps were placed in the field on 10 March 2008andwere collected on 8 or 17 September 2008, i.e. after 182 and 191days respectively. Trap sets 1e5 from each of the sites weresampled on the first date, and sets 6e10 on the second date. Thiswas done for extraction capacity reasons, because soil fauna wasalso collected. The traps were brought into the laboratory andtreated as in Bengtsson et al. (2011). Total C and N concentrationswere determined using a Carlo-Erba NA 1500 Elemental Analyzer,while P, K, Na, Mg and Ca were measured by Inductively CoupledPlasma Atomic Spectroscopy (see Bengtsson et al., 2011). Twosamples were accidentally mislabelled during the chemical anal-yses and therefore excluded from the data set.
2.2. Statistics
We measured mass loss as the loss of organic matter from eachlitter-bag. Mass loss was determined using ash free dry weightmeasurements. To compare our results with other studies, we alsocalculated the decomposition constant k assuming the exponentialdecomposition model (Olson, 1963), i.e. Wt ¼ W0 e�kt, where W0 isthe mass of organic matter at the start of the experiment and Wt isthe mass of organic matter at the end (t ¼ 182 or 191 days). Theconstant k has unit day�1 and was calculated for each litter-bag.
J. Bengtsson et al. / Soil Biology & Biochemistry 47 (2012) 100e105102
Carbon-to-nutrient ratios were calculated on a weight basis usingthe data from the chemical analyses. All variables were square-root-transformed before statistical analysis.
The data were analysed with a split-plot analysis of variance,with Vegetation Type (Proteoid, Ericaceaous or Restioid) as wholeplots, with the error term Vegetation Type*Shrub ID, and LitterType (5 levels) as the split-plot factor with the residual as errorterm. The interaction between Litter Type and Vegetation Type wasincluded in all models, with the residual as error term. Theapproximately balanced design of the present study (n¼ 29 or 30 inall litter treatments) means that the split-plot model gives essen-tially the same results as a mixed model (GLMM). The analyseswere undertaken with the SuperAnova program for Macintosh(Abacus inc., 1918 Bonita Ave. Berkeley, CA). To examine relation-ships between mass loss and C/nutrient ratios in the original litter,we used Microsoft Excel spreadsheet functions.
2.3. Analysis of decomposition of mixed vs. single species litter
To determine whether mixed ProteaeErica litter had highermass loss than expected from the mass loss from the two singlelitters, we employed a randomization test using Microsoft Excelspreadsheets. The procedure assumed that there was no effect ofvegetation type on decomposition, an assumption that is fulfilled inour case (Table 2a). From the 29 single litter litter-bags of eachspecies we randomly chose 29 combinations of mass loss values,and calculated the expected mass loss in the mixed litter-bagsbased on the average initial proportion of Erica litter in the mixedlitter-bags, which was 55.7%. From these values we calculated theexpected mean mass loss and its standard deviation. The expectedand the observed mass loss in mixed litter-bags was comparedusing a t-test with df¼ 2*(29� 1)¼ 56 and t0.05,56¼ 2.01 (followingSokal and Rohlf, 1991). It was noted if the difference between ex-pected and observed mass loss was significant at the p ¼ 0.05 level.This procedurewas repeated 100 times, each timewith a new set ofrandomly selected combinations of single litters, and the propor-tion of significant t-tests was used as an indicator whether massloss was higher from mixed litters than expected from singlespecies litter-bags. In our case, there were no instances when thet-test was non-significant, so we stopped the randomization testafter 100 iterations.
3. Results
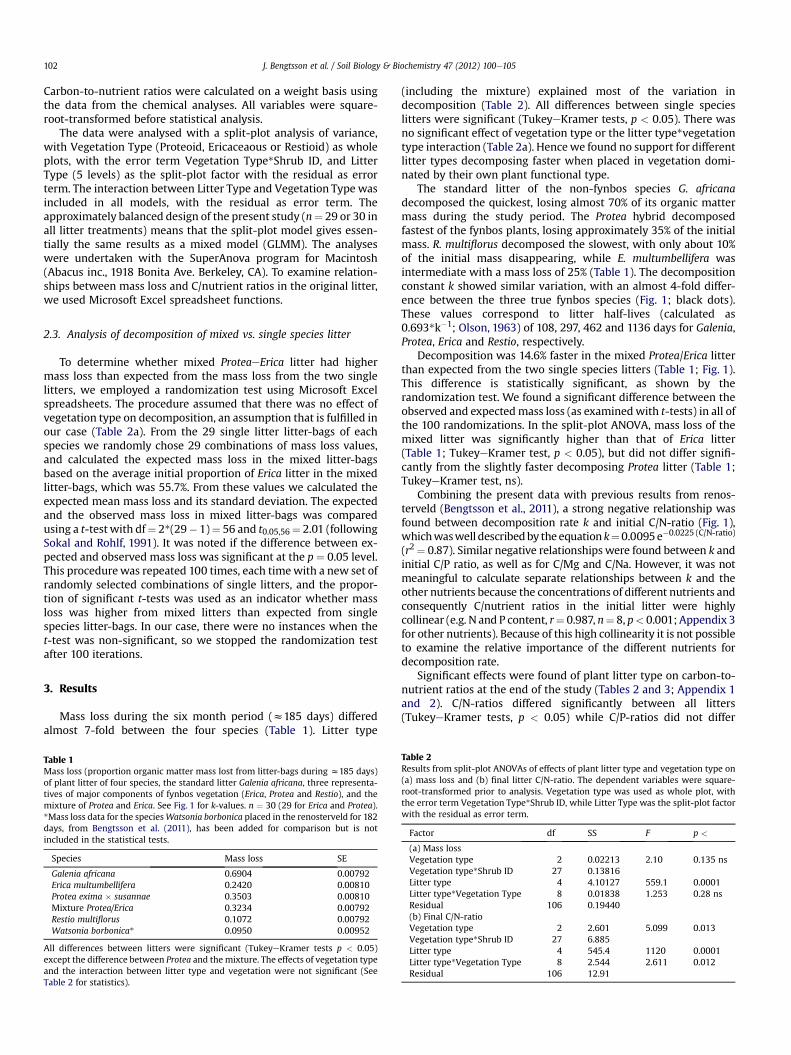
Mass loss during the six month period (z185 days) differedalmost 7-fold between the four species (Table 1). Litter type
Table 1Mass loss (proportion organic matter mass lost from litter-bags during z185 days)of plant litter of four species, the standard litter Galenia africana, three representa-tives of major components of fynbos vegetation (Erica, Protea and Restio), and themixture of Protea and Erica. See Fig. 1 for k-values. n ¼ 30 (29 for Erica and Protea).*Mass loss data for the speciesWatsonia borbonica placed in the renosterveld for 182days, from Bengtsson et al. (2011), has been added for comparison but is notincluded in the statistical tests.
Species Mass loss SE
Galenia africana 0.6904 0.00792Erica multumbellifera 0.2420 0.00810Protea exima � susannae 0.3503 0.00810Mixture Protea/Erica 0.3234 0.00792Restio multiflorus 0.1072 0.00792Watsonia borbonica* 0.0950 0.00952
All differences between litters were significant (TukeyeKramer tests p < 0.05)except the difference between Protea and the mixture. The effects of vegetation typeand the interaction between litter type and vegetation were not significant (SeeTable 2 for statistics).
(including the mixture) explained most of the variation indecomposition (Table 2). All differences between single specieslitters were significant (TukeyeKramer tests, p < 0.05). There wasno significant effect of vegetation type or the litter type*vegetationtype interaction (Table 2a). Hencewe found no support for differentlitter types decomposing faster when placed in vegetation domi-nated by their own plant functional type.
The standard litter of the non-fynbos species G. africanadecomposed the quickest, losing almost 70% of its organic mattermass during the study period. The Protea hybrid decomposedfastest of the fynbos plants, losing approximately 35% of the initialmass. R. multiflorus decomposed the slowest, with only about 10%of the initial mass disappearing, while E. multumbellifera wasintermediate with a mass loss of 25% (Table 1). The decompositionconstant k showed similar variation, with an almost 4-fold differ-ence between the three true fynbos species (Fig. 1; black dots).These values correspond to litter half-lives (calculated as0.693*k�1; Olson, 1963) of 108, 297, 462 and 1136 days for Galenia,Protea, Erica and Restio, respectively.
Decomposition was 14.6% faster in the mixed Protea/Erica litterthan expected from the two single species litters (Table 1; Fig. 1).This difference is statistically significant, as shown by therandomization test. We found a significant difference between theobserved and expectedmass loss (as examinedwith t-tests) in all ofthe 100 randomizations. In the split-plot ANOVA, mass loss of themixed litter was significantly higher than that of Erica litter(Table 1; TukeyeKramer test, p < 0.05), but did not differ signifi-cantly from the slightly faster decomposing Protea litter (Table 1;TukeyeKramer test, ns).
Combining the present data with previous results from renos-terveld (Bengtsson et al., 2011), a strong negative relationship wasfound between decomposition rate k and initial C/N-ratio (Fig. 1),whichwaswell describedby the equation k¼0.0095e�0.0225 (C/N-ratio)
(r2¼ 0.87). Similar negative relationships were found between k andinitial C/P ratio, as well as for C/Mg and C/Na. However, it was notmeaningful to calculate separate relationships between k and theother nutrients because the concentrations of different nutrients andconsequently C/nutrient ratios in the initial litter were highlycollinear (e.g. N and P content, r¼ 0.987, n¼ 8, p< 0.001; Appendix 3for other nutrients). Because of this high collinearity it is not possibleto examine the relative importance of the different nutrients fordecomposition rate.
Significant effects were found of plant litter type on carbon-to-nutrient ratios at the end of the study (Tables 2 and 3; Appendix 1and 2). C/N-ratios differed significantly between all litters(TukeyeKramer tests, p < 0.05) while C/P-ratios did not differ
Table 2Results from split-plot ANOVAs of effects of plant litter type and vegetation type on(a) mass loss and (b) final litter C/N-ratio. The dependent variables were square-root-transformed prior to analysis. Vegetation type was used as whole plot, withthe error term Vegetation Type*Shrub ID, while Litter Type was the split-plot factorwith the residual as error term.
Factor df SS F p <
(a) Mass lossVegetation type 2 0.02213 2.10 0.135 nsVegetation type*Shrub ID 27 0.13816Litter type 4 4.10127 559.1 0.0001Litter type*Vegetation Type 8 0.01838 1.253 0.28 nsResidual 106 0.19440(b) Final C/N-ratioVegetation type 2 2.601 5.099 0.013Vegetation type*Shrub ID 27 6.885Litter type 4 545.4 1120 0.0001Litter type*Vegetation Type 8 2.544 2.611 0.012Residual 106 12.91
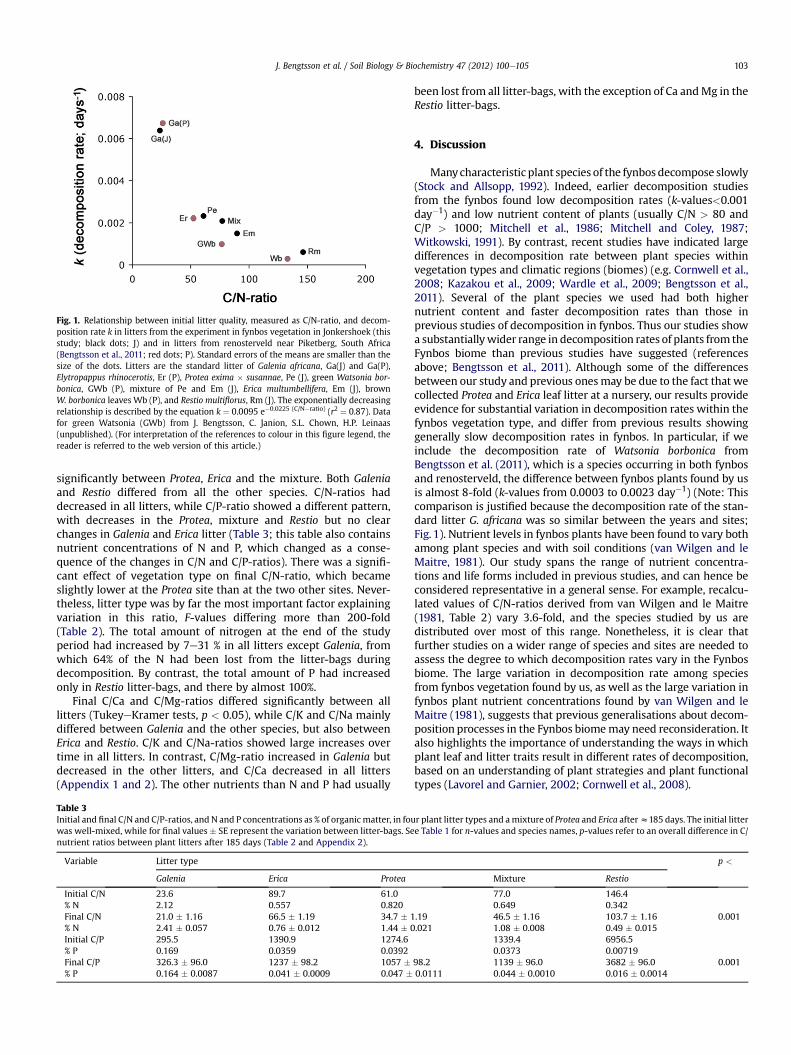
Fig. 1. Relationship between initial litter quality, measured as C/N-ratio, and decom-position rate k in litters from the experiment in fynbos vegetation in Jonkershoek (thisstudy; black dots; J) and in litters from renosterveld near Piketberg, South Africa(Bengtsson et al., 2011; red dots; P). Standard errors of the means are smaller than thesize of the dots. Litters are the standard litter of Galenia africana, Ga(J) and Ga(P),Elytropappus rhinocerotis, Er (P), Protea exima � susannae, Pe (J), green Watsonia bor-bonica, GWb (P), mixture of Pe and Em (J), Erica multumbellifera, Em (J), brownW. borbonica leaves Wb (P), and Restio multiflorus, Rm (J). The exponentially decreasingrelationship is described by the equation k ¼ 0.0095 e�0.0225 (C/N�ratio) (r2 ¼ 0.87). Datafor green Watsonia (GWb) from J. Bengtsson, C. Janion, S.L. Chown, H.P. Leinaas(unpublished). (For interpretation of the references to colour in this figure legend, thereader is referred to the web version of this article.)
J. Bengtsson et al. / Soil Biology & Biochemistry 47 (2012) 100e105 103
significantly between Protea, Erica and the mixture. Both Galeniaand Restio differed from all the other species. C/N-ratios haddecreased in all litters, while C/P-ratio showed a different pattern,with decreases in the Protea, mixture and Restio but no clearchanges in Galenia and Erica litter (Table 3; this table also containsnutrient concentrations of N and P, which changed as a conse-quence of the changes in C/N and C/P-ratios). There was a signifi-cant effect of vegetation type on final C/N-ratio, which becameslightly lower at the Protea site than at the two other sites. Never-theless, litter type was by far the most important factor explainingvariation in this ratio, F-values differing more than 200-fold(Table 2). The total amount of nitrogen at the end of the studyperiod had increased by 7e31 % in all litters except Galenia, fromwhich 64% of the N had been lost from the litter-bags duringdecomposition. By contrast, the total amount of P had increasedonly in Restio litter-bags, and there by almost 100%.
Final C/Ca and C/Mg-ratios differed significantly between alllitters (TukeyeKramer tests, p < 0.05), while C/K and C/Na mainlydiffered between Galenia and the other species, but also betweenErica and Restio. C/K and C/Na-ratios showed large increases overtime in all litters. In contrast, C/Mg-ratio increased in Galenia butdecreased in the other litters, and C/Ca decreased in all litters(Appendix 1 and 2). The other nutrients than N and P had usually
Table 3Initial and final C/N and C/P-ratios, and N and P concentrations as % of organicmatter, in fouwas well-mixed, while for final values � SE represent the variation between litter-bags. Senutrient ratios between plant litters after 185 days (Table 2 and Appendix 2).
Variable Litter type
Galenia Erica Protea
Initial C/N 23.6 89.7 61.0% N 2.12 0.557 0.820Final C/N 21.0 � 1.16 66.5 � 1.19 34.7 � 1% N 2.41 � 0.057 0.76 � 0.012 1.44 � 0Initial C/P 295.5 1390.9 1274.6% P 0.169 0.0359 0.0392Final C/P 326.3 � 96.0 1237 � 98.2 1057 �% P 0.164 � 0.0087 0.041 � 0.0009 0.047 �
been lost from all litter-bags, with the exception of Ca andMg in theRestio litter-bags.
4. Discussion
Manycharacteristic plant species of the fynbos decompose slowly(Stock and Allsopp, 1992). Indeed, earlier decomposition studiesfrom the fynbos found low decomposition rates (k-values<0.001day�1) and low nutrient content of plants (usually C/N > 80 andC/P > 1000; Mitchell et al., 1986; Mitchell and Coley, 1987;Witkowski, 1991). By contrast, recent studies have indicated largedifferences in decomposition rate between plant species withinvegetation types and climatic regions (biomes) (e.g. Cornwell et al.,2008; Kazakou et al., 2009; Wardle et al., 2009; Bengtsson et al.,2011). Several of the plant species we used had both highernutrient content and faster decomposition rates than those inprevious studies of decomposition in fynbos. Thus our studies showa substantiallywider range in decomposition rates of plants from theFynbos biome than previous studies have suggested (referencesabove; Bengtsson et al., 2011). Although some of the differencesbetween our study and previous onesmay be due to the fact that wecollected Protea and Erica leaf litter at a nursery, our results provideevidence for substantial variation in decomposition rates within thefynbos vegetation type, and differ from previous results showinggenerally slow decomposition rates in fynbos. In particular, if weinclude the decomposition rate of Watsonia borbonica fromBengtsson et al. (2011), which is a species occurring in both fynbosand renosterveld, the difference between fynbos plants found by usis almost 8-fold (k-values from 0.0003 to 0.0023 day�1) (Note: Thiscomparison is justified because the decomposition rate of the stan-dard litter G. africana was so similar between the years and sites;Fig. 1). Nutrient levels in fynbos plants have been found to vary bothamong plant species and with soil conditions (van Wilgen and leMaitre, 1981). Our study spans the range of nutrient concentra-tions and life forms included in previous studies, and can hence beconsidered representative in a general sense. For example, recalcu-lated values of C/N-ratios derived from van Wilgen and le Maitre(1981, Table 2) vary 3.6-fold, and the species studied by us aredistributed over most of this range. Nonetheless, it is clear thatfurther studies on a wider range of species and sites are needed toassess the degree to which decomposition rates vary in the Fynbosbiome. The large variation in decomposition rate among speciesfrom fynbos vegetation found by us, as well as the large variation infynbos plant nutrient concentrations found by van Wilgen and leMaitre (1981), suggests that previous generalisations about decom-position processes in the Fynbos biomemay need reconsideration. Italso highlights the importance of understanding the ways in whichplant leaf and litter traits result in different rates of decomposition,based on an understanding of plant strategies and plant functionaltypes (Lavorel and Garnier, 2002; Cornwell et al., 2008).
r plant litter types and amixture of Protea and Erica afterz185 days. The initial littere Table 1 for n-values and species names, p-values refer to an overall difference in C/
p <
Mixture Restio
77.0 146.40.649 0.342
.19 46.5 � 1.16 103.7 � 1.16 0.001
.021 1.08 � 0.008 0.49 � 0.0151339.4 6956.50.0373 0.00719
98.2 1139 � 96.0 3682 � 96.0 0.0010.0111 0.044 � 0.0010 0.016 � 0.0014
J. Bengtsson et al. / Soil Biology & Biochemistry 47 (2012) 100e105104
A strong relationship was found here between plant stoichi-ometry, i.e. C/N or C/P-ratio, and decomposition rate during thefirst-year wet season in our combined data (Fig. 1). Whetherdecomposition rates are best related to nutrient concentrations inthe litter, environmental conditions, or the carbon fractions in thelitter has been the subject of much discussion (e.g. Enríquéz et al.,1993; Aerts, 1997; Joffre and Ågren, 2001). The meta-analysis ofCornwell et al. (2008) suggested that litter nutrient content as wellas carbon fractions are important for explaining variation indecomposition rate, and that the role of environmental conditionsrelated to climate may have been overemphasised relative to planttraits. In the fynbos, nutrient limitation of plant growth is perva-sive, although it is unclear which nutrients are most limiting (e.g.Witkowski, 1989; Richards et al., 1997). In any case, until moredetailed studies are carried out it seems reasonable to usea measure of nutrient content, e.g. C/N-ratio, as an indicator ofdecomposition rate in this biome. Hence, the high diversity ofspecies in fynbos may lead to a larger variation of decompositionrates than previously thought.
The mixed litter decomposed faster than expected from thesingle Protea and Erica litters. Although by no means ubiquitous,increased decomposition of litter mixtures has often been observed(Gartner and Cardon, 2004; Chapman and Koch, 2007; Jonsson andWardle, 2008; Wardle et al., 2009); approximately 65% of thestudies reviewed by Gartner and Cardon (2004) found this pattern.One possible mechanism for such an effect is the movement ofnutrients among litters, with the higher quality litter stimulatingthe decomposition of the lower quality one, either by biologicalprocesses or by leaching (Gartner and Cardon, 2004). For example,nitrogen-limited decomposer fungi may use nitrogen from themore nutrient-rich Protea litter when acquiring energy from theErica litter. The observation that mixing of litter may increasedecomposition suggests that interactions between co-occurringlitters may need to be taken into account when examining soilbiological processes in fynbos.
To conclude, our studies from fynbos and renosterveld in theFynbos biome in South Africa found 8- to 20-fold differences,respectively, in first-year decomposition rates between plantspecies representing several important taxa and functional types inthese vegetation types (this study, Bengtsson et al., 2011). Bothvegetation types are fire-prone, with fire intervals of 10e20 years innatural fynbos (on average 11 years; vanWilgen, 2009). Hence firesare clearly important for ecosystem processes in this biome, asshown by previous authors (e.g. Stock and Allsopp, 1992). However,the observed variation in litter quality and decomposition ratesfound in the present study (see also vanWilgen and leMaitre,1981)suggests that biological decomposition may still be important forcarbon and nutrient cycling between fire events. Biologicaldecomposition is especially likely for plants with higher nutrientcontents, such as G. africana, renosterbos Elytropappus rhinocerotisand the Protea species used here, which had litter half-lives of lessthan one year. Biological carbon and nutrient cycling may be mostimportant in the years immediately after fires, when fynbos vege-tation shows many adaptations that result in rapid regrowth andrecovery after fire (e.g. Richardson and van Wilgen, 1992) andnutrient levels in the soil are likely to be higher (Stock and Lewis,1986). Long-term studies examining a larger set of species duringsuccession after fire are needed for a better understanding of therelative roles of fire and biological decomposition as well as otherecosystem processes in this biome.
Acknowledgements
We thank Linnea Berglund for discussing mixed-species litterdecomposition, Birgitta Vegerfors for statistical advice, Suzaan
Kritzinger-Klopper and Anthony Hitchcock for identification of theplant species, Mirijam Gaertner for supplying us with Protea litter,our numerous field assistants, Thomas Grönqvist for chemicalanalyses, Mary-Lou Nash for access to her property to collectGalenia litter, CapeNature for collecting permits, and two reviewersfor their comments. Weather data was supplied by CapeNature andthe Agricultural Research Centre. Funded by a SA-Norway Grant toS.L. Chown/H.P. Leinaas from the Norwegian Research Council anda South Africa-SIDA/VR grant from the Swedish Research Council toS.L. Chown/J. Bengtsson.
Appendix. Supplementary material
Supplementary material associated with this article can befound, in the online version, at doi:10.1016/j.soilbio.2011.11.023.
References
Aerts, R., 1997. Climate, leaf litter chemistry and leaf litter decomposition interrestrial ecosystems: a triangular relationship. Oikos 79, 439e449.
Allsopp, N., 1999. Effects of grazing and cultivation on soil patterns and processes inthe Paulshoek area of Namaqualand. Plant Ecology 142, 179e187.
Ayres, E., Steltzer, H., Simmons, B.L., Simpson, R.T., Steinweg, J.M., Wallenstein, M.D.,Mellor, N., Parton, W.J., Moore, J.C., Wall, D.H., 2009. Home-field advantageaccelerates leaf litter decomposition in forests. Soil Biology andBiochememistry 41, 606e610.
Bengtsson, J., Janion, C., Chown, S.L., Leinaas, H.P., 2011. Variation in decompositionrates in the Fynbos biome, South Africa: the role of plant species and plantstoichiometry. Oecologia 165, 225e235.
Carrillo, Y., Ball, B.A., Bradford, M.A., Jordan, C.F., Molina, M., 2011. Soil fauna alterthe effects of litter composition on nitrogen cycling in a mineral soil. SoilBiology and Biochemistry 43, 1440e1449.
Chapman, S.K., Koch, G.W., 2007. What type of diversity yields synergy duringmixed litter decomposition in a natural forest ecosystem? Plant and Soil 299,153e162.
Cornwell, W.K., Cornelissen, J.H.C., Amatangelo, K., Dorrepaal, E., Eviner, V.T.,Godoy, O., Hobbie, S.H., Hoorens, B., Kurokawa, H., Perez-Harguindeguy, N.,Quested, H.M., Santiago, L.S., Wardle, D.A., Wright, I.J., Aerts, R., Allison, S.D., canBodegom, P., Brovkin, V., Chatain, A., Callaghan, T.V., Diaz, S., Garnier, E.,Gurvich, D.E., Kazakou, E., Klein, J.A., Read, J., Reich, P.B., Soudzilovskaia, N.A.,Vaieretti, M.N., Westoby, M., 2008. Plant species traits are the predominantcontrol on litter decomposition rates within biomes worldwide. Ecology Letters11, 1065e1071.
Cowling, R.M., Lombard, A.T., 2002. Heterogeneity, speciation/extinction history andclimate, explaining regional plant diversity patterns in the Cape FloristicRegion. Diversity and Distributions 8, 163e179.
Cowling, R.M., Richardson, D.M., Muster, P.J., 1997. Fynbos. In: Cowling, R.M.,Richardson, D.M., Pierce, S.M. (Eds.), The Vegetation of Southern Africa.Cambridge University Press, Cambridge, pp. 99e130.
Enríquéz, S., Duarte, C.M., Sand-Jensen, K., 1993. Patterns in decomposition ratesamong photosynthetic organisms: the importance of detritus C:N:P content.Oecologia 94, 457e471.
Gartner, T.B., Cardon, Z.G., 2004. Decomposition dynamics in mixed-species leaflitter. Oikos 104, 230e246.
Hättenschwiler, S., Aeschlimann, B., Coûteaux, M.-M., Roy, J., Bonal, D., 2008. Highvariation in foliage and leaf litter chemistry among 45 tree species ofa neotropical rainforest community. New Phytologist 179, 165e175.
Joffre, R., Ågren, G.I., 2001. From plant to soil: litter production and decomposition.In: Roy, J., Saugier, B., Mooney, H.A. (Eds.), Terrestrial Global Productivity.Academic Press, pp. 83e99.
Jonsson, M., Wardle, D.A., 2008. Context-dependency of litter-mixing effects ondecomposition and nutrient release across a long-term chronosequence. Oikos117, 1674e1682.
Kazakou, E., Violle, C., Roumet, C., Pintor, C., Gimenez, O., Garnier, E., 2009.Litter quality and decomposability of species from a Mediterranean successiondepend on leaf traits but not onnitrogen supply. Annals of Botany 104,1151e1161.
Lavorel, S., Garnier, E., 2002. Predicting changes in community composition andecosystem functioning from plant traits: revisiting the Holy Grail. FunctionalEcology 16, 545e556.
Linder, H.P., 2003. The radiation of the Cape flora, southern Africa. BiologicalReviews 78, 597e638.
Manning, J., 2007. Field Guide to Fynbos. Struik, Cape Town, South Africa.Mitchell, D.T., Coley, P.G.F., 1987. Litter production and decomposition from shrubs
of Protea repens growing in sand plain lowland and mountain fynbos,south-western Cape. South African Journal of Botany 53, 25e31.
Mitchell, D.T., Coley, P.G.F., Webb, S., Allsopp, N., 1986. Litter fall and decompositionprocesses in the coastal fynbos vegetation, south-western Cape, South Africa.Journal of Ecology 74, 977e993.
J. Bengtsson et al. / Soil Biology & Biochemistry 47 (2012) 100e105 105
Mucina, L., Rutherford, M.C. (Eds.), 2006. The Vegetation of South Africa, Lesotho andSwaziland. Strelitzia 19. South African national Biodiversity Institute, Pretoria.
Olson, J.S., 1963. Energy storage and the balance of producers and decomposers inecological systems. Ecology 44, 322e331.
Osler, G.H.R., Sommerkorn, M., 2007. Toward a complete soil C and N cycle:incorporating the soil fauna. Ecology 88, 1611e1621.
Parton, W., Silver, W.L., Burke, I.C., Grassens, L., Harmon, M.E., Currie, W.S., King, J.Y.,Adair, E.C., Brandt, L.A., Hart, S.C., Fasth, B., 2007. Global-scale similarities innitrogen release patterns during long-termdecomposition. Science 315, 361e364.
Rebelo, A.G., Boucher, C., Helme, N., Mucina, L., Rutherford, M.C., 2006. Fynbosbiome. In: Mucina, L., Rutherford, M.C. (Eds.), The Vegetation of South Africa,Lesotho and Swaziland. Strelitzia 19. South African National BiodiversityInstitute, Pretoria, pp. 52e219.
Richards, M.B., Stock, W.D., Cowling, R.M., 1997. Soil nutrient dynamics andcommunity boundaries in the Fynbos vegetation of South Africa. Plant Ecology130, 143e153.
Richardson, D.M., van Wilgen, B.W., 1992. Ecosystem, community and speciesresponse to fire in mountain fynbos: conclusions from the Swartboskloofexperiment. In: Van Wilgen, B.W., Richardson,, D.M., Kruger, F.J.,Hensbergen, H.J. (Eds.), Fire in South African Fynbos. Springer, pp. 273e284.
Simons, L., Allsopp, N., 2007. Rehabilitation of rangelands in Paulshoek,Namaqualand: understanding vegetation change using biophysical manipula-tions. Journal of Arid Environments 70, 755e766.
Sokal, R.R., Rohlf, F.J., 1991. Biometry, second ed. Freeman, New York.Stock, W.D., Allsopp, N., 1992. Functional perspective of ecosystems. In:
Cowling, R.M. (Ed.), The Ecology of Fynbos: Nutrients, Fire and Diversity. OxfordUniversity Press, Cape Town, pp. 241e259.
Stock, W.D., Lewis, O.A.M., 1986. Soil nitrogen and the role of fire as a mineralizingagent in a South African coastal fynbos ecosystem. Journal of Ecology 74,317e328.
Todd, S.W., Hoffmann, M.T., 1999. A fence-line contrast reveals effects of heavygrazing on plant diversity and community composition in Namaqualand, SouthAfrica. Plant Ecology 142, 169e178.
Van der Lugt, J.J., Schultz, R.A., Fourie, N., Hon, L.J., Jordaan, P., Labuschagne, L., 1992.Galenia africana L. poisoning in sheep and goats: hepatic and cardiac changes.Journal of Veterinary Research 59, 323e333.
van Wilgen, B.W., le Maitre, D.C., 1981. Preliminary estimates of nutrient levels infynbos vegetation and the role of fire in nutrient cycling. South African ForestryJournal 119, 24e28.
van Wilgen, B.W., 2009. The evolution of fire and invasive alien plant managementpractices in fynbos. South African Journal of Science 105, 335e342.
Vries, F.A., El Bitar, H., Green, L.R., Klaasen, J.A., Mabulesa, W.T., Bodo, B., Johnson, Q.,2005. An antifungal active extract from the aerial parts of Galenia africana. In:Midiwo, J.O., Yenesew, A., Derese, S. (Eds.), 11th NAPRECA Symposium Book ofProceedings, Antananarivo, Madagascar, 2005. Napreca, Nairobi, Kenya,pp. 123e131. www.napreca.net.
Wardle, D.A., Bardgett, R.A., Walker, L.R., Bonner, K.I., 2009. Among and within plantspecies variation in plant litter decomposition in contrasting long-termchronosequences. Functional Ecology 23, 442e453.
Witkowski, E.T.F., 1989. Effects of nutrient additions on litter production andnutrient return in a nutrient-poor Cape fynbos ecosystem. Plant and Soil 117,227e235.
Witkowski, E.T.F., 1991. Effects of invasive alien acacias on nutrient cycling in thecoastal lowlands of the Cape fynbos. Journal of Applied Ecology 28, 1e15.