Embed Size (px)
Citation preview
THESIS FOR THE DEGREE OF LICENTIATE OFENGINEERING
Lithium ion Battery Aging:Battery Lifetime Testing and Physics-based Modeling for
Electric Vehicle Applications
Evelina Wikner
Division of Electric Power EngineeringDepartment of Electrical Engineering
CHALMERS UNIVERSITY OF TECHNOLOGYGöteborg, Sweden 2017
Lithium ion Battery Aging:Battery Lifetime Testing and Physics-based Modeling forElectric Vehicle Applications
c© Evelina Wikner, 2017.except where otherwise stated.All rights reserved
Department of Electrical EngineeringCHALMERS UNIVERSITY OF TECHNOLOGYSE-412 96 GöteborgSwedenTelephone + 46 (0)31 772 00 00

To my family
iii

iv
Abstract
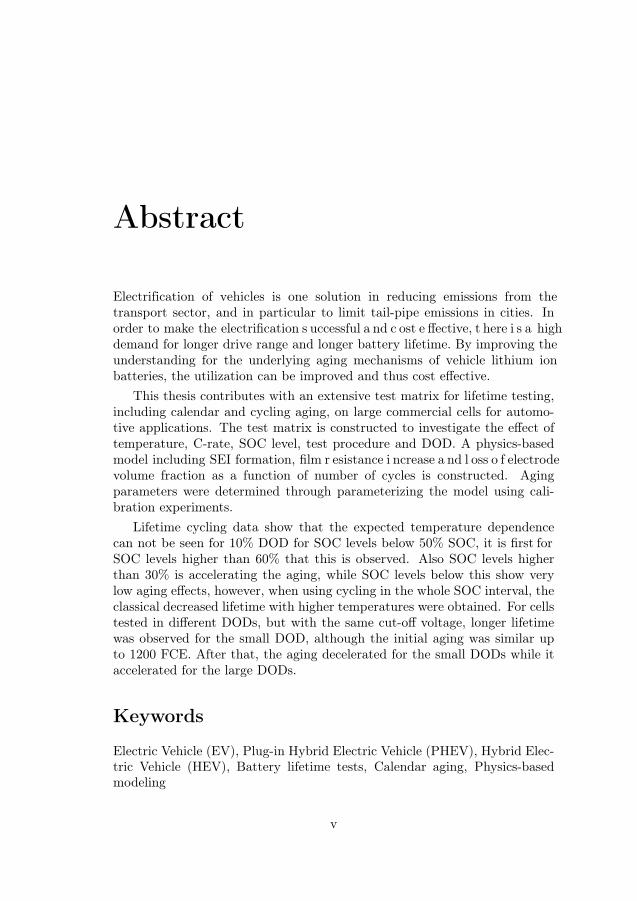
Electrification of vehicles is one solution in reducing emissions from the transport sector, and in particular to limit tail-pipe emissions in cities. In order to make the electrification s uccessful a nd c ost e ffective, t here i s a high demand for longer drive range and longer battery lifetime. By improving the understanding for the underlying aging mechanisms of vehicle lithium ion batteries, the utilization can be improved and thus cost effective.
This thesis contributes with an extensive test matrix for lifetime testing, including calendar and cycling aging, on large commercial cells for automo-tive applications. The test matrix is constructed to investigate the effect of temperature, C-rate, SOC level, test procedure and DOD. A physics-based model including SEI formation, film r esistance i ncrease a nd l oss o f electrode volume fraction as a function of number of cycles is constructed. Aging parameters were determined through parameterizing the model using cali-bration experiments.
Lifetime cycling data show that the expected temperature dependence can not be seen for 10% DOD for SOC levels below 50% SOC, it is first for SOC levels higher than 60% that this is observed. Also SOC levels higher than 30% is accelerating the aging, while SOC levels below this show very low aging effects, however, when using cycling in the whole SOC interval, the classical decreased lifetime with higher temperatures were obtained. For cells tested in different DODs, but with the same cut-off voltage, longer lifetime was observed for the small DOD, although the initial aging was similar up to 1200 FCE. After that, the aging decelerated for the small DODs while it accelerated for the large DODs.
Keywords
Electric Vehicle (EV), Plug-in Hybrid Electric Vehicle (PHEV), Hybrid Elec-tric Vehicle (HEV), Battery lifetime tests, Calendar aging, Physics-based modeling
v

vi

Acknowledgement
I would like to thank my family and friends, for the constant support andencouragement in perusing my goals, this thesis being one of them.
I would especially like to thank my supervisors Prof. Torbjörn Thiringerand Dr. Johan Scheers for there guidance, encouragement and patience.
Also thanks to my colleges at Electric Power Engineering for the openand welcoming working environment, support, and interesting discussions,not always regarding batteries.
Evelina WiknerGöteborg, June 2017
vii

viii
Preface
This thesis is a result of the project Aging mechanisms and how to prolongbattery life in vehicles and stationary applications financed by the SwedishEnergy Agency, all thanks for the financial support through Batterifonden,in collaboration with ABB, Volvo Car Corporation (VCC) and Uppsala Uni-versity (UU). ABB and VCC has provided battery testing facilities and ex-tensive testing performed by Tomas Tegner, Antonis Marinopoulos, LukasMigas and Anneli Jedenmalm at ABB and by Johan Lesser and Michael Ös-trand at VCC. UU has provided expertise in electrochemical systems andof aging mechanisms in batteries through Daniel Brandell and Kristina Ed-ström. Erik Björklund at UU has performed several measurements for properparametrization of the model and kindly provided images of the materials.
ix

x
Contents
Abstract v
Acknowledgement vii
Preface ix
List of Abbreviations xv
List of Symbols xvii
1 Introduction 11.1 Background . . . . . . . . . . . . . . . . . . . . . . . . . . . . 11.2 Previous Work . . . . . . . . . . . . . . . . . . . . . . . . . . 21.3 Purpose of Work . . . . . . . . . . . . . . . . . . . . . . . . . 21.4 Contributions . . . . . . . . . . . . . . . . . . . . . . . . . . . 3
2 Theory 52.1 Lithium Ion Batteries (LIBs) . . . . . . . . . . . . . . . . . . 52.2 Aging Processes . . . . . . . . . . . . . . . . . . . . . . . . . . 8
2.2.1 Calendar and Cycling Aging . . . . . . . . . . . . . . 92.2.2 Anode Aging Mechanisms . . . . . . . . . . . . . . . . 92.2.3 Cathode Aging Mechanisms . . . . . . . . . . . . . . . 11
2.3 Mathematical Formulation ofElectrochemical Processes . . . . . . . . . . . . . . . . . . . . 122.3.1 Mass Transport . . . . . . . . . . . . . . . . . . . . . . 12
3 Experimental Setup 15
xi
3.1 Test Object . . . . . . . . . . . . . . . . . . . . . . . . . . . . 153.1.1 Model Parameters . . . . . . . . . . . . . . . . . . . . 163.1.2 Electrode Materials Potential . . . . . . . . . . . . . . 19
3.2 Cell Aging Tests . . . . . . . . . . . . . . . . . . . . . . . . . 193.2.1 Calendar Tests . . . . . . . . . . . . . . . . . . . . . . 193.2.2 Lifetime Cycling Tests . . . . . . . . . . . . . . . . . . 203.2.3 Test Protocols and Load Cycles . . . . . . . . . . . . . 213.2.4 Control Method for 10% SOC Intervals . . . . . . . . 25
3.3 Characterization Tests . . . . . . . . . . . . . . . . . . . . . . 253.3.1 Reference Performance Test (RPT) . . . . . . . . . . . 253.3.2 Capacity Test . . . . . . . . . . . . . . . . . . . . . . . 253.3.3 Simple RPT . . . . . . . . . . . . . . . . . . . . . . . . 26
3.4 Aging Characterization . . . . . . . . . . . . . . . . . . . . . . 263.4.1 Incremental Capacity Analysis (ICA) . . . . . . . . . 263.4.2 Resistance Characterization . . . . . . . . . . . . . . . 30
4 Battery Modeling 334.1 Aging Mechanisms and Simulation Challenges . . . . . . . . . 334.2 Electrochemical Model . . . . . . . . . . . . . . . . . . . . . . 35
4.2.1 Mass Transport in the Electrolyte . . . . . . . . . . . 354.2.2 Potential and Current Coupling . . . . . . . . . . . . . 364.2.3 Electrochemical Reactions . . . . . . . . . . . . . . . . 374.2.4 Double Layer Capacitance . . . . . . . . . . . . . . . . 374.2.5 Mass Transport in the Electrode Materials . . . . . . 384.2.6 Aging Through SEI Growth . . . . . . . . . . . . . . . 38
4.3 Model Validation . . . . . . . . . . . . . . . . . . . . . . . . . 404.3.1 Parameter Estimation . . . . . . . . . . . . . . . . . . 404.3.2 Calibration using Experimental data . . . . . . . . . . 414.3.3 Active Material Loss . . . . . . . . . . . . . . . . . . . 42
4.4 Aging Simulation Results . . . . . . . . . . . . . . . . . . . . 454.4.1 Consequences of SEI Build up . . . . . . . . . . . . . . 454.4.2 Contribution of Aging Mechanisms . . . . . . . . . . . 46
5 Battery Aging 495.1 Lifetime Aging Tests . . . . . . . . . . . . . . . . . . . . . . . 49
xii
5.2 Temperature Dependence . . . . . . . . . . . . . . . . . . . . 505.2.1 Calendar Aging . . . . . . . . . . . . . . . . . . . . . . 505.2.2 Cycling Aging . . . . . . . . . . . . . . . . . . . . . . . 515.2.3 Current Rate . . . . . . . . . . . . . . . . . . . . . . . 535.2.4 Drive Cycle vs. Constant Current . . . . . . . . . . . 55
5.3 Aging Dependence of SOC . . . . . . . . . . . . . . . . . . . . 585.3.1 Aging in Small SOC Intervals . . . . . . . . . . . . . . 585.3.2 Effect of high SOC . . . . . . . . . . . . . . . . . . . . 605.3.3 Effect of DOD . . . . . . . . . . . . . . . . . . . . . . 61
5.4 ICA on Aged Cells . . . . . . . . . . . . . . . . . . . . . . . . 625.4.1 Effect of Temperature Aging . . . . . . . . . . . . . . 625.4.2 Effect of SOC Interval . . . . . . . . . . . . . . . . . . 645.4.3 Effect of Fast Charging . . . . . . . . . . . . . . . . . 66
6 Conclusions 67
7 Future Work 69
References 71
xiii

xiv
List of Abbreviations
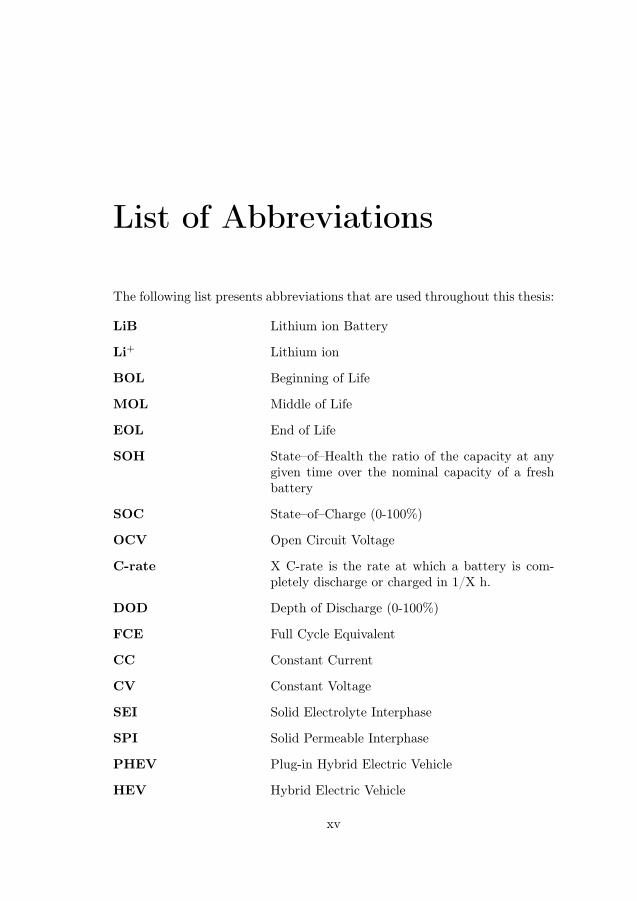
The following list presents abbreviations that are used throughout this thesis:
LiB Lithium ion Battery
Li+ Lithium ion
BOL Beginning of Life
MOL Middle of Life
EOL End of Life
SOH State–of–Health the ratio of the capacity at anygiven time over the nominal capacity of a freshbattery
SOC State–of–Charge (0-100%)
OCV Open Circuit Voltage
C-rate X C-rate is the rate at which a battery is com-pletely discharge or charged in 1/X h.
DOD Depth of Discharge (0-100%)
FCE Full Cycle Equivalent
CC Constant Current
CV Constant Voltage
SEI Solid Electrolyte Interphase
SPI Solid Permeable Interphase
PHEV Plug-in Hybrid Electric Vehicle
HEV Hybrid Electric Vehicle
xv
EV Electric Vehicle
OEM Original Equipment Manufacturer
NMC Lithium Nickel Manganese Cobalt oxide
LMO Lithium Manganese Oxide
MO Metal Oxide
EC Ethylene Carbonate
DMC Dimethyl Carbonate
DEC Diethyl Carbonate
EMC Ethylmethyl Carbonate
cc Current Collector
RPT Reference Performance Test
ICA Incremental Capacity Analysis
es Electronic State
xvi
List of Symbols
subscript s/l Solid/liquid material
subscript +/− Li+/PF−6
subscript a/c Anodic/Cathodic reaction
a+ Activity
c Concentration
csolv Solvent concentration
cT Total concentration
Cdl Double layer capacitance
dSEI SEI thickness
D Diffusivity
Eeq Equilibrium potential
f± Salt activity coefficient
F Faradays constant
i Current density
k Reaction rate
K Friction coefficient
L Length
M Molar mass
n Number of electrons
xvii
N Molar flux
rp Particle radius
R Gas constant
Rfilm Film resistance [Ω/m2]
Sa Specific surface area
t+ Transport number for Li+
T Temperature
u Ionic mobility
v Fluid velocity
Vm Partial molar volume
z Ionic charge
Qcell Battery capacity
Qa/c Amount of active host material
α Reaction rate coefficient
β Bruggeman Coefficient
ε Volume fraction
η Activation over potential
νreactions Reaction product, moles
ν+/− Number of cations and anions formed when 1 molelectrolyte dissolves
σ Conductivity of solid material
κ Conductivity of electrolyte
µ Electrochemical potential
φ Electric potential
∆φfilm Voltage drop over resistive film
xviii
Chapter 1
Introduction
1.1 Background
Electrification of vehicles is seen as one of the key solutions in reducing emis-sions from the transport sector. In particular, the tail-pipe emissions can bereduced, which is very important in some large cities. Today the transportsector is one contributor to air pollution in cities and is responsible for almosta quarter of the total greenhouse gas emissions in Europe [1]. By the endof 2016 there were 28113 electrified vehicles registered in Sweden, 33% pureelectric vehicles (EV) and 67% plug-in hybrid electric vehicles (PHEV). Theprognosis for the end of 2017 is 48000 vehicles [2].
The by far most common solution for EVs is to use lithium ion batteries(LiBs) for the on board energy storage. As the market for EV, hybrid elec-tric vehicle (HEV) and PHEV is increasing, the demand for longer drivingrange and lifetime requirement calls for further development, utilization andunderstanding of the LiBs.
The battery is an expensive component in the vehicle through betterunderstanding of the aging, the usage of the battery in the vehicle can beoptimized. An improved understanding could lead to a better estimate of thestate of health (SOH) of the battery in the vehicle. Today the warranty timefor the battery in EV’s varies for different models and manufacturers and isaround 8 years or 100 000 miles with 70% capacity degradation [3]. A betterunderstanding for what current and power limits to use for the battery couldhelp prolonging the lifetime, and thereby the warranty time. Physics-basedmodels can be used to improve the understanding for the effect of differentusage cases in connection to different aging mechanisms.
The development of physics-based models will require correlation to life-
1
time testing. The lifetime cycling is time consuming and costly. Improvingthe test methods used for lifetime cycling is therefore also needed.
1.2 Previous Work
The LiBs are continuously developed and improved, for each new batterychemistry extensive tests have to be performed to be able to estimate theaging during operation. Several empirical [4–6], semi-empirical [7–9] and cir-cuit models [10] have been presented over the years. Very interesting from [4]is the indications of the effects of Stat of Charge (SOC) level used, althoughthis study was done for LiPO4. The downside of these models is that theyare parameterized from extensive test matrices. This is an expensive andtime consuming task. These models can not simply be coupled to the elec-trochemical processes occurring in the battery during its lifetime.
To better understand the battery, physics-based models are used to de-scribe the underlying electrochemical processes [8,11–14]. These models cancapture and improve the understanding for the underlying aging mechanismbetter than the empirical and semi-empirical models. The physics-basedmodels, though, needs mathematical descriptions for the aging mechanisms,for which some have not yet been derived.
There are some different approaches described in the literature on howto simulate capacity fade in batteries. The most common is to simulateparasitic side reactions inducing a resistive film growth and capacity fade dueto the resistance increase and loss of lithium ions (Li+) [8, 11, 12, 15]. Otherapproaches include that of Spotnitz et al. [16] who developed polynomialexpressions from an empirical study, estimating the irreversible and reversibleLi+ loss. There are, however, many more aging mechanisms occurring in thebattery during use.
There is a lack of published literature on physics-based modeling linkedto cycling aging of large commercial cells. The need for lifetime testing incorrelation with physics-based models is a key factor in further developingthe understanding for the aging mechanisms. To correlate different agingmechanisms to the battery usage, and use this to better utilize the batteryin specific applications.
1.3 Purpose of Work
The purpose of this work is to deepen the understanding of aging phenom-ena in LiBs. A physics-based aging model is built for a commercial LiB ofpouch type. The model describes three linked aging mechanisms using elec-
2
trochemical equations in combination with experimental aging studies. Anaging model capturing the different aging mechanisms can reduce the re-quired test matrix needed for battery characterization. It will also provide abetter understanding of the limits in the utilization of the battery for differ-ent applications. The aging mechanisms described in this model is capacityfade and resistance increase from side reactions similar to previous work [15].In the model, the side reactions give rise to loss of recyclable Li+ and contin-uous growth of a resistive film on the anode particles. The film growth alsoreduces the volume fraction of electrolyte in the porous anode.
1.4 Contributions
The contributions made in this thesis are the following:
• The aging consequences for cells tested in 10% intervals of SOC, werequantified at three different temperatures and showed that:
– SOC intervals lower than 30% can improve cycling lifetime 3x theexpected full cycle equivalent (FCE) lifetime.
– There is a large difference in aging between the different SOC in-tervals; Low SOC intervals will not reach end of life (EOL) withinthis project time, while higher SOC (≥50%) reached EOL afterapproximately 3000 FCE.
– The importance of temperature for 10% SOC intervals has provento be small for intervals ≤50% SOC in contrast to large depthof discharge (DOD). The results presented here show that a tem-perature of close to 40C is more beneficial compared to a lowertemperature of 30C.
– For SOC intervals above 50% SOC, increasing aging with increas-ing temperature is observed first above 40C.
• The effect of Coulomb counting without an upper cutoff voltage limithas been experimentally demonstrated to increase the aging in compar-ison to constant voltage (CV) charging using an upper cutoff voltagelimit.
• The life expectancy for large DOD are confirmed to be shorter in com-parison to small DOD, 10% DOD can give more than 2 times longerlifetime. The highest allowed voltage shows to hold a strong correlationto the lifetime where lower SOC levels can prolong the lifetime morethan 6 times.
3
• An electrochemically based aging model was set up for lifetime pre-diction including loss of recyclable Li+, resistive film growth, and lossof electrolyte volume in the electrode and base functionalities demon-strated.
• Diffusion coefficient for the mixed cathode material, Lithium NickelManganese Cobalt Oxide (NMC)/ Lithium Manganese Oxide (LMO),was estimated for the electrochemically based model from voltage andcurrent measurements on a commercial cell.
4
Chapter 2
Theory
2.1 Lithium Ion Batteries (LIBs)
LIBs are built up from a number of electrochemical cells. These electro-chemical cells can store or release energy through electrochemical reactions,faradaic processes. An electrochemical cell is composed of an anode, a cath-ode and between them an electrically insulating, but ionically conductingelectrolyte enabling ions to move through the cell. There is also a rigidseparator, often a polymer, between the anode and cathode to contain theelectrolyte and prevent short circuit. Li+ and other Li based batteries havethe highest energy densities, of all existing rechargeable batteries [17].
The electrodes can be of metallic or insertion type. In this thesis onlythe insertion type electrodes, which are most common for all LiB, are invesit-gated. The insertion electrodes have porous structures with large surfaceareas where the transfer of electrons (redox reactions) between ion and elec-trode material can occur. The electrodes function as hosts for Li+ [18].
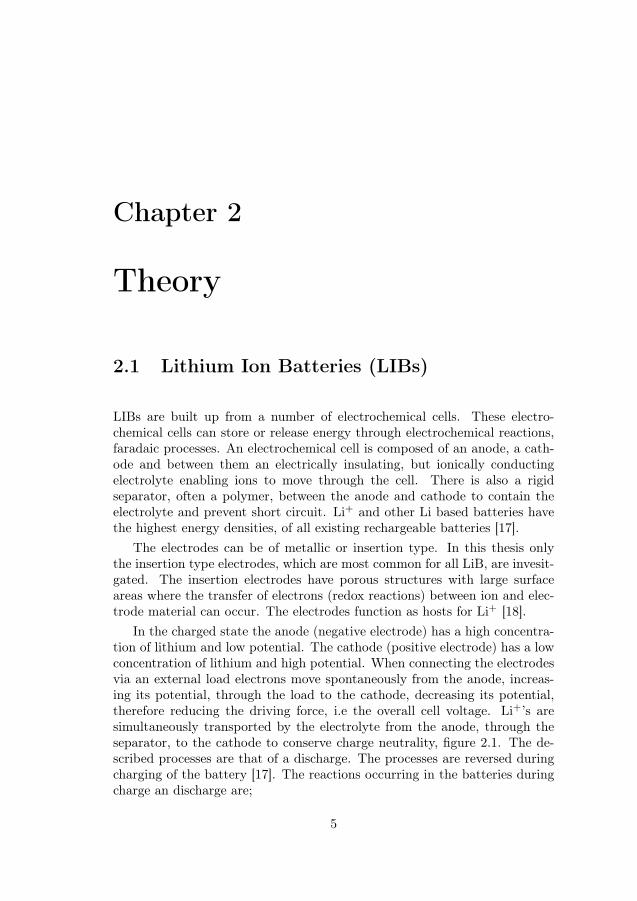
In the charged state the anode (negative electrode) has a high concentra-tion of lithium and low potential. The cathode (positive electrode) has a lowconcentration of lithium and high potential. When connecting the electrodesvia an external load electrons move spontaneously from the anode, increas-ing its potential, through the load to the cathode, decreasing its potential,therefore reducing the driving force, i.e the overall cell voltage. Li+’s aresimultaneously transported by the electrolyte from the anode, through theseparator, to the cathode to conserve charge neutrality, figure 2.1. The de-scribed processes are that of a discharge. The processes are reversed duringcharging of the battery [17]. The reactions occurring in the batteries duringcharge an discharge are;
5
e-
Li+Li+
e-
Li+e-
e-
SEILi-plating
Li+
Exfoliation
Solvent
Cu-
curr
ent
colle
cto
r
Al-
curr
ent
colle
cto
r
NMC/LMOGraphite
Graphite layers
Particle cracking/ Structural dissorder
Current collector corrosion
M
Metal dissolution
Cathode particles accelerate SEI growth
M
LMO
NMC
LAnodeLCathode
Sep
ara
tor
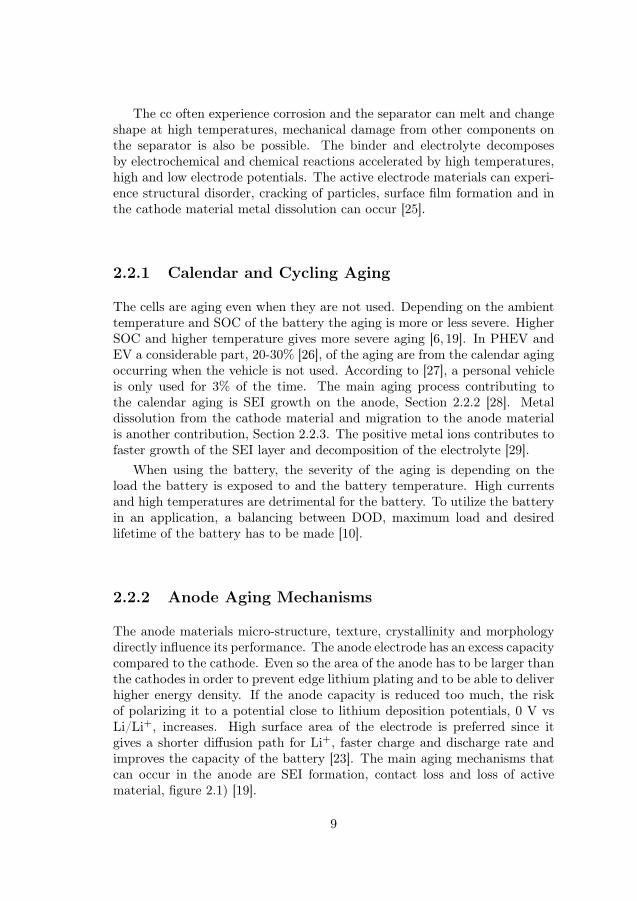
Figure 2.1: Schematic illustration of how a LiB works during discharge andthe aging mechanisms that can occur during usage [19].
Anode:LixC6 xLi+ + xe− + C6
Cathode:Li1−xMO + xLi+ + xe− LiMO
Overall cell reaction:
LixC6 + Li1−xMOdischarge
charge
C6 + LiMO
where MO denotes an arbitrary metal oxide and 0 ≤ x ≤ 1 [20, 21].The Open Circuit Voltage (OCV) is the voltage over the cell when no
load is applied and is a function of the SOC of the cell. The SOC itself is a
6
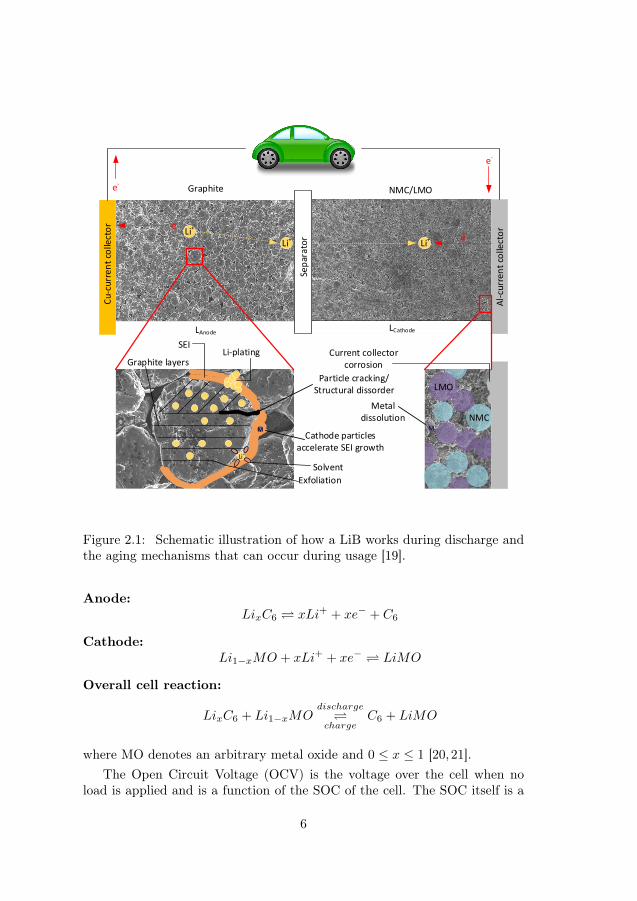
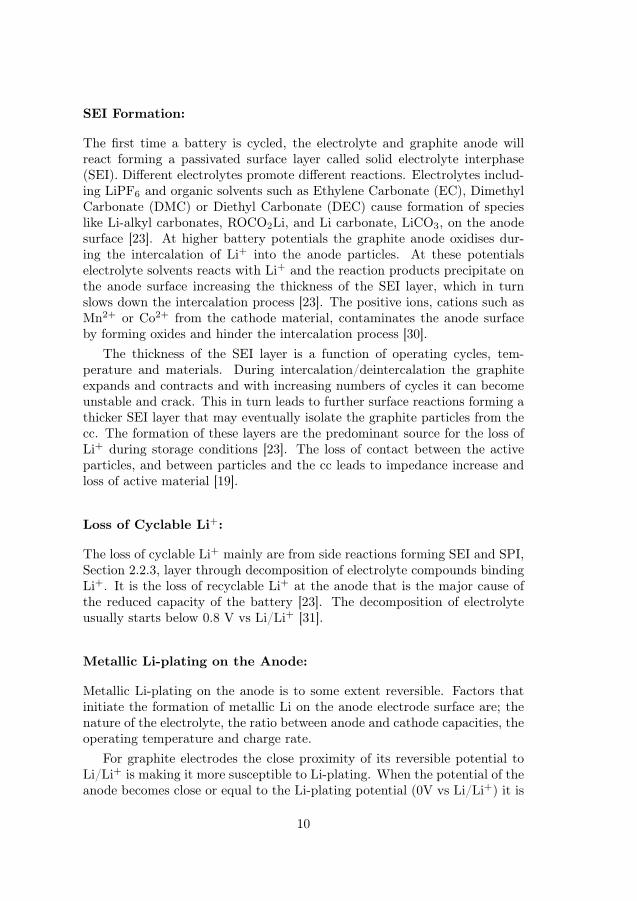
linear function of the total capacity of the cell and is specified by a limitedvoltage interval, determined so that the electrode materials and electrolyteare stability during cycling [18]. The 0% and 100% SOC level of the cell doesnot have to correspond to the minimum and maximum possible cell voltages.By operating in a limited voltage window, where the end points are definedas 0 and 100% SOC, the reversibility of the reactions and lifetime of the cellis improved. An example of how the cell OCV vs SOC is a combination ofthe anode and cathode material potentials can be seen in figure 2.2.
0 0.2 0.4 0.6 0.8 1SOC
Cell
-1
0
1
2
3
4
Pote
nti
al
(V)
00.20.40.60.81
SOCCathode
0
1
2
3
4
0 0.2 0.4 0.6 0.8 1SOC
Anode
0
1
2
Figure 2.2: Cell OCV curve and the electrode materials potential as a func-tion of respectivly SOC.
The energy output of the battery of course depends on the operatingvoltage and storage capacities of lithium in the electrode materials, thusthere is a balance between energy output and battery longevity decided bythe usage of the battery. For the electrode reactions to occur there has tobe an overpotential that drives the reactions, this leads to a decrease in thebattery voltage, with respect to the OCV, as a result of the internal resistance.If the cell is to provide high power, the discharge process has to be rapid, andthe internal resistance low. At high current rates the internal resistance willincrease and result in a larger change in voltage. Other properties that lowersa battery’s energy output include ohmic losses from the electrical resistanceof the electrolyte and resistance in the electrodes and current collectors.
7
Commercial batteries uses anodes of carbonaceous materials, most com-monly graphite. The gravimetric capacity of graphite is typically 360-365mAh/g, close to the theoretical value of 372 mAh/g (LiC6).
Cathodes are made of metal oxides, mixed layered oxides or phosphatesincluding one or several transition metal ions such as Cobalt, Manganese,Nickel or Iron. The capacities obtainable from the cathode material are lim-ited to the amount of Li+ they can release and still remain a stable structure.For most cathode materials the lattice contracts as the lithium is deinterca-lated. The cathode materials typically have theoretical capacities of 150-278mAh/g and specific capacities of 100-200 mAh/g [22]. This lower capacity ofthe cathode compared to the anode is compensated for by using more cathodematerial [17].
Cell Impedance:
The impedance in the battery consists of impedance contributions from sev-eral sub-components and the connection between these sub-components. Ifconsidering only the major parts, the current collectors (cc) and separatorcan be modeled as pure resistive components while the porous electrodes aremore complex. The impedance in the electrodes consists of contact resis-tance, charge transfer and diffusion. The contact resistance describes howgood the contact is between electrode particles and between electrode andcc, which may also include the conductivity of the solid particles. The chargetransfer impedance describes the reaction kinetics, double layer capacitanceand transport of Li+ through the surface film, Solid Electrolyte Interphase(SEI) or Solid Permeable Interphase (SPI) [10]. The SEI layer on the an-ode creates an increasing resistance in the Li+ flow and thereby the chargetransfer resistance and total impedance of the anode. This impedance in-creases with charge rate, cycle number, temperature and particle size of theanode material [23]. An increased SEI layer affect the anodes intercalationand deintercalation kinetics and result in an increase in impedance [19].
2.2 Aging Processes
Batteries degrade as they age, they experience power and energy fade as-sociated with impedance rise and capacity loss. The capacity loss can belinked to degradation of the electrolyte components through side reactionswith Li+ with the result of less cyclable Li+ and in the electrodes by lossof active electrode material. The power losses are consisting of contact re-sistance in interphases between the materials, growth of resistive film on theactive material, loss of active surface area and impaired mass transport [24].The different components of the battery experience different aging processes.
8
The cc often experience corrosion and the separator can melt and changeshape at high temperatures, mechanical damage from other components onthe separator is also be possible. The binder and electrolyte decomposesby electrochemical and chemical reactions accelerated by high temperatures,high and low electrode potentials. The active electrode materials can experi-ence structural disorder, cracking of particles, surface film formation and inthe cathode material metal dissolution can occur [25].
2.2.1 Calendar and Cycling Aging
The cells are aging even when they are not used. Depending on the ambienttemperature and SOC of the battery the aging is more or less severe. HigherSOC and higher temperature gives more severe aging [6, 19]. In PHEV andEV a considerable part, 20-30% [26], of the aging are from the calendar agingoccurring when the vehicle is not used. According to [27], a personal vehicleis only used for 3% of the time. The main aging process contributing tothe calendar aging is SEI growth on the anode, Section 2.2.2 [28]. Metaldissolution from the cathode material and migration to the anode materialis another contribution, Section 2.2.3. The positive metal ions contributes tofaster growth of the SEI layer and decomposition of the electrolyte [29].
When using the battery, the severity of the aging is depending on theload the battery is exposed to and the battery temperature. High currentsand high temperatures are detrimental for the battery. To utilize the batteryin an application, a balancing between DOD, maximum load and desiredlifetime of the battery has to be made [10].
2.2.2 Anode Aging Mechanisms
The anode materials micro-structure, texture, crystallinity and morphologydirectly influence its performance. The anode electrode has an excess capacitycompared to the cathode. Even so the area of the anode has to be larger thanthe cathodes in order to prevent edge lithium plating and to be able to deliverhigher energy density. If the anode capacity is reduced too much, the riskof polarizing it to a potential close to lithium deposition potentials, 0 V vsLi/Li+, increases. High surface area of the electrode is preferred since itgives a shorter diffusion path for Li+, faster charge and discharge rate andimproves the capacity of the battery [23]. The main aging mechanisms thatcan occur in the anode are SEI formation, contact loss and loss of activematerial, figure 2.1) [19].
9
SEI Formation:
The first time a battery is cycled, the electrolyte and graphite anode willreact forming a passivated surface layer called solid electrolyte interphase(SEI). Different electrolytes promote different reactions. Electrolytes includ-ing LiPF6 and organic solvents such as Ethylene Carbonate (EC), DimethylCarbonate (DMC) or Diethyl Carbonate (DEC) cause formation of specieslike Li-alkyl carbonates, ROCO2Li, and Li carbonate, LiCO3, on the anodesurface [23]. At higher battery potentials the graphite anode oxidises dur-ing the intercalation of Li+ into the anode particles. At these potentialselectrolyte solvents reacts with Li+ and the reaction products precipitate onthe anode surface increasing the thickness of the SEI layer, which in turnslows down the intercalation process [23]. The positive ions, cations such asMn2+ or Co2+ from the cathode material, contaminates the anode surfaceby forming oxides and hinder the intercalation process [30].
The thickness of the SEI layer is a function of operating cycles, tem-perature and materials. During intercalation/deintercalation the graphiteexpands and contracts and with increasing numbers of cycles it can becomeunstable and crack. This in turn leads to further surface reactions forming athicker SEI layer that may eventually isolate the graphite particles from thecc. The formation of these layers are the predominant source for the loss ofLi+ during storage conditions [23]. The loss of contact between the activeparticles, and between particles and the cc leads to impedance increase andloss of active material [19].
Loss of Cyclable Li+:
The loss of cyclable Li+ mainly are from side reactions forming SEI and SPI,Section 2.2.3, layer through decomposition of electrolyte compounds bindingLi+. It is the loss of recyclable Li+ at the anode that is the major cause ofthe reduced capacity of the battery [23]. The decomposition of electrolyteusually starts below 0.8 V vs Li/Li+ [31].
Metallic Li-plating on the Anode:
Metallic Li-plating on the anode is to some extent reversible. Factors thatinitiate the formation of metallic Li on the anode electrode surface are; thenature of the electrolyte, the ratio between anode and cathode capacities, theoperating temperature and charge rate.
For graphite electrodes the close proximity of its reversible potential toLi/Li+ is making it more susceptible to Li-plating. When the potential of theanode becomes close or equal to the Li-plating potential (0V vs Li/Li+) it is
10
favorable for Li+ to form metallic dendrite on the surface of the anode ratherthan intercalating into the carbon lattice. The risk of dendrites are higher atlow temperature and high charge current. Dendrites can cause the separatorto disconnect (lose contact with the electrolyte) and even pierce through it,causing a short circuit and thermal runway in the battery. Li-plating usuallymanifests itself as a voltage plateau on the discharge voltage profile and lowcolumbic efficiency [23].
Structural Changes:
The structural changes in the anode material when cycling the battery is notthe main, but an additional contributor to battery degradation. Cycling thebattery at high currents induces mechanical strain on the graphite latticeand steep gradients of Li+ in the material. The insertion and de-insertion ofLi+ induces mechanical stress that with time will cause the particles to crackand split, making them less ordered compared to the original structure [23].The expansion and cracking of particles enables further SEI growth thataccelerates the aging, this can also lead to loss of active material [19]. Thegeometry of the graphite particles effects the reversible capacity. Pressedparticles with less oriented graphite particles have low reversible capacity.The intercalation kinetics becomes more difficult and new boundaries arecreated between crystallites where irreversible Li+/electrolyte interaction canoccur [23].
2.2.3 Cathode Aging Mechanisms
The degradation in the composite cathode materials can be separated intotwo main effects, film-formation and loss of active material [32]. Other mecha-nisms are structural changes, degradation or change of binder and conductingagents [19].
SPI Formation:
The film layer formed on the cathode particles are called Solid PermeableInterphase (SPI) and, therefore, distinguished from the anode SEI becauseof its different composition and properties [33]. The SPI is formed on theelectrode particles from reactions with electrolyte components and similarto the SEI layer it undergoes changes during the batteries entire lifetime.The SPI thickness is a few nm and consists of both inorganic and organicspecies. The organic species formed is commonly LiF, LixPFy and LixPFyOz.Which inorganic species that is formed, is dependent on the cathode materialand electrolyte. The thickness of the SPI also increases with cycle number,
11
storage time and significantly with temperature [34].
Loss of Active Material:
The loss of active material can come from structural changes, particle crack-ing, metal dissolution and loss of contact to the cc. Structural changes canappear when metal in the cathode material dissolves in the electrolyte, asdescribed in Section 2.2.2.
Metal Dissolution:
Metal dissolution from the cathode material causes capacity loss and giverise to a higher contact resistance at the metal depleted interface. For somecathode materials these metal ions can form isolating precipitates on thecathode surface leading to increasing impedance [19]. The resistance forthe intercalation/deintercalation reaction has also been seen to increase. InLMO based cells, the Mn2+ dissolution increase with the lithium content inthe cathode, i.e at high potentials, especially above 4.1 V vs Li/Li+ [29]. Themetal dissolution can lead to further aging by migrating to the anode causingreactions on the anode surface (see Section 2.2.2) [35].
2.3 Mathematical Formulation ofElectrochemical Processes
The most commonly used and established mathematical method for physics-based simulations of LiBs is the so called Fuller, Doyle and Newman theory,often referred to as the Newman model.
The model describes the behavior of both solid and liquid phases usingconcentrated solution theory and porous electrode theory. It describes theone-dimensional transport of lithium from one porous electrode through theseparator and in to the other porous electrode [13].
In this section an introduction to some fundamental electrochemistry from[36] focusing on the transport of ions in electrolytic systems will be presented.
2.3.1 Mass Transport
Mass transport of ionic species takes place by diffusion, migration and con-vection. Diffusion is driven by the gradient of chemical potential, the con-centration gradient. Migration is driven by the gradient of electric potentialand convection by macroscopic streams in the fluid. The total molar flux of a
12
species, NT , passed over an arbitrary unit area, can be expressed as the sumof the flux contributions from migration (Nm), diffusion (Nd) and convection(Nc)
NT = Nm +Nd +Nc (2.1)
since they are considered independent of each other. In the general expressionfor transport of matter in electrochemical systems
NT = −ziuiFci∇φ−Di∇ci + civ (2.2)
where zi is the ionic charge of species i, ui the ionic mobility, F Faradaysconstant, ci the concentration, φ the potential, Di the diffusion coefficientand v the fluid velocity.
In the immediate vicinity of the electrode there is no convection due tofriction forces at the material surface. In this area diffusion is most effectiveand it is therefore known as the diffusion layer. At increased distance fromthe electrode there is no concentration gradient and therefore no diffusion,here convection becomes more important. Mass transport by migration takesplace in both of these areas [36].
Conservation of Mass
To simulate the behavior of an electrochemical system it is often necessaryto include one or more of the conservation equations for, mass, energy andmomentum. The conservation of mass of species i in a volume element withtime t is formulated as
dcidt
= −∇ ·NT +∑
reactions
νi,reactions (2.3)
where νi is moles of species i produced or consumed by reactions [36].
Transport in Eelectrolyte
The driving force for the mass transfer in concentrated solution theory is thegradient in electrochemical potential
ci∇µi =∑j 6=i
Kij(vj − vi) =∑j 6=i
cicjcTDij
RT (vj − vi) (2.4)
where µi is the electrochemical potential, Kij the friction coefficient betweenspecies i and j, R the gas constant and T temperature [36]. In a binaryelectrolyte i and j can be refereed to as + and −. By the Gibbs-Duhemequation (
∑i
nidµi = 0) this results in two independent transport equations.
13
Using the solvent as reference and setting its velocity to zero the two transportequations in the form of (2.4) are inverted to receive the equations for themolar flux of respectively species
N+ = −ν+D∇c+it0+z+F
(2.5)
and
N− = −ν−D∇c+it0−z−F
(2.6)
where i is the current density, t0± the transport number and ν+/− the numberof ions formed when 1 mol electrolyte dissolves [13].
14
Chapter 3
Experimental Setup
In this chapter the test object specifications are presented, as well as the setupfor the lifetime cycling, calendar aging and different characterization tests.The result from the characterization measurements performed for model pa-rameters are presented together with measurement methods for analyzing thecell aging.
3.1 Test Object
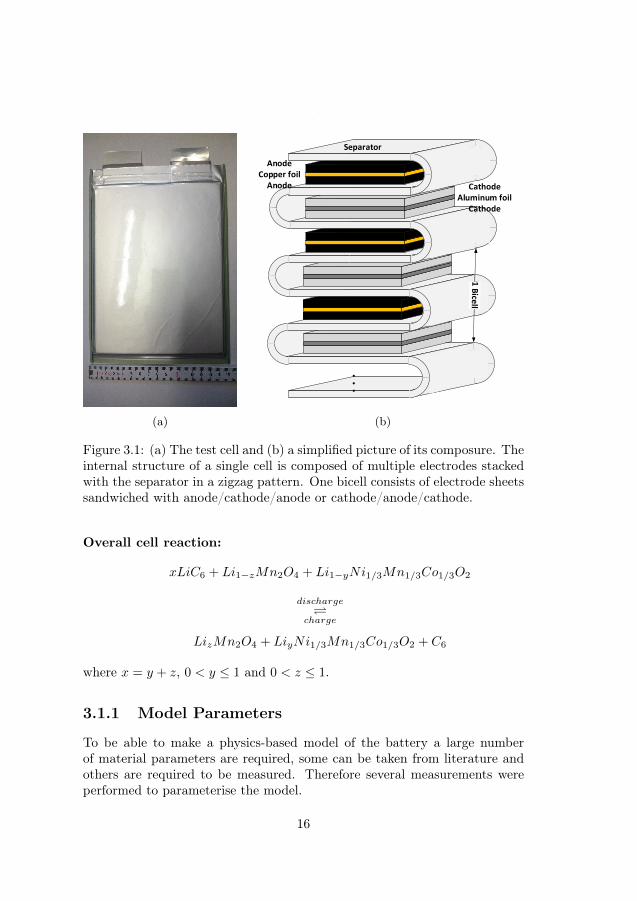
The test object of this thesis is a commercial 26 Ah Li+ pouch cell, shown infigure 3.1a. The cell is made up of 13 stacked bicells resulting in a total of 38electrochemical cells, a simplified schematics is shown in figure 3.1b. The cellis designed for use in the voltage window 2.8-4.15 V, corresponding to 0 and100% SOC respectively. The current needed to discharge the cell in 1 h is 26A, 1C-rate. The negative electrode (anode) is surface treated natural graphiteand the positive electrode (cathode) is a mixture of spinel LMO (30wt%)and layered NMC (70wt%). The separator is made of Poly propylene andthe electrolyte is composed of the solvents EC/DMC/Ethylmethyl Carbonate(EMC) and the salt LiPF6.
The anode reaction is described in Section 2.1 and the two cathode reac-tions of the mixed electrode are derived from [20]:
NMC:
Li1−yNi1/3Mn1/3Co1/3O2 + yLi+ + ye− LiNi1/3Mn1/3Co1/3O2
LMO:Li1−zMn2O4 + zLi+ + ze− LiMn2O4
15
(a)
Separator
AnodeCopper foil
Anode CathodeAluminum foil
Cathode
(b)
Figure 3.1: (a) The test cell and (b) a simplified picture of its composure. Theinternal structure of a single cell is composed of multiple electrodes stackedwith the separator in a zigzag pattern. One bicell consists of electrode sheetssandwiched with anode/cathode/anode or cathode/anode/cathode.
Overall cell reaction:
xLiC6 + Li1−zMn2O4 + Li1−yNi1/3Mn1/3Co1/3O2
discharge
charge
LizMn2O4 + LiyNi1/3Mn1/3Co1/3O2 + C6
where x = y + z, 0 < y ≤ 1 and 0 < z ≤ 1.
3.1.1 Model Parameters
To be able to make a physics-based model of the battery a large numberof material parameters are required, some can be taken from literature andothers are required to be measured. Therefore several measurements wereperformed to parameterise the model.
16
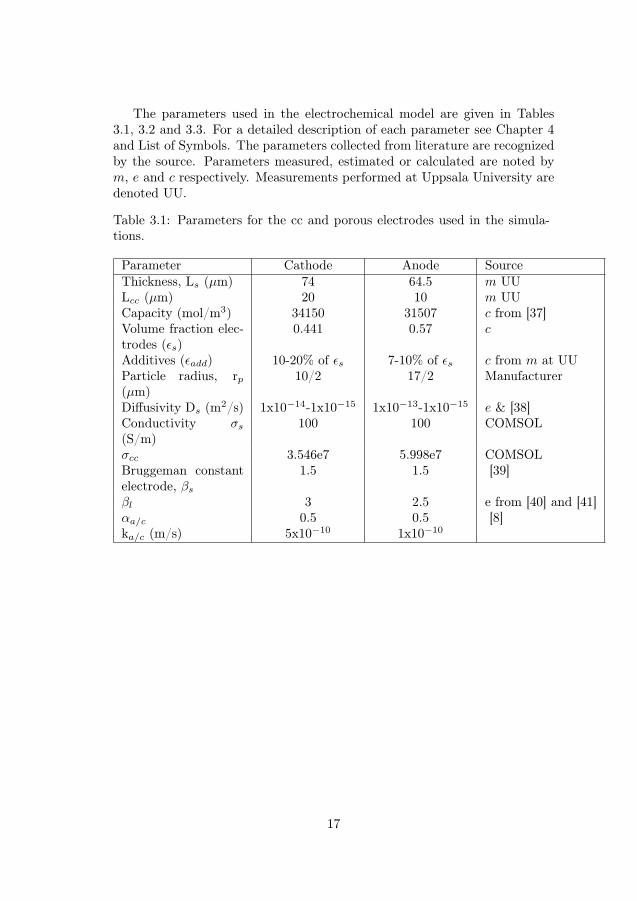
The parameters used in the electrochemical model are given in Tables3.1, 3.2 and 3.3. For a detailed description of each parameter see Chapter 4and List of Symbols. The parameters collected from literature are recognizedby the source. Parameters measured, estimated or calculated are noted bym, e and c respectively. Measurements performed at Uppsala University aredenoted UU.
Table 3.1: Parameters for the cc and porous electrodes used in the simula-tions.
Parameter Cathode Anode SourceThickness, Ls (µm) 74 64.5 m UULcc (µm) 20 10 m UUCapacity (mol/m3) 34150 31507 c from [37]Volume fraction elec-trodes (εs)
0.441 0.57 c
Additives (εadd) 10-20% of εs 7-10% of εs c from m at UUParticle radius, rp(µm)
10/2 17/2 Manufacturer
Diffusivity Ds (m2/s) 1x10⁻¹⁴-1x10⁻¹⁵ 1x10⁻¹³-1x10⁻¹⁵ e & [38]Conductivity σs(S/m)
100 100 COMSOL
σcc 3.546e7 5.998e7 COMSOLBruggeman constantelectrode, βs
1.5 1.5 [39]
βl 3 2.5 e from [40] and [41]αa/c 0.5 0.5 [8]ka/c (m/s) 5x10⁻¹⁰ 1x10⁻¹⁰
17
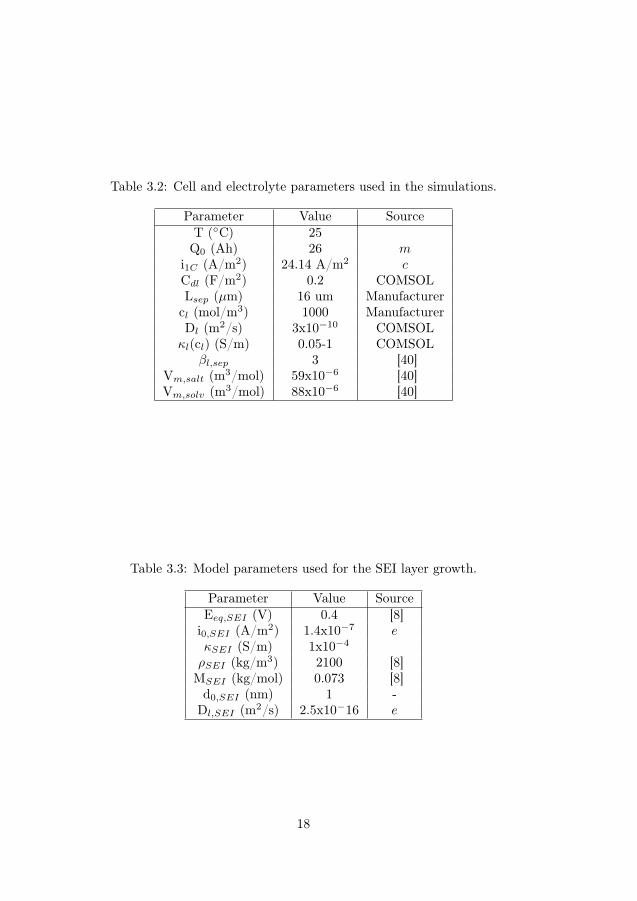
Table 3.2: Cell and electrolyte parameters used in the simulations.
Parameter Value SourceT (C) 25Q0 (Ah) 26 m
i1C (A/m2) 24.14 A/m2 cCdl (F/m2) 0.2 COMSOLLsep (µm) 16 um Manufacturercl (mol/m3) 1000 ManufacturerDl (m2/s) 3x10⁻¹⁰ COMSOLκl(cl) (S/m) 0.05-1 COMSOL
βl,sep 3 [40]Vm,salt (m3/mol) 59x10−6 [40]Vm,solv (m3/mol) 88x10−6 [40]
Table 3.3: Model parameters used for the SEI layer growth.
Parameter Value SourceEeq,SEI (V) 0.4 [8]
i0,SEI (A/m2) 1.4x10⁻⁷ eκSEI (S/m) 1x10⁻⁴ρSEI (kg/m3) 2100 [8]MSEI (kg/mol) 0.073 [8]d0,SEI (nm) 1 -Dl,SEI (m2/s) 2.5x10⁻¹⁶ e
18
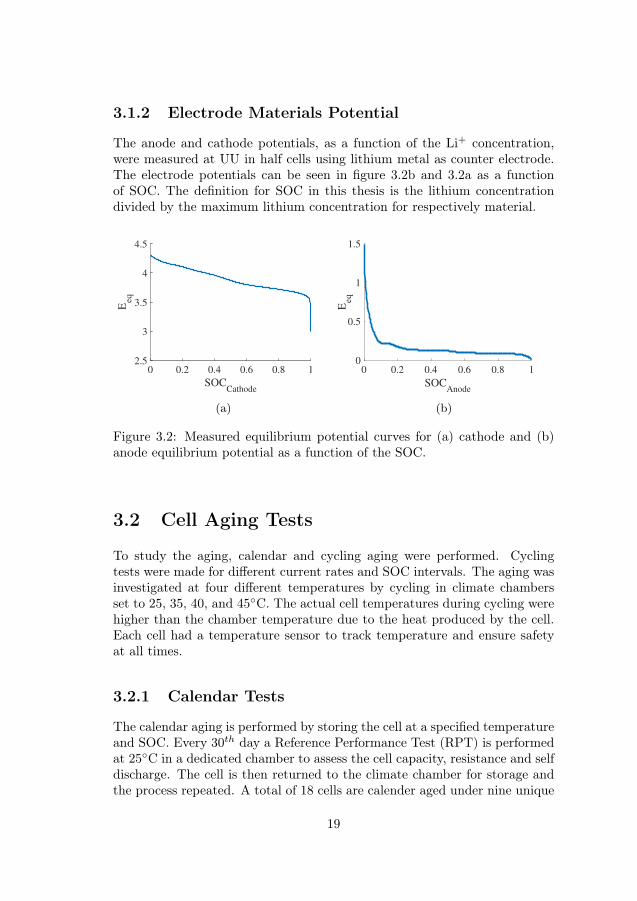
3.1.2 Electrode Materials Potential
The anode and cathode potentials, as a function of the Li+ concentration,were measured at UU in half cells using lithium metal as counter electrode.The electrode potentials can be seen in figure 3.2b and 3.2a as a functionof SOC. The definition for SOC in this thesis is the lithium concentrationdivided by the maximum lithium concentration for respectively material.
0 0.2 0.4 0.6 0.8 1
SOCCathode
2.5
3
3.5
4
4.5
Eeq
(a)
0 0.2 0.4 0.6 0.8 1
SOCAnode
0
0.5
1
1.5
Eeq
(b)
Figure 3.2: Measured equilibrium potential curves for (a) cathode and (b)anode equilibrium potential as a function of the SOC.
3.2 Cell Aging Tests
To study the aging, calendar and cycling aging were performed. Cyclingtests were made for different current rates and SOC intervals. The aging wasinvestigated at four different temperatures by cycling in climate chambersset to 25, 35, 40, and 45C. The actual cell temperatures during cycling werehigher than the chamber temperature due to the heat produced by the cell.Each cell had a temperature sensor to track temperature and ensure safetyat all times.
3.2.1 Calendar Tests
The calendar aging is performed by storing the cell at a specified temperatureand SOC. Every 30th day a Reference Performance Test (RPT) is performedat 25C in a dedicated chamber to assess the cell capacity, resistance and selfdischarge. The cell is then returned to the climate chamber for storage andthe process repeated. A total of 18 cells are calender aged under nine unique
19
Current connections
Voltage Sense
Temperature sensor
placement
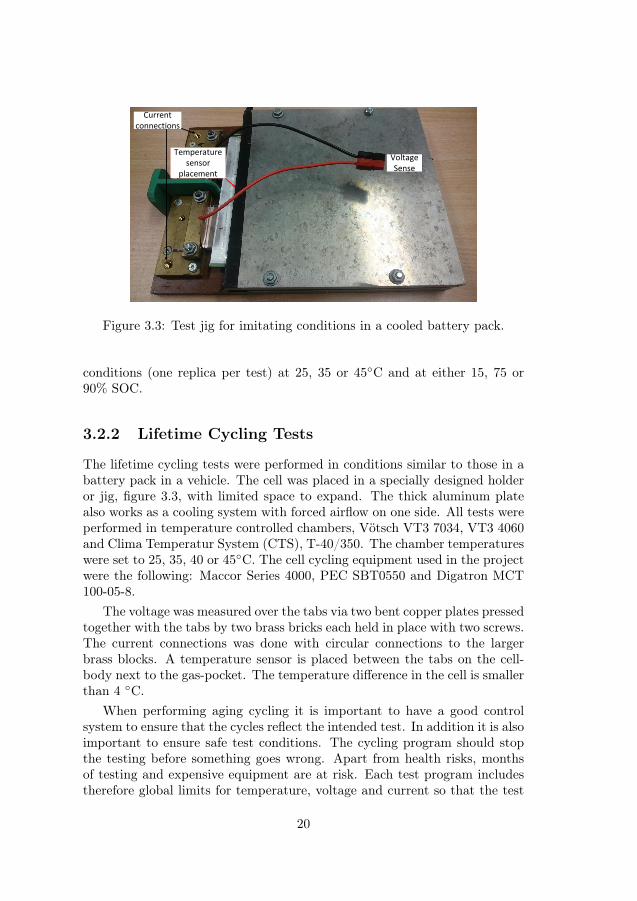
Figure 3.3: Test jig for imitating conditions in a cooled battery pack.
conditions (one replica per test) at 25, 35 or 45C and at either 15, 75 or90% SOC.
3.2.2 Lifetime Cycling Tests
The lifetime cycling tests were performed in conditions similar to those in abattery pack in a vehicle. The cell was placed in a specially designed holderor jig, figure 3.3, with limited space to expand. The thick aluminum platealso works as a cooling system with forced airflow on one side. All tests wereperformed in temperature controlled chambers, Vötsch VT3 7034, VT3 4060and Clima Temperatur System (CTS), T-40/350. The chamber temperatureswere set to 25, 35, 40 or 45C. The cell cycling equipment used in the projectwere the following: Maccor Series 4000, PEC SBT0550 and Digatron MCT100-05-8.
The voltage was measured over the tabs via two bent copper plates pressedtogether with the tabs by two brass bricks each held in place with two screws.The current connections was done with circular connections to the largerbrass blocks. A temperature sensor is placed between the tabs on the cell-body next to the gas-pocket. The temperature difference in the cell is smallerthan 4 C.
When performing aging cycling it is important to have a good controlsystem to ensure that the cycles reflect the intended test. In addition it is alsoimportant to ensure safe test conditions. The cycling program should stopthe testing before something goes wrong. Apart from health risks, monthsof testing and expensive equipment are at risk. Each test program includestherefore global limits for temperature, voltage and current so that the test
20
is terminated and damages avoided in case of a malfunction.
3.2.3 Test Protocols and Load Cycles
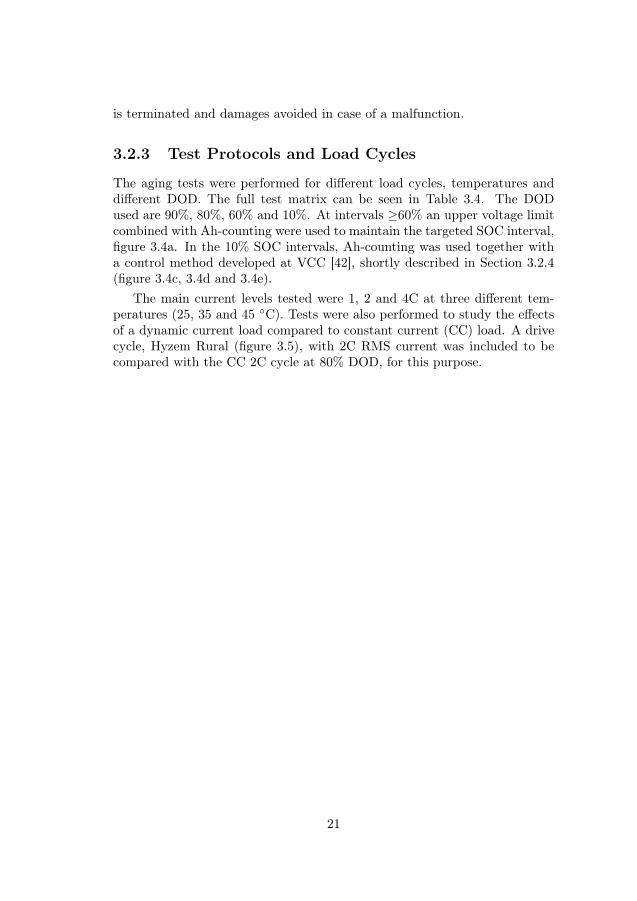
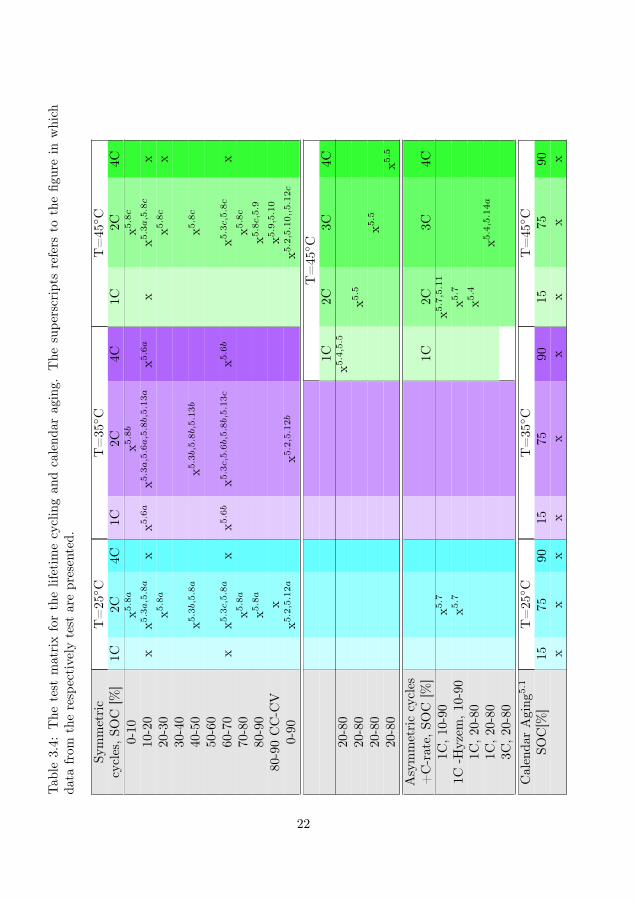
The aging tests were performed for different load cycles, temperatures anddifferent DOD. The full test matrix can be seen in Table 3.4. The DODused are 90%, 80%, 60% and 10%. At intervals ≥60% an upper voltage limitcombined with Ah-counting were used to maintain the targeted SOC interval,figure 3.4a. In the 10% SOC intervals, Ah-counting was used together witha control method developed at VCC [42], shortly described in Section 3.2.4(figure 3.4c, 3.4d and 3.4e).
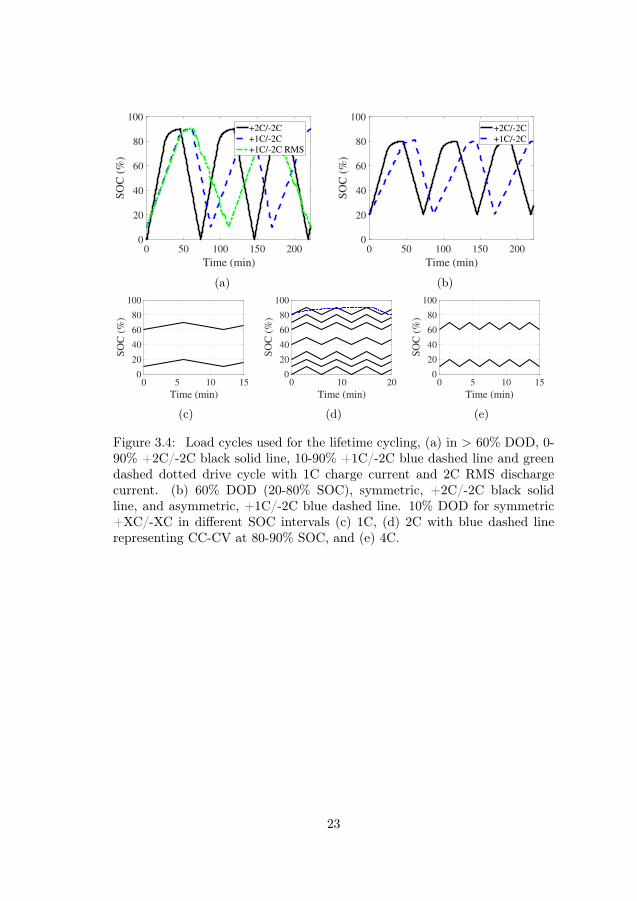
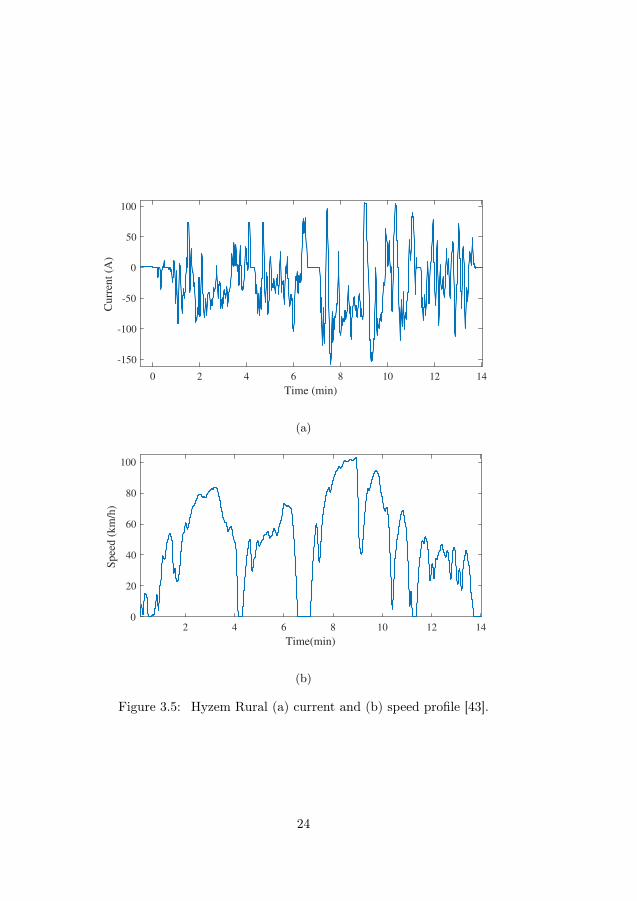
The main current levels tested were 1, 2 and 4C at three different tem-peratures (25, 35 and 45 C). Tests were also performed to study the effectsof a dynamic current load compared to constant current (CC) load. A drivecycle, Hyzem Rural (figure 3.5), with 2C RMS current was included to becompared with the CC 2C cycle at 80% DOD, for this purpose.
21
Tab
le3.4:
The
test
matrixforthelifetim
ecyclingan
dcalend
araging.
The
supe
rscripts
refers
tothefig
urein
which
data
from
therespectively
test
arepresented.
Symmetric
T=25 C
T=35 C
T=45 C
cycles,S
OC
[%]
1C2C
4C1C
2C4C
1C2C
4C0-10
x5.8a
x5.8b
x5.8c
10-20
xx5.3a,5.8a
xx5.6a
x5.3a,5.6a,5.8b,5.13a
x5.6a
xx5.3a,5.8c
x20-30
x5.8a
x5.8c
x30-40
40-50
x5.3b,5.8a
x5.3b,5.8b,5.13b
x5.8c
50-60
60-70
xx5.3c,5.8a
xx5.6b
x5.3c,5.6b,5.8b,5.13c
x5.6b
x5.3c,5.8c
x70-80
x5.8a
x5.8c
80-90
x5.8a
x5.8c,5.9
80-90CC-C
Vx
x5.9,5.10
0-90
x5.2,5.12a
x5.2,5.12b
x5.2,5.10,,5.12c
T=45 C
1C2C
3C4C
20-80
x5.4,5.5
20-80
x5.5
20-80
x5.5
20-80
x5.5
Asymmetriccycles
+C-rate,
SOC
[%]
1C2C
3C4C
1C,1
0-90
x5.7
x5.7,5.11
1C-H
yzem
,10-90
x5.7
x5.7
1C,2
0-80
x5.4
1C,2
0-80
x5.4,5.14a
3C,2
0-80
Calenda
rAging
5.1
T=25 C
T=35 C
T=45 C
SOC[%
]15
7590
1575
9015
7590
xx
xx
xx
xx
x
22
0 50 100 150 200
Time (min)
0
20
40
60
80
100S
OC
(%
)+2C/-2C
+1C/-2C
+1C/-2C RMS
(a)
0 50 100 150 200
Time (min)
0
20
40
60
80
100
SO
C (
%)
+2C/-2C
+1C/-2C
(b)
0 5 10 15
Time (min)
0
20
40
60
80
100
SO
C (
%)
(c)
0 10 20
Time (min)
0
20
40
60
80
100
SO
C (
%)
(d)
0 5 10 15
Time (min)
0
20
40
60
80
100
SO
C (
%)
(e)
Figure 3.4: Load cycles used for the lifetime cycling, (a) in > 60% DOD, 0-90% +2C/-2C black solid line, 10-90% +1C/-2C blue dashed line and greendashed dotted drive cycle with 1C charge current and 2C RMS dischargecurrent. (b) 60% DOD (20-80% SOC), symmetric, +2C/-2C black solidline, and asymmetric, +1C/-2C blue dashed line. 10% DOD for symmetric+XC/-XC in different SOC intervals (c) 1C, (d) 2C with blue dashed linerepresenting CC-CV at 80-90% SOC, and (e) 4C.
23
0 2 4 6 8 10 12 14
Time (min)
-150
-100
-50
0
50
100
Cu
rren
t (A
)
(a)
2 4 6 8 10 12 14
Time(min)
0
20
40
60
80
100
Spee
d (
km
/h)
(b)
Figure 3.5: Hyzem Rural (a) current and (b) speed profile [43].
24
3.2.4 Control Method for 10% SOC Intervals
To control the SOC interval during cycling in 10% DOD with CC, voltagepeak and minimum values was used together with Ah-counting. The cellwas first discharged to the OCV value for the upper SOC level. In theinitiation of the cycling, a control cycle was introduced with CC dischargeand charge using Ah-counting, where the end voltage values were stored intwo control variables. After each charge and discharge the end voltage valuewas compared to the voltage value from the control cycle according to
∆V = |Vupper/lower,1 − Vupper/lower,n| < Vlimit. (3.1)
If ∆V is within a predetermined limit value, Vlimit, the cycling proceeds. Ifnot a correction cycle of CC-CV is performed to the OCV value for the upperSOC level. The next coming cycle is then the new control cycle.
Vlimit was adjusted with respect to C-rate, SOC and resistance to ensurea fault tolerance of max 1% SOC. In the low SOC levels a higher value ofVlimit was allowed due to the shape of the OCV and higher resistance.
10 < Vlimit < 100mV
As the resistance increased during aging the limit was increased. At 0% SOCa constant voltage limit of 2.8V was used [42].
3.3 Characterization Tests
Capacity and current pulse tests were performed to track the capacity andresistance changes of the cell during the aging process. Initially these testswere performed every 100 full cycle equivalent (FCE), but less frequent at ev-ery 200-1000 FCE after 800 FCE. The periodicity of these tests were adaptedfor each load profile.
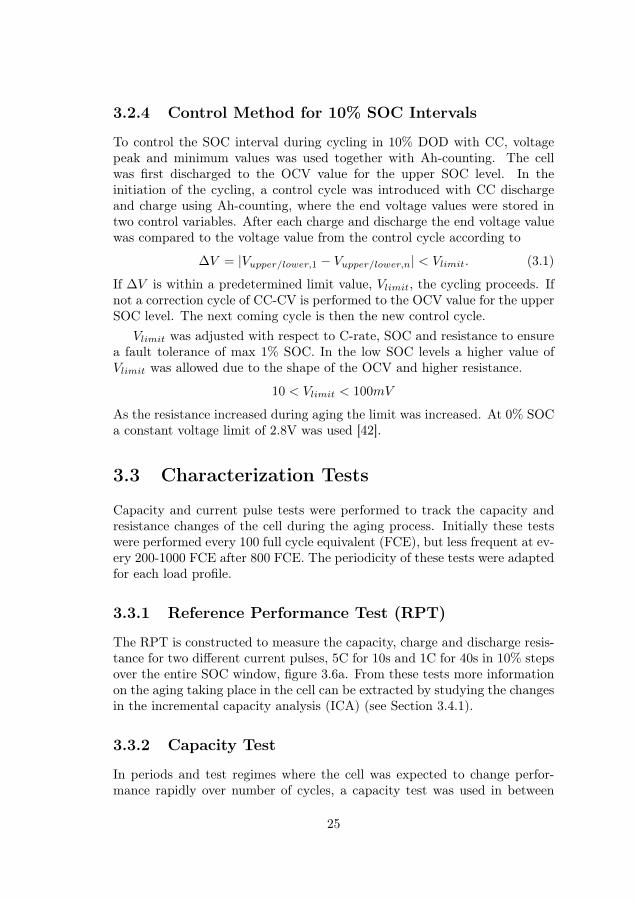
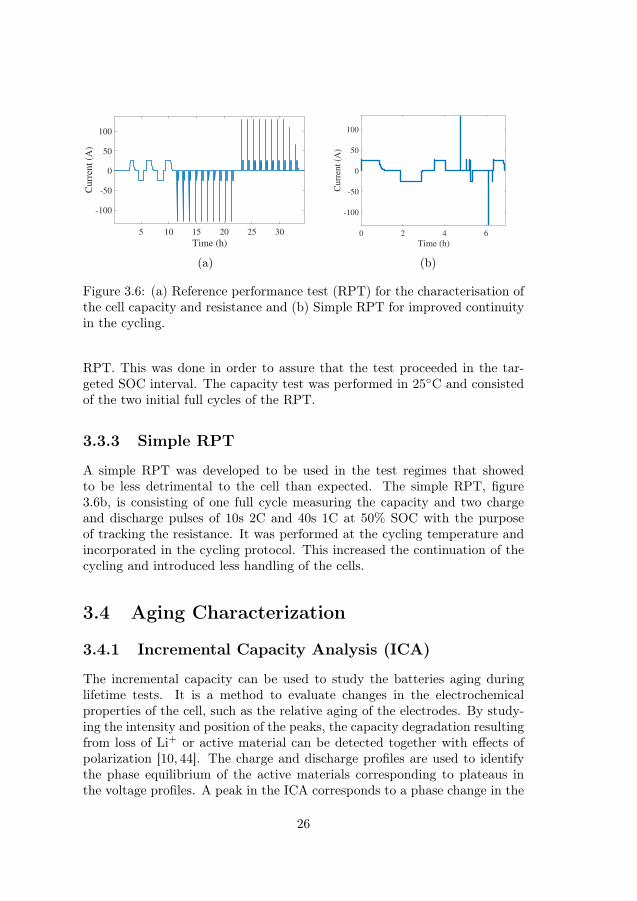
3.3.1 Reference Performance Test (RPT)
The RPT is constructed to measure the capacity, charge and discharge resis-tance for two different current pulses, 5C for 10s and 1C for 40s in 10% stepsover the entire SOC window, figure 3.6a. From these tests more informationon the aging taking place in the cell can be extracted by studying the changesin the incremental capacity analysis (ICA) (see Section 3.4.1).
3.3.2 Capacity Test
In periods and test regimes where the cell was expected to change perfor-mance rapidly over number of cycles, a capacity test was used in between
25
5 10 15 20 25 30
Time (h)
-100
-50
0
50
100
Cu
rren
t (A
)
(a)
0 2 4 6
Time (h)
-100
-50
0
50
100
Curr
ent
(A)
(b)
Figure 3.6: (a) Reference performance test (RPT) for the characterisation ofthe cell capacity and resistance and (b) Simple RPT for improved continuityin the cycling.
RPT. This was done in order to assure that the test proceeded in the tar-geted SOC interval. The capacity test was performed in 25C and consistedof the two initial full cycles of the RPT.
3.3.3 Simple RPT
A simple RPT was developed to be used in the test regimes that showedto be less detrimental to the cell than expected. The simple RPT, figure3.6b, is consisting of one full cycle measuring the capacity and two chargeand discharge pulses of 10s 2C and 40s 1C at 50% SOC with the purposeof tracking the resistance. It was performed at the cycling temperature andincorporated in the cycling protocol. This increased the continuation of thecycling and introduced less handling of the cells.
3.4 Aging Characterization
3.4.1 Incremental Capacity Analysis (ICA)
The incremental capacity can be used to study the batteries aging duringlifetime tests. It is a method to evaluate changes in the electrochemicalproperties of the cell, such as the relative aging of the electrodes. By study-ing the intensity and position of the peaks, the capacity degradation resultingfrom loss of Li+ or active material can be detected together with effects ofpolarization [10, 44]. The charge and discharge profiles are used to identifythe phase equilibrium of the active materials corresponding to plateaus inthe voltage profiles. A peak in the ICA corresponds to a phase change in the
26
intercalation material where two or more phases with different lithium con-centrations coexist with the same chemical potential [18,45]. The differentialcapacity (∆Q/∆V ) is analyzed as a function of the cell potential.
The results depend on the charge and discharge current rate. A slowrate should be used to limit the effects from polarization. For this project1C has been used to follow the changes in the cells during the aging. Atthis current the effects of polarization can be clearly seen. To achieve a moreunambiguous picture, C/10 is required, but 1C can still provide a crude imageof what processes are occurring. Reference ICA on half cell data were usedto analyze the peaks in the full cell ICA performed at VCC.
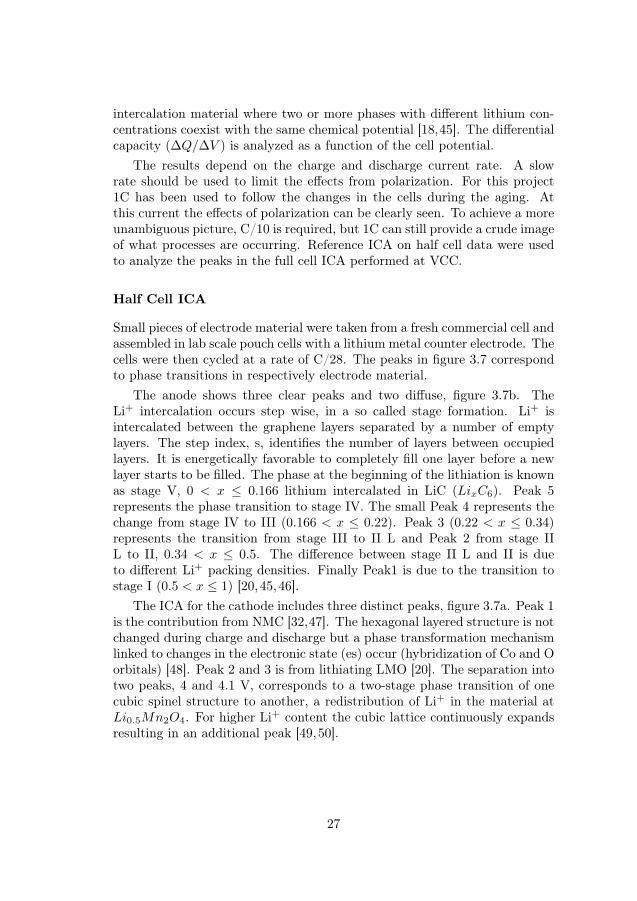
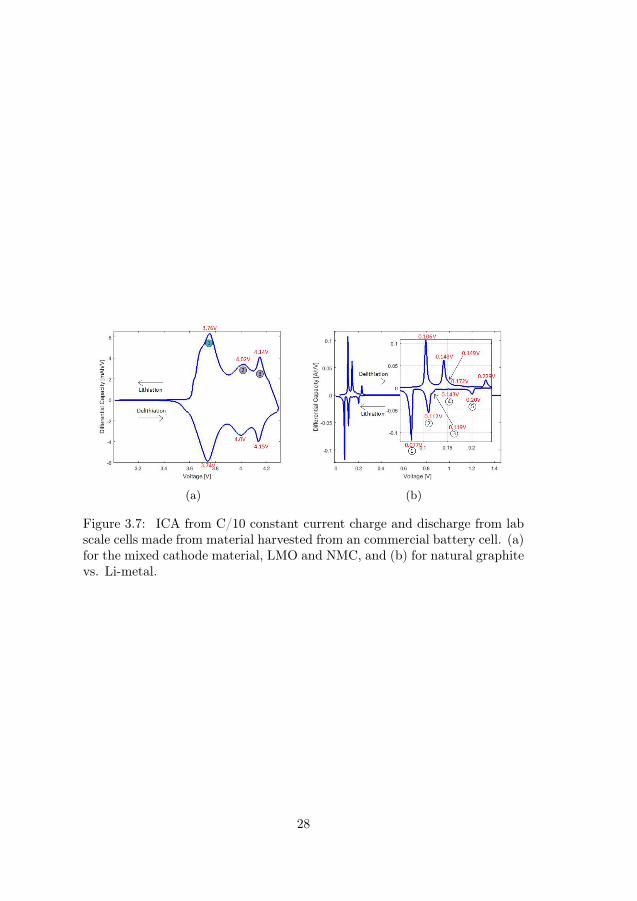
Half Cell ICA
Small pieces of electrode material were taken from a fresh commercial cell andassembled in lab scale pouch cells with a lithium metal counter electrode. Thecells were then cycled at a rate of C/28. The peaks in figure 3.7 correspondto phase transitions in respectively electrode material.
The anode shows three clear peaks and two diffuse, figure 3.7b. TheLi+ intercalation occurs step wise, in a so called stage formation. Li+ isintercalated between the graphene layers separated by a number of emptylayers. The step index, s, identifies the number of layers between occupiedlayers. It is energetically favorable to completely fill one layer before a newlayer starts to be filled. The phase at the beginning of the lithiation is knownas stage V, 0 < x ≤ 0.166 lithium intercalated in LiC (LixC6). Peak 5represents the phase transition to stage IV. The small Peak 4 represents thechange from stage IV to III (0.166 < x ≤ 0.22). Peak 3 (0.22 < x ≤ 0.34)represents the transition from stage III to II L and Peak 2 from stage IIL to II, 0.34 < x ≤ 0.5. The difference between stage II L and II is dueto different Li+ packing densities. Finally Peak1 is due to the transition tostage I (0.5 < x ≤ 1) [20,45,46].
The ICA for the cathode includes three distinct peaks, figure 3.7a. Peak 1is the contribution from NMC [32,47]. The hexagonal layered structure is notchanged during charge and discharge but a phase transformation mechanismlinked to changes in the electronic state (es) occur (hybridization of Co and Oorbitals) [48]. Peak 2 and 3 is from lithiating LMO [20]. The separation intotwo peaks, 4 and 4.1 V, corresponds to a two-stage phase transition of onecubic spinel structure to another, a redistribution of Li+ in the material atLi0.5Mn2O4. For higher Li+ content the cubic lattice continuously expandsresulting in an additional peak [49,50].
27
(a) (b)
Figure 3.7: ICA from C/10 constant current charge and discharge from labscale cells made from material harvested from an commercial battery cell. (a)for the mixed cathode material, LMO and NMC, and (b) for natural graphitevs. Li-metal.
28
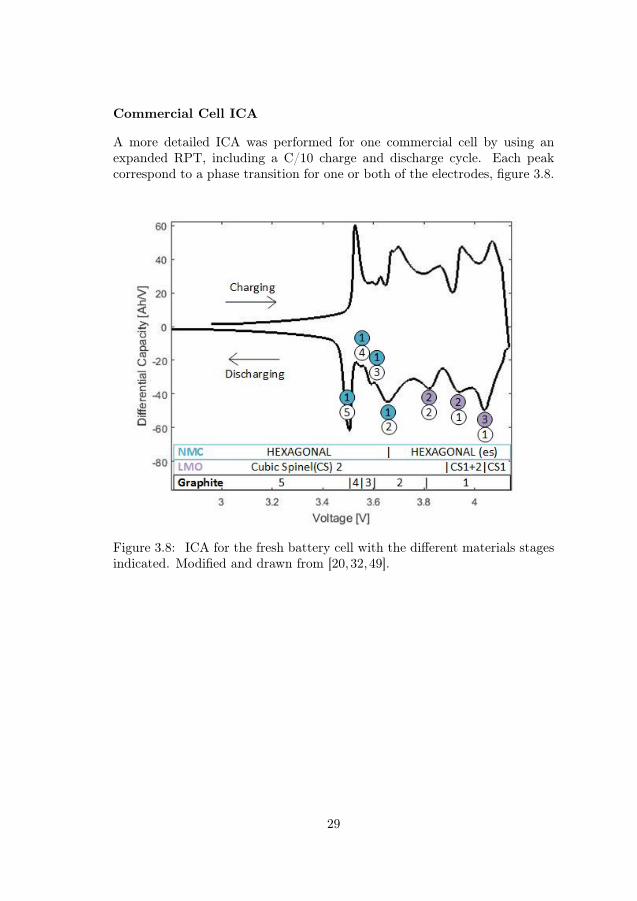
Commercial Cell ICA
A more detailed ICA was performed for one commercial cell by using anexpanded RPT, including a C/10 charge and discharge cycle. Each peakcorrespond to a phase transition for one or both of the electrodes, figure 3.8.
Figure 3.8: ICA for the fresh battery cell with the different materials stagesindicated. Modified and drawn from [20,32,49].
29
0 5 10 15 20
Time (s)
3.94
3.96
3.98
Vo
ltag
e (V
)
t1
t2
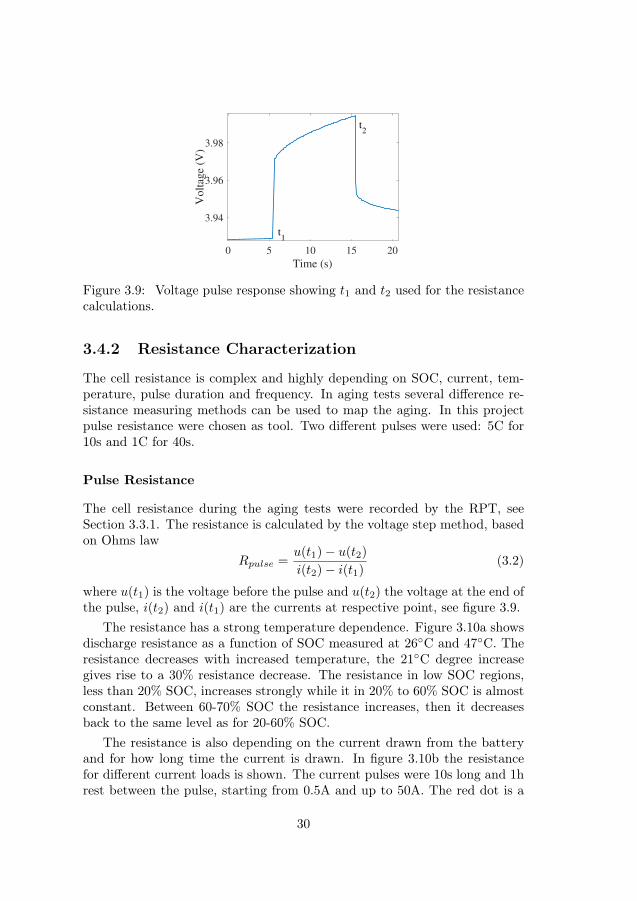
Figure 3.9: Voltage pulse response showing t1 and t2 used for the resistancecalculations.
3.4.2 Resistance Characterization
The cell resistance is complex and highly depending on SOC, current, tem-perature, pulse duration and frequency. In aging tests several difference re-sistance measuring methods can be used to map the aging. In this projectpulse resistance were chosen as tool. Two different pulses were used: 5C for10s and 1C for 40s.
Pulse Resistance
The cell resistance during the aging tests were recorded by the RPT, seeSection 3.3.1. The resistance is calculated by the voltage step method, basedon Ohms law
Rpulse =u(t1)− u(t2)
i(t2)− i(t1)(3.2)
where u(t1) is the voltage before the pulse and u(t2) the voltage at the end ofthe pulse, i(t2) and i(t1) are the currents at respective point, see figure 3.9.
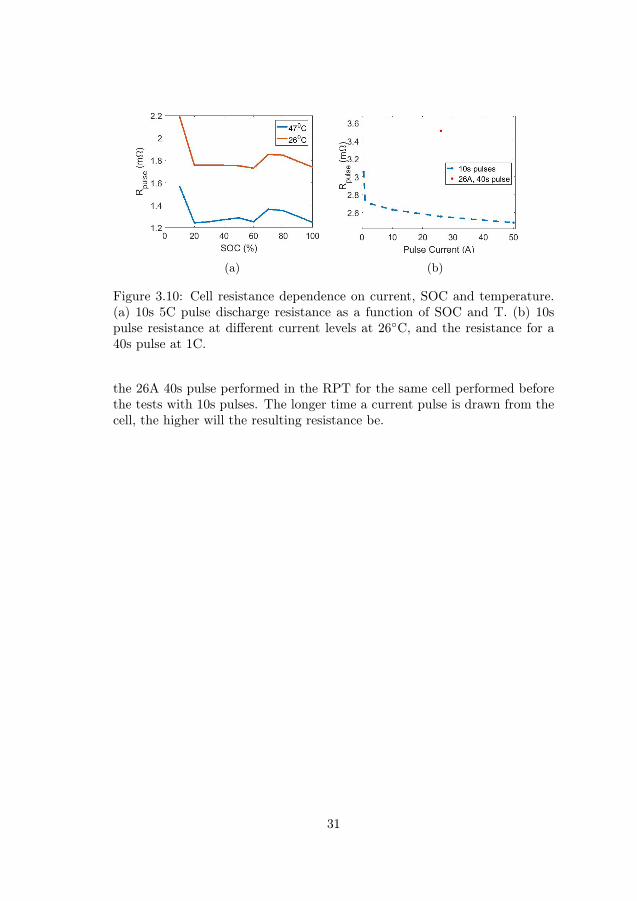
The resistance has a strong temperature dependence. Figure 3.10a showsdischarge resistance as a function of SOC measured at 26C and 47C. Theresistance decreases with increased temperature, the 21C degree increasegives rise to a 30% resistance decrease. The resistance in low SOC regions,less than 20% SOC, increases strongly while it in 20% to 60% SOC is almostconstant. Between 60-70% SOC the resistance increases, then it decreasesback to the same level as for 20-60% SOC.
The resistance is also depending on the current drawn from the batteryand for how long time the current is drawn. In figure 3.10b the resistancefor different current loads is shown. The current pulses were 10s long and 1hrest between the pulse, starting from 0.5A and up to 50A. The red dot is a
30
(a) (b)
Figure 3.10: Cell resistance dependence on current, SOC and temperature.(a) 10s 5C pulse discharge resistance as a function of SOC and T. (b) 10spulse resistance at different current levels at 26C, and the resistance for a40s pulse at 1C.
the 26A 40s pulse performed in the RPT for the same cell performed beforethe tests with 10s pulses. The longer time a current pulse is drawn from thecell, the higher will the resulting resistance be.
31

32
Chapter 4
Battery Modeling
The aging mechanism that most of the physics-based models focus on is thecapacity loss and resistance increase by the parasitic reactions occurring onthe surface of the anode particles, the formation of an SEI layer. This is justone of many aging mechanisms, in the next section several other aging mech-anisms are stated and their suitability to be modelled is brifely mentioned.
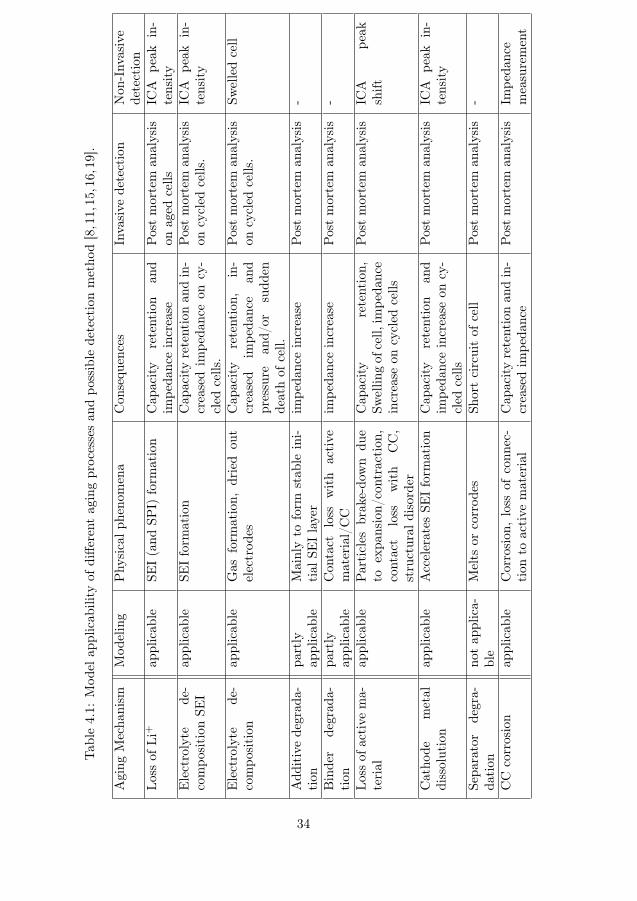
4.1 Aging Mechanisms and Simulation Chal-lenges
In Table 4.1 some of the most important aging mechanisms in the battery arelisted with the corresponding driving physical phenomena and the simulationability of the aging mechanism stated. Several of the mechanisms that areapplicable to be simulated might be highly difficult to incorporate in a modelof a commercial cell, due to lack of material knowledge or material parame-ters. For most battery manufacturers the different additives and compositionof the electrolyte is a trade secret.
Even with all the data given, the amount of reactions needed to be sim-ulated is not fully applicable in a model. The choice of aging mechanismshas to be based on the cell investigated, what seems to be the main agingcontributions. Another consideration is that a physics-based model requiresseveral material parameters as input. This is another reason for the difficultyto simulate the aging mechanisms.
33
Tab
le4.1:
Mod
elap
plicab
ility
ofdiffe
rent
agingprocessesan
dpo
ssible
detectionmetho
d[8,11,15,16,19].
Aging
Mecha
nism
Mod
eling
Phy
sicalp
heno
mena
Con
sequ
ences
Invasive
detection
Non
-Inv
asive
detection
Loss
ofLi
+ap
plicab
leSE
I(and
SPI)
form
ation
Cap
acity
retention
and
impe
danceincrease
Postmortem
analysis
onaged
cells
ICA
peak
in-
tensity
Electrolyte
de-
compo
sition
SEI
applicab
leSE
Iform
ation
Cap
acityretentionan
din-
creasedim
peda
nceon
cy-
cled
cells.
Postmortem
analysis
oncycled
cells.
ICA
peak
in-
tensity
Electrolyte
de-
compo
sition
applicab
leGas
form
ation,
dried
out
electrod
esCap
acity
retention,
in-
creased
impe
dance
and
pressure
and/
orsudd
endeathof
cell.
Postmortem
analysis
oncycled
cells.
Swelledcell
Add
itivedegrad
a-tion
partly
applicab
leMainlyto
form
stab
leini-
tial
SEIlayer
impe
danceincrease
Postmortem
analysis
-
Binder
degrad
a-tion
partly
applicab
leCon
tact
loss
with
active
material/CC
impe
danceincrease
Postmortem
analysis
-
Loss
ofactive
ma-
terial
applicab
leParticles
brake-do
wn
due
toexpa
nsion/
contraction,
contact
loss
with
CC,
structural
disorder
Cap
acity
retention,
Swellin
gof
cell,
impe
dance
increase
oncycled
cells
Postmortem
analysis
ICA
peak
shift
Catho
demetal
dissolution
applicab
leAccelerates
SEIform
ation
Cap
acity
retention
and
impe
danceincrease
oncy-
cled
cells
Postmortem
analysis
ICA
peak
in-
tensity
Sepa
rator
degra-
dation
notap
plica-
ble
Melts
orcorrod
esSh
ortcircuitof
cell
Postmortem
analysis
-
CC
corrosion
applicab
leCorrosion
,loss
ofconn
ec-
tion
toactive
material
Cap
acityretentionan
din-
creasedim
peda
nce
Postmortem
analysis
Impe
dance
measurement
34
4.2 Electrochemical Model
The fundamentals of mathematically modelled electrochemical system werepresented in Section 2.3. Here the model used in this thesis is described, inmore detail. Some of the parameters used in the model are given in Table3.1, 3.2 and 3.3.
4.2.1 Mass Transport in the Electrolyte
In the simulated system the electrolyte is assumed to be a binary electrolyte,consisting of a lithium salt dissolved in one solvent species. Letting + and −denote the ionic species, Li+ and PF−6 , the Maxwell-Stefan equation (see also(2.4)) for the binary electrolyte is used to account for the friction interactionbetween the species,
c+∂µ+
∂x=∑−
RTc+c−
cTDeff+−
(v− − v+) (4.1)
where cT is the sum of all species concentrations. The effective diffusioncoefficient, Deff
+− , is calculated from the Maxwell-Stefan diffusivity of thepure electrolyte
Deff+− = D+−ε
β (4.2)
where ε is the electrolyte volume fraction and β the Bruggeman coefficient[51]. All the effective parameters used in the porous structures in this modeluses this correlation.
From now on D will be used for the efficient diffusion coefficient if nothingelse is stated. Writing (2.2) for the two component electrolyte, solvent andsalt, gives
N+ =cT c+c−
D+∇lna+ −z+F
RT
cT c+c−
D+∇φ+ c+v− (4.3)
where a+ is the activity (∇µ+ = RT∇lna+) [36] and the total concentrationcalculated from the salt concentration, cl = c+/−, and solvent concentration,csolv, assuming electroneutrality.
cT = 2cl + csolv (4.4)
The solvent concentration is calculated from the partial molar volume Vm ofthe salt and solvent
csolv =1− V lmV solvm
(4.5)
35
Combining (4.3) and (2.3) while taking into account the porosity, thematerial balance for the salt becomes
εl∂cl∂t
= ∇[(1− clV lm)
((1 +
∂lnf±∂lncl
)cTcsolv
εβl Dl∇cl +il(1− t+)
F
)](4.6)
where the electrolyte current density is expressed by
il = κeff
(−∇φl +
2RT
clF
(1 +
∂lnf±∂lncl
)(1− t+)∇cl
)(4.7)
where f± is the salt activity coefficient and κeff electrolyte conductivity[40,51].
4.2.2 Potential and Current Coupling
The potential, in the current collectors and the porous electrode materialsare calculated by Ohms law from the applied current density
is = −σs∇φs (4.8)
where σ is the conductivity. In the porous material, the effective conductivity
σeff = εβsσ, (4.9)
is used. The copper current collector, on the anode side, is connected toground, φ = 0V, and the aluminum, on the cathode side, to the current feed,−n · i = iapplied. To couple the active material and electrolyte, a balance overthe volumetric current is used
∇ · il = iv,tot =∑m
iv,m(+iv,dl,add) (4.10)
∇ · is = −iv,tot (4.11)
The volumetric current in each mesh node, iv,m, is the sum of the Faradaiccurrent density (jF ), the current density from electrochemical reactions, andthe charging of double layers on the surface of the active material particles(jdl),
iv,m = Sailoc = Sa(iF + idl) (4.12)
where Sa is the active specific surface area of the electrode material. Theparticles are assumed to be spherical, giving the following expression for theactive specific surface area
Sa =3εsrp
(4.13)
where rp is the particle radius [13,40].
36
4.2.3 Electrochemical Reactions
The electrochemical reactions are considered to be of intercalation and dein-tercalation type and occur on the surface of the active electrode particles.During the intercalation, Li+ enters into the material, is reduced and dur-ing deintercalation, is oxidized back to Li+, which exits the material. Thereaction kinetics is assumed to follow the Butler-Volmer (B-V) equation
iF = i0
(exp
(αaFη
RT
)− exp
(−αcFηRT
))(4.14)
with
i0 = F (kc)αa(ka)αc(cs,max − cs)αa(cs)
αc
(cl
cl,ref
)αa
(4.15)
andη = φs − φl − Eeq(cs, T )−∆φs,film (4.16)
where η is the overpotential, Eeq the equilibrium potential of electrode ma-terial, α the reaction rate coefficient, and ∆φs,film is the potential differencefrom the resistive film that always is formed on the graphite particles (SEI)and to a smaller extent on the cathode particles (SPI).
∆φs,film = itotRfilm (4.17)
where Rfilm is the film resistance [13].
4.2.4 Double Layer Capacitance
The double layer capacitance, Cdl,i, is assumed to arise between the elec-trolyte and all surfaces in the electrode components. The double layer isassumed to be charged by Li+ and the current densities are calculated from
idl,S = Cdl,S∂(φs − φl −∆φs,film)
∂t(4.18a)
idl,addS = Cdl,addS∂(φadds − φl)
∂t(4.18b)
idl,cc = Cdl,cc∂(φcc − φl)
∂t(4.18c)
where (4.18a) is the contribution from the active material, (4.18b) from theconductive additives and (4.18c) from the current collectors [40]. The doublelayer capacitance affects the results when simulating dynamic behavior, dueto uncertainty in parameters for (4.18c) and (4.18b) only idl,S is added tothe model so far.
37
4.2.5 Mass Transport in the Electrode Materials
The particles are assumed to be spherical and to account for the concentra-tion in the active material, a pseudo dimension is added to the model. Thetransport of Li+ in the particles is assumed to occur through diffusion, whichis modelled by Fick’s second law [51]
∂cs∂t
=Ds
r2∂
∂r
(r2∂cs∂r
)(4.19)
with the boundary conditions
∂cs∂r|r=0 = 0 (4.20)
−Ds∂cs∂r|r=rp =
∑m
iloc,mF
(4.21)
4.2.6 Aging Through SEI Growth
The SEI growth originate from decomposition reactions of the solvent atthe graphite surface [52, 53]. The solvent consists of EC, DMC, EMC, andadditives. The concentration of the different solvents is unknown and for thismodel only decomposition reactions of EC are considered. The main productsare considered to be dilithium ethylene dicarbonate ((LiOCO2CH2)2) [52,54]and lithium carbonate (Li2CO3) [52,55]. The reaction considered is reductionof EC to (LiOCO2CH2)2 and further decomposition [56] or electrochemicalreduction [57] of (LiOCO2CH2)2 according to [58]:
2(CH2O)2CO + 2e− + 2Li+ → (LiOCO2CH2)2 + C2H4 (4.22a)
(LiOCO2CH2)2 → Li2CO3 + C2H4 + CO2 + 1/2O2 (4.22b)
(LiOCO2CH2)2 + 2Li+ + 2e− → 2Li2CO3 + C2H4 (4.22c)
The end product of reactions (4.22b) and (4.22c) are containing Li2CO3,which in this model, therefore is considered the final product. The SEI is as-sumed to grow only during charging and the decomposition reaction triggeredby the overpotential
η = φs − φl −∆φs,SEI − Eeq,SEI (4.23)
where Eeq,SEI = 0.4 V vs Li/Li+ [8]. The SEI growth introduces an increasingresistance proportional to the thickness of the SEI layer, dSEI ,
RSEI =dSEI + ∆dSEI
κSEI(4.24)
38
where κSEI is the conductivity of the SEI layer. The thickness is determinedby the accumulated amount of Li+ lost due to side reactions
∆dSEI =QSEIMSEI
2SaanodeρF(4.25)
where MSEI is the average molar mass of the products formed in the SEIand ρ the density of Li2CO3. QSEI (C/m2) is the irreversibly capacity lossto the side reactions directly proportional to the concentration, cSEI , of Li+bound in the SEI layer
QSEI = cSEIF (4.26)
The concentration accumulated in the SEI layer is calculated from
dcSEIdt
=−iSEISaanode
F(4.27)
where the current from the SEI reactions is assumed to follow B-V kineticswith concentration dependence
ikin,SEI = i0,SEI
(cp
cp,refexp
(αaFη
RT
)− c+c+,ref
clcl,ref
exp
(−αcFηRT
))(4.28)
where p stands for the product produced in the side reaction. The equationwas simplified to a cathodic Tafel approximation by assuming irreversible(only cathodic) reaction, thus, dropping the first term of (4.28) [8]
ikin,SEI = −i0,SEIc+
c+,ref
clcl,ref
exp
(−αcFηRT
)(4.29)
The exchange current density i0,SEI was first taken from [8] and later esti-mated from simulations to tune the aging so that the thickness of the SEIlayer would be in the order of 300 nm, reported by [30], at EOL for a simu-lated cell in the full SOC range.
As the SEI layer grows the side reactions are assumed to become masstransport limited and a limiting current in accordance to the Nernst boundarylayer was used
ilim = −clDl,seiF
dSEI(4.30)
where cl is the solvents bulk concentration, Dl,sei the diffusion coefficient forthe SEI layer and cl the bulk concentration in the electrolyte. The relationfor first order mass transport limitations was used
iSEI =ikin,SEI
1 +ikin,SEI
ilim
(4.31)
39
Porosity Change due to SEI Growth
With an increasing SEI layer the volume balance in the electrode needs tobe adjusted. The amount of active material is kept constant while the in-crease in SEI layer is reducing the volume fraction of electrolyte in the porousstructure. This is a rough estimation, since the SEI layer is likely to reducethe porosity of the active material and will not grow evenly on all surfaces.It might also isolate parts of the active material from the current collector.These effects have so far been neglected.
The electrolyte volume fraction is decreased according to:
εl = 1− εs − εadd − εSEI (4.32)
where εs and εadd are constant.
εSEI = VSEI/Vtot = dSEISa (4.33)
4.3 Model Validation
In this section the calibration of the model and estimation of model parame-ters are presented. Experimental data from RPT and half cell measurementswere used to fit parameters and to calibrate the model to the lifetime testedcells.
4.3.1 Parameter Estimation
Resistance Estimation
Current pulses were simulated in the model and the voltage response com-pared to to measured pulse data, the RPT test. The simulation showed largervoltage response than expected and the ohmic resistance was estimated bycalculating the pure resistive contribution from all parts in the electrochem-ical cell, Table 4.2. From this estimation the IR contribution for differentcurrents were calculated. The results showed that the additional resistancewas not coming from the material’s resistivities. The high resistivity was con-tributed to the reaction rates for the two materials and these were adjustedto give the same voltage increase as the measured data, figure 4.1a.
Diffusion Coefficient Estimation
The diffusion coefficient as a function of potential for graphite was takenfrom [38] and for NMC as a function of SOC from [59]. Since the cathodeis a mixture of NMC and LMO, the diffusion coefficient for the cathode side
40
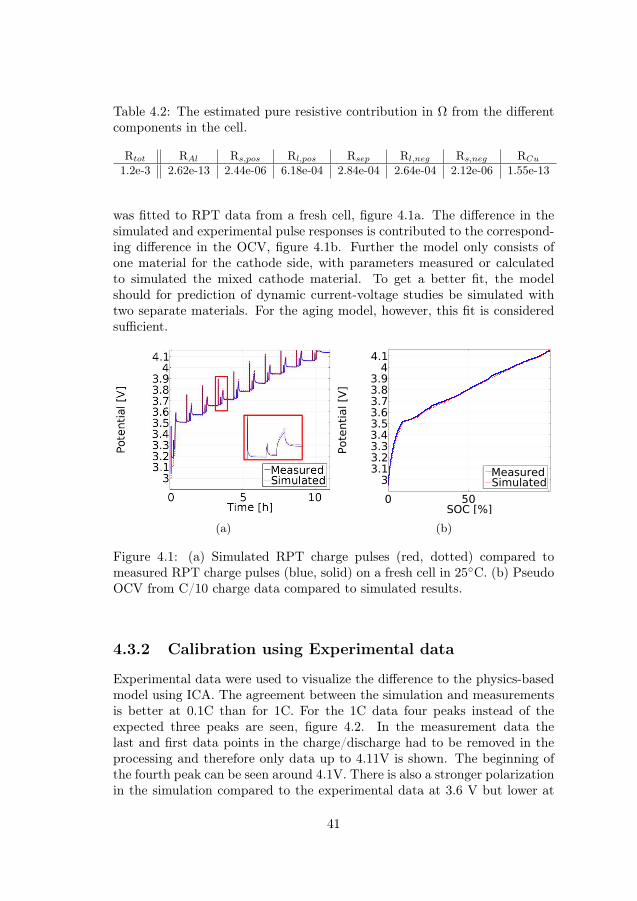
Table 4.2: The estimated pure resistive contribution in Ω from the differentcomponents in the cell.
Rtot RAl Rs,pos Rl,pos Rsep Rl,neg Rs,neg RCu1.2e-3 2.62e-13 2.44e-06 6.18e-04 2.84e-04 2.64e-04 2.12e-06 1.55e-13
was fitted to RPT data from a fresh cell, figure 4.1a. The difference in thesimulated and experimental pulse responses is contributed to the correspond-ing difference in the OCV, figure 4.1b. Further the model only consists ofone material for the cathode side, with parameters measured or calculatedto simulated the mixed cathode material. To get a better fit, the modelshould for prediction of dynamic current-voltage studies be simulated withtwo separate materials. For the aging model, however, this fit is consideredsufficient.
(a) (b)
Figure 4.1: (a) Simulated RPT charge pulses (red, dotted) compared tomeasured RPT charge pulses (blue, solid) on a fresh cell in 25C. (b) PseudoOCV from C/10 charge data compared to simulated results.
4.3.2 Calibration using Experimental data
Experimental data were used to visualize the difference to the physics-basedmodel using ICA. The agreement between the simulation and measurementsis better at 0.1C than for 1C. For the 1C data four peaks instead of theexpected three peaks are seen, figure 4.2. In the measurement data thelast and first data points in the charge/discharge had to be removed in theprocessing and therefore only data up to 4.11V is shown. The beginning ofthe fourth peak can be seen around 4.1V. There is also a stronger polarizationin the simulation compared to the experimental data at 3.6 V but lower at
41
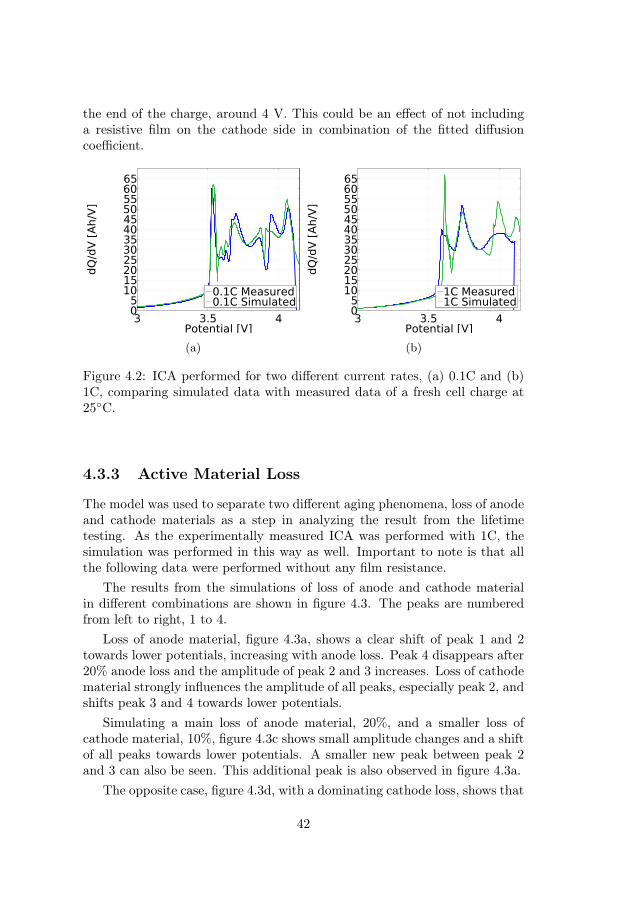
the end of the charge, around 4 V. This could be an effect of not includinga resistive film on the cathode side in combination of the fitted diffusioncoefficient.
(a) (b)
Figure 4.2: ICA performed for two different current rates, (a) 0.1C and (b)1C, comparing simulated data with measured data of a fresh cell charge at25C.
4.3.3 Active Material Loss
The model was used to separate two different aging phenomena, loss of anodeand cathode materials as a step in analyzing the result from the lifetimetesting. As the experimentally measured ICA was performed with 1C, thesimulation was performed in this way as well. Important to note is that allthe following data were performed without any film resistance.
The results from the simulations of loss of anode and cathode materialin different combinations are shown in figure 4.3. The peaks are numberedfrom left to right, 1 to 4.
Loss of anode material, figure 4.3a, shows a clear shift of peak 1 and 2towards lower potentials, increasing with anode loss. Peak 4 disappears after20% anode loss and the amplitude of peak 2 and 3 increases. Loss of cathodematerial strongly influences the amplitude of all peaks, especially peak 2, andshifts peak 3 and 4 towards lower potentials.
Simulating a main loss of anode material, 20%, and a smaller loss ofcathode material, 10%, figure 4.3c shows small amplitude changes and a shiftof all peaks towards lower potentials. A smaller new peak between peak 2and 3 can also be seen. This additional peak is also observed in figure 4.3a.
The opposite case, figure 4.3d, with a dominating cathode loss, shows that
42
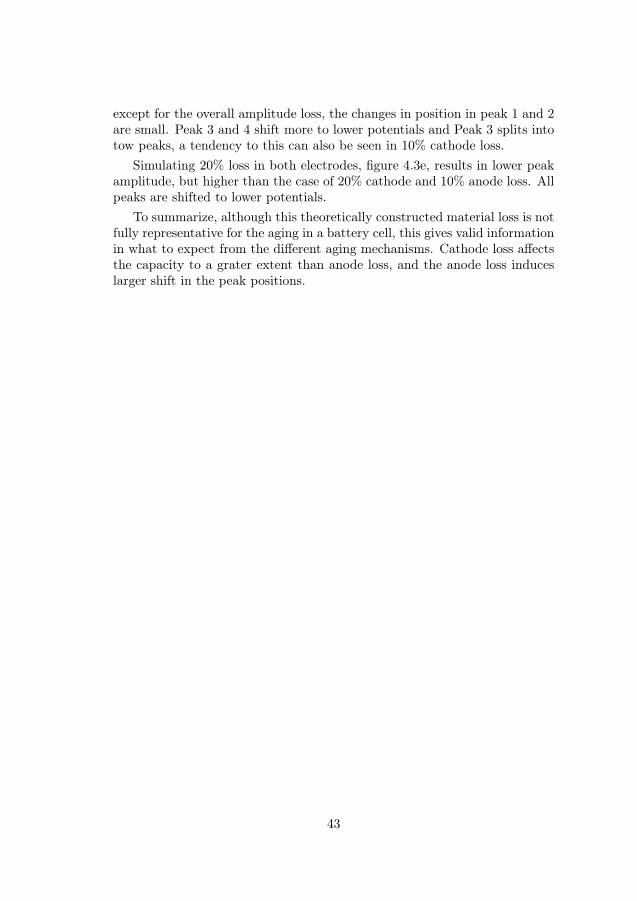
except for the overall amplitude loss, the changes in position in peak 1 and 2are small. Peak 3 and 4 shift more to lower potentials and Peak 3 splits intotow peaks, a tendency to this can also be seen in 10% cathode loss.
Simulating 20% loss in both electrodes, figure 4.3e, results in lower peakamplitude, but higher than the case of 20% cathode and 10% anode loss. Allpeaks are shifted to lower potentials.
To summarize, although this theoretically constructed material loss is notfully representative for the aging in a battery cell, this gives valid informationin what to expect from the different aging mechanisms. Cathode loss affectsthe capacity to a grater extent than anode loss, and the anode loss induceslarger shift in the peak positions.
43
(a) (b)
(c) (d)
(e)
Figure 4.3: ICA from simulations showing how the peaks shift with differentcombinations of loss of active material. First only one-sided material loss issimulated (a) anode loss and (b) cathode loss. Secondly in three differentcombinations; (c) 20% anode loss and 10% cathode loss, (d) 10% anode lossand 20% cathode loss, and (e) 20% loss of both materials. The peaks arenumbered from left to right, 1 to 4.
44
4.4 Aging Simulation Results
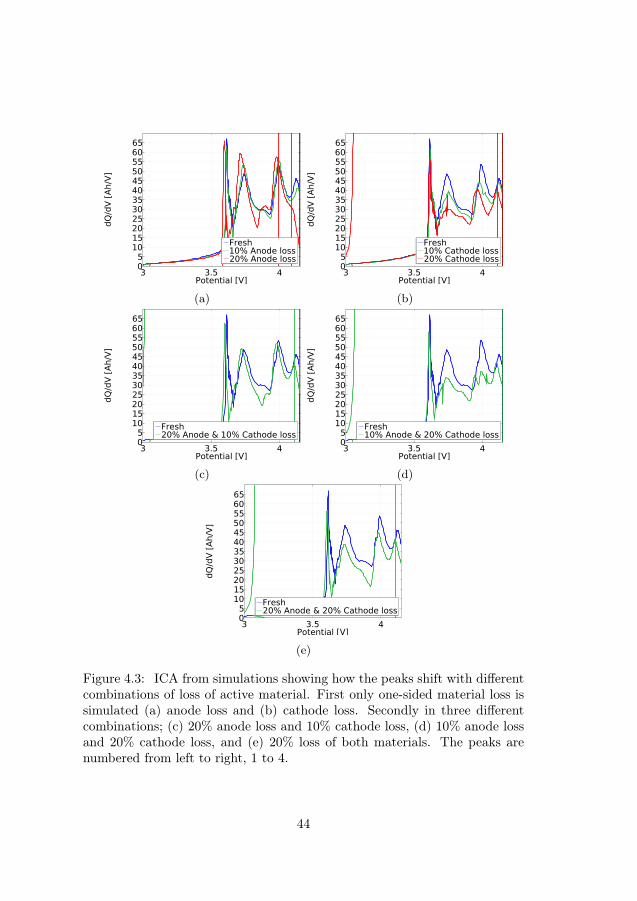
The aging in this model is a result from SEI layer growth, from side reactionson the anode/electrolyte interface. The growth of the SEI results in threedifferent contributions, consumption of cyclable Li+, increased film resistanceon the anode, and decreased volume fraction of the electrolyte. The agingparameters for the SEI reaction were fitted to the capacity loss for the +2C/-2C 0-90% SOC interval in 25C, figure 4.4.
Figure 4.4: Simulated capacity retention, blue line, the aging parameterswere fitted to represent the aging of +2C/-2C 0-90% SOC at 25C, red line.
4.4.1 Consequences of SEI Build up
The capacity retention due to SEI build up is overestimated in the model,since it is the only aging mechanism included all loss has to come from this.Therefore, the simulated SEI thickness is considered to be larger than in theactual cell. Postmortem analysis will hopefully show how thick the layer is.The expected thickness is in the rage 3-300 nm based on literature [30,35].
The thickness of the SEI is depending on the current in each segment ofthe anode, figure 4.5a. During charging the current is highest close to theseparator (sep), at 64.5 µm, and this can be seen in the distribution of thethickness, it is largest at the sep and thinnest at the cc, 0. Therefore, thevolume fractions are presented for both the cc and sep.
The loss of electrolyte contributes to a small resistance increase in themodel, although the main resistance increase is from the SEI layer, figure4.5b and 4.6a. The lost electrolyte volume is filled with SEI, figure 4.6b.
45
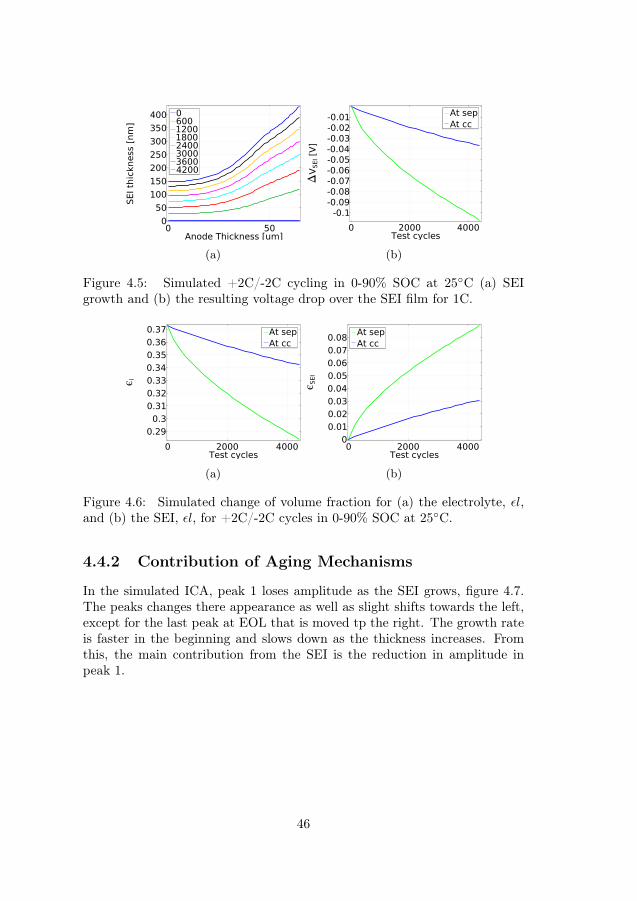
(a) (b)
Figure 4.5: Simulated +2C/-2C cycling in 0-90% SOC at 25C (a) SEIgrowth and (b) the resulting voltage drop over the SEI film for 1C.
(a) (b)
Figure 4.6: Simulated change of volume fraction for (a) the electrolyte, εl,and (b) the SEI, εl, for +2C/-2C cycles in 0-90% SOC at 25C.
4.4.2 Contribution of Aging Mechanisms
In the simulated ICA, peak 1 loses amplitude as the SEI grows, figure 4.7.The peaks changes there appearance as well as slight shifts towards the left,except for the last peak at EOL that is moved tp the right. The growth rateis faster in the beginning and slows down as the thickness increases. Fromthis, the main contribution from the SEI is the reduction in amplitude inpeak 1.
46
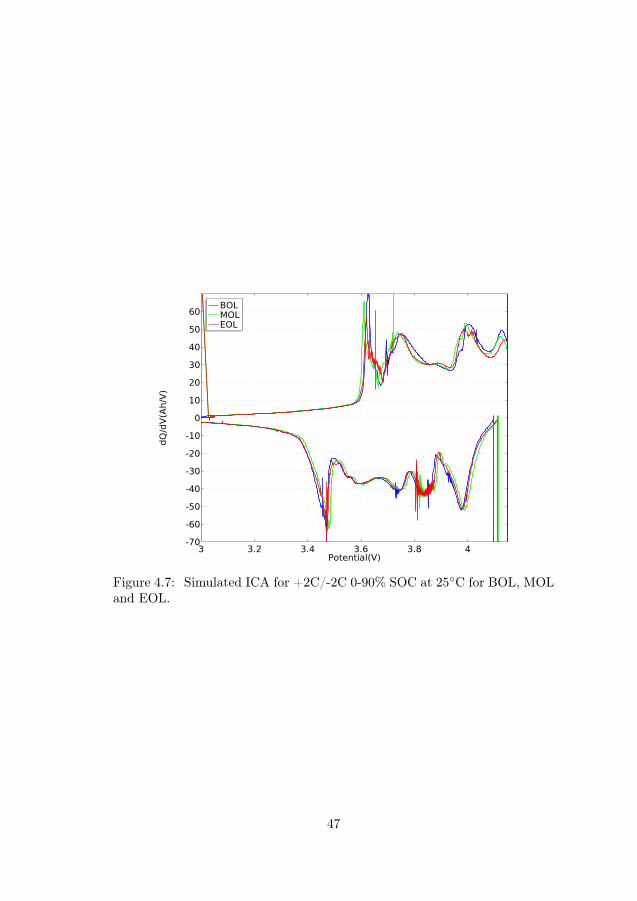
Figure 4.7: Simulated ICA for +2C/-2C 0-90% SOC at 25C for BOL, MOLand EOL.
47

48
Chapter 5
Battery Aging
The results from the cycle and calendar aging tests are presented in thischapter. The effect of several different parameters, such as temperature,C-rate, SOC level and DOD, has been investigated. All cycling data arerecalculated and presented as FCE for a straight forward comparison of testresults.
5.1 Lifetime Aging Tests
The lifetime cycling was performed in four different DOD, 10%, 60%, 80% and90%. For the targeted application, a 100% DOD is not under considerationand has, therefore, not been included in the test matrix. The focus has beenon studying the effects of different SOC levels and C-rates, where charge ratesand discharge rates are noted with +XC respectively -XC.
For cells cycled during long time periods two data points can be seenfor the same cycle number, this indicates that the cell has been in roomtemperature for 1 month during vacation time, one RPT before and oneafter the vacation period. The resistance displayed in this chapter is the50% SOC 10s 5C discharge resistance. The given temperatures in the figuresare the average cycling temperatures. The various test protocols give rise todifferent temperature increases, the resulting cell temperatures are thereforenot the same as the climate chambers temperature.
As the temperature is an important factor in the aging process, calendaraging at 25, 35 and 45C and at 15, 75 and 90% SOC were performed. Atotal of 18 cells were tested, including replicas.
49
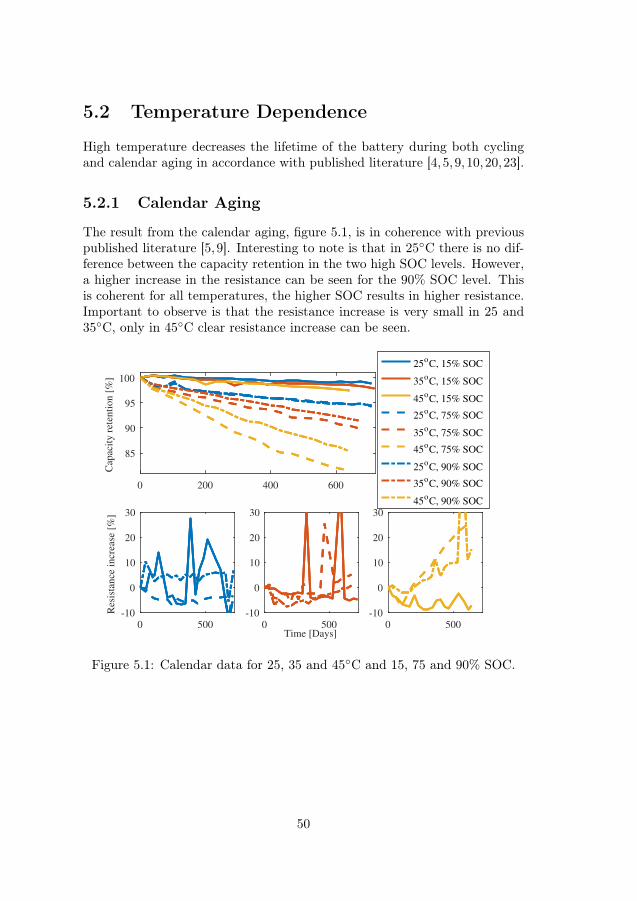
5.2 Temperature Dependence
High temperature decreases the lifetime of the battery during both cyclingand calendar aging in accordance with published literature [4,5,9,10,20,23].
5.2.1 Calendar Aging
The result from the calendar aging, figure 5.1, is in coherence with previouspublished literature [5,9]. Interesting to note is that in 25C there is no dif-ference between the capacity retention in the two high SOC levels. However,a higher increase in the resistance can be seen for the 90% SOC level. Thisis coherent for all temperatures, the higher SOC results in higher resistance.Important to observe is that the resistance increase is very small in 25 and35C, only in 45C clear resistance increase can be seen.
0 500-10
0
10
20
30
Res
ista
nce
incr
ease
[%
]
0 200 400 600
85
90
95
100
Cap
acit
y r
eten
tion [
%]
25oC, 15% SOC
35oC, 15% SOC
45oC, 15% SOC
25oC, 75% SOC
35oC, 75% SOC
45oC, 75% SOC
25oC, 90% SOC
35oC, 90% SOC
45oC, 90% SOC
0 500Time [Days]
-10
0
10
20
30
0 500-10
0
10
20
30
Figure 5.1: Calendar data for 25, 35 and 45C and 15, 75 and 90% SOC.
50
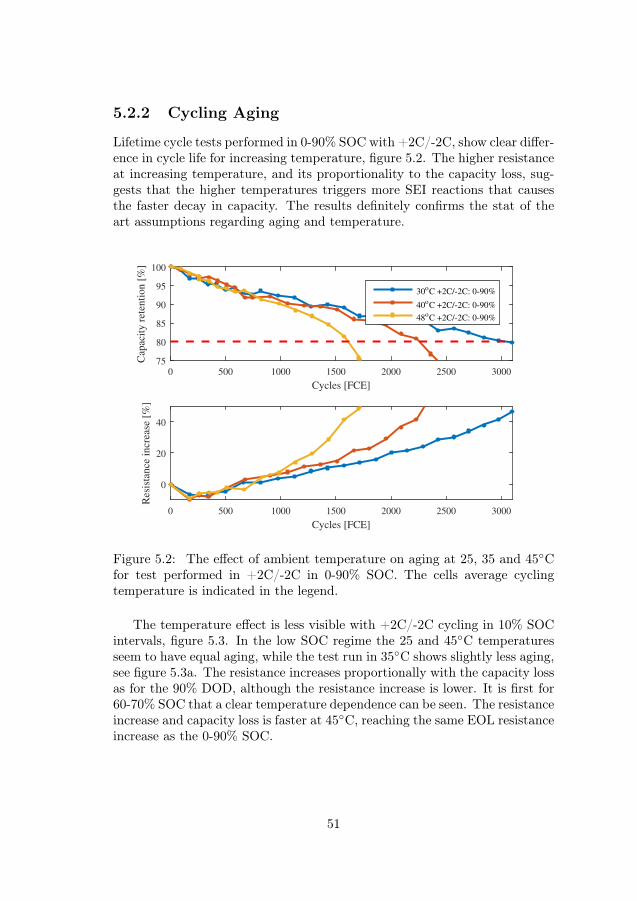
5.2.2 Cycling Aging
Lifetime cycle tests performed in 0-90% SOC with +2C/-2C, show clear differ-ence in cycle life for increasing temperature, figure 5.2. The higher resistanceat increasing temperature, and its proportionality to the capacity loss, sug-gests that the higher temperatures triggers more SEI reactions that causesthe faster decay in capacity. The results definitely confirms the stat of theart assumptions regarding aging and temperature.
0 500 1000 1500 2000 2500 3000
Cycles [FCE]
75
80
85
90
95
100
Cap
acit
y r
eten
tion [
%]
30oC +2C/-2C: 0-90%
40oC +2C/-2C: 0-90%
48oC +2C/-2C: 0-90%
0 500 1000 1500 2000 2500 3000
Cycles [FCE]
0
20
40
Res
ista
nce
incr
ease
[%
]
Figure 5.2: The effect of ambient temperature on aging at 25, 35 and 45Cfor test performed in +2C/-2C in 0-90% SOC. The cells average cyclingtemperature is indicated in the legend.
The temperature effect is less visible with +2C/-2C cycling in 10% SOCintervals, figure 5.3. In the low SOC regime the 25 and 45C temperaturesseem to have equal aging, while the test run in 35C shows slightly less aging,see figure 5.3a. The resistance increases proportionally with the capacity lossas for the 90% DOD, although the resistance increase is lower. It is first for60-70% SOC that a clear temperature dependence can be seen. The resistanceincrease and capacity loss is faster at 45C, reaching the same EOL resistanceincrease as the 0-90% SOC.
51
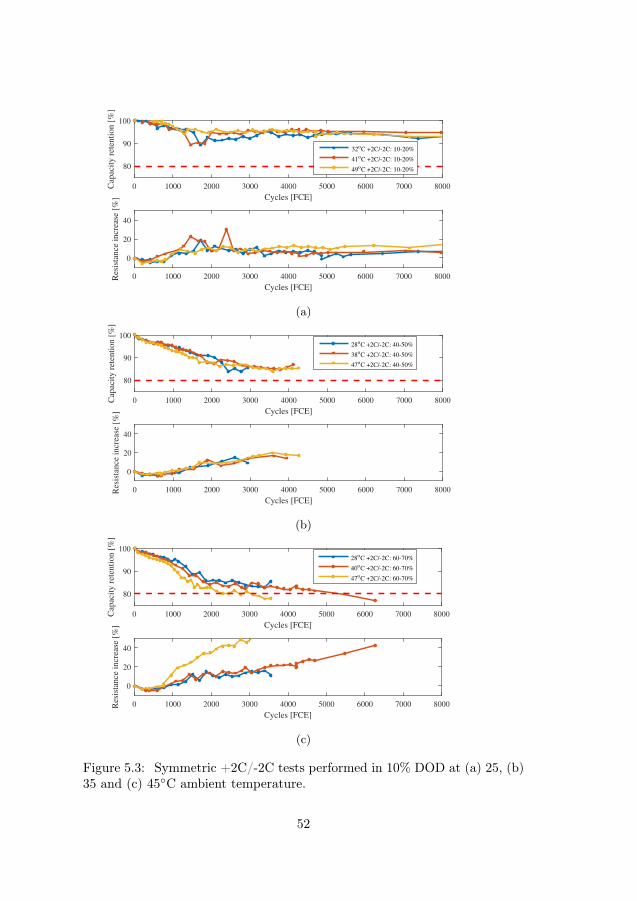
0 1000 2000 3000 4000 5000 6000 7000 8000
Cycles [FCE]
80
90
100
Cap
acit
y r
eten
tio
n [
%]
32oC +2C/-2C: 10-20%
41oC +2C/-2C: 10-20%
49oC +2C/-2C: 10-20%
0 1000 2000 3000 4000 5000 6000 7000 8000
Cycles [FCE]
0
20
40
Res
ista
nce
in
crea
se [
%]
(a)
0 1000 2000 3000 4000 5000 6000 7000 8000
Cycles [FCE]
80
90
100
Cap
acit
y r
eten
tio
n [
%]
28oC +2C/-2C: 40-50%
38oC +2C/-2C: 40-50%
47oC +2C/-2C: 40-50%
0 1000 2000 3000 4000 5000 6000 7000 8000
Cycles [FCE]
0
20
40
Res
ista
nce
in
crea
se [
%]
(b)
0 1000 2000 3000 4000 5000 6000 7000 8000
Cycles [FCE]
80
90
100
Cap
acit
y r
eten
tio
n [
%]
28oC +2C/-2C: 60-70%
40oC +2C/-2C: 60-70%
47oC +2C/-2C: 60-70%
0 1000 2000 3000 4000 5000 6000 7000 8000
Cycles [FCE]
0
20
40
Res
ista
nce
in
crea
se [
%]
(c)
Figure 5.3: Symmetric +2C/-2C tests performed in 10% DOD at (a) 25, (b)35 and (c) 45C ambient temperature.
52
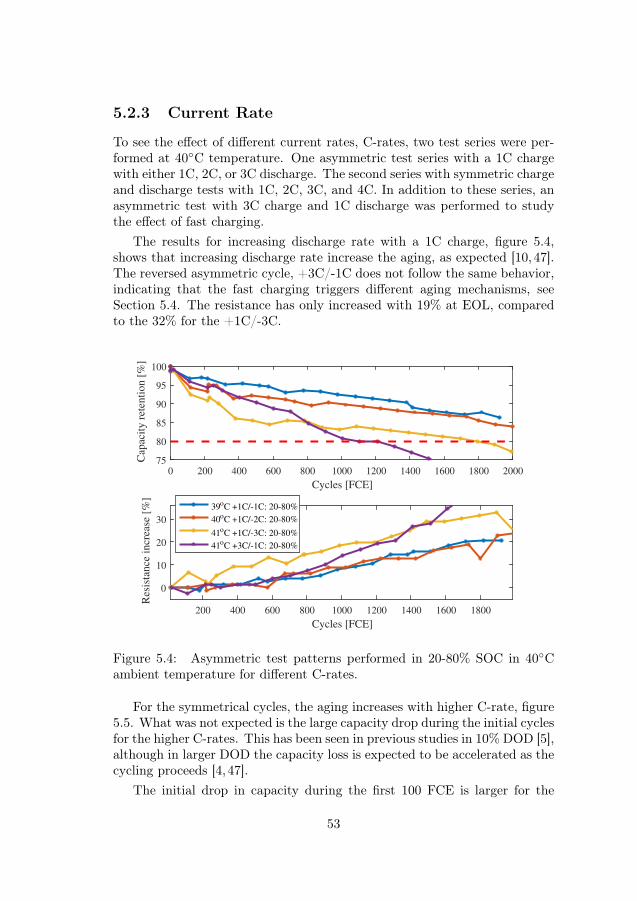
5.2.3 Current Rate
To see the effect of different current rates, C-rates, two test series were per-formed at 40C temperature. One asymmetric test series with a 1C chargewith either 1C, 2C, or 3C discharge. The second series with symmetric chargeand discharge tests with 1C, 2C, 3C, and 4C. In addition to these series, anasymmetric test with 3C charge and 1C discharge was performed to studythe effect of fast charging.
The results for increasing discharge rate with a 1C charge, figure 5.4,shows that increasing discharge rate increase the aging, as expected [10, 47].The reversed asymmetric cycle, +3C/-1C does not follow the same behavior,indicating that the fast charging triggers different aging mechanisms, seeSection 5.4. The resistance has only increased with 19% at EOL, comparedto the 32% for the +1C/-3C.
0 200 400 600 800 1000 1200 1400 1600 1800 2000
Cycles [FCE]
75
80
85
90
95
100
Cap
acit
y r
eten
tion [
%]
200 400 600 800 1000 1200 1400 1600 1800
Cycles [FCE]
0
10
20
30
Res
ista
nce
incr
ease
[%
]
39oC +1C/-1C: 20-80%
40oC +1C/-2C: 20-80%
41oC +1C/-3C: 20-80%
41oC +3C/-1C: 20-80%
Figure 5.4: Asymmetric test patterns performed in 20-80% SOC in 40Cambient temperature for different C-rates.
For the symmetrical cycles, the aging increases with higher C-rate, figure5.5. What was not expected is the large capacity drop during the initial cyclesfor the higher C-rates. This has been seen in previous studies in 10% DOD [5],although in larger DOD the capacity loss is expected to be accelerated as thecycling proceeds [4, 47].
The initial drop in capacity during the first 100 FCE is larger for the
53
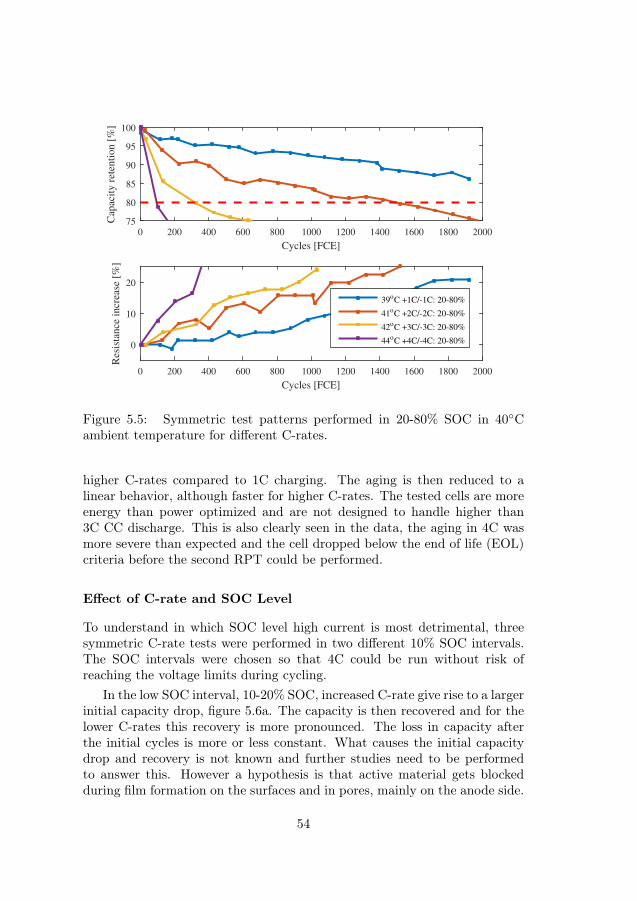
0 200 400 600 800 1000 1200 1400 1600 1800 2000
Cycles [FCE]
75
80
85
90
95
100
Cap
acit
y r
eten
tion [
%]
0 200 400 600 800 1000 1200 1400 1600 1800 2000
Cycles [FCE]
0
10
20
Res
ista
nce
incr
ease
[%
]
39oC +1C/-1C: 20-80%
41oC +2C/-2C: 20-80%
42oC +3C/-3C: 20-80%
44oC +4C/-4C: 20-80%
Figure 5.5: Symmetric test patterns performed in 20-80% SOC in 40Cambient temperature for different C-rates.
higher C-rates compared to 1C charging. The aging is then reduced to alinear behavior, although faster for higher C-rates. The tested cells are moreenergy than power optimized and are not designed to handle higher than3C CC discharge. This is also clearly seen in the data, the aging in 4C wasmore severe than expected and the cell dropped below the end of life (EOL)criteria before the second RPT could be performed.
Effect of C-rate and SOC Level
To understand in which SOC level high current is most detrimental, threesymmetric C-rate tests were performed in two different 10% SOC intervals.The SOC intervals were chosen so that 4C could be run without risk ofreaching the voltage limits during cycling.
In the low SOC interval, 10-20% SOC, increased C-rate give rise to a largerinitial capacity drop, figure 5.6a. The capacity is then recovered and for thelower C-rates this recovery is more pronounced. The loss in capacity afterthe initial cycles is more or less constant. What causes the initial capacitydrop and recovery is not known and further studies need to be performedto answer this. However a hypothesis is that active material gets blockedduring film formation on the surfaces and in pores, mainly on the anode side.
54
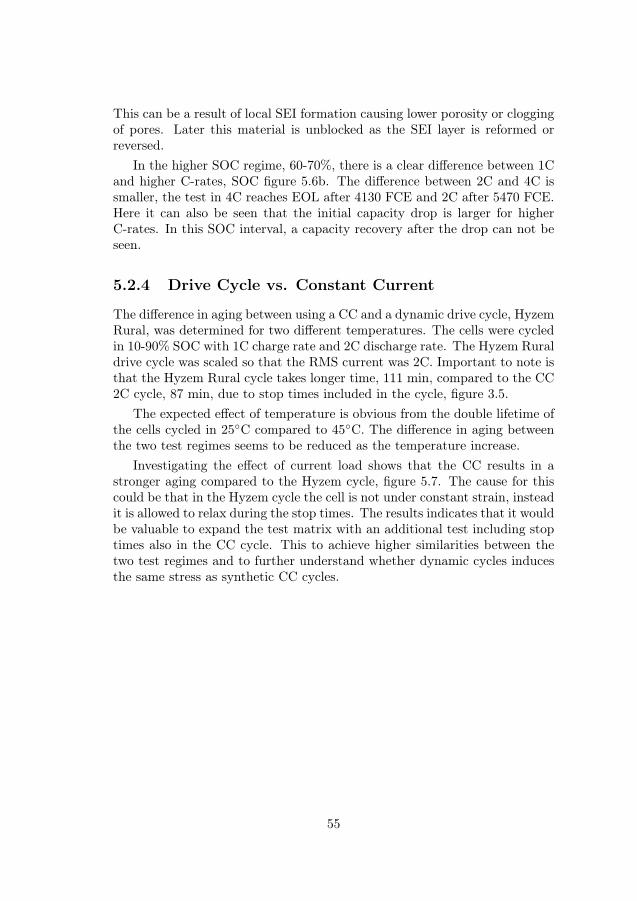
This can be a result of local SEI formation causing lower porosity or cloggingof pores. Later this material is unblocked as the SEI layer is reformed orreversed.
In the higher SOC regime, 60-70%, there is a clear difference between 1Cand higher C-rates, SOC figure 5.6b. The difference between 2C and 4C issmaller, the test in 4C reaches EOL after 4130 FCE and 2C after 5470 FCE.Here it can also be seen that the initial capacity drop is larger for higherC-rates. In this SOC interval, a capacity recovery after the drop can not beseen.
5.2.4 Drive Cycle vs. Constant Current
The difference in aging between using a CC and a dynamic drive cycle, HyzemRural, was determined for two different temperatures. The cells were cycledin 10-90% SOC with 1C charge rate and 2C discharge rate. The Hyzem Ruraldrive cycle was scaled so that the RMS current was 2C. Important to note isthat the Hyzem Rural cycle takes longer time, 111 min, compared to the CC2C cycle, 87 min, due to stop times included in the cycle, figure 3.5.
The expected effect of temperature is obvious from the double lifetime ofthe cells cycled in 25C compared to 45C. The difference in aging betweenthe two test regimes seems to be reduced as the temperature increase.
Investigating the effect of current load shows that the CC results in astronger aging compared to the Hyzem cycle, figure 5.7. The cause for thiscould be that in the Hyzem cycle the cell is not under constant strain, insteadit is allowed to relax during the stop times. The results indicates that it wouldbe valuable to expand the test matrix with an additional test including stoptimes also in the CC cycle. This to achieve higher similarities between thetwo test regimes and to further understand whether dynamic cycles inducesthe same stress as synthetic CC cycles.
55
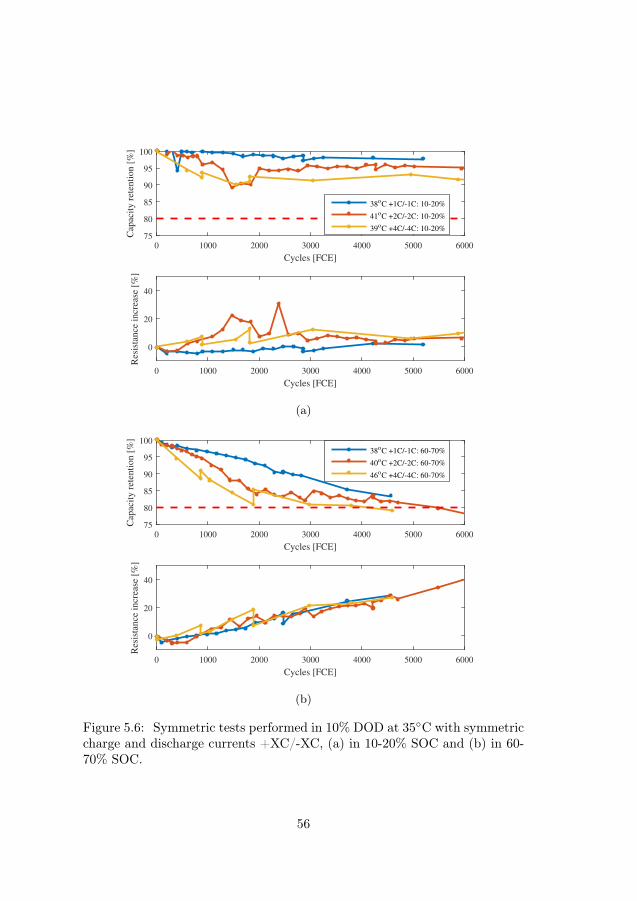
0 1000 2000 3000 4000 5000 6000
Cycles [FCE]
75
80
85
90
95
100
Cap
acit
y r
eten
tion [
%]
38oC +1C/-1C: 10-20%
41oC +2C/-2C: 10-20%
39oC +4C/-4C: 10-20%
0 1000 2000 3000 4000 5000 6000
Cycles [FCE]
0
20
40
Res
ista
nce
incr
ease
[%
]
(a)
0 1000 2000 3000 4000 5000 6000
Cycles [FCE]
75
80
85
90
95
100
Cap
acit
y r
eten
tion [
%]
38oC +1C/-1C: 60-70%
40oC +2C/-2C: 60-70%
46oC +4C/-4C: 60-70%
0 1000 2000 3000 4000 5000 6000
Cycles [FCE]
0
20
40
Res
ista
nce
incr
ease
[%
]
(b)
Figure 5.6: Symmetric tests performed in 10% DOD at 35C with symmetriccharge and discharge currents +XC/-XC, (a) in 10-20% SOC and (b) in 60-70% SOC.
56
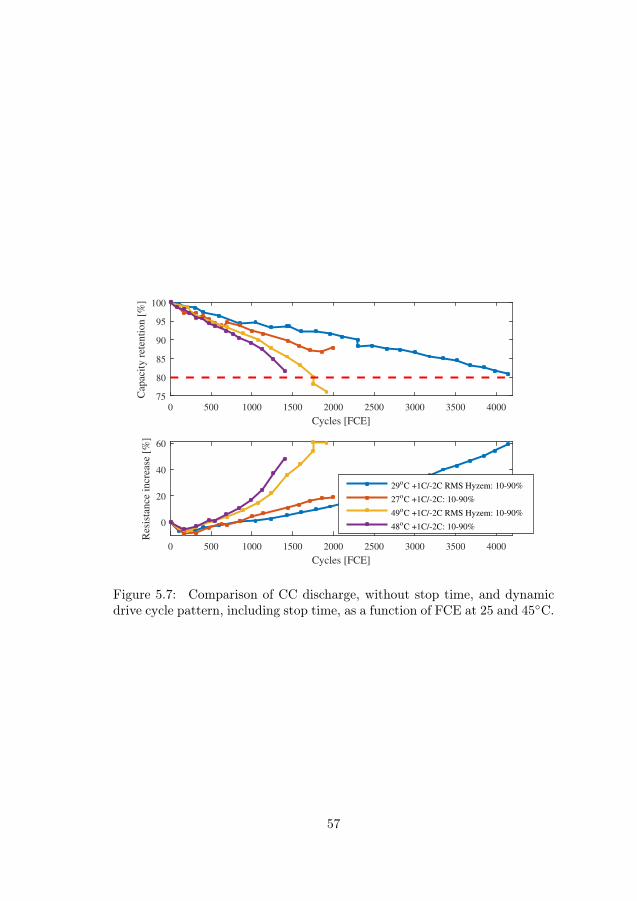
0 500 1000 1500 2000 2500 3000 3500 4000
Cycles [FCE]
75
80
85
90
95
100
Cap
acit
y r
eten
tion [
%]
0 500 1000 1500 2000 2500 3000 3500 4000
Cycles [FCE]
0
20
40
60
Res
ista
nce
incr
ease
[%
]
29oC +1C/-2C RMS Hyzem: 10-90%
27oC +1C/-2C: 10-90%
49oC +1C/-2C RMS Hyzem: 10-90%
48oC +1C/-2C: 10-90%
Figure 5.7: Comparison of CC discharge, without stop time, and dynamicdrive cycle pattern, including stop time, as a function of FCE at 25 and 45C.
57
5.3 Aging Dependence of SOC
When establishing the SOC window for an application there are several pa-rameters to be considered, DOD, SOC interval placement, and applicationrequirements. As was seen from the calendar aging, the SOC level has astrong correlation to the aging of the cell.
5.3.1 Aging in Small SOC Intervals
To understand in what SOC level the aging is most severe during cycling,tests in different 10% SOC intervals were performed at three temperatures;25, 35 and 45C. All SOC intervals in Table 3.4 were not included for all tem-peratures, however, the selection presented is assumed to cover the importantfindings.
There is a clear separation between the results originating from the lowand high SOC intervals, figure 5.8. In the higher SOC intervals a more rapidaging can be observed compared to the lower SOC intervals. The previouslydescribed behavior with an initial capacity drop followed by a capacity re-covery is clearly seen for the low SOC intervals. As previously stated, thehypothesis is that reformation of the SEI or reversible SEI reactions takeplace and anode material previously blocked by SEI layer is unblocked.
After the recovery, the cells are stabilizing on a capacity level above 90%,at 35C even above 95%. What causes the stability in capacity over suchextended number of cycles is not yet understood, and will be addressed byfurther studies including postmortem analysis. The hypothesis is that theSEI formed is very stable, the small SOC interval give rise only to smallanode material expansions, which leaves the SEI intact, or with very fewcracks. Therefore, the additional SEI formed, which is the main source forcapacity loss, is limited. The resistance increase follows the coherent patternproportional to the capacity loss but is not explicitly shown here, see figure5.3 for the resistance of nine of the cells.
High SOC has been proven to increase side reactions forming SEI layeron the anode side [8, 31]. This is also seen in the aging patterns, where highSOC shows more rapid aging. Above 60% SOC no large differences in agingcan be seen while 40-50% SOC shows slightly less aging. For the low SOCintervals only very moderate aging is observed.
58
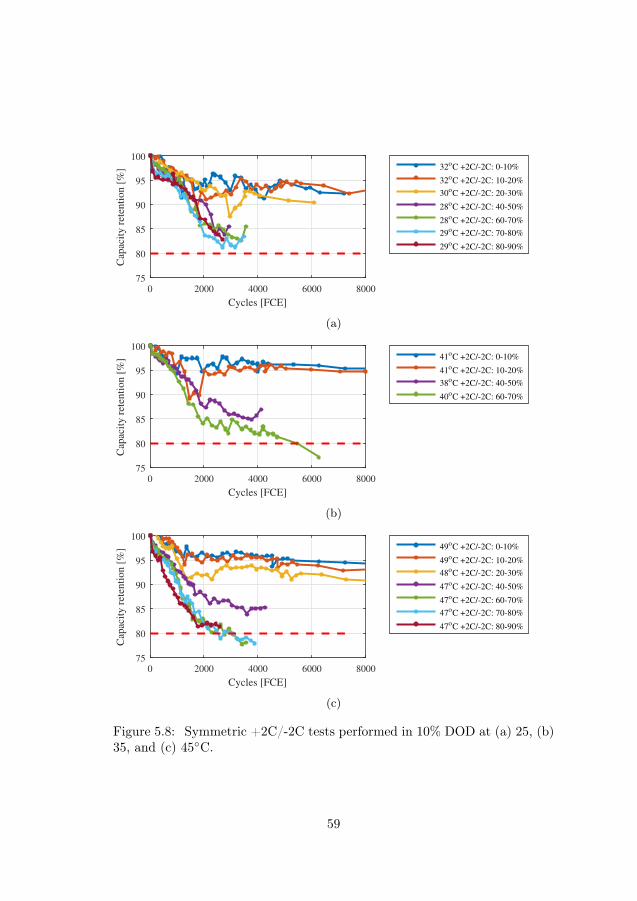
0 2000 4000 6000 8000
Cycles [FCE]
75
80
85
90
95
100
Cap
acit
y r
eten
tion [
%] 32oC +2C/-2C: 0-10%
32oC +2C/-2C: 10-20%
30oC +2C/-2C: 20-30%
28oC +2C/-2C: 40-50%
28oC +2C/-2C: 60-70%
29oC +2C/-2C: 70-80%
29oC +2C/-2C: 80-90%
(a)
0 2000 4000 6000 8000
Cycles [FCE]
75
80
85
90
95
100
Cap
acit
y r
eten
tion [
%] 41oC +2C/-2C: 0-10%
41oC +2C/-2C: 10-20%
38oC +2C/-2C: 40-50%
40oC +2C/-2C: 60-70%
(b)
0 2000 4000 6000 8000
Cycles [FCE]
75
80
85
90
95
100
Cap
acit
y r
eten
tion [
%] 49oC +2C/-2C: 0-10%
49oC +2C/-2C: 10-20%
48oC +2C/-2C: 20-30%
47oC +2C/-2C: 40-50%
47oC +2C/-2C: 60-70%
47oC +2C/-2C: 70-80%
47oC +2C/-2C: 80-90%
(c)
Figure 5.8: Symmetric +2C/-2C tests performed in 10% DOD at (a) 25, (b)35, and (c) 45C.
59
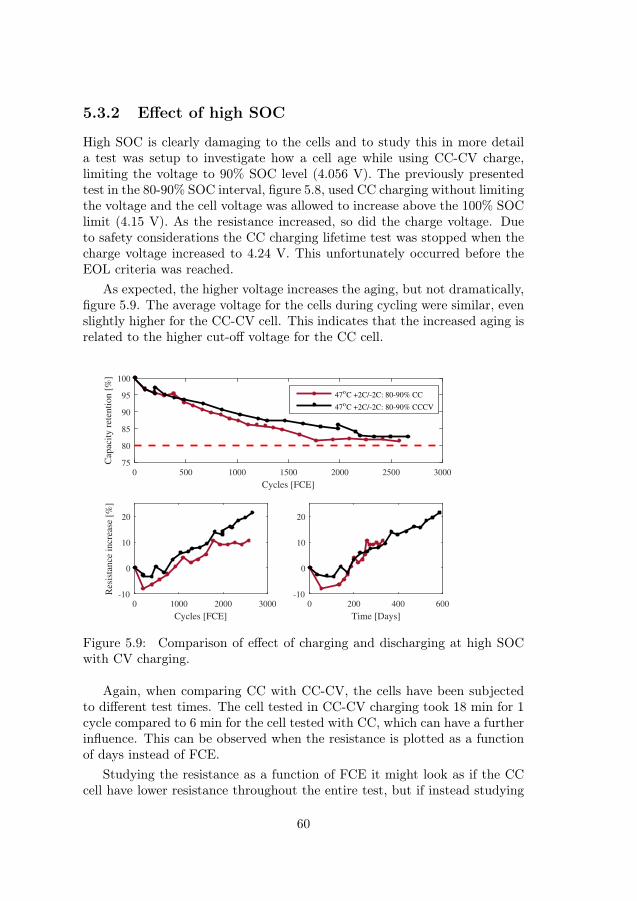
5.3.2 Effect of high SOC
High SOC is clearly damaging to the cells and to study this in more detaila test was setup to investigate how a cell age while using CC-CV charge,limiting the voltage to 90% SOC level (4.056 V). The previously presentedtest in the 80-90% SOC interval, figure 5.8, used CC charging without limitingthe voltage and the cell voltage was allowed to increase above the 100% SOClimit (4.15 V). As the resistance increased, so did the charge voltage. Dueto safety considerations the CC charging lifetime test was stopped when thecharge voltage increased to 4.24 V. This unfortunately occurred before theEOL criteria was reached.
As expected, the higher voltage increases the aging, but not dramatically,figure 5.9. The average voltage for the cells during cycling were similar, evenslightly higher for the CC-CV cell. This indicates that the increased aging isrelated to the higher cut-off voltage for the CC cell.
0 500 1000 1500 2000 2500 3000
Cycles [FCE]
75
80
85
90
95
100
Cap
acit
y r
eten
tion [
%]
47oC +2C/-2C: 80-90% CC
47oC +2C/-2C: 80-90% CCCV
0 1000 2000 3000
Cycles [FCE]
-10
0
10
20
Res
ista
nce
incr
ease
[%
]
0 200 400 600
Time [Days]
-10
0
10
20
Figure 5.9: Comparison of effect of charging and discharging at high SOCwith CV charging.
Again, when comparing CC with CC-CV, the cells have been subjectedto different test times. The cell tested in CC-CV charging took 18 min for 1cycle compared to 6 min for the cell tested with CC, which can have a furtherinfluence. This can be observed when the resistance is plotted as a functionof days instead of FCE.
Studying the resistance as a function of FCE it might look as if the CCcell have lower resistance throughout the entire test, but if instead studying
60
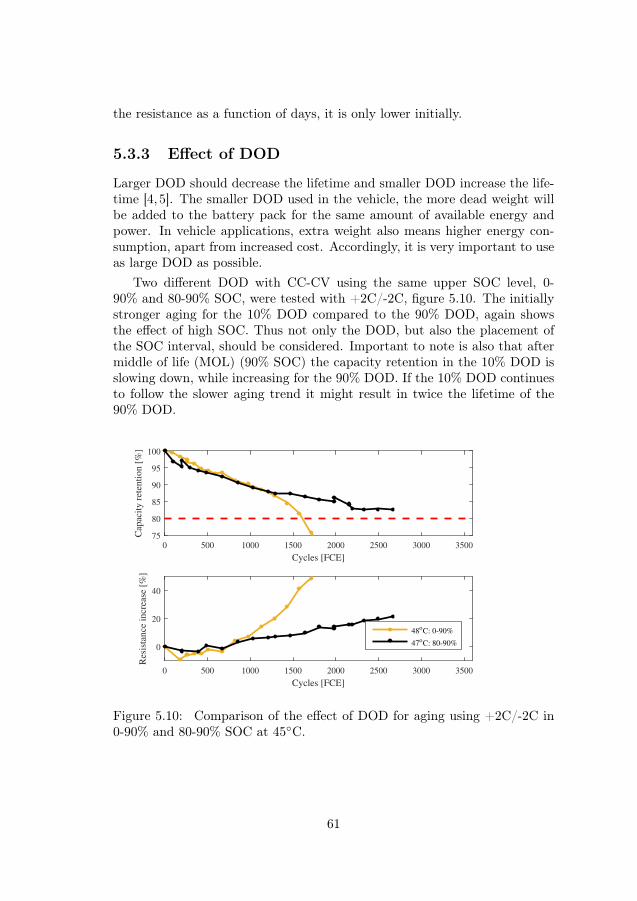
the resistance as a function of days, it is only lower initially.
5.3.3 Effect of DOD
Larger DOD should decrease the lifetime and smaller DOD increase the life-time [4, 5]. The smaller DOD used in the vehicle, the more dead weight willbe added to the battery pack for the same amount of available energy andpower. In vehicle applications, extra weight also means higher energy con-sumption, apart from increased cost. Accordingly, it is very important to useas large DOD as possible.
Two different DOD with CC-CV using the same upper SOC level, 0-90% and 80-90% SOC, were tested with +2C/-2C, figure 5.10. The initiallystronger aging for the 10% DOD compared to the 90% DOD, again showsthe effect of high SOC. Thus not only the DOD, but also the placement ofthe SOC interval, should be considered. Important to note is also that aftermiddle of life (MOL) (90% SOC) the capacity retention in the 10% DOD isslowing down, while increasing for the 90% DOD. If the 10% DOD continuesto follow the slower aging trend it might result in twice the lifetime of the90% DOD.
0 500 1000 1500 2000 2500 3000 3500
Cycles [FCE]
75
80
85
90
95
100
Cap
acit
y r
eten
tion [
%]
0 500 1000 1500 2000 2500 3000 3500
Cycles [FCE]
0
20
40
Res
ista
nce
incr
ease
[%
]
48oC: 0-90%
47oC: 80-90%
Figure 5.10: Comparison of the effect of DOD for aging using +2C/-2C in0-90% and 80-90% SOC at 45C.
61
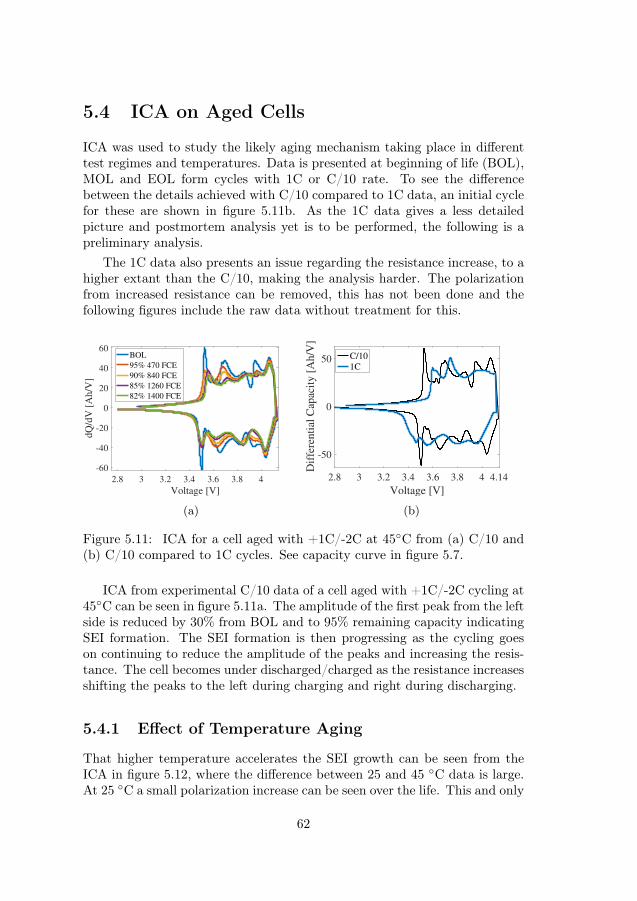
5.4 ICA on Aged Cells
ICA was used to study the likely aging mechanism taking place in differenttest regimes and temperatures. Data is presented at beginning of life (BOL),MOL and EOL form cycles with 1C or C/10 rate. To see the differencebetween the details achieved with C/10 compared to 1C data, an initial cyclefor these are shown in figure 5.11b. As the 1C data gives a less detailedpicture and postmortem analysis yet is to be performed, the following is apreliminary analysis.
The 1C data also presents an issue regarding the resistance increase, to ahigher extant than the C/10, making the analysis harder. The polarizationfrom increased resistance can be removed, this has not been done and thefollowing figures include the raw data without treatment for this.
2.8 3 3.2 3.4 3.6 3.8 4
Voltage [V]
-60
-40
-20
0
20
40
60
dQ
/dV
[A
h/V
]
BOL
95% 470 FCE
90% 840 FCE
85% 1260 FCE
82% 1400 FCE
(a)
2.8 3 3.2 3.4 3.6 3.8 4 4.14
Voltage [V]
-50
0
50
Dif
fere
nti
al C
apac
ity
[A
h/V
]
C/10
1C
(b)
Figure 5.11: ICA for a cell aged with +1C/-2C at 45C from (a) C/10 and(b) C/10 compared to 1C cycles. See capacity curve in figure 5.7.
ICA from experimental C/10 data of a cell aged with +1C/-2C cycling at45C can be seen in figure 5.11a. The amplitude of the first peak from the leftside is reduced by 30% from BOL and to 95% remaining capacity indicatingSEI formation. The SEI formation is then progressing as the cycling goeson continuing to reduce the amplitude of the peaks and increasing the resis-tance. The cell becomes under discharged/charged as the resistance increasesshifting the peaks to the left during charging and right during discharging.
5.4.1 Effect of Temperature Aging
That higher temperature accelerates the SEI growth can be seen from theICA in figure 5.12, where the difference between 25 and 45 C data is large.At 25 C a small polarization increase can be seen over the life. This and only
62
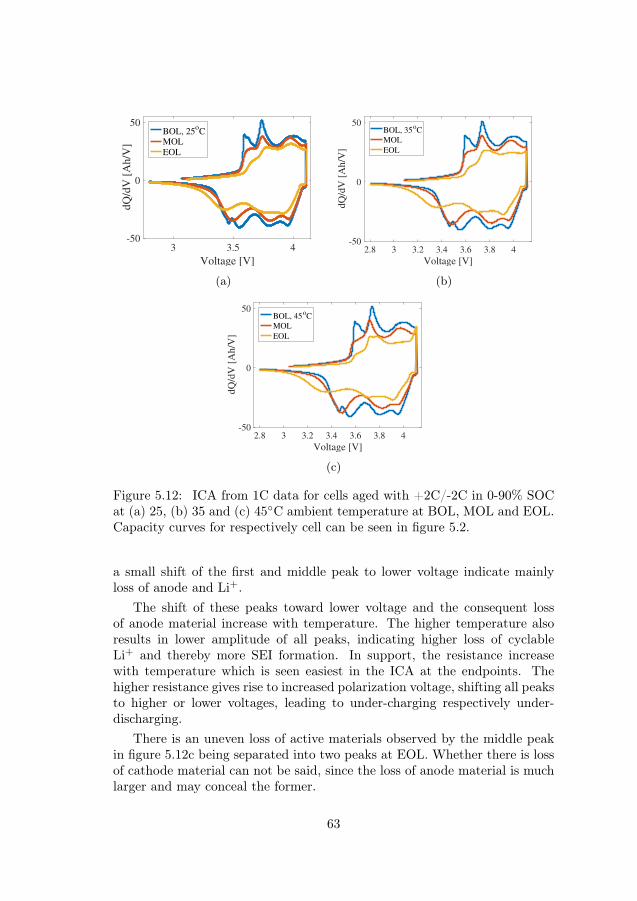
3 3.5 4
Voltage [V]
-50
0
50d
Q/d
V [
Ah
/V]
BOL, 25oC
MOL
EOL
(a)
2.8 3 3.2 3.4 3.6 3.8 4
Voltage [V]
-50
0
50
dQ
/dV
[A
h/V
]
BOL, 35oC
MOL
EOL
(b)
2.8 3 3.2 3.4 3.6 3.8 4
Voltage [V]
-50
0
50
dQ
/dV
[A
h/V
]
BOL, 45oC
MOL
EOL
(c)
Figure 5.12: ICA from 1C data for cells aged with +2C/-2C in 0-90% SOCat (a) 25, (b) 35 and (c) 45C ambient temperature at BOL, MOL and EOL.Capacity curves for respectively cell can be seen in figure 5.2.
a small shift of the first and middle peak to lower voltage indicate mainlyloss of anode and Li+.
The shift of these peaks toward lower voltage and the consequent lossof anode material increase with temperature. The higher temperature alsoresults in lower amplitude of all peaks, indicating higher loss of cyclableLi+ and thereby more SEI formation. In support, the resistance increasewith temperature which is seen easiest in the ICA at the endpoints. Thehigher resistance gives rise to increased polarization voltage, shifting all peaksto higher or lower voltages, leading to under-charging respectively under-discharging.
There is an uneven loss of active materials observed by the middle peakin figure 5.12c being separated into two peaks at EOL. Whether there is lossof cathode material can not be said, since the loss of anode material is muchlarger and may conceal the former.
63
5.4.2 Effect of SOC Interval
The ICA for 10% intervals cycled with +2C/-2C at 35C shows a clear trend,figure 5.13. The higher SOC interval, 60-70% SOC, shows a large loss ofamplitude in all peaks in combination with a higher polarization voltageindicating loss of Li+ and SEI formation. Strong indicators are the rapidamplitude loss of the first peak and a shift to the left of the middle peak athigher SOC.
For the middle SOC interval the first peak is visible, but shifted to ahigher voltage, towards the middle peak, indicating smaller SEI formationand anode loss. The total capacity loss is less than at high SOC and a slightrecovery of the capacity is seen after 2200 FCE, just after MOL. The cell hasnot yet reached EOL and seem to have stabilized at 85% capacity.
The low SOC interval, 10-20%, will not reach EOL within the scope ofthis project, maybe not even MOL. After 1500 FCE there is loss of anodematerial and to some extent also loss of Li+. The cell then regains the loss ofanode material, although not completely. This supports the hypothesis thatanode material gets blocked or in other way hindered from participating inthe cell reactions and not irreversibly lost. The cell stabilizes and very littlechange can be seen between 2200 and 8000 FCE.
64
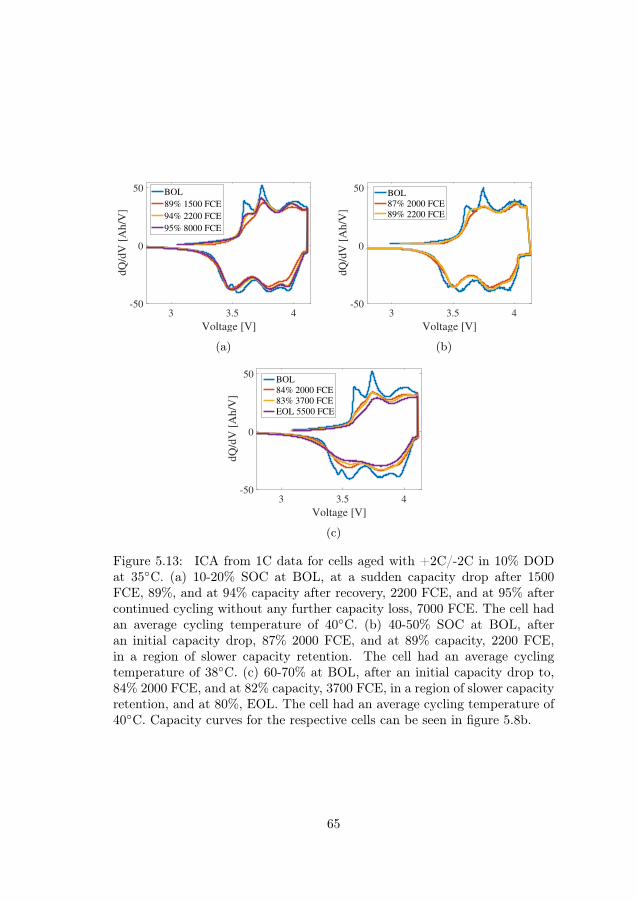
3 3.5 4
Voltage [V]
-50
0
50
dQ
/dV
[A
h/V
]
BOL
89% 1500 FCE
94% 2200 FCE
95% 8000 FCE
(a)
3 3.5 4
Voltage [V]
-50
0
50
dQ
/dV
[A
h/V
]
BOL
87% 2000 FCE
89% 2200 FCE
(b)
3 3.5 4
Voltage [V]
-50
0
50
dQ
/dV
[A
h/V
]
BOL
84% 2000 FCE
83% 3700 FCE
EOL 5500 FCE
(c)
Figure 5.13: ICA from 1C data for cells aged with +2C/-2C in 10% DODat 35C. (a) 10-20% SOC at BOL, at a sudden capacity drop after 1500FCE, 89%, and at 94% capacity after recovery, 2200 FCE, and at 95% aftercontinued cycling without any further capacity loss, 7000 FCE. The cell hadan average cycling temperature of 40C. (b) 40-50% SOC at BOL, afteran initial capacity drop, 87% 2000 FCE, and at 89% capacity, 2200 FCE,in a region of slower capacity retention. The cell had an average cyclingtemperature of 38C. (c) 60-70% at BOL, after an initial capacity drop to,84% 2000 FCE, and at 82% capacity, 3700 FCE, in a region of slower capacityretention, and at 80%, EOL. The cell had an average cycling temperature of40C. Capacity curves for the respective cells can be seen in figure 5.8b.
65
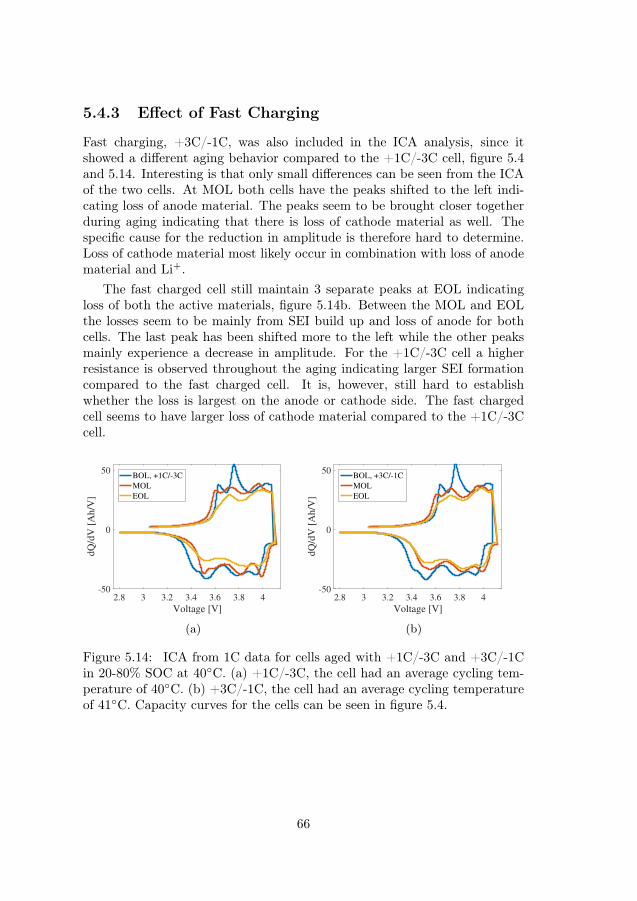
5.4.3 Effect of Fast Charging
Fast charging, +3C/-1C, was also included in the ICA analysis, since itshowed a different aging behavior compared to the +1C/-3C cell, figure 5.4and 5.14. Interesting is that only small differences can be seen from the ICAof the two cells. At MOL both cells have the peaks shifted to the left indi-cating loss of anode material. The peaks seem to be brought closer togetherduring aging indicating that there is loss of cathode material as well. Thespecific cause for the reduction in amplitude is therefore hard to determine.Loss of cathode material most likely occur in combination with loss of anodematerial and Li+.
The fast charged cell still maintain 3 separate peaks at EOL indicatingloss of both the active materials, figure 5.14b. Between the MOL and EOLthe losses seem to be mainly from SEI build up and loss of anode for bothcells. The last peak has been shifted more to the left while the other peaksmainly experience a decrease in amplitude. For the +1C/-3C cell a higherresistance is observed throughout the aging indicating larger SEI formationcompared to the fast charged cell. It is, however, still hard to establishwhether the loss is largest on the anode or cathode side. The fast chargedcell seems to have larger loss of cathode material compared to the +1C/-3Ccell.
2.8 3 3.2 3.4 3.6 3.8 4
Voltage [V]
-50
0
50
dQ
/dV
[A
h/V
]
BOL, +1C/-3C
MOL
EOL
(a)
2.8 3 3.2 3.4 3.6 3.8 4
Voltage [V]
-50
0
50
dQ
/dV
[A
h/V
]
BOL, +3C/-1C
MOL
EOL
(b)
Figure 5.14: ICA from 1C data for cells aged with +1C/-3C and +3C/-1Cin 20-80% SOC at 40C. (a) +1C/-3C, the cell had an average cycling tem-perature of 40C. (b) +3C/-1C, the cell had an average cycling temperatureof 41C. Capacity curves for the cells can be seen in figure 5.4.
66
Chapter 6
Conclusions
In this thesis an extensive test matrix for commercial cells is presented to-gether with a physics-based aging model. The results from the lifetime cy-cling tests showed the expected temperature dependence for 90% DOD, thathigher temperature degrades the battery faster, while a different and interest-ing observation was made with 10% DOD. The temperature dependence hadlittle effect within SOC intervals having a maximum lower than 50%. Theexpected temperature dependence could first be observed above 50% SOCand only at temperatures higher than 40C.
When comparing the Hyzem Rural drive cycle to the synthetic CC cycle,the lifetime cycling test results showed that the Hyzem Rural drive cycle isless detrimental compared to the CC cycle with the same RMS current asC-rate.
The study also confirm that operating at high SOC levels lead to morerapid aging; only moderate aging could be observed in the low SOC intervals,while more rapid aging was noted for SOC intervals higher than 40% SOC.For 60% SOC and above that are no large differences.
Several of the 10% DOD tests in low SOC intervals showed an initialcapacity drop followed by a regain and a stabilization of the capacity, thus,experiencing only minimal aging overall. The author’s hypothesis is thatanode material gets blocked or is in some other way reversibly hindered fromparticipating in the cell reactions. This hypothesis is supported by the ICAmade at the capacity drop and after the recovery.
67

68
Chapter 7
Future Work
During the progress of this work several phenomena have been identified thatrequire further studies for a better understanding. Some gaps in the lifetimeaging test matrix should be filled for a more complete picture.
Additional tests to investigate the cause for the initial capacity drop andsudden recovery in capacity for the 10% SOC intervals is of interest. Furthermore, continued testing of all 10% SOC intervals, including 30-40, 50-60%SOC, and including the so far note tested intermediate intervals, such as 35-45% SOC, should be performed. The latter in order to understand at whatSOC the SEI reactions start to occur.
For a deeper understanding of the differences between the dynamic andsynthetic cycles, tests with an additional synthetic CC cycle, with pausessimilar to the Hyzem Rural drive cycle, is of interest. This would allow amore coherent comparison between the CC and application governed cycles.
To be able to monitor the aging with ICA during the cycling it is recom-mended to use data from a C/10 cycle. Therefore, changing the RPT testto include a C/10 cycle is planned for all future testing. A need to furtherdevelop test procedures to make the lifetime testing more efficient is also onthe improvment list. The method for testing in small SOC intervals is to bedeveloped to make testing more automated, but without reducing the levelof control.
In order to limit the extent of lifetime tests further development of thephysic-based models is needed. There are several aspects to address; deter-mining what parameters and material properties that influence the modeledmechanism most is of high importance since parameterization of these modelsis a tedious task. Future work include expanding the model with temperaturedependence for these key parameters.
69
There is little knowledge of how the different aging mechanisms are linked,to be combated by further development of the mathematical descriptions ofthe various aging mechanisms. The most prominent is the SEI growth andthere are several publications regarding this. In this thesis the first stepswere conducted in developing a physics-based aging model. The future workfor the aging model is to couple the SEI growth to the loss of anode material.Also to include metal dissolution from the cathode, since LMO is known torelease Mn2+ at high potentials. As LMO only constitutes ca 30 wt% ofthe cathode, the capacity loss by this mechanism is likely to be small onthe cathode side, although it should have an accelerating effect on the SEIgrowth when reaching the anode side.
Connecting the results of the aging model closer to the vehicle applicationsis a interesting topic that should be perused.
70
References
[1] European Commission, “A European Strategy for low-emissionmobility,” 2016. [Online]. Available: https://ec.europa.eu/clima/policies/transport_sv
[2] O. Johansson, “12 151 nya laddbara bilar i sverige 2016,” 2017.[Online]. Available: http://powercircle.org/nyhet/12-151-nya-laddbara-bilar-sverige-2016/
[3] J. Voelcker, “Electric car battery warranties compared,” R GreenCar-Reports, 2016. [Online]. Available: http://www.greencarreports.com/news/1107864_electric-car-battery-warranties-compared
[4] J. Groot, “State-of-Health Estimation of Li-ion Batteries: Cycle LifeTest Methods,” 2012, licentiatavhandling.
[5] J. Schmalstieg, S. Käbitz, M. Ecker, and D. U. Sauer, “From acceleratedaging tests to a lifetime prediction model: Analyzing lithium-ion batter-ies,” in 2013 World Electric Vehicle Symposium and Exhibition (EVS27),Nov 2013, pp. 1–12.
[6] E. Thomas, H. Case, D. Doughty, R. Jungst, G. Nagasubramanian, andE. Roth, “Accelerated power degradation of Li-ion cells ,” Journal ofPower Sources, vol. 124, no. 1, pp. 254 – 260, 2003.
[7] P. Ramadass, B. Haran, R. White, and B. N. Popov, “Mathematicalmodeling of the capacity fade of Li-ion cells ,” Journal of Power Sources,vol. 123, no. 2, pp. 230 – 240, 2003.
[8] P. Ramadass, B. Haran, P. M. Gomadam, R. White, and B. N. Popov,“Development of First Principles Capacity Fade Model for Li-Ion Cells,”Journal of The Electrochemical Society, vol. 151, no. 2, pp. A196–A203,2004.
71
[9] R. B. Wright, C. G. Motloch, J. R. Belt, J. P. Christophersen, C. D. Ho,R. A. Richardson, I. Bloom, S. A. Jones, V. S. Battaglia, G. L. Henrik-sen, T. Unkelhaeuser, D. Ingersoll, H. L. Case, S. A. Rogers, and R. A.Sutula, “Calendar-and cycle-life studies of advanced technology devel-opment program generation 1 lithium-ion batteries,” Journal of powersources, vol. 110, pp. 445–470, 08/2002 2002.
[10] J. Groot, “State-of-health estimation of li-ion batteries: Ageing models,”Ph.D. dissertation, Chalmers University of Technology, 2014.
[11] G. Ning, R. White, and B. Popov, “A generalized cycle life model ofrechargeable Li-ion batteries,” Electrochimica Acta, vol. 51, pp. 2012–2022, 2006.
[12] M. Meyer, L. Komsiyska, B. Lenz, and C. Agert, “Study of the localSOC distribution in a lithium-ion battery by physical and electrochemi-cal modeling and simulation,” Applied Mathematical Modelling, vol. 37,no. 4, pp. 2016 – 2027, 2013.
[13] M. Doyle, T. F. Fuller, and J. Newman, “Modeling of GalvanostaticCharge and Discharge of the Lithium/Polymer/Insertion Cell,” Journalof The Electrochemical Society, vol. 140, no. 6, pp. 1526–1533, 1993.
[14] R. Darling and J. Newman, “Modeling Side Reactions in CompositeLiyMn2O4 Electrodes,” Journal of The Electrochemical Society, vol. 145,no. 3, pp. 990–998, 1998.
[15] H. Ekström and G. Lindbergh, “A Model for Predicting Capacity Fadedue to SEI Formation in a Commercial Graphite/LiFePO4 Cell,” Journalof The Electrochemical Society, vol. 162, no. 6, pp. A1003–A1007, 2015.
[16] R. Spotnitz, “Simulation of capacity fade in lithium-ion batteries,” Jour-nal of Power Sources, vol. 113, no. 1, pp. 72 – 80, 2003.
[17] H. D. Abruña, Y. Kiya, and J. C. Henderson, “Batteries and electro-chemical capacitors,” Physics Today, vol. 61, no. 12, pp. 43–47, 2008.
[18] H. Berg, Batteries for Electric Vehicles, Materials and Electrochemistry.Cambridge University Press, 2015.
[19] J. Vetter, P. Novák, M. Wagner, C. Veit, K.-C. Möller, J. Besenhard,M. Winter, M. Wohlfahrt-Mehrens, C. Vogler, and A. Hammouche,“Ageing mechanisms in lithium-ion batteries,” Journal of Power Sources,vol. 147, no. 1–2, pp. 269 – 281, 2005.
[20] M. Winter, J. O. Besenhard, M. E. Spahr, and P. Novák, “InsertionElectrode Materials for Rechargeable Lithium Batteries,” Advanced Ma-terials, vol. 10, no. 10, pp. 725–763, 1998.
72
[21] C.-H. Doh, B.-C. Han, B.-S. Jin, and H.-B. Gu, “Structures and For-mation Energies of LixC6 (x=1-3) and its Homologues for LithiumRechargeable Batteries,” Bulletin of the Korean Chemical Society,vol. 32, no. 6, pp. 2045 – 2050, 2011.
[22] M. M. Doeff, Encyclopedia of Sustainability Science and Technology,Chapter 2 Battery Cathodes, R. A. Meyers, Ed. Springer-Verlag NewYork, 2012.
[23] V. Agubra and J. Fergus, “Lithium ion battery anode aging mecha-nisms,” Materials, vol. 6, no. 4, pp. 1310–1325, 2013.
[24] M. Klett, “Electrochemical Studies of Aging in Lithium-Ion Batteries,”Ph.D. dissertation, Royal Institute of Technology, 2014.
[25] G. K. Prasad and C. D. Rahn, “Model based identification of agingparameters in lithium ion batteries,” Journal of Power Sources, vol. 232,pp. 79 – 85, 2013.
[26] T. Granerus, Volvo Cars, Personal communication.
[27] J. Bates and D. Leibling, “Spaced out perspectives on parkingpolicy,” Royal Automobile Club Foundation for Motoring, 2012. [On-line]. Available: http://www.racfoundation.org/assets/rac_foundation/content/downloadables/spaced_out-bates_leibling-jul12.pdf
[28] S. Käbitz, J. B. Gerschler, M. Ecker, Y. Yurdagel, B. Emmermacher,D. André, T. Mitsch, and D. U. Sauer, “Cycle and calendar life study ofa graphite|LiNi1/3Mn1/3Co1/3O2 Li-ion high energy system. Part A:Full cell characterization,” Journal of Power Sources, vol. 239, pp. 572– 583, 2013.
[29] D. H. Jang, Y. J. Shin, and S. M. Oh, “Dissolution of Spinel Oxidesand Capacity Losses in 4V Li/Lix Mn2O4 Cells,” Journal of The Elec-trochemical Society, vol. 143, no. 7, pp. 2204–2211, 1996.
[30] L. Yang, M. Takahashi, and B. Wang, “A study on capacity fading oflithium-ion battery with manganese spinel positive electrode during cy-cling,” Electrochimica Acta, vol. 51, no. 16, pp. 3228–3234, 2006.
[31] K. C. Högström, “The Complex Nature of the Electrode/ElectrolyteInterfaces in Li-ion Batteries,” Ph.D. dissertation, Uppsala University,2014.
[32] M. Dubarry, C. Truchot, B. Y. Liaw, K. Gering, S. Sazhin, D. Jami-son, and C. Michelbacher, “Evaluation of commercial lithium-ion cellsbased on composite positive electrode for plug-in hybrid electric vehicle
73
applications. Part II. Degradation mechanism under 2 C cycle aging,”Journal of Power Sources, vol. 196, pp. 10 336–10 343, 2011.
[33] S. Malmgren, K. Ciosek, M. Hahlin, T. Gustafsson, M. Gorgoi,H. Rensmo, and K. Edström, “Comparing anode and cathode elec-trode/electrolyte interface composition and morphology using soft andhard X-ray photoelectron spectroscopy ,” Electrochimica Acta, vol. 97,pp. 23 – 32, 2013.
[34] K. Edström, T. Gustafsson, and J. Thomas, “The cathode–electrolyteinterface in the Li-ion battery,” Electrochimica Acta, vol. 50, no. 2–3,pp. 397 – 403, 2004.
[35] S. J. An, J. Li, C. Daniel, D. Mohanty, S. Nagpure, and D. L. W. III,“The state of understanding of the lithium-ion-battery graphite solidelectrolyte interphase (SEI) and its relationship to formation cycling,”Carbon, vol. 105, pp. 52 – 76, 2016.
[36] P. Horsman, Comprehensive Treatise of Electrochemistry, Vol. 6: Elec-trodics - Transport: Chapter 1 and 2. Plenum Press, 1983.
[37] N. Nitta, F. Wu, J. T. Lee, and G. Yushin, “Li-ion battery materials:present and future,” Materials Today, vol. 18, no. 5, pp. 252 – 264, 2015.
[38] D. Aurbach, A. Zaban, Y. Ein-Eli, I. Weissman, O. Chusid,B. Markovsky, M. Levi, E. Levi, A. Schechter, and E. Granot, “Re-cent studies on the correlation between surface chemistry, morphology,three-dimensional structures and performance of Li and Li-C intercala-tion anodes in several important electrolyte systems,” Journal of PowerSources, vol. 68, no. 1, pp. 91 – 98, 1997.
[39] B. Tjaden, S. J. Cooper, D. J. Brett, D. Kramer, and P. R. Shearing,“On the origin and application of the bruggeman correlation for analysingtransport phenomena in electrochemical systems,” Current Opinion inChemical Engineering, vol. 12, pp. 44 – 51, 2016.
[40] T. G. Zavalis, “Mathematical Models for Investigation of Performance,Safety, and Aging in Lithium-Ion Batteries,” Ph.D. dissertation, KTH,Applied Electrochemistry, 2013.
[41] T. Danner, M. Singh, S. Hein, J. Kaiser, H. Hahn, and A. Latz, “Thickelectrodes for Li-ion batteries: A model based analysis,” Journal ofPower Sources, vol. 334, pp. 191 – 201, 2016.
[42] E. Wikner, J. Lesser, and T. Thiringer, “Accelerated lifetime testing insmall SOC intervals on commercial pouch cells, challenges and counter-measures,” 2017, EPE’17 ECCE Europe.
74
[43] T. Grube, Fuel Cells : Data, Facts and Figures, Chapter 2 PassengerCar Drive Cycles, D. N. G. Prof. Detlef Stolten, Dr. Remzi C. Samsun,Ed. Wiley-VCH Verlag GmbH Co. KGaA, 2016.
[44] M. Dubarry, B. Y. Liaw, M.-S. Chen, S.-S. Chyan, K.-C. Han, W.-T. Sie,and S.-H. Wu, “Identifying battery aging mechanisms in large format Liion cells,” Journal of Power Sources, vol. 196, no. 7, pp. 3420 – 3425,2011.
[45] M. D. Levi and D. Aurbach, “Simultaneous Measurements and Modelingof the Electrochemical Impedance and the Cyclic Voltammetric Char-acteristics of Graphite Electrodes Doped with Lithium,” The Journal ofPhysical Chemistry B, vol. 101, no. 23, pp. 4630–4640, 1997.
[46] T. Ohzuku, Y. Iwakoshi, and K. Sawai, “Formation of LithiumGraphiteIntercalation Compounds in Nonaqueous Electrolytes and Their Appli-cation as a Negative Electrode for a Lithium Ion (Shuttlecock) Cell,”Journal of The Electrochemical Society, vol. 140, no. 9, pp. 2490–2498,1993.
[47] S.-h. Wu and P.-H. Lee, “Nonlinear Cycling Aging of a Commercial 18650Lithium Ion Cell,” Meeting Abstracts, vol. MA2016-03, no. 2, p. 1198,2016.
[48] I. Buchberger, S. Seidlmayer, A. Pokharel, M. Piana, J. Hattendorff,P. Kudejova, R. Gilles, and H. A. Gasteiger, “Aging Analysis ofGraphite/LiNi1/3Mn1/3Co1/3O2 Cells Using XRD, PGAA, and ACImpedance,” Journal of The Electrochemical Society, vol. 162, no. 14,pp. A2737–A2746, 2015.
[49] T. Ohzuku, M. Kitagawa, and T. Hirai, “Electrochemistry of ManganeseDioxide in Lithium Nonaqueous Cell: III XRay Diffractional Study onthe Reduction of SpinelRelated Manganese Dioxide,” Journal of TheElectrochemical Society, vol. 137, no. 3, pp. 769–775, 1990.
[50] N. Leifer, F. Schipper, E. M. Erickson, C. Ghanty, M. Talianker, J. Grin-blat, C. M. Julien, B. Markovsky, and D. Aurbach, “Studies of Spinel-to-Layered Structural Transformations in LiMn2O4 Electrodes Chargedto High Voltages,” The Journal of Physical Chemistry C.
[51] A. Nyman, M. Behm, and G. Lindbergh, “Electrochemical characterisa-tion and modelling of the mass transport phenomena in LiPF6–EC–EMCelectrolyte,” Electrochimica Acta, vol. 53, no. 22, pp. 6356 – 6365, 2008.
[52] Y. Wang, S. Nakamura, M. Ue, and P. B. Balbuena, “Theoretical Studiesto Understand Surface Chemistry on Carbon Anodes for Lithium-Ion
75
Batteries: Reduction Mechanisms of Ethylene Carbonate,” Journal ofAmerican Chemical Society, vol. 123, p. 11708, 2001.
[53] D. Aurbach, M. D. Levi, E. Levi, and A. Schechter, “Failure andStabilization Mechanisms of Graphite Electrodes,” Journal of PhysicalChemistr B, vol. 101, p. 2195, 1997.
[54] C. R. Yang, Y. Y. Wang, and C. C. Wan, “Composition Analysis of thePassive Film on the Carbon Electrode of a Lithium-Ion Battery with anEC-Based Electrolyte,” Journal of Power Sources, vol. 72, p. 66, 1998.
[55] S.-P. Kim, A. C. T. van Duin, and V. B. Shenoy, “Effect of Electrolyteson the Structure and Evolution of the Solid Electrolyte Interphase (SEI)in Li-Ion Batteries: A Molecular Dynamics Study,” Journal of PowerSources, vol. 196, p. 8590, 2011.
[56] K. Tasaki, A. Goldberg, J.-J. Lian, M. Walker, A. Timmons, and S. J.Harris, “Solubility of Lithium Salts Formed on the Lithium-Ion BatteryNegative Electrode Surface in Organic Solvents,” Journal Electrochem-istry Society, vol. 156, p. A1019, 2009.
[57] A. M. Andersson, M. Herstedt, A. G. Bishop, and K. Edström, “TheInfluence of Lithium Salt on the Interfacial Reactions Controlling theThermal Stability of Graphite Anodes,” Electrochimica Acta, vol. 47, p.1885, 2002.
[58] K. Ciosek Högström, S. Malmgren, M. Hahlin, H. Rensmo, F. Thébault,P. Johansson, and K. Edström, “The Influence of PMS-Additive on theElectrode/Electrolyte Interfaces in LiFePO4/Graphite Li-Ion Batteries,”The Journal of Physical Chemistry C, vol. 117, no. 45, pp. 23 476–23 486,2013.
[59] S.-L. Wu, W. Zhang, X. Song, A. K. Shukla, G. Liu, V. Battaglia, andV. Srinivasan, “High Rate Capability of Li(Ni1/3Mn1/3Co1/3)O2 Elec-trode for Li-Ion Batteries,” Journal of The Electrochemical Society, vol.159, no. 4, pp. A438–A444, 2012.
76


![Databaseforahighperformanceandstability demanding command ...publications.lib.chalmers.se/records/fulltext/127516.pdf · Chapter 1 Introduction TraditionallySaab[3]hasstoredapplicationdatainadistributeddatastructure](https://img.pdfslide.us/doc/110x75/5f283e290d51ca22422dad96/databaseforahighperformanceandstability-demanding-command-chapter-1-introduction.jpg)