Embed Size (px)
Citation preview

Ž .Journal of Power Sources 81–82 1999 448–453www.elsevier.comrlocaterjpowsour
Lithium insertion behaviour of Li V O with different degrees of1qx 3 8
crystallinity
Jin Kawakita ), Takahiro Kato, Yasushi Katayama, Takashi Miura, Tomiya KishiDepartment of Applied Chemistry, Faculty of Science and Technology, Keio UniÕersity, Hiyoshi 3-14-1, Kouhoku-ku, Yokohama 223-8522, Japan
Abstract
Lithium insertion behaviour of amorphous Li V O was compared with that of poorly crystalline and highly crystalline LiV O .1qx 3 8 3 8
This oxide retained the amorphous state during discharge and charge cycle and exhibited electrochemical performance inferior to thecrystalline one, i.e., smaller discharge capacity and lower cycle efficiency. The crystallinity of the crystalline Li V O was one of the1qx 3 8
primary factors determining the rate of lithium insertion reaction. q 1999 Elsevier Science S.A. All rights reserved.
Keywords: Amorphous; Vanadate; Quenching; Lithium; Insertion
1. Introduction
Lithium trivanadate, Li V O is one of the attractive1qx 3 8
active materials for the positive electrodes of lithium sec-w xondary batteries. Since Besenhard and Schollhorn 1 found¨
the possibility of insertion of Liq ions to Li V O from1qx 3 8
the non-aqueous electrolyte, many researchers have at-tempted to improve its electrochemical performance.
w xNassau and Murphy 2 reported the larger dischargecapacity of glassy Li V O in early cycles and more1qx 3 8
rapid deterioration in subsequent cycles than crystallineŽ .one. They prepared glassy or amorphous and crystalline
forms by quenching and slow cooling of the melt, subse-w xquently Pasquali et al. 3 reported slight inferiority of
amorphous to crystalline Li V O during the first cycle1qx 3 8
and deterioration with cycling in terms of the capacity.w xOther techniques 4 were applied to reduce the particle
size of crystalline form to obtain a larger capacity. In thesedays, the theoretical discharge capacity of LiV O was3 8
estimated to be 279 mA h gy1, assuming the accommoda-tion of up to three equivalent of Liq ions per formula unit,i.e., xs3.0 in Li V O .1qx 3 8
w xPistoia et al. 5 prepared amorphous Li V O using1qx 3 8Žsol–gel method. It had the larger discharge capacity 419
y1 .mA h g : xs4.5 and the longer retention of capacity inw xmany cycles than crystalline oxide. West et al. 6 obtained
Li V O in a finely dispersed form by heat treatment1qx 3 8
) Corresponding author. Tel.: q81-45-563-1141; Fax: q81-45-563-5967; E-mail: [email protected]
and dehydration of aqueous lithium vanadate gels, result-Ž y1 .ing in a high capacity 372 mA h g : xs4.0 and good
reversibility. However, the product obtained by this methodmay possess water molecules in the compound, which was
w xreported to bring the favored result 7 .Therefore, the authors elucidated the characteristics of
lithium insertion reaction of amorphous Li V O with-1qx 3 8
out water molecules and the effect of morphology andcrystallinity on the lithium insertion behaviour ofLi V O . In this paper, crystallinity was classified into1qx 3 8
three types. The first is amorphous vanadate prepared byquenching of the melt, termed as AM. The second is lowcrystalline one obtained by heat treatment of the AMsample, termed as LC. The last is highly crystalline mate-rial prepared by slow cooling of the melt, termed as HC.The AM sample was compared with both the LC and HCsamples in terms of insertion behaviour.
2. Experimental
Ž .Li V O AM was prepared as follows. A mixture of1qx 3 8Žlithium oxide Li O, Soekawa Chemicals, )99.9% pu-2
. Ž .rity and vanadium pentoxide V O in molar ratio of2 5
1.2:3 was heated in a platinum crucible at 9008C for 30 hin air. V O used in this experiment was synthesized by2 5
thermal decomposition of ammonium metavanadateŽ .NH VO , Soekawa Chemicals, )99% purity at 5008C4 3
for 24 h. The crucible was swung for some times to attainthe homogeneous composition of the melt. Then, the melt
0378-7753r99r$ - see front matter q 1999 Elsevier Science S.A. All rights reserved.Ž .PII: S0378-7753 99 00197-4

( )J. Kawakita et al.rJournal of Power Sources 81–82 1999 448–453 449
was quenched by putting the crucible on ice water rapidly.The resulting sample was ground and heated at 215 or3508C for 12 h in air to produce the LC215 or LC350sample. As the reference material, high crystalline
Ž .Li V O HC was prepared by the conventional high1qx 3 8w xtemperature synthesis 8 . Thermogravimetry and differen-Žtial thermal analysis TG-DTA, Mac Science TG-DTA
.2000 were carried out on the AM sample to detect thetransition from amorphous to crystalline state.
Electrochemical measurements were carried out by us-ing the three-electrode cell described elsewhere in detailsw x9 . The working electrode was prepared by mixing and
Žpressing the mixture of the oxide, acetylene black Denka. Ž .Black, Denkikagaku Kogyo and poly tetrafluoroethylene
Ž .PTFE, Mitsui-Du Pont in a weight ratio of 70:25:5.Metallic lithium rods were used as the counter and refer-ence electrodes. The electrolyte was 1 mol dmy3 lithium
Žperchloraterpropylene carbonate solution LiClO rPC,4.Mitsubishi Chemical, battery grade containing water
within 20 ppm. All the cells were fabricated in a glove boxfilled with argon gas. Galvanostatic discharge and dis-chargercharge cycle tests were performed with an aid of
Ž .galvanostatrpotentiostat Toho Technical research PS-08 .The rest potential was regarded as the quasi open circuit
Ž . y1potential OCP when its change was within 0.001 V hafter discharge experiment.
The lithiated product was also prepared by the chemicalw xmethod described elsewhere in detail 9 . The sample
powder was dispersed in an n-BuLirn-hexane solutionand stirred at room temperature for 7 days under argonatmosphere. The lithium content of lithiated samples wasdetermined by elemental analysis for Li and V using
Ž .atomic absorption analysis Hitachi, 180-55 AAS .These vanadates before and after lithium insertion were
Ž .examined by X-ray diffraction XRD, Rigaku RINT 1300Žby CuKa radiation with nickel filter, and FT-IR, Bio-Rad
.FTS-165 spectroscopic measurements using KBr diskmethod.
3. Results and discussion
3.1. Preparation
Fig. 1 shows the TG-DTA curves of amorphousŽ .Li V O AM . Two exothermic peaks appeared at about1.2 3 8
200 and 2508C on the DTA curve. A similar DTA curvewas observed under N atmosphere by Nassau and Mur-2
w xphy 2 , who ascribed two peaks to the formation ofcrystalline LiV O and LiV O phases, respectively. They6 15 3 8
did not, however, show any TG curves or XRD patterns.The TG curve in Fig. 1 did not have any weight change atthis temperature range, though weight loss caused byvaporization of adsorbed water could be seen below about1508C. As discussed below, XRD patterns of the samples
Ž .heat treated at 215 and 3508C see Fig. 2 were ascribed
Fig. 1. TG-DTA curves of amorphous Li V O .1.2 3 8
Žthose of LiV O and had not any diffraction line ascribed3 8.to LiV O . These observations suggested that the two6 15
exothermic peaks at 200 and 2508C observed under airwould be attributed to crystallization of LiV O phase and3 8
to any ordering phenomenon described later.ŽFig. 2 gives the XRD patterns of Li V O AM.1.2 3 8
.LC215, LC350, and HC . No obvious diffraction linesappeared in the pattern except for a hallow characteristicof the amorphous substance, as shown in Fig. 2a. All the
Ždiffraction lines of the LC215 with coexisting graphite.marked by arrows , LC350 and HC samples were at-
Ž .tributed to Li V O indexed in JCPDS card No. 18-754 ,1qx 3 8
as shown in Fig. 2b–d. The lattice parameters of thesecrystalline samples coincided well with the JCPDS data.
Ž .Relative intensities of the diffraction lines of 020 andŽ . Ž .003 to 100 for LC215 and LC 350 were similar to those
Ž .of the JCPDS card, but stronger 100 diffraction line wasobserved for HC sample, as shown in Fig. 3. The lattermay be caused by a preferred orientation of the crystal dueto a plate-like shape of the HC powdered sample. Thegrain sizes, calculated from data of full width at halfmaximum using Scherrer’s equation were 70–80, 25–32,20–28 nm for HC, LC 350 and LC215, respectively,independent of the crystal directions. These results indi-cated the diffraction line broadening might be accounted asimperfection of the crystal rather than grain size, and LCsamples might have some crystal disorders.
ŽFig. 4 shows the FT-IR spectra of Li V O AM, LC1.2 3 8.and HC . Referring to the previous studies on IR spectra of
w xthis oxide 10,11 , the two main peaks around 1000 and950 cmy1 were ascribed to the stretching vibration be-
Ž .tween V and O atoms, n V5O . Though these two peakswere observed obviously for the HC sample, they werebroadened and overlapped for the LC sample, as seen in

( )J. Kawakita et al.rJournal of Power Sources 81–82 1999 448–453450
Ž . Ž .Fig. 2. XRD patterns of Li V O , a prepared by quenching AM , heat1.2 3 8Ž . Ž . Ž . Ž . Ž .treated at b 2158C LC215 and c 3508C LC350 , and d prepared by
Ž .slow cooling HC .
Fig. 4a and b. A broad peak was observed near 950 cmy1
for the AM sample. These results indicated the existenceof the short-range order of VO unit in the HC sample, and6
increasing indistinct separation of these peaks for the LCand AM samples was due to increasing disorder of aregular configuration of the atoms. On the other hand, thepeak near 730 cmy1 attributed to the stretching vibration
Ž .between V and O atoms, n V–O–V , indicated the exis-tence of the long-range order for the HC sample, as
Fig. 3. Relative intensity in some planes of Li V O .1.2 3 8
Ž .Fig. 4. IR spectra of Li V O , a: HC, b: LC350, c: LC215, and d: AM .1.2 3 8
presented in Fig. 4a. This peak became ambiguous for theLC sample, and further for the AM sample. These disor-ders might appear as the diffraction line broadening in theXRD patterns. Relative integrated absorbance of the ab-
Ž . Ž .sorption band of n V–O–V to that of n V5O increasedin order of the temperature of heat treatment, i.e., RC-
LC350, the last of which has the relative absorbancesimilar to that of HC sample. This suggested that VO6
units in the intralayer were arranged in more regularmanner by heat treatment above 2208C where the secondexothermic peak appeared. The broad exothermic peak at
Ž .220 to 2508C in the DTA curve Fig. 1 will be related toan arrangement of the layer to gain some long-rangeorders.
3.2. Lithium insertion behaÕiour
Ž .Fig. 5 shows an open circuit potential OCP of theoxides versus composition x in Li V O obtained by1qx 3 8
electrochemical lithium insertion. The continuous decreasein the potential of the AM sample was characteristic of theamorphous material. On the other hand, the plateau of
Ž q .potential was observed near 2.6 V vs. Li rLi for theLC350, LC215 and HC samples. In this plateau, theoriginal LiV O phase and the second Li V O phase3 8 4 3 8
w xcoexisted 9 . Though the HC sample had the insertionlimit at xs3.0, further lithium insertion proceeded up tonear xs4.0 in the AM sample as well as the LC sample.The potential plateau at 2.4 V in the LC sample was alsoobserved in LiV O prepared by the sol–gel method and3 8
w xthe subsequent heat treatment 6,12 .The XRD patterns of the fully lithiated by chemical
method samples of Li V O were compared in Fig. 6.1qx 3 8

( )J. Kawakita et al.rJournal of Power Sources 81–82 1999 448–453 451
ŽFig. 5. OCP plots of Li V O , `: AM, \: LC215, ^: LC350, and1q x 3 8.I: HC .
Ž .As for both the LC and HC samples Fig. 6a and b , all thediffraction lines in the patterns were ascribed to the phase
w xfound out by Picciotto et al. 13 . On the other hand, noŽ .diffraction lines in the pattern of the AM sample Fig. 6a
showed the successive absence of the crystalline phaseupon lithiation.
The IR spectra of the fully lithiated by chemical methodsamples of Li V O were drawn as the solid lines and1qx 3 8
compared in Fig. 7. The dashed lines represented therespective unlithiated sample, Li V O . As seen in Fig.1.2 3 8
ŽFig. 6. XRD patterns of chemically lithiated samples, Li V O , a: HC,4 3 8.b: LC350, c: LC215, and d: AM samples .
ŽFig. 7. IR spectra of chemically lithiated samples, Li V O , a: HC,4 3 8.b: LC350, c: LC215 and d: AM .
7a and b, the assembling of the absorption bands from near950 and 740 cmy1 to around 850 cmy1 was explained bya homogenization of the bond lengths due to the formation
w xof the rock-salt type defect Li V O 11 . In the case of the4 3 8
AM sample, the shifting of the band from near 950 cmy1
to the lower wavenumbers corresponded to the decrease ofthe bond strength between V and O atoms rather thanhomogenization of the bond lengths. This phenomenonwas caused by the reduction of vanadium component tothe lower valence state.
3.3. Discharge and charge cycling characteristics
Fig. 8 shows the first discharge and charge cycle curvesof the samples. Lithium insertionrextraction reaction ofcrystalline Li V O less than 3.0 moles of Liq ions was1qx 3 8
w xreversible for HC sample 14 . Especially, each step in thedischarge curve of the LC350 sample was observed widerand more obviously than for HC sample and at the corre-sponding plateau potentials during charging. In the case ofthe AM sample, on the contrary, the absence of anyplateaus during discharging and charging indicated theabsence of crystallization. The behaviour of LC215 wassituated between LC350 and AM samples. These dataindicated that a crystalline oxide is more feasible to lithium
Ž .insertion than an amorphous oxide, though large and 100preferential orientation of the HC oxide retarded lithiuminsertion. Moreover, the amorphous oxide had unex-tractable lithium upon charging.
The dependence of the discharge capacity on the currentdensity were shown in Fig. 9a, where the first dischargeand charge was cycled between 3.5 and 1.5 V. The dis-charge capacity decreased as the c.d. increased, and the
( )J. Kawakita et al.rJournal of Power Sources 81–82 1999 448–453452
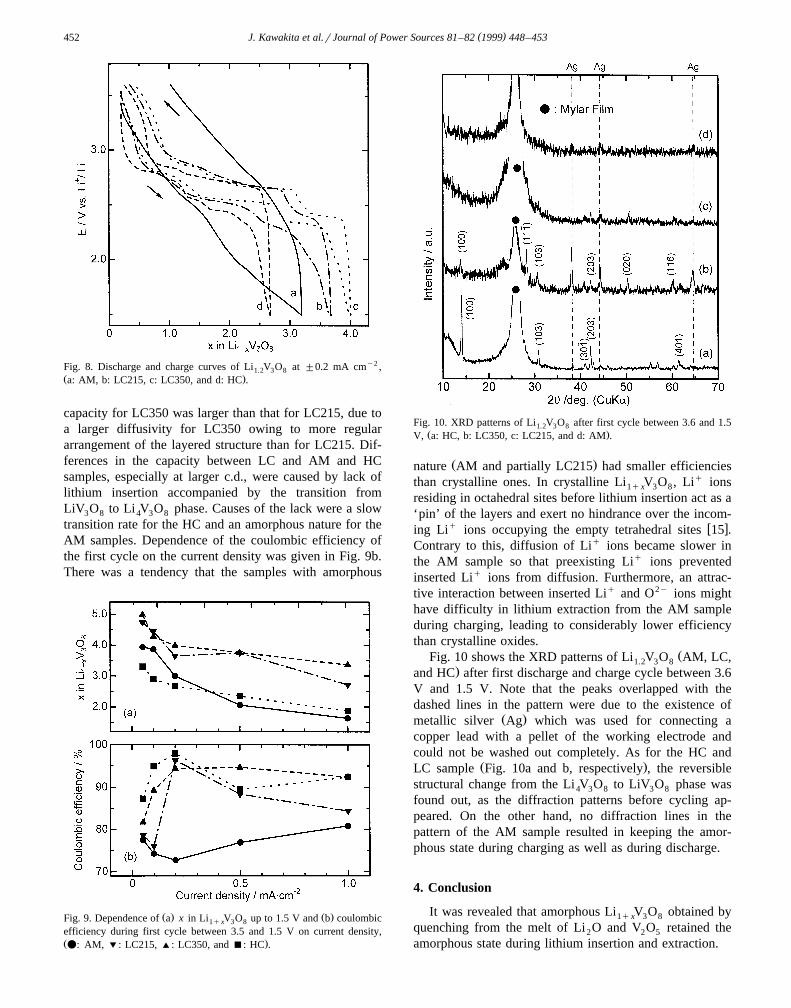
Fig. 8. Discharge and charge curves of Li V O at "0.2 mA cmy2 ,1.2 3 8Ž .a: AM, b: LC215, c: LC350, and d: HC .
capacity for LC350 was larger than that for LC215, due toa larger diffusivity for LC350 owing to more regulararrangement of the layered structure than for LC215. Dif-ferences in the capacity between LC and AM and HCsamples, especially at larger c.d., were caused by lack oflithium insertion accompanied by the transition fromLiV O to Li V O phase. Causes of the lack were a slow3 8 4 3 8
transition rate for the HC and an amorphous nature for theAM samples. Dependence of the coulombic efficiency ofthe first cycle on the current density was given in Fig. 9b.There was a tendency that the samples with amorphous
Ž . Ž .Fig. 9. Dependence of a x in Li V O up to 1.5 V and b coulombic1q x 3 8
efficiency during first cycle between 3.5 and 1.5 V on current density,Ž .v: AM, %: LC215, ': LC350, and B: HC .
Fig. 10. XRD patterns of Li V O after first cycle between 3.6 and 1.51.2 3 8Ž .V, a: HC, b: LC350, c: LC215, and d: AM .
Ž .nature AM and partially LC215 had smaller efficienciesthan crystalline ones. In crystalline Li V O , Liq ions1qx 3 8
residing in octahedral sites before lithium insertion act as a‘pin’ of the layers and exert no hindrance over the incom-
q w xing Li ions occupying the empty tetrahedral sites 15 .Contrary to this, diffusion of Liq ions became slower inthe AM sample so that preexisting Liq ions preventedinserted Liq ions from diffusion. Furthermore, an attrac-tive interaction between inserted Liq and O2y ions mighthave difficulty in lithium extraction from the AM sampleduring charging, leading to considerably lower efficiencythan crystalline oxides.
ŽFig. 10 shows the XRD patterns of Li V O AM, LC,1.2 3 8.and HC after first discharge and charge cycle between 3.6
V and 1.5 V. Note that the peaks overlapped with thedashed lines in the pattern were due to the existence of
Ž .metallic silver Ag which was used for connecting acopper lead with a pellet of the working electrode andcould not be washed out completely. As for the HC and
Ž .LC sample Fig. 10a and b, respectively , the reversiblestructural change from the Li V O to LiV O phase was4 3 8 3 8
found out, as the diffraction patterns before cycling ap-peared. On the other hand, no diffraction lines in thepattern of the AM sample resulted in keeping the amor-phous state during charging as well as during discharge.
4. Conclusion
It was revealed that amorphous Li V O obtained by1qx 3 8
quenching from the melt of Li O and V O retained the2 2 5
amorphous state during lithium insertion and extraction.

( )J. Kawakita et al.rJournal of Power Sources 81–82 1999 448–453 453
The amorphous Li V O was inferior to the crys-1qx 3 8
talline samples with respect to the rate capability of lithiuminsertion reaction because the repulsive interaction be-tween preexisting and inserted Liq ions in the amorphousone lead to slower diffusion of Liq ions in contrast to caseof the crystalline one. Furthermore, the lower coulombicefficiency of the amorphous one during first discharge andcharge cycle was explained by the existence of unex-tractable Liq ions which were bonded strongly with O2y
ions.The insertion rate of the crystalline Li V O was1qx 3 8
influenced largely by the rate of the transition betweenLiV O and Li V O phases, which is dependent on size3 8 4 3 8
and shape and also imperfection of the oxide crystals.
References
w x Ž .1 J.O. Besenhard, R. Schollhorn, J. Power Sources 1 1976 267.¨w x Ž .2 K. Nassau, D.W. Murphy, J. Non-Cryst. Solids 44 1981 297.
w x3 M. Pasquali, G. Pistoia, V. Manev, R.V. Moshtev, J. Electrochem.Ž .Soc. 133 1986 2454.
w x4 G. Pistoia, M. Pasquali, Y. Geronov, V. Manev, R.V. Moshtev, J.Ž .Power Sources 27 1989 35.
w x5 G. Pistoia, M. Pasquali, G. Wang, L. Li, J. Electrochem. Soc. 137Ž .1990 2365.
w x6 K. West, B. Zachau-Christiansen, S. Skaarup, Y. Saidi, J. Barker,I.I. Olsen, R. Pynenburg, R. Koksbang, J. Electrochem. Soc. 143Ž .1996 820.
w x7 V. Manev, A. Momchilov, A. Nassalevska, G. Pistoia, M. Pasquali,Ž .J. Power Sources 54 1995 501.
w x8 J. Kawakita, H. Katagiri, T. Miura, T. Kishi, J. Power Sources 68Ž .1997 680.
w x9 J. Kawakita, Y. Katayama, T. Miura, T. Kishi, Solid State IonicsŽ .107 1998 145.
w x Ž .10 Y. Kera, J. Solid State Chem. 51 1984 205.w x11 R. Tossici, R. Marassi, M. Berrettoni, S. Stizza, G. Pistoia, Solid
Ž .State Ionics 57 1992 227.w x12 J. Kawakita, Y. Katayama, T. Miura, T. Kishi, Solid State Ionics
Ž .110 1998 199.w x13 L.A. de Picciotto, K.T. Adendorff, D.C. Liles, M.M. Thackeray,
Ž .Solid State Ionics 62 1993 297.w x14 G. Pistoia, M. Pasquali, M. Tocci, R.V. Moshtev, V. Manev, J.
Ž .Electrochem. Soc. 132 1985 281.w x15 G. Pistoia, S. Panero, M. Tocci, R.V. Moshtev, V. Manev, Solid
Ž .State Ionics 13 1984 311.