Embed Size (px)
Citation preview
This journal is©The Royal Society of Chemistry 2017 Mater. Horiz., 2017, 4, 1157--1164 | 1157
Cite this:Mater. Horiz., 2017,
4, 1157
Wide concentration liquid crystallinityof graphene oxide aqueous suspensionswith interacting polymers†
Yul Hui Shim,a Kyung Eun Lee,b Tae Joo Shin,c Sang Ouk Kim *b andSo Youn Kim *a
Graphene oxides (GOs), an oxygenated derivative of graphene,
spontaneously undergo monolayer exfoliation in water, and thus,
form liquid crystalline (LC) suspensions. Unfortunately, the resultant
suspensions vitrify at around a 1 wt% composition, which commonly
acts as an obstacle for GO-based material fabrication, while degrading
the molecular ordering and relevant material properties. Here, we
systematically investigate the phase behaviour and structural evolu-
tion of GO LC suspensions under various experimental conditions
and disclose how the glass transition of GO dispersions is affected
particularly in the presence of strongly interacting polymers. The
supplementary polymer additives can effectively retard the ‘glass
transition’ of a GO suspension, broaden the concentration range for
a nematic LC phase toward lower and higher concentration ranges
and dramatically decrease the viscosity of the suspension down to
the 1/100–1/1000 level. Extensive small-angle X-ray scattering and
rheological measurements are employed to characterize the molecular
level GO structures in LC suspensions.
Genuine two-dimensional materials represented by graphenehave attracted tremendous attention particularly owing to theirextraordinary physical properties.1–5 Many excellent properties ofgraphene originate from the unusually large, two-dimensionalshape anisotropy composed of a honeycomb sp2 carbon matrix,making it an essential element for many different applications.6,7
Graphene oxide (GO) is an oxidized form of graphene and iswidely emphasized as a promising distinguishable material withunique advantages such as ease of synthesis, process scalability,
and manageability.8,9 The colloidal dispersibility of monolayerGO is also noteworthy in many solvents including water.10 Suchsolvent dispersibility is beneficial for low-cost and high-throughput solution processes. Thus, significant attention hasbeen paid to GO as 2D colloids in solvent dispersions.11–13
One intriguing characteristic of GO suspensions is theformation of a liquid-crystalline phase at a very low GO concen-tration as seen in other similar particles, which is obviously dueto the extremely large shape anisotropy of GO sheets.14–18
A typical GO suspension is known to undergo an isotropic-to-nematic liquid crystalline transition at around 0.3 wt% concen-tration and to show a solid-like elastic behaviour typically above1 wt%.19 Recently, GO LC has been actively exploited for thesolution processing of high-performance graphene fibers andfilms.20 Gao et al. reported the spinning of superstrong graphenefibers, taking advantage of the precise control of defects in GOLCs.21 In these emerging applications, polymer additives havebeen frequently incorporated for the improvement of process-ibility and molecular scale alignment.19,22 Shin et al. reported thealignment of composite fibers consisting of reduced grapheneoxide, carbon nanotubes and poly(vinyl alcohol) (PVA). Toughnesswas dramatically increased compared to the commercially avail-able Kevlar fibers, resulting from the synergistic effect amongcarbon-based materials and PVA in the presence of 0.3 wt% GO.23
a School of Energy and Chemical Engineering, Ulsan National Institute of Science
and Technology (UNIST), Ulsan, 44919, Republic of Korea.
E-mail: [email protected] National Creative Research Initiative Center for Multi-Dimensional Directed
Nanoscale Assembly, Department of Materials Science & Engineering, KAIST,
Daejeon, 34141, Republic of Korea. E-mail: [email protected] School of Natural Science & UNIST Central Research Facilities, Ulsan National
Institute of Science and Technology (UNIST), Ulsan, 44919, Republic of Korea
† Electronic supplementary information (ESI) available: Fig. S1–S10 and Table S1.See DOI: 10.1039/c7mh00624a
Received 9th August 2017,Accepted 25th September 2017
DOI: 10.1039/c7mh00624a
rsc.li/materials-horizons
Conceptual insightsTwo-dimensional materials represented by graphene/graphene oxide(GO) have attracted tremendous attention based on their extraordinaryphysical properties. While many graphene production tecnhiques requiresolution processing based on the good dispersity of GO, the current levelof application is achieved without detailed understanding of GOdispersions. Here, we present the ultimate phase diagram of GOsuspensions in the presence of polymers with a detailed structural andrheological study. Moreover, we found that adding polymers canironically reduce the viscosity of GO suspensions, suggesting a newstrategy for effective GO processing.
MaterialsHorizons
COMMUNICATION
Publ
ishe
d on
25
Sept
embe
r 20
17. D
ownl
oade
d by
Kor
ea A
dvan
ced
Inst
itute
of
Scie
nce
& T
echn
olog
y / K
AIS
T o
n 14
/12/
2017
07:
01:4
4.
View Article OnlineView Journal | View Issue
1158 | Mater. Horiz., 2017, 4, 1157--1164 This journal is©The Royal Society of Chemistry 2017
Ultimate colloidal stability is a significant issue for GO LCsuspensions consisting of unusually large 2D particles. To date,the colloidal stability of GO suspensions has been studied,while controlling solvent type,11,12 ionic strength,20 pH,24 andpolymer additives.25 Konios et al. reported the dispersibility ofGO in various solvents and the long-term colloidal stability overseveral weeks.4 Bai et al. reported GO hydrogel formation in thepresence of poly(vinyl alcohol);25 reversible sol–gel transitionwas observed by controlling the pH of the dispersion and GOconcentration. The characteristic behaviours of GO LCs as wellas their potential performance in relevant applications criticallydepend on the colloidal stability of the GO suspension.26–29 Forinstance, uniform fiber spinning from GO LCs is often hinderedby the poor colloidal stability of GO suspensions.13 Gelation of GOobstructs the uniform alignment of GO in fibers, thus degradingits mechanical, electronic and optical properties.30–32
In this work, we systematically study the ultimate phasebehaviour of aqueous GO LC suspensions under various con-ditions particularly focusing on the stability of the LC phase inthe presence of polymers. It is worth noting that polymers arecommonly added in colloidal suspensions, where they caneither act as a steric colloidal stabilizer or cause depletionattraction for aggregation.33–35 Recent studies have presentedthat polymer additives can significantly improve the mechanicalproperties,23,36,37 heat-resistance38 and gas permeability39,40 of GObased materials and provide pH-sensitive stability.41 Here weprovide the detailed fundamental understanding of GO–polymerinteractions and their influence on structural evolution at a sub-molecular level. The exact phase behaviour, microstructures, andrheological properties of GO suspensions with or without polymeradditives are thoroughly discussed. Notably, polymer additiveswithout particular functionality may effectively lower the criticalconcentration for the isotropic-to-nematic phase transition,and retard the glass transition of a GO suspension at highconcentrations.
The model system employed in this work is composed ofaqueous GO suspensions and low molecular weight poly(ethyleneglycol) (PEG), where the PEG concentration varied from 0 to90 wt%. PEG is a well-known water-soluble polymer and canadsorb onto the GO surface by hydrogen bonding.38 PEG waschosen based on its good solubility in water and easy accessibilitywith low cost. PEG does not alter the chemical functionality ofGOs as the degree of oxygenation of GO does not significantly varyover time in this study. GO aqueous dispersions were preparedwith a careful purification step, as described elsewhere14,42
to remove ionic impurities, and were then mixed with PEG(Mn: 400 g mol�1, density: 1.128 g ml�1). The use of PEG 400excludes the possible bridging flocculation because of the suffi-ciently short chain length of PEG 400.
The ultimate phase stability of GO aqueous suspensions wascarefully examined over a year. Fig. 1a shows the completephase diagram as a function of GO and PEG concentration.When GO concentration is below 0.1 wt%, phase separationoccurs, principally arising from the sedimentation of large sizeGO sheets (Fig. S1 and S2, ESI†). According to PEG concentration,the GO phase separates at different rates: generally it requires a
longer time with a higher concentration (cp) suspension withhigher viscosity. GO suspensions with a sufficiently high PEGconcentration (cp 4 30 wt%) remain stable over a year. Up to1.5 wt% of GO, the suspensions initially exhibit a liquid-likefluidity right after mixing with PEG for all PEG concentrations.After a while, some GO dispersions start to show solid-likeelasticity. For example, the 1.5 wt% GO suspension exhibits elasticbehaviour after B3 months. In contrast, GO suspensions withPEG maintained liquid-like fluidity for a much longer time period;GOs dispersed in cp = 10 wt% solutions showed fluidity even afterone year. This clearly demonstrates that PEG additives caneffectively restrain the vitrification of a GO suspension.
The liquid crystallinity of the GO suspensions is examinedwith polarized optical microscopy (POM).43–45 Optical images ofGO suspensions are presented in Fig. 1b for each GO and PEGconcentration. Liquid crystallinity was confirmed with a pro-minent optical birefringence between two crossed polarizers.Extremely high aspect ratio GO sheets can align parallel to eachother in order to maximize the positional entropy at theexpense of orientational entropy.42 The isotropic-to-nematicphase transition concentration (fn) was observed to be around0.3 wt%, consistent with previous reports.14,19 When PEG isadded to the GO suspension at 30 and 60 wt%, fn is reduceddown to 0.2 and 0.1 wt%, respectively, as shown in Fig. 1a andb. Increasing the effective size of the GO sheets with PEGadsorption may influence the transition. However, we considerthat this contribution is insignificant because GO suspensionsremained isotropic in the range of 0 o cp o 10 wt%, where thedegree of PEG adsorption should vary dramatically. Furthermore,we have shown that the effective volume of GO sheets in PEGsolution is rather smaller than that in water, which will bediscussed later. Instead, increasing medium viscosity withpolymer additives may cause the GOs to maintain the nematicphase longer. The nematic phase can be temporarily formedwhen GOs have a good interaction with the substrate, and ashear force is given during sample injection. While the nematicphase in a less viscous solvent easily disappears, that in aviscous solvent can stay longer because of the restricted motionof GOs. Furthermore, the depletion induced by polymer addi-tives may cause the transition from the isotropic to nematicphase to occur more easily. If the surface-to-surface distancebetween two GO sheets is close enough, the polymer chainsshould be excluded between GO sheets, bringing the GO sheetstogether. Then, the local concentration of GO suspensions canbe enhanced to cause an isotropic-to-nematic transition. Wealso note that LCs are formed to maximize their total entropy,dominated by packing entropy, when their rotational entropy isrestricted. The polymers in the solvent medium may restrict therotational entropy of GO; thus, the GO sheets may more easilyalign to form a nematic phase to maximize the packing entropy.
As the GO concentration increases, the optical birefringencewas more distinct, as shown in Fig. 1b. While the orientationorder of a nematic LC gradually increases with an increase inGO concentration, GO LC starts to vitrify (no more fluidity) at acritical concentration (fg), presumably becoming a glass orgel.42,46 The critical concentration is critically dependent on the
Communication Materials Horizons
Publ
ishe
d on
25
Sept
embe
r 20
17. D
ownl
oade
d by
Kor
ea A
dvan
ced
Inst
itute
of
Scie
nce
& T
echn
olog
y / K
AIS
T o
n 14
/12/
2017
07:
01:4
4.
View Article Online

This journal is©The Royal Society of Chemistry 2017 Mater. Horiz., 2017, 4, 1157--1164 | 1159
PEG concentration such that fg was around 1 wt% in purewater and 1.5 wt% in cp = 10 wt% PEG solution, as determinedafter a year.
A dramatic reduction of the GO LC fluidity was observedwith a viscosity measurement.35,47 Fig. 2a shows the viscosity of0.8 wt% GO suspensions with PEG concentrations of 0, 1, 10,and 20 wt%. The viscosity of the suspension (Z) increases withtime for all samples. Interestingly, the viscosity of the PEG-freedispersion (cp = 0) was much higher than that of the cp = 20 wt%dispersion. Relative viscosity (Z/Z0) was obtained by normali-zation with the solvent viscosity (Z0) without GO. The relativeviscosity of GO in pure water is 20–30 times higher than that ofGO in 20 wt% PEG solution. We note that GO suspensionsshowed a shear-thinning behaviour (Fig. S3, ESI†); thus, viscosityreduction with PEG can be reduced at high shear rates. GOdispersions in pure water do not flow, presumably forming a gelor glass, whereas those in 10 and 20 wt% PEG retain fluidity. Theobservation in Fig. 2a is consistent with the phase diagram inFig. 1a. We confirmed that PEG additives can dramatically retard
the gelation or glass transition of GO suspensions, raising ascientific question regarding the exact role of polymers for GOinteractions.
Aqueous GO suspensions have been reported to exhibit arange of arrested states,46 from liquid to gel and glass. Whilegels are formed by attractive interactions typically at highionic strength, glass can originate from strong electrostaticrepulsion even at a low ionic strength, often called a Wignerglass.48 PEG-free GO suspensions are expected to exhibit arange of electrostatic repulsions among GO sheets, which arecaused by the ionized deprotonated oxygen functional groupsat their surfaces.49,50 Therefore, the arrested state of the GOdispersions in our system should not be a gel but a glass, asthe dispersions were extensively purified to remove ionicimpurities.48
To confirm the nature of the arrested state, the total pairinteraction energy for the GO sheets is calculated at differentPEG concentrations based on the Derjaguin, Landau, Verwey,and Overbeek (DLVO) theory.20 The classical DLVO theory is
Fig. 1 (a) Phase diagram with respect to GO and PEG concentrations after 12 months of stabilization. The status of dispersion is marked with symbols asindicated. (b) Optical micrographs of GO dispersions located between a pair of crossed polarizers. All images were taken after 3 months from samplepreparation (scale bar is 300 mm).
Fig. 2 (a) Viscosity measurements of 0.8 wt% GO dispersions in 0, 1, 10, and 20 wt% PEG solution. Optical images of the samples show differentfluidities. (b) Interaction energy per unit area variation between two GO sheets in PEG solutions at cp = 0, 10, and 20 wt% (from high to low). The dashedline shows the distance for the closest approach arising from the surface roughness and polymer adsorption. The inset shows the calculated Debyelength (k�1). (c) Vial inversion tests for 1.5 wt% GO suspensions at different PEG concentrations; (left to right) 0, 0.1, 1, 10 and 30 wt%.
Materials Horizons Communication
Publ
ishe
d on
25
Sept
embe
r 20
17. D
ownl
oade
d by
Kor
ea A
dvan
ced
Inst
itute
of
Scie
nce
& T
echn
olog
y / K
AIS
T o
n 14
/12/
2017
07:
01:4
4.
View Article Online
1160 | Mater. Horiz., 2017, 4, 1157--1164 This journal is©The Royal Society of Chemistry 2017
able to capture the colloidal stability of charged particles inpolar medium even for low-dimensional colloids (for moredetails see the ESI†).51 For van der Waals attraction, theHamaker constant is varied for different PEG concentrationsas the refractive index and dielectric constant of the solvent arevaried. For electrostatic repulsion, the Debye length of GO andthe dielectric constant of the solvent are the key parameters.It is worth noting that the Debye length is an estimation ofhow far the electrostatics persist. The Debye length of GO wascalculated based on the zeta potential (z-potential) measurement.52
Fig. 2b shows the total pair interaction energy (attractive van derWaals force + repulsive electrostatic force) per unit area as afunction of surface distance. In the absence of polymers,electrostatic repulsion is dominant, providing sufficient stabilityfor the GO suspension. Furthermore, the repulsion is effective upto a long distance, signifying that the effective volume of GO inwater is much larger than their physical sizes. Therefore, the
nature of vitrification at high concentrations should be regardedas a glass transition induced by a repulsive interaction.53
As the amount of PEG is increased up to 20 wt%, theelectrostatic repulsion is noticeably reduced along with theDebye length, as shown in the inset of Fig. 2b. The Debyelength and z-potential of GO gradually decrease with anincrease in PEG concentration (see the ESI†). The decrease ofthe Debye length and the increase of the z-potential mayoriginate from the low permittivity of PEG (ewater = 78, ePEG =17.3) as well as the possible deionization of GO functionalgroups in PEG solution.
For simplicity, we did not consider the steric repulsionpossibly induced by PEG adsorption in the total interaction energy.The steric interaction can be significant for a short range smallerthan a few nanometers. Nonetheless, as it is effective only in a shortrange, it cannot influence the calculated results for the variation inthe effective volume with PEG concentration in a long range.
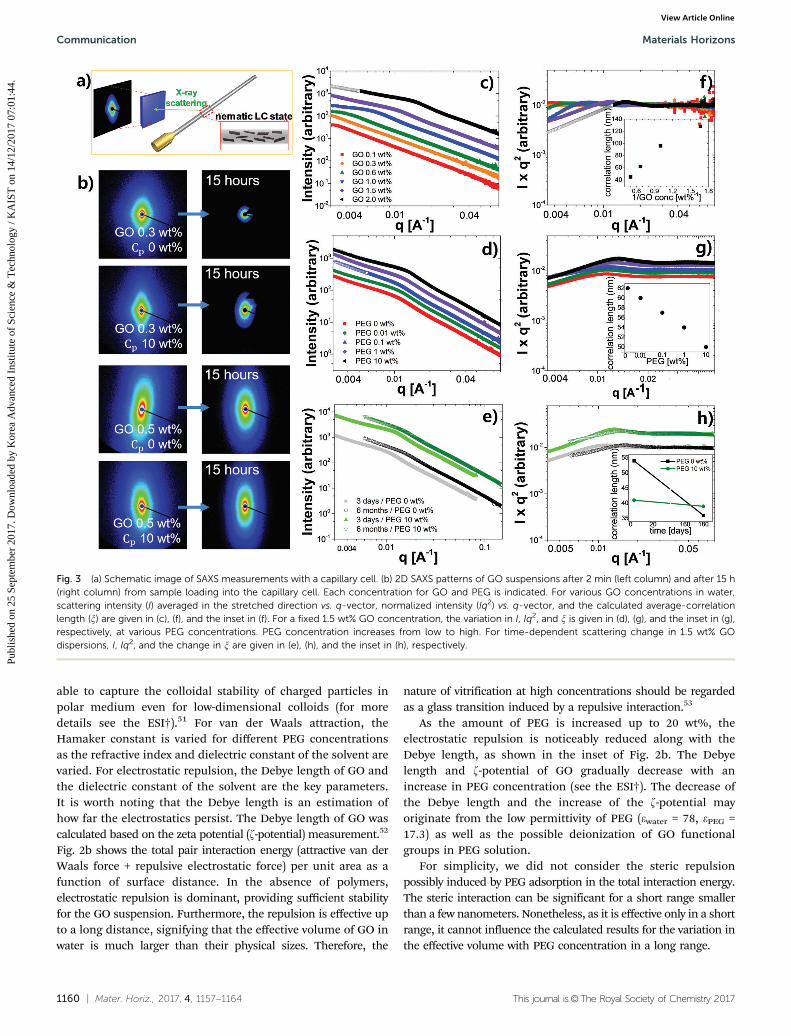
Fig. 3 (a) Schematic image of SAXS measurements with a capillary cell. (b) 2D SAXS patterns of GO suspensions after 2 min (left column) and after 15 h(right column) from sample loading into the capillary cell. Each concentration for GO and PEG is indicated. For various GO concentrations in water,scattering intensity (I) averaged in the stretched direction vs. q-vector, normalized intensity (Iq2) vs. q-vector, and the calculated average-correlationlength (x) are given in (c), (f), and the inset in (f). For a fixed 1.5 wt% GO concentration, the variation in I, Iq2, and x is given in (d), (g), and the inset in (g),respectively, at various PEG concentrations. PEG concentration increases from low to high. For time-dependent scattering change in 1.5 wt% GOdispersions, I, Iq2, and the change in x are given in (e), (h), and the inset in (h), respectively.
Communication Materials Horizons
Publ
ishe
d on
25
Sept
embe
r 20
17. D
ownl
oade
d by
Kor
ea A
dvan
ced
Inst
itute
of
Scie
nce
& T
echn
olog
y / K
AIS
T o
n 14
/12/
2017
07:
01:4
4.
View Article Online
This journal is©The Royal Society of Chemistry 2017 Mater. Horiz., 2017, 4, 1157--1164 | 1161
The repulsive nature of GOs based on the long Debye-lengthindicates the highly effective volume of the GO sheets in waterto form a glass.48 In contrast, adding polymers effectivelyscreens the electrostatic repulsion, as a salt additive does.54
While adding salt changes the ionic strength, adding polymerscan vary the permittivity in this study. While adding saltseventually causes particle aggregation, adsorbed polymers providelong-term stability creating steric layers on GO surfaces, thushampering the direct contact between GO sheets. We conclude,therefore, that the reduced effective volume of GO sheets in thepresence of polymers is the principal cause of the restrained glasstransition and the dramatically reduced viscosity.
We also performed additional experiments to confirm thatthe arrested state is a glass, and not a gel; upon dilution withwater, networks in gels are hardly untangled, while in glass theybecome a homogeneous mixture with water.46 The results of thedilution experiments are given in Fig. 2c, which demonstrate thata highly repulsive interaction between GOs is the origin of thearrested state.
Small-angle X-ray scattering (SAXS) experiments providemore detailed structural information on the LC behaviourand glass formation of GO suspensions. For sample preparation,200 ml of GO suspension was slowly injected into a 1.5 mm thickquartz capillary cell and relaxed for 2 min, as illustrated in Fig. 3a.LC phase formation can be easily monitored in the stretched 2DSAXS patterns.55 When GO concentration is near fn = 0.3 wt%, GOsheets principally align along the longest axis of the capillary cellsand in a partially perpendicular direction to the cell, as indicatedby a diamond shape of 2D patterns in the first row of Fig. 3b. LCsare sensitive to the substrate geometry such that they can easilyalign parallel to the substrate27,56 with a preferential interactionand, moreover, shear flow is given along the longest axis of thecells during sample injection. 2D SAXS patterns show the highlyasymmetric scattering profiles near fn. When a sufficient time of15 h was given for the relaxation of GO sheets, the GO sheetsbecome randomly oriented isotropic liquids, as indicated by thecircular 2D scattering pattern (the first row in Fig. 3b). In contrast,the GO suspension with cp = 10 wt% PEG remained as a nematicLC, but the weakly stretched pattern implies a low degree ofalignment after 15 h (the second row in Fig. 3b). This is inagreement with our observation summarized in Fig. 1a: GO sheetscan form an LC phase more easily in the presence of polymers.
For a higher GO concentration up to 0.5 wt%, 2D patternsbecome more elliptical without any noticeable change after15 h (the third and fourth rows in Fig. 3b). The GO sheets inthis concentration certainly have a better orientation orderthan those in 0.3 wt% and can retain the order for hours.All scattering data at different GO and PEG concentrations areshown in Fig. S5 (ESI†).
Scattering intensity was averaged with a mask based on astretched pattern to obtain the averaged intensity, I vs. q, whereq is a scattering vector (q = 4p sin y/l). A distinct peak is foundin the vertical direction cut while a greatly reduced peak(or even no peak) is found in the horizontal direction cut,implying that GOs are aligned parallel to the long axis of thecapillary cells (see the ESI† for details).57 Considering the
typical scattering behaviour of 2-dimensional materials wherethe intensity decays with q2, the intensity was normalized bymultiplication with q2, as shown in Fig. 3f–h.
Fig. 3c and f show the measured scattering intensity and itsnormalized value for a polymer-free GO suspension at differentGO concentrations. The scattering profiles vs. q-vector showthe prominent peaks, indicative of the correlation distancebetween GO sheets. The correlation distance is a characteristiclength scale for the GO interaction; thus, the average plane-to-plane distance, davg (=2p/q*) could be obtained where q* is thepeak position. As GO concentration increases, the davg becomessmaller. While the davg is inversely proportional to GO concen-trations (the inset in Fig. 3f), no distinctive peak was observedat low GO concentrations below 0.5 wt% within the givenscattering length scale. We also found that the closest distancefor GOs or the effective thickness is around 40 nm or slightlybelow because GO cannot be closer anymore as it becomes aglass. We note that this value is consistent with the calculatedDebye length as shown in Fig. 2b.
Fig. 3d and g show the scattering intensity and the normalizedvalue for the 1.5 wt% GO concentration with various PEGconcentrations, measured a few days after sample preparation.It is worth noting that the davg decreases with PEG concen-tration (the inset in Fig. 3g). The decreasing davg implies thatthe system becomes less repulsive. As suggested above, ionizedGO sheets repel each other more strongly in pure water withoutPEG, which is consistent with the interaction energy calculationsas shown in Fig. 2b. However, as an aqueous GO suspensionbecomes a Wigner glass over time, the characteristic length alsovaries (Fig. 3e and h).
For the confirmation of time-dependent structural change,the scattering intensity of each sample was measured rightafter sample preparation, and again after 6 months withoutevaporation. Fig. 3e compares the initial scattering intensity ofFig. 3d with the measured value after 6 months (the normalizedintensity is given in Fig. 3h). Different time-dependent behavioursare observed with or without PEG additives. While there is littlechange in davg in the presence of PEG (cp = 10 wt%), the davg
decreases substantially without PEG. The GO suspension withcp = 10 wt% is in the liquid state with a low viscosity, and thus,reaches its equilibrium rapidly: davg varies little. In contrast, theGO suspension with cp = 0 wt% gradually transforms into a glass;the davg was 62 nm initially, which decreased down to 35 nm after6 months (the inset in Fig. 3h). Note that the average centre-to-centre distance generally decreases as the system becomes eithera gel or a glass. A similar time-dependent structural change isfound at 0.8 wt% GO concentration (Fig. S7, ESI†).
SAXS experiments provided detailed structural informationsuch as the characteristic length of a GO suspension lying inthe length scale of 10–102 nm. Moreover, the restrained glasstransition of GO suspensions with polymer additives was alsoconfirmed.
The detailed process of glass transition is monitored withrheological measurements. GO suspensions exhibit distinctiveviscoelastic properties based on their LC behaviours. An oscil-latory shear rheometer was employed with a cone-and-plate
Materials Horizons Communication
Publ
ishe
d on
25
Sept
embe
r 20
17. D
ownl
oade
d by
Kor
ea A
dvan
ced
Inst
itute
of
Scie
nce
& T
echn
olog
y / K
AIS
T o
n 14
/12/
2017
07:
01:4
4.
View Article Online
1162 | Mater. Horiz., 2017, 4, 1157--1164 This journal is©The Royal Society of Chemistry 2017
geometry: frequency ( f ) sweep experiments were performed at aconstant stress of 1 Pa; 1 Pa was found to be in the linearviscoelastic region from stress sweep experiments with GO inpure water.42
Fig. S8 (ESI†) shows the elastic (G0) and loss modulus (G00) ofGO suspensions in pure water as the GO concentration variedfrom 0.8 to 1.5 wt%. While both moduli increase with GOconcentration, tan d is lower than unity (o1) at all concentra-tions except for 0.8 wt%, signifying that PEG-free suspensionspossess a solid-like elastic property in the given frequencyranges.58
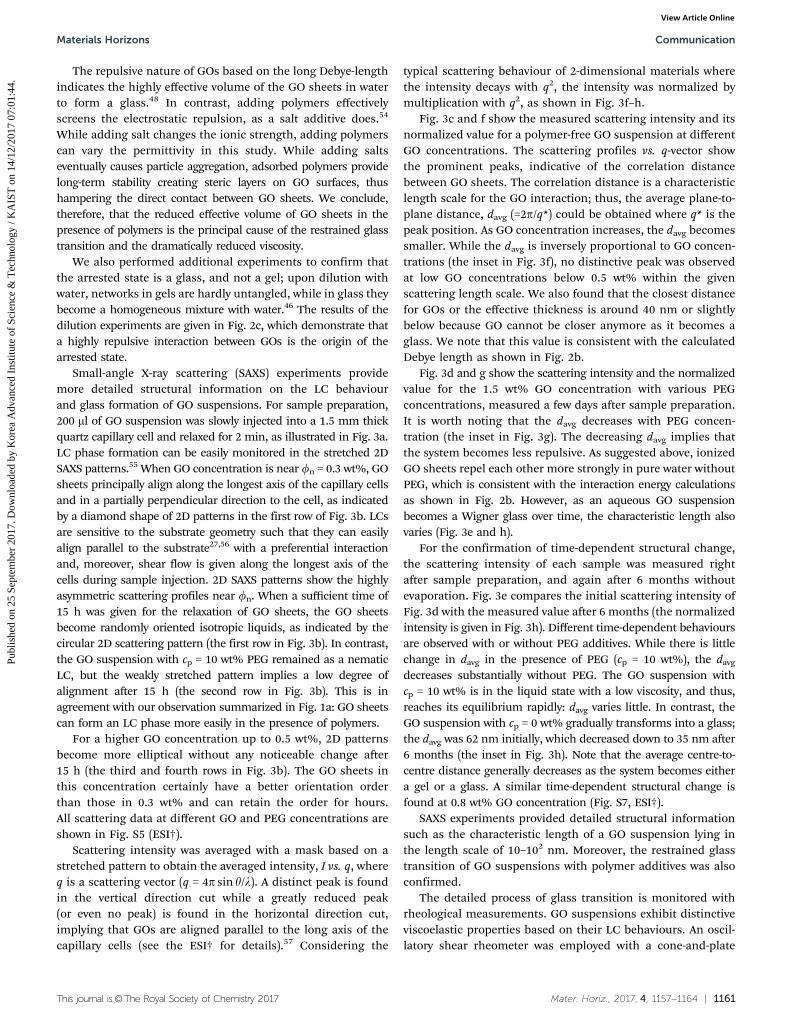
Fig. 4 shows G0 and G00 for 0.5 wt% GO suspensions as PEGconcentration changes from 0 to 1, 10, and 20 wt%. In themeasurements 2 weeks after sample preparation (black sym-bols), G0 and G00 exhibited a liquid-like behaviour (G00 4 G0) inthe measured frequency range.58,59 A significant differenceexists with and without polymers. First, as the PEG concen-tration increases from 0 to 1, 10 and 20 wt%, both the viscousand elastic moduli decrease dramatically. For example, G00 was1, 0.01, 0.005, and 0.001 at f B 0.05 Hz for 0, 1, 10, and 20 wt%PEG concentrations, respectively. This indicates that the visc-osity of the 20 wt% PEG suspension at f B 0.05 Hz would be1000 times lower than that of a pure water suspension (seeFig. S9, ESI† for details).
Second, there is an abrupt transition in G0 at a low frequencyin the presence of PEG. At cp = 1 wt% PEG (Fig. 4b), G0 decreasesinitially but increases back around f = 0.013 Hz. While thetransition is rather unclear at 1 wt%, G0 valleys clearly exist at10 and 20 wt% around f = 0.063 and 0.040 Hz, respectively.Notably, G0 in pure water also rapidly increases in the lowfrequency region, implying that a valley may exist at a lowerfrequency beyond the measurement range. The minimized G0
implies the weakened energy storage at the specific frequency
( fmin) as GO dissipates the energy with flow, while aligningalong the shear. The characteristic time of GO(t) could becalculated from the fmin(t B 1/fmin). According to the natureof system viscoelasticity, the t varies. We note that fmin shifts toa higher frequency with PEG concentration, implying that theGO sheets in PEG solution relax more rapidly than those inpure water due to the reduced viscosity. Further discussion ofthe G0 minimum is given below.
In measurements after 4 months (red symbols), GO suspen-sions with cp = 0 and 1 wt% PEG exhibit a solid-like elasticitywith G0 4 G00, clearly demonstrating a liquid-to-glass transitionover time, as shown in Fig. 4a. While GO suspensions in cp = 0or 1 wt% show a glassy behaviour, GO suspensions with cp = 10and 20 wt% still remain in the liquid state, noting that G0 andG00 are almost the same at a high frequency. We note that0.5 wt% GO suspensions maintain liquid fluidity over a year forall PEG concentrations based on the phase diagram in Fig. 1a;however, frequency-dependent G0 and G00 may show solid-likeelasticity (G0 4 G00) in the given frequency range.13,58,59
The location of fmin also varies over time. The G0 minimumindicates a characteristic timescale where the elastic property ofthe suspension can be minimized. Interestingly, the G0 mini-mum is always observed with G004 G0. After 4 months, no morerapid increase of G00 is observed in the low frequency range forcp = 0 wt% and the G0 minimum no longer exists for cp = 1 wt%.The fact that both are true indicates that GO cannot havethe characteristic time within a given frequency for the cp assuspensions become more elastic over time.
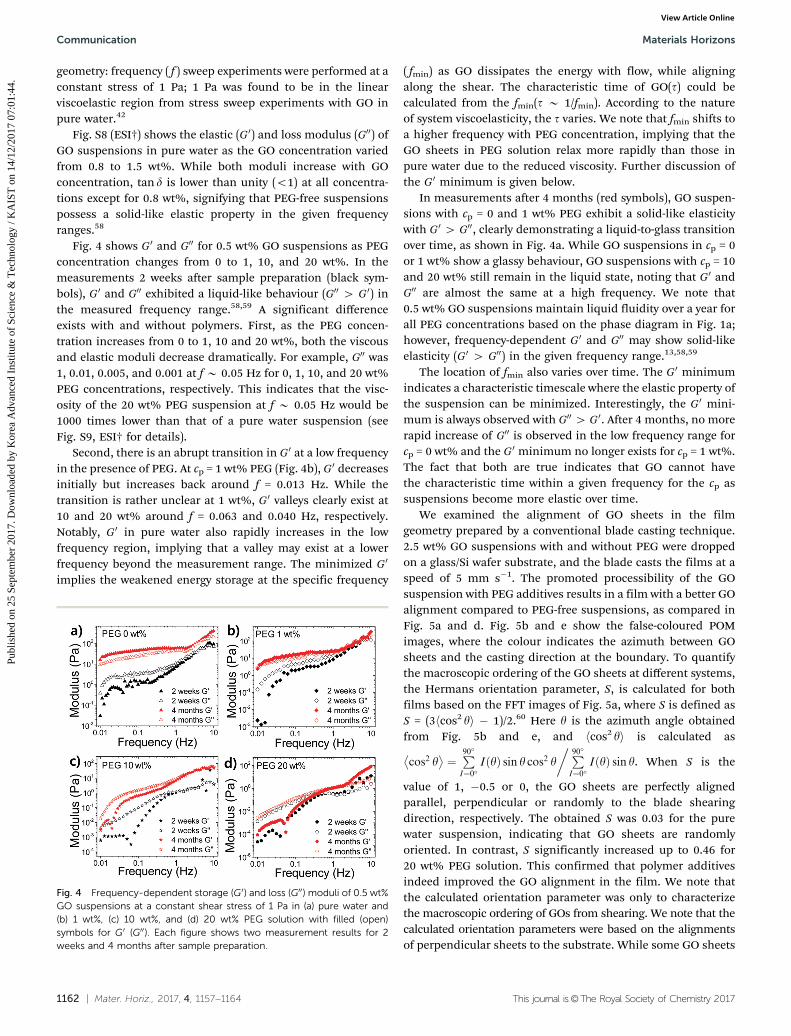
We examined the alignment of GO sheets in the filmgeometry prepared by a conventional blade casting technique.2.5 wt% GO suspensions with and without PEG were droppedon a glass/Si wafer substrate, and the blade casts the films at aspeed of 5 mm s�1. The promoted processibility of the GOsuspension with PEG additives results in a film with a better GOalignment compared to PEG-free suspensions, as compared inFig. 5a and d. Fig. 5b and e show the false-coloured POMimages, where the colour indicates the azimuth between GOsheets and the casting direction at the boundary. To quantifythe macroscopic ordering of the GO sheets at different systems,the Hermans orientation parameter, S, is calculated for bothfilms based on the FFT images of Fig. 5a, where S is defined asS = (3hcos2 yi � 1)/2.60 Here y is the azimuth angle obtainedfrom Fig. 5b and e, and hcos2 yi is calculated as
cos2 y� �
¼P90�I¼0�
IðyÞ sin y cos2 y�P90�
I¼0�IðyÞ sin y. When S is the
value of 1, �0.5 or 0, the GO sheets are perfectly alignedparallel, perpendicular or randomly to the blade shearingdirection, respectively. The obtained S was 0.03 for the purewater suspension, indicating that GO sheets are randomlyoriented. In contrast, S significantly increased up to 0.46 for20 wt% PEG solution. This confirmed that polymer additivesindeed improved the GO alignment in the film. We note thatthe calculated orientation parameter was only to characterizethe macroscopic ordering of GOs from shearing. We note that thecalculated orientation parameters were based on the alignmentsof perpendicular sheets to the substrate. While some GO sheets
Fig. 4 Frequency-dependent storage (G0) and loss (G00) moduli of 0.5 wt%GO suspensions at a constant shear stress of 1 Pa in (a) pure water and(b) 1 wt%, (c) 10 wt%, and (d) 20 wt% PEG solution with filled (open)symbols for G0 (G00). Each figure shows two measurement results for 2weeks and 4 months after sample preparation.
Communication Materials Horizons
Publ
ishe
d on
25
Sept
embe
r 20
17. D
ownl
oade
d by
Kor
ea A
dvan
ced
Inst
itute
of
Scie
nce
& T
echn
olog
y / K
AIS
T o
n 14
/12/
2017
07:
01:4
4.
View Article Online
This journal is©The Royal Society of Chemistry 2017 Mater. Horiz., 2017, 4, 1157--1164 | 1163
lie parallel to the substrate, some GO sheets lie perpendicularto the substrate aligning along the shear direction because ofhigh viscosity of the solution and thick film thickness. Thus,one should use these values to understand the qualitativedifferences of processing between two systems.
Conclusions
We have thoroughly investigated the equilibrium phase behav-iour of GO LC suspensions with or without polymer additivesbased on prolonged careful examination for more than 1 year.The high concentration vitrification of GO LC suspensions inpure water is confirmed to be a glass transition rather thangelation. Polymer additives with a strong attractive interactionwith the GO surface may bring about an unexpected broadconcentration range stabilization of the GO LC phase (Fig. S10,ESI†). The polymer additives induce depletion attractionamong GO sheets and thereby align GO sheets at a low GOconcentration (typically f o 0.2 wt%) so that the critical LCtransition concentration can be lowered. In contrast, at a highGO concentration (typically f 4 0.5 wt%), the same polymersrelieve the electrostatic repulsion among the GO sheets, asconfirmed by our interaction energy calculations basedon DLVO theory,20,51 and thus, retard the glass transition.Ironically, the viscosity of GO suspensions can be lowered by afactor of 102–103 with the polymer additives. This workdemonstrates that a molecular level interaction in GO LCsuspensions is critical in understanding the macroscopicbehaviour of GO based material processing. Based on ourfindings here, fundamental intuitions are anticipated for thenovel design of high-performance GO LC based materials anddevices for a variety of application fields, including energy, theenvironment, and nanocomposites.
Conflicts of interest
There are no conflicts to declare.
Acknowledgements
This work was supported by the Basic Science Research Programthrough the National Research Foundation of Korea (NRF) fundedby the Ministry of Education (NRF-2014R1A1A2056774), theNano Material Technology Development Program through NRFfunded by the Ministry of Science, ICT and Future Planning(NRF-2016M3A7B4905624) and the National Creative ResearchInitiative (CRI) Center for Multi-Dimensional Directed NanoscaleAssembly (2015R1A3A2033061). SAXS experiments were per-formed at the 9A and 6D UNIST-PAL Beamline of the PohangAccelerator Laboratory. The 6D UNIST-PAL Beamline wassupported in part by UCRF, MSIIP and POSTECH. We gratefullyacknowledge Dr Junwoo Jeong for helpful discussions andDr Hyungju Ahn for SAXS experiments.
Notes and references
1 J. Kim, S. Kwon, D. H. Cho, B. Kang, H. Kwon, Y. Kim,S. O. Park, G. Y. Jung, E. Shin, W. G. Kim, H. Lee, G. H. Ryu,M. Choi, T. H. Kim, J. Oh, S. Park, S. K. Kwak, S. W. Yoon,D. Byun, Z. Lee and C. Lee, Nat. Commun., 2015, 6, 8294.
2 L. Xuesong and S. R. Rodney, Science, 2009, 324, 1312–1314.3 D. A. Dikin, S. Stankovich, E. J. Zimney, R. D. Piner, G. H.
Dommett, G. Evmenenko, S. T. Nguyen and R. S. Ruoff,Nature, 2007, 448, 457–460.
4 H. Wang, H. Yuan, S. Sae Hong, Y. Li and Y. Cui, Chem. Soc.Rev., 2015, 44, 2664–2680.
5 S. S. Gong, W. Cui, Q. Zhang, A. Y. Cao, L. Jiang andQ. F. Cheng, ACS Nano, 2015, 9, 11568–11573.
6 S. Ahn, Trans. Electr. Electron. Mater., 2015, 16, 49–52.
Fig. 5 (a and d) POM images of blade-casted GO films, (b and e) the false coloured POM images, and (c and f) the schematic orientations of GO sheetswith calculated orientation parameters. Images (a–c) are obtained for PEG-free pure water suspensions, and (d–f) are for 20 wt% PEG suspensions.The blade casting direction is shown with an arrow (scale bar is 300 mm).
Materials Horizons Communication
Publ
ishe
d on
25
Sept
embe
r 20
17. D
ownl
oade
d by
Kor
ea A
dvan
ced
Inst
itute
of
Scie
nce
& T
echn
olog
y / K
AIS
T o
n 14
/12/
2017
07:
01:4
4.
View Article Online
1164 | Mater. Horiz., 2017, 4, 1157--1164 This journal is©The Royal Society of Chemistry 2017
7 H. Kim and C. W. Macosko, Macromolecules, 2008, 41, 3317–3327.8 Z. Xu and C. Gao, ACS Nano, 2011, 5, 2908–2915.9 J. Y. Luo, L. J. Cote, V. C. Tung, A. T. L. Tan, P. E. Goins,
J. S. Wu and J. X. Huang, J. Am. Chem. Soc., 2010, 132,17667–17669.
10 D. Konios, M. M. Stylianakis, E. Stratakis and E. Kymakis,J. Colloid Interface Sci., 2014, 430, 108–112.
11 S. Park, J. An, I. Jung, R. D. Piner, S. J. An, X. Li, A. Velamakanniand R. S. Ruoff, Nano Lett., 2009, 9, 1593–1597.
12 J. I. Paredes, S. Villar-Rodil, A. Martinez-Alonso andJ. M. D. Tascon, Langmuir, 2008, 24, 10560–10564.
13 S. Naficy, R. Jalili, S. Aboutalebi, R. A. Gorkin, K. Konstantinov,P. C. Innis, G. M. Spinks, P. Poulin and G. G. Wallace, Mater.Horiz., 2014, 1, 326–331.
14 J. E. Kim, T. H. Han, S. H. Lee, J. Y. Kim, C. W. Ahn, J. M. Yunand S. O. Kim, Angew. Chem., Int. Ed., 2011, 50, 3043–3047.
15 T. Z. Shen, S. H. Hong and J. K. Song, Nat. Mater., 2014, 13,394–399.
16 R. T. Ahmad, S. H. Hong, T. Z. Shen and J. K. Song, Opt.Express, 2015, 23, 4435–4440.
17 Y. Luo, G. A. Braggin, G. T. Olson, A. R. Stevenson,W. L. Ruan and S. Zhang, Langmuir, 2014, 30, 14631–14637.
18 P. Li, M. H. Wong, X. Zhang, H. Q. Yao, R. Ishige,A. Takahara, M. Miyamoto, R. Nishimura and H. J. Sue,ACS Photonics, 2014, 1, 79–86.
19 R. Narayan, J. E. Kim, J. Y. Kim, K. E. Lee and S. O. Kim, Adv.Mater., 2016, 28, 3045–3068.
20 M. M. Gudarzi, Langmuir, 2016, 32, 5058–5068.21 Z. Xu, Y. Liu, X. Zhao, L. Peng, H. Sun, Y. Xu, X. Ren, C. Jin,
P. Xu, M. Wang and C. Gao, Adv. Mater., 2016, 28,6449–6456.
22 C. Vechambre, X. Callies, C. Fonteneau, G. Ducouret, S. Pensec,L. Bouteiller, C. Creton, J. M. Chenal and L. Chazeau,Macromolecules, 2015, 48, 8232–8239.
23 M. K. Shin, B. Lee, S. H. Kim, J. A. Lee, G. M. Spinks,S. Gambhir, G. G. Wallace, M. E. Kozlov, R. H. Baughmanand S. J. Kim, Nat. Commun., 2012, 3, 650.
24 T. Z. Shen, S. H. Hong and J. K. Song, J. Phys. Chem. C, 2014,118, 26304–26312.
25 H. Bai, C. Li, X. Wang and G. Shi, Chem. Commun., 2010, 46,2376–2378.
26 Z. Zhu, G. Song, J. Liu, P. G. Whitten, L. Liu and H. Wang,Langmuir, 2014, 30, 14648–14657.
27 B. Yao, J. Chen, L. Huang, Q. Zhou and G. Shi, Adv. Mater.,2016, 28, 1623–1729.
28 Y. Kim, K. Kim, K. B. Kim, J.-Y. Park, N. Lee and Y. Seo, Curr.Appl. Phys., 2016, 16, 409–414.
29 R. T. M. Ahmad, S. H. Hong, T. Z. Shen and J. K. Song,Carbon, 2016, 98, 188–194.
30 W. Ai, Z.-Z. Du, J.-Q. Liu, F. Zhao, M.-D. Yi, L.-H. Xie, N.-E.Shi, Y.-W. Ma, Y. Qian, Q.-L. Fan, T. Yu and W. Huang, RSCAdv., 2012, 2, 12204–12209.
31 U. N. Maiti, J. Lim, K. E. Lee, W. J. Lee and S. O. Kim, Adv.Mater., 2014, 26, 615–619.
32 H. Bai, C. Li, X. Wang and G. Shi, J. Phys. Chem. C, 2011, 115,5545–5551.
33 T. Y. Jiang and C. F. Zukoski, Macromolecules, 2012, 45,9791–9803.
34 S. Y. Kim and C. F. Zukoski, Langmuir, 2011, 27, 5211–5221.35 Z. Zheng, Y. H. Song, H. L. Xu and Q. Zheng, Macro-
molecules, 2015, 48, 9015–9023.36 J. P. Abdou, G. A. Braggin, Y. Luo, A. R. Stevenson, D. Chun and
S. Zhang, ACS Appl. Mater. Interfaces, 2015, 7, 13620–13626.37 T.-Z. Shen, S.-H. Hong and J.-K. Song, Carbon, 2014, 80,
560–564.38 C. Wang, L. Feng, H. Yang, G. Xin, W. Li, J. Zheng, W. Tian
and X. Li, Phys. Chem. Chem. Phys., 2012, 14, 13233–13238.39 P. Tzeng, B. Stevens, I. Devlaming and J. C. Grunlan, Langmuir,
2015, 31, 5919–5927.40 L. Olivieri, S. Ligi, M. De Angelis, G. Cucca and A. Pettinau,
Ind. Eng. Chem. Res., 2015, 54, 11199–11211.41 J. T. Chen, Y. J. Fu, Q. F. An, S. C. Lo, S. H. Huang,
W. S. Hung, C. C. Hu, K. R. Lee and J. Y. Lai, Nanoscale,2013, 5, 9081–9088.
42 P. Kumar, U. N. Maiti, K. E. Lee and S. O. Kim, Carbon, 2014,80, 453–461.
43 B. Fang, L. Peng, Z. Xu and C. Gao, ACS Nano, 2015, 9,5214–5222.
44 B. Wang, J. Liu, Y. Zhao, Y. Li, W. Xian, M. Amjadipour,J. MacLeod and N. Motta, ACS Appl. Mater. Interfaces, 2016,8, 22316–22323.
45 X. Zhao, Z. Xu, Y. Xie, B. Zheng, L. Kou and C. Gao,Langmuir, 2014, 30, 3715–3722.
46 B. Konkena and S. Vasudevan, J. Phys. Chem. C, 2014, 118,21706–21713.
47 Q. Chang, S. Ceneaux, X. Wang, X. Zhang, Y. Wang andJ. Zhou, J. Sol-Gel Sci. Technol., 2014, 73, 208–214.
48 H. Tanaka, J. Meunier and D. Bonn, Phys. Rev. E: Stat.,Nonlinear, Soft Matter Phys., 2004, 69, 031404.
49 B. Konkena and S. Vasudevan, J. Phys. Chem. Lett., 2012, 3,867–872.
50 O. C. Compton, Z. An, K. W. Putz, B. J. Hong, B. G. Hauser,L. C. Brinson and S. T. Nguyen, Carbon, 2012, 50, 3399–3406.
51 D. Saha, R. Bandyopadhyay and Y. M. Joshi, Langmuir, 2015,31, 3012–3020.
52 C. J. van Oss, R. F. Giese and P. M. Costanzo, Clays ClayMiner., 1990, 38, 151–159.
53 R. P. White and F. E. G. Lipson, ACS Macro Lett., 2015, 4, 588–592.54 A. N. Rodgers, M. Velicky and R. A. Dryfe, Langmuir, 2015,
31, 13068–13076.55 Z. Xu and C. Gao, Nat. Commun., 2011, 2, 571.56 F. Guo, F. Kim, T. H. Han, V. B. Shenoy, J. X. Huang and
R. H. Hurt, ACS Nano, 2011, 5, 8019–8025.57 W. Tung, R. J. Composto, N. Clarke and K. I. Winey, ACS
Macro Lett., 2015, 4, 916–920.58 X. Callies, C. Vechambre, C. Fonteneau, S. Pensec,
J. M. Chenal, L. Chazeau, L. Bouteiller, G. Ducouret andC. Creton, Macromolecules, 2015, 48, 7320–7326.
59 C. Valles, R. J. Young, D. J. Lomax and I. A. Kinloch, J. Mater.Sci., 2014, 49, 6311–6320.
60 J. Prost, The Physics of Liquid Crystals, Oxford UniversityPress, 1995.
Communication Materials Horizons
Publ
ishe
d on
25
Sept
embe
r 20
17. D
ownl
oade
d by
Kor
ea A
dvan
ced
Inst
itute
of
Scie
nce
& T
echn
olog
y / K
AIS
T o
n 14
/12/
2017
07:
01:4
4.
View Article Online


![Noncuring Graphene Thermal Interface Materials for ... · graphene research has led to development of several scalable techniques, such as liquid phase exfoliation (LPE)[37,38] and](https://img.pdfslide.us/doc/110x75/5f26d73ea912ed5cd26480f6/noncuring-graphene-thermal-interface-materials-for-graphene-research-has-led.jpg)