Embed Size (px)
Citation preview
1
Literature review for the Energy Demand Research Project
Sarah Darby, Environmental Change Institute, University of
Oxford

2
Summary
1.1. This literature review provides a context for understanding the Energy Demand
Research Project (EDRP) trials, by looking at the results of comparable experiments
and trials around the world. It covers a broad range of trials, but emphasises those
that have been carried out in the most ‘real life’ conditions. Qualitative findings are
combined with the quantitative results, in order to shed some light on the reasons
behind different outcomes. The review is set out intervention by intervention, with
comments on synergies. It also outlines four theoretical approaches to energy
demand and consumption feedback, all of which have their uses when trying to
understand how people react to feedback.
1.2. The diverse trials and experiments summarised here, with their wide‐ranging
results, illustrate that there are few single ‘fixes’ to bring down demand. They also
point to the lack of a standardised approach to researching these impacts (see EPRI
2009 for a systematic attempt to describe and rectify the situation). However, there
are useful general lessons to be learned. The most significant single message is that
improved feedback is necessary for good understanding of energy use and effective
action to reduce it, but not always sufficient.
1.3. Ofgem's March 2010 EDRP progress report stated that ‘if households are to
realise potential reductions in energy consumption, there must be a cycle of learning
and action... it is assumed that this cycle has three inputs: feedback to customers
about energy consumption, advice ... about how to make savings, and motivation ...
to implement that information’. This fits with the framework of ‘knowledge,
understanding, motivation’, set out in Table 1 in relation to the EDRP trials.
Table 1: Mechanisms of change in ‘knowledge/ understanding/ motivation’
framework that can be supported by smart meters.
Input Mechanism in EDRP
Advice and information
(knowledge)
On bills or online
In conjunction with feedback
Through community schemes
Feedback
(understanding)
More frequent billing
More accurate billing
Additional information on bill, including graphs with
historic feedback
Real-time, on visual displays
Motivation Information on potential cost savings through reducing
bills
Offering guaranteed cost savings or financial rewards for
reduction / load-shifting
Generating community engagement by offering rewards
for combined performance

3
1.4. The qualitative evidence for the benefits of feedback in raising awareness is
strong, though this does not always translate into useful action. For people who are
not interested in their energy use, and/or do not feel that they can control it,
awareness-raising can be a valuable initial step.
1.5. Opt‐in experiments and trials with in‐home displays show promising results in
the short to medium term, mostly with already‐motivated customers but sometimes
with uninterested householders. However, the displays can also cause frustration in
people who cannot use the information to improve their situation, and they can
cause conflict in the household, for example when one member wants to make
changes in thermostat settings or appliance usage and another does not. There are
challenges ahead to widen the motivation to understand energy use, to use displays
as part of wider programmes (eg community initiatives or retrofits) and to maintain
interest, eg through time‐varying tariffs.
1.6. Some subsets of a population can be expected to respond better to feedback
than others. An obvious point, but it shows the need to tailor feedback carefully to
circumstances. Examples would be high-consuming owner-occupied households, and
low-income young people.
1.7. Multiple interventions, such as advice with feedback or advice with installation of
efficiency measures, will tend to give better results than single interventions.
A ‘fit and forget’ attitude to interventions such as the provision of an in‐home
display or a website will only tend to lead to savings for people who already have
the motivation and understanding to make use of them. Others will need
additional support, and/or exceptionally good design to make the display or site
immediately engaging and self‐explanatory. Once no-cost energy-saving
responses are exhausted, many householders need guidance on how to access
any available resources to invest in energy efficiency.
Where time‐of‐use electricity pricing is concerned, the research has mostly been
carried out in parts of the world with acute summer‐peaking problems. At this
stage, in this country, there are less pressing needs for variable pricing. The
potential for domestic load‐shifting in the UK is estimated to be no greater than
25%; and most household carbon emissions come from the use of gas for space‐ and water‐heating. However, the desirability of time-varying pricing will increase
as supply margins tighten, as electric vehicles and heat pumps come into more
widespread usage, and as the proportion of intermittent generation increases.
Financial incentives (over and above the incentive of lower bills from reduced
consumption) are normally effective only for as long as the incentive lasts. This
points to a need to revisit tariffs as a means of developing long‐term, built‐in
incentives to contain consumption.
The research literature shows the potential significance of other actors than the
energy suppliers in harnessing public trust and motivation to address energy and
environmental issues.
Community programmes can be highly effective, sometimes involving a relatively
high cost in time and resources. This success points to social and educational
factors at work beyond the usual range of economic incentives and information.
4
Introduction
Mechanisms of change
1.8. Almost all the interventions carried out in the course of the EDRP trials have
been intended to promote energy saving action within the home, with two aimed at
encouraging time‐shifting of electricity use. There were three main ways in which
energy saving was considered likely to happen:
increasing knowledge of how to save energy (energy efficiency information),
increasing understanding of consumption and encouraging a sense of control over
usage via accurate billing and real‐time feedback devices
incentivising action via special tariffs and other financial incentives (motivating
the customer).
Theories of how feedback works
1.9. Four theoretical approaches are relevant to these trials: sociological, economic,
psychological and educational. All are useful in assessing how behaviour might
change, in the short or long term.
Sociological theory
1.10. Modern energy use is largely invisible, energy systems are complex, and daily
practices are significant. Much gas and electricity usage in buildings is ‘invisible’. It is
also usually limited only by the apparatus or appliances through which it flows. Once
switched on, these continue to use gas or electricity until stopped by manual
switching or automatic controls. This contrasts sharply with the use of solid or liquid
fuels, which are burned in finite quantities and can be seen, weighed and poured.
Domestic energy use is also determined by a complex array of factors – physical
systems/ infrastructure, social norms, comfort preferences and options for control.
Sociological research analyses and demonstrates how many factors are normally
within the control of householders, and which are not. It highlights the importance of
comfort standards and expectations, daily routines and practices (Lutzenhiser, 1993;
Shove, 2003; Burgess and Nye, 2008). ‘Practice theory’ emphasises the combined
roles of routines, artefacts and know‐how (tacit knowledge) in influencing actions
(e.g. Wilhite, 2008).
1.11. In the sociological approach, there is not much space for the ‘rational‐economic
consumer’ of classical economic theory. People use energy as they do because they
have particular ideas about what comfort is and how to achieve it, because they have
to work with particular types and designs of building and appliance, are susceptible
to the marketing of new items and practices, and have developed their own
understandings of how to operate the ‘hardware’ available to them. ‘The social and
cultural nature of energy demand may mean effective interventions are specific to a
time and place, not universally applicable’ (Wilson and Dowlatabadi, 2007,
p.189).For the EDRP, this type of theory suggests that improved feedback can make

5
consumption more visible, bring it more within the perceived control of the energy
user, and demonstrate the success or otherwise of different actions, behaviour
patterns and investments. At the same time, sociological theory suggests that we
should not expect much impact from single, stand‐alone interventions, especially in
the long term: energy usage is too complex for that.
Economic theory
1.12. Energy is a commodity and consumers will adapt their usage in response to
price signals. According to this strand of theory, we would expect financial incentives
to have some impact on energy‐using behaviour and energy‐related investments,
with the size of incentive affecting the scale of response. The literature on residential
electricity demand‐shifting in response to time‐varying tariffs demonstrates this, as in
the review of demand response programmes in the USA by Faruqui and Sergici
(2008). Looking both at overall consumption and electrical demand-shifting in the
UK, Owen and Ward note that household gas customers reduced their use by 12%
overall from 2005 to 2007 in response to higher prices. However, in 2008, when the
winter was colder, household gas use rose by 3%, despite prices rising in real‐terms.
There therefore appears to be some available price response for household gas, but
people will understandably choose extra heat rather than save money if the weather
is very cold … Real price increases for electricity between 2005 and 2007 suggested
a modest demand reduction in 2007. [but] In 2008, despite real price increases,
demand for domestic electricity rose by 2.4%. Around one‐fifth to one quarter of
household electrical appliance load could be ‘discretionary’ or price responsive –
mainly wet appliances. (Owen and Ward, 2010b, p7).
1.13. The evidence for a rational‐economic mechanism behind long‐term
energy‐related decisions is mixed. If this were strong, we would expect far more
investment in efficiency measures in the home than is the case, for a start –
especially when fuel prices rise. Customers ‘react in quite different ways to price
levels and price changes’ and ‘even if significant opportunities to save energy and
money are present, only those with certain rationalistic styles may be able to
appreciate that fact’ (Lutzenhiser, 2002, p54). For the UK, a report by OXERA (2008)
finds that [potential] energy savings had little or no influence on decisions to fit
insulation or buy efficient appliances, in a survey of greater than 1000 homeowners.
OXERA saw this partly in rational‐economic terms, as their interviewees had little
idea of the costs and hassle factor involved in installing efficiency measures. But they
also interpreted the findings as illustrating low levels of trust in government and the
energy suppliers responsible for CERT measures. Recent attempts at explaining why
suppliers are obliged to help their customers save energy (such as E.ON’s recent
campaign) may start to improve this situation.
1.14. Reiss and White (2008) develop some of the classical economics‐based theory
of energy demand, using 5 years’ worth of billing data for a random sample of
70,000 Californian households and showing how pricing, public appeals for
conservation and information all had a powerful effect on consumption. This was in
crisis conditions, when it was clear that electricity supply was limited. As electricity
supply margins shrink in the UK, this sense of limits may come to have more
relevance.

6
1.15. Behavioural economics is a growing branch of theory that has something to
offer to energy feedback studies, by analysing responses to financial, social or other
prompts. It is now being applied to energy feedback programmes (e.g. Schultz et al,
2008).
Psychological theory
1.16. Energy use can be affected by stimulus – response mechanisms and by
engaging attention. Early research on energy feedback demonstrated how people
respond in ways that are influenced by context but are still fairly predictable. Fischer,
in her 2008 review of energy feedback from a psychological standpoint, identifies the
following ‘likely features for successful feedback (… effective in stimulating
conservation and satisfying to households)’.
1. based on actual consumption1 (ie accurate and trustworthy)
2. frequent (ideally daily or more often)
3. involves interaction and choice for households
4. involves appliance‐specific breakdown (the review relates to electricity)
5. given over a prolonged period
6. may involve historical or normative comparisons (although the effects of the
latter are less clear) presented in an understandable and appealing way.
1.17. As Fischer points out, the more clearly someone can link consumption to
specific appliances and activities, the more clearly behaviour patterns become
relevant to the size of the energy bill. In the longer term, we could add that feedback
over time can demonstrate the benefits of better insulation and more careful use of
timers and thermostats, or the energy cost of new equipment or increased living
space. Abrahamse et al. (2005) cover a wider spectrum of research in their review of
intervention studies aimed at home energy conservation, taking into account
‘antecedent information’ (e.g. information or standardised advice tips, or
goal‐setting) as well as feedback (consequent information). They point out that
information may increase knowledge, but does not necessarily affect behaviour.
Feedback is effective to the extent that it provides highly specific, relevant,
actionable information, and a means of checking the effectiveness of actions. The
authors conclude that ‘single antecedent interventions are not very effective. Rather,
we found an antecedent intervention’s effectiveness ...to increase when combined
with consequence strategies’ (ibid., p283). The advantages of combined approaches
to complex behaviours are therefore indicated from the psychological as well as the
sociological viewpoint.
Educational theory
1.18. Effective energy use is a skill that is learned through experience in specific
situations. The most widely‐accepted theories of teaching and learning in this country
are based on the idea that people construct meaning continually and incrementally,
experimenting and building on what they know already (e.g. Kolb 1984; Chaiklin and
Lave 1993). Energy users are not a uniform category of learners but a mixed‐ability,
1 Or for building-integrated renewables, on actual generation or water heating.

7
mixed‐age class. They have differing levels of skill and understanding, and different
motives for learning. For example, they may be looking for understanding and ‘right
action’ in relation to the environment; looking for what is ‘wrong’ with their
consumption (and bills) with a view to saving money; trying to keep in tune with
social norms; trying to work with new types of gadget; or some combination of these
and other factors. (For an example of this non‐linear approach to technology
adoption and use, see Aune, 2001 and 2007). Energy users also ascribe different
meanings to information: the same messages will be used in different ways,
according to the awareness of the person receiving them (Williams, 1983).
1.19. According to educational theory, feedback has a role in teaching energy
management skills, and in giving people a sense of their ability to control usage
better. If people can experiment with energy in their homes or workplaces and see
the consequences of their usage (feedback), the literature shows that they typically
increase control over consumption and may form new habits. Effective feedback adds
to what householders already know about their own ‘energy system’ – the nature of
their home, appliances, comfort preferences, daily routines and exceptional events –
and helps them discover what is within their power to change, day by day or over
longer periods, such as switching off, cutting ‘default’ usage by altering settings,
investment in efficiency measures or home alterations. Feedback is seen as a
necessary element in energy education or the building of ‘energy literacy’, which has
to take into account the mixed abilities and motivations of users – including chronic
lack of motivation. Just as teachers are challenged by bored and disaffected
students, so feedback providers are challenged by uninterested customers – for
example, the ‘passive ratepayers’ of a recent IBM study (Valocchi et al., 2009).
1.20. Kempton and Layne (1994) point out how selling energy is very different from
selling ‘solid’ commodities such as groceries. The kWh is easy to meter, for the
utility, but 'irrelevant' to the buyer. We cannot assume that people will know how to
act in order to reduce demand if they have little or no idea how much each end‐use
contributes to that demand, and how it might be altered. In educational terms, they
need to be able to add accurate, trustworthy information (information that they
cannot easily get hold of themselves) to what they already know about their own
energy using habits. Ideally, a consumer needs to know the relative importance of
different end‐uses (disaggregated feedback), and also how effective his/her attempts
to use less energy have been (historic feedback). The first of these is possible,
approximately, if the customer pays attention to real‐time information, or to hourly
data on a day‐late basis2. The second is helped by day-late data and by more
frequent and informative billing. All of these were made available to groups of
customers in the course of the EDRP.
Prepayment
1.21. From theory and experience, we would expect prepayment to assist in
managing energy: through paying for finite quantities of energy services, the user is
2 Disaggregation of electrical appliance usage is now becoming possible to a high
level of accuracy, through advanced signal recognition.
8
constantly reminded that they are using energy. If the meter shows how much credit
is left (as is the case with the keypad meters used in Northern Ireland), there is also
a continuous feedback effect. Approximately 4 million customers in Great Britain are
using at least one prepayment meter. Fourteen per cent of customers (3.7m) prepay
for electricity and there are also 2.5m households (11% of customers) on gas
prepayment (Owen and Ward, 2010a). Low income and vulnerable groups are among
the main users of prepayment meters, with over 50% of users in social groups D and
E, and more than 30% of single parents, the unemployed and those with long‐term
sickness or disability having at least one in their homes.
1.22. In Northern Ireland, 230,000 customers (30%) were using semi‐smart keypad
prepayment meters by mid-2009, with new connections running at 2000 per month.
This takes prepayment beyond the usual demographics: 17% of the NI keypad
customers were estimated to fall into the ACORN 'wealthy achievers' category.
Keypad customers get 2% discount on standard credit prices (ibid.). There is some
evidence for a strong combined impact of prepayment with in‐home displays. Faruqui
et al. (2010) reviewed eight trials of in‐home displays in North American and
Australia and found that the conservation impact was doubled in the two instances
where displays were combined with prepayment. In Northern Ireland (with a more
temperate climate) there is some evidence for a slight conservation impact when
customers change to the keypad meter, with its display of how much credit they
have left3 (Boyd, 2008).
EDRP interventions
1.23. This section brings together qualitative and quantitative information to provide
a commentary on the types of interventions employed in the EDRP trials. It is worth
emphasising that many of the trials recorded here involved relatively small samples
and all were, to some extent, ‘opt‐in’ trials or experiments. The Ontario trials and the
Massachusetts trial come closest to ‘normal’ coverage of a population. The
significance of each trial has to be interpreted in light of who the participants were,
along with their circumstances. This in turn suggests the more profitable ways of
supplying and using feedback information.
Hawthorne effect
1.24. The exact nature and significance of the ‘Hawthorne effect’ is still disputed, but
it is broadly accepted that if people know that they are taking part in an experiment,
or that changes are being made to their living or working arrangements, it is likely to
affect their behaviour. We would expect this to be most marked in relatively
short‐lived experiments, before participants become used to the idea of observation
and intervention. The effect needs taking into account in designing interventions and
interpreting results, and several of the feedback experiments in the research
literature do so, establishing ‘blind’ control groups as well as control groups whose
members know that they are under observation. One supplier in the EDRP set up a
‘Hawthorne effect’ sample group, although it did not actually serve the aim of testing
3 The display shows much more than this, but this is the element that is consulted
most (NIE, pers. comm.)
9
the impact of being in a trial. Customers in the group were sent regular postcards
which asked them to send in their meter readings. The response was low. Another
EDRP supplier observed that many of their trial households have taken part in more
than one survey, and that these will in themselves have been experienced as
interventions. The Hawthorne effect is worth considering in trials, in order to avoid
exaggerating the impact of individual interventions. However, in the event of a
national initiative or rollout, any Hawthorne effect would simply become a part of
overall impact.
Enhanced billing
1.25. Informative billing / graphs on bills, with and without advice. A [standard]
utility bill is a form of feedback in which the feedback loop is too far removed from
the use of inputs to have any information value’ (Gaskell et al, 1982). There are only
a few published records of trials that show the effect of informative billing in isolation
from other factors. The highest recorded savings were achieved in Norway: 10%
over controls when quarterly bills based on an annual meter reading were replaced
first by accurate bills every two months, and then, after a year, by historic feedback
– a comparison with the same period during the previous year. Including advice on
energy efficiency with the bill added nothing to the savings (this contrasts with
findings from several other sources), and the authors concluded that the main single
stimulus to conserve had come from increased billing frequency (Wilhite and Ling,
1995). It appeared that people knew what they needed to do in order to save
energy, and that the improved, more frequent bill prompted them to do it and then,
later, validated their actions by showing the reduced usage. A follow‐up study, on a
larger scale (2000 participants) in which customers phoned in their meter readings
every month, gave comparable savings: 8% over controls, three years after the end
of the trial (Wilhite, 1997 and pers. comm.). It seems that the durable and relatively
high impact from frequent, accurate bills in Norway was primarily due to their
supplying a ‘missing link’: customers were already motivated to save and were then
given something crucial for knowledge and understanding that they had lacked
previously, plus a regular prompt to act. This is relevant to the thinking behind the
EDRP trials to test the impact of increased knowledge, understanding and incentives.
1.26. This high level of savings from more frequent and accurate billing has not been
replicated elsewhere. A review of energy information in the Nordic countries found
savings of 0 - 4% (though not only from enhanced bills; other forms of information
were included). It concluded that the longer the duration of a trial and the more
information available to the customer, the more persistent the effects were likely to
be (Henryson et al, 2000). A trial of monthly, accurate bills with historic and
comparative feedback in Helsingborg, Sweden, found no clear impact on electricity or
district heating usage in 600 homes, compared with controls. But interviews showed
that the new bill improved householders' sense of control over their energy costs,
with almost all interviewees expressing satisfaction (Garay and Lindholm, 1995). This
has its echo in the appeal of accurate bills (or dislike of estimated bills) in the UK,
and the way in which EDF Energy were able to recruit control households for their
EDRP trials by offering an end to estimated bills.

10
1.27. A variant on the informative bill is the home energy report that uses billing
data but is sent out separately, by an organisation that works for, but is separate
from, the utility. The best known example of this is OPower, who report
independently evaluated savings of between 1.5-3.5% against controls from around
10m customers in the USA. The reports show consumption compared with 100
selected neighbours and the five lowest-consuming of those neighbours4. The
reports also offer brief advice, based on specific characteristics of the consumption
data - for example, disproportionately high summer usage. In California, where the
programme has been running longest, savings are holding up over 30 months, with
the greatest impact in summer when consumption is highest. Participation rates are
high, with around 85% of customers showing some sort of response to the reports.
The programme is funded by a $10 charge per customer per year, approved by state
utility regulators who also require proof of effectiveness. OPower claim increased
participation in energy efficiency programmes, as well as direct response to the
reports.
1.28. Other studies of the impact of written feedback give a range of savings from 0
to 13%, but the high figures are associated with small‐scale experiments of short
duration, and usually involve combined interventions, not just improved
billing/written feedback. For example, Midden et al (1983) found savings of 13% and
7% in comparison with controls, for electricity and gas respectively, in 69
apartments which were given weekly written information on
usage in kWh
% increase or reduction on individual's baseline or reference figure
financial consequences of increase or reduction, and
graphs of consumption to date.
1.29. The apartment residents were also given advice at the start of the experiment,
and some were given financial incentives to reduce - this was a high‐intensity
intervention. Interviews after the experiment showed that three particular responses
were most effective in conserving, most often applied, but also most difficult for
people to implement. These were
heating to a lower temperature,
turning the heating down an hour before bedtime, and
having a smaller number of lights on.
1.30. Midden et al. noted that it was very difficult to obtain levels of significance
below p=0.1 because of very large initial differences in consumption within the
groups, an observation that is true of almost all domestic energy trials. They
concluded that individual (historic) written feedback and a combination of financial
incentives and comparative feedback were effective in reducing energy use during
the five months of the project. Comparative feedback was effective only under
certain conditions, while information alone was not effective.
4 http://www.opower.com/Results/Overview.aspx

11
Information on time of use
1.31. The main significance of time-of-use information (not time-of-use tariffs) is
likely to be that it might change customer awareness of the nature of the electricity
supply, endowing it with the extra dimension of time. But information on time-of-use
will become more significant when it relates to variable tariffs. For simple, durable
schemes, this could be displayed on something like a card or fridge magnet. For
more complex pricing, it may be useful to have updates on web‐related applications.
1.32. What we know in general terms about energy information tells us that it
becomes more useful as it becomes more specific and accurate. Showing a
time‐of‐day profile for an average consumer on a bill, for example, as was tried by
one supplier in the EDRP trials, might be expected to confuse some customers, who
would not recognise it as fitting their own routines.
Incentives to reduce consumption
1.33. The research literature shows that, while financial incentives to reduce demand
can be effective, this is usually only for as long as the incentive lasts (Dwyer et al
1993; Abrahamse et al. 2005). They are ‘Extrinsic motivations’ which tend to give
‘minimum compliance’ (de Young 1993). These researchers do not take into account
any lasting effect that might occur if the consumer invested in efficiency measures or
more efficient appliances as part of an effort to gain the incentive, but of course such
incentives would have to be structured for the long term in order to make the
investment worthwhile. The tariffing system would seem to be an obvious way of
introducing long-term incentives to keep consumption below certain thresholds. One
supplier’s tariff, used for the EDRP, has a feedback/ engagement component, in that
customers have to go and read their own meters in order to qualify for reduced
payment.
Incentives to shift electrical consumption
1.34. As noted above, no more than a quarter of electrical appliance load in the UK is
likely to be ‘discretionary’ or price responsive. Much of the literature on load‐shifting
comes from North America, where incentives to shift are offered by suppliers in order
to reduce sharp summer peaks caused by air‐conditioning (and, in the north, winter
peaks exacerbated by electrical heating). But there can be an associated
conservation effect (that is, an effect on overall demand). A trial of real‐time pricing
in Chicago, described under the ‘web‐based display’ heading below, gave a 3‐4%
conservation impact during the summer, measured against baseline, although the
programme was designed primarily for cost savings and peak demand reduction.
Average bill savings were much higher than energy savings, at 20% compared with
the standard tariff, as a result of shifting consumption to low-rate times (Isaacson et
al., 2006). King and Delurey (2005) found an average 4% conservation impact from
24 studies of dynamic pricing, mostly in North America though with the inclusion of a
few European studies.

12
1.35. More recently, a two‐year California trial of time‐of‐use pricing in 330
households found minimal change in response to price signals, although over half of
the householders interviewed said that they had made great efforts to respond. The
qualitative research gives some clues as to why the signals were so ineffective.
Neither the new tariff nor the additional interventions of information and real‐time
displays seem to have added much new information or motivation. The researchers
also found relatively low willingness to make any substantial load reduction: for
example, nearly half the sample were not willing to change from tumble‐dryers to
line‐drying. There was also evidence of some perceived loss of comfort and family
tensions, caused by attempts to shift usage or conserve. The rate of uptake of the
TOU tariff was around 1%, which has been typical for American opt‐in
programmes5.The authors concluded that
future rates should be designed to minimise household disruption,
bills should show effects of load‐shifting on cost, and
major end‐uses should be targeted for programmes, not minor ones that take
effort and are relatively worthless (Peters et al., 2009).
1.36. Isaacson et al. (2006) reported on the Energy‐Smart Pricing Plan (ESPP) run by
a community energy cooperative in the Chicago area, which used real‐time pricing,
with interval meters (meters only ‐ no in‐home displays) and showed that it can be
viable for residential electricity consumers. The ESPP is covered in more detail below
(1.67).
1.37. One EDRP supplier’s TOU trial used a similar metering unit to that deployed in
Northern Ireland – the PRI ‘Freedom’ unit, which gives a breakdown of the number of
units used at each tariff rate and the unit price per kWh of each rate, among many
other items of information on consumption and tariff. Northern Ireland Electricity has
introduced a time-of-day tariff that has been credited with a 10% peak time saving,
while the use of the meter was associated with a 1% reduction in usage compared
with baseline consumption (Boyd, 2008).
Written information (energy‐saving tips) and written advice
1.38. There is little evidence that written, generalised information has a significant
impact on energy usage. One example to the contrary is the study by Gaskell et al.
in 1982 which saw savings of 10% in gas and 22% in electricity compared with
controls, three months after the end of a six‐week trial in which one experimental
group were given advice leaflets, visited each week by researchers to have their
meters read, and interviewed twice. The effectiveness of the leaflets would almost
certainly have been bolstered by the impact of weekly visits and meter readings.
5 Capgemini (2008) give the following estimates of uptake for different
demand‐response‐related interventions: 30‐40% for in‐home displays, 30‐60% for
IHDs + dynamic pricing and up to 20% for websites. Accurate billing (and home
energy reports), reach almost all customers.

13
1.39. Advice, by definition, is more specific than information. The Energy Efficiency
Advice Centres (EEACs) used to estimate savings of 4‐5% following written advice
based on self‐completed home audit questionnaires - that is, specific to the home in
question (Darby, 2003). New Perspectives and Energy Inform (2004) surveyed
householders who had received different modes of advice from the EEACs,
concluding that verbal advice was more effective than written. Verbal advice, of
course, allows for some interaction and gives an opportunity for clarifying the exact
nature of a problem and possible solutions.
In‐home displays
1.40. The term 'in-home display' is used here to cover a range of display monitors
which may or may not be connected to a smart meter, although it is sometimes
reserved only for those that are. There is a range of trials of in‐home displays to
draw on, though there have been many more that are commercially confidential.
Most of the published trials involve ‘clip‐on’ displays, used without smart meters. The
most basic of these show electricity use in real time only. ‘Second‐generation’
displays also show historic usage. Clip-on displays do not give an accurate
measurement of usage, as they do not measure reactive power, but for many users
they give a 'good enough' indication. Interest in acquiring and using displays is
widespread but likely to vary between social groups. For example, a recent survey of
1041 American customers found that 73% of high electricity consumers were
interested in acquiring one, as opposed to 50% of low users, and homeowners more
interested than tenants (Wheelock, 2009). Most experiments and trials with displays
have tended to focus on family homes that are owner‐occupied. The most commonly
used display to date in North American trials has been the Power Cost Monitor which
gives real-time and historic data, with a predictive function.
1.41. Results from PCM trials have varied widely. The most‐quoted is probably the
Ontario trial of PCMs in 382 detached family homes, which gave consistent savings of
6.5% against controls over a year (Mountain, 2006). Only 2% of the families who
were offered monitors in that trial refused them, so the ‘opt‐in’ effect seems to have
been minimal for that social group. Other findings range from minimal effect in a
recent Oregon trial with 365 households6, to 22% savings against controls for a
small sample of homes in Newfoundland and Labrador with electric water heating but
not space heating (Mountain, 2007).
1.42. The two largest‐scale PCM trials to date were carried out in Northern Ontario
(n=30,000) and Massachusetts (n=3,500), reported on by Rossini (2009) and Siems
(2009) respectively. Both had problems with battery replacement and malfunctions,
comparable with those in the EDRP trials of clip‐on displays.
1.43. In northern Ontario roughly a fifth of the customer base took part in the trial,
paying $10 for their displays. There was a small ‘selection bias’, in that customers
who acquired a display but never used it still saved 1.5% compared to the control
group – that is, their initial interest and motivation were associated with slightly
reduced consumption. The 29% who were still using their display after the two years
6 http://energytrust.org/library/reports/Home_Energy_Monitors.pdf
14
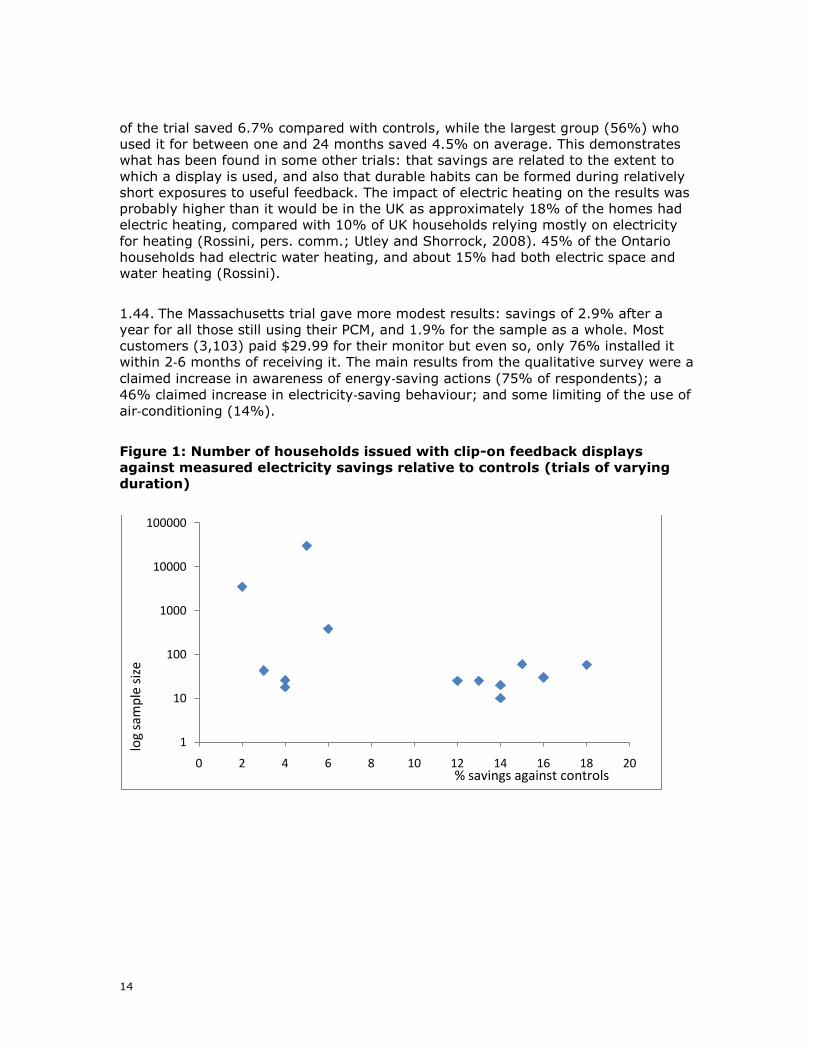
of the trial saved 6.7% compared with controls, while the largest group (56%) who
used it for between one and 24 months saved 4.5% on average. This demonstrates
what has been found in some other trials: that savings are related to the extent to
which a display is used, and also that durable habits can be formed during relatively
short exposures to useful feedback. The impact of electric heating on the results was
probably higher than it would be in the UK as approximately 18% of the homes had
electric heating, compared with 10% of UK households relying mostly on electricity
for heating (Rossini, pers. comm.; Utley and Shorrock, 2008). 45% of the Ontario
households had electric water heating, and about 15% had both electric space and
water heating (Rossini).
1.44. The Massachusetts trial gave more modest results: savings of 2.9% after a
year for all those still using their PCM, and 1.9% for the sample as a whole. Most
customers (3,103) paid $29.99 for their monitor but even so, only 76% installed it
within 2‐6 months of receiving it. The main results from the qualitative survey were a
claimed increase in awareness of energy‐saving actions (75% of respondents); a
46% claimed increase in electricity‐saving behaviour; and some limiting of the use of
air‐conditioning (14%).
Figure 1: Number of households issued with clip-on feedback displays
against measured electricity savings relative to controls (trials of varying
duration)
1
10
100
1000
10000
100000
0 2 4 6 8 10 12 14 16 18 20
log
sam
ple
siz
e
% savings against controls

15
Figure 2: Number of households issued with clip-on feedback displays
against measured electricity savings relative to controls (trials of a year or
longer)
Figure 3: Number of households issued with clip-on feedback displays
against measured electricity savings relative to controls (trials of varying
duration; homes with air-conditioning and/or electrical heating)
1.45. Figure 1 summarises electricity savings (compared with control groups) from
13 trials of in-home clip-on displays on their own, dating from 1979 to 2009, in
relation to the number of people issued with a display. These studies were selected
on the basis of applicability to the EDRP. Figure 2 shows only those trials of displays
1
10
100
1000
10000
100000
0 5 10 15 20
% savings against controls
log
sam
ple
siz
e
1
10
100
1000
10000
100000
0 2 4 6 8 10 12 14 16 18 20
% savings against controls
log
sam
ple
siz
e
16
that lasted for longer than a year. Figure 3 shows findings from trials which included
households using electricity for air-conditioning and/or heating ie those with very
substantial single end-uses.
Qualitative research into in-home displays
1.46. There are now several qualitatively‐slanted studies which investigate whether
and how displays engage customers. The four referred to below are given as
examples.
1.47. Boice (2009): trials of five different types of in‐home display (IHDs) in 95
Nevada households, over six months. The research indicated strong participant
satisfaction with the displays. Just over two-thirds of participants took part in the
end of trial survey. 86% of them said that their IHDs performed well, 83% claimed
they knew how to use them, and 79% would recommend their IHDs to friends and
family. More than 68% supported the utility providing IHDs for free or at a discount,
which would seem to correlate with the two thirds of participants who made savings
while using the displays. Most participants built IHD use into their lives at home, and
were pleased they had done so. However, both the survey answers and the verbatim
comments show that a significant portion of the IHD trial participants were not
served well by mere distribution and installation of devices, without further customer
support. In the first survey, 17% of trial households claimed their IHD had not
performed well; by the third survey, this number had only fallen to 10%. After six
months experience, 15% of respondents did not find the instructions useful, 12% did
not know how to use the device, and 12% would not recommend it.
1.48. In a recent UEA study (Hargreaves et al, 2010), GEO displays tested by East
Anglian householders were mostly well-received, but frustration, despondency and
anxiety were also expressed. The design of the displays was close to that specified
by the focus groups held in Bristol by the CSE in 2009 (Anderson and White, 2009).
The importance of displays being attractive was stressed; also the need to recognise
that household energy use is normally social and negotiated (for example, over the
question of thermostat settings), not a purely individual matter. Again, the need for
a degree of support is indicated, including public policy support.
1.49. SenterNovem (UC Partners, 2009) have developed a display for use in the
Netherlands, the ‘PowerPlayer’, which has some of the characteristics of the GEO
displays, including an analogue ‘speedometer’ to show real time electricity
consumption. It covers gas as well as electricity usage, gives historic as well as real
time feedback, and allows the householder to compare progress each day against a
self‐set target. 18 households were given a display over three winter months; they
were also interviewed, given advice, and asked to take weekly meter readings. A
control group of 18, matched for motivation to conserve energy, were also
interviewed, given advice and asked to take weekly readings. The controls made
some savings but found the process ‘unrewarding’. 14 more households were given
no interventions at all. The experimental group recorded savings of 4% for electricity
against baseline consumption, and 13% for gas. Users found that the PowerPlayer
'functioned as a coach', motivating people to apply known conservation strategies by
showing the effect. They preferred to use the energy rather than the cost units,

17
because costs did not coincide with those on the bill and because energy was ‘out of
the influence zone’ of their supplier, while prices were not.
1.50. The SenterNovem report concludes that the displays gave ‘direct insight, with
no maths needed, instantly. It confronts people with the fact that energy is being
consumed, and shows what appliances/behaviours are responsible’. The report also
states that the PowerPlayer was not much use for people with low environmental
motivation, and that a 'pull' model for marketing is likely to lead to more
conservation and better ROI: initial marketing focus should be to 'heavy users' and
special interest groups. While this conclusion may well be relevant to the UK, it
raises the question of how best to reach some fuel‐poor households who may be
badly in need of better insight into their usage.
1.51. A fourth study, also from the Netherlands, (van Dam et al., 2010), shows a
drop-off in interest and in savings against baseline consumption in 264 households
over a period of 15 months, from a high point of 8% average savings after four
months (based on self-reported meter data). This mean figure masks a wide range
between those who developed a daily habit of checking their display (saving almost
17% over baseline after four months, weather-adjusted, falling off to 8% after 15
months) and those who took a display for four months and then returned it (4% and
zero respectively). Findings included the variability in receptiveness to displays
between households, the greater savings made by those who develop the habit of
consulting their display than those who do not; the crucial role played by design, and
the unsuitability of a 'one size fits all' approach.
Smart meters
Smart meters without other interventions
1.52. Smart meter installation, as a simple matter of meter replacement and with no
other intervention, might be expected to have one or more of three impacts on
householders. The first is the experience of having the installer visit the home, which
is unlikely to do more than raise awareness peripherally (a sort of Hawthorne effect).
The second is the effect of having accurate billing. If the customer (and supplier)
previously relied on estimates much of the time, then the increased accuracy may
give a greater awareness of usage over time. ‘Over time’ could, of course, mean
‘over time of day’ as well as seasonal variation. The third impact could come from
more frequent, accurate billing (see the section above on billing/graphs on bills). In
themselves, smart meters do not necessarily engage customers: much depends on
how a smart metering system is defined, deployed and supported (see Darby 2010
for a discussion of these issues).
Smart meter with ecoMeter in-home display (electricity & gas)
1.53. The ecoMeter functionality includes display of electricity in real time and also
for the previous 24 hours, week or month. It can be used for electricity, gas and
water. ‘Traffic lights’ can be used to show whether current electricity demand is high,
medium, or low, or to indicate the current unit cost of electricity if the customer is on

18
a time-of-use tariff. There is little published research as yet into the use of the
ecoMeter. Black et al. (2009) report 20% electricity and 19% gas savings from use
of a combined ecoMeter and social marketing approach in student houses (see also
below, under ‘community trials’). The students rated energy‐saving posters as the
most influential intervention, followed by nightlights, shower timers and ecoMeters;
the authors concluded that all three intervention options (ecoMeter, social marketing
and combination of the two) had a significant impact on consumption, and that the
project demonstrated the usefulness of providing a variety of tools. Weatherall
(2009) reports on the ‘Eco‐Pioneer’ pilot programme, which also used ecoMeters.
Recruitment and start up phases were 'resource intensive', and there was a need to
develop strong working relationships with project partners: 'an engaging and
seasonally focussed incentive program for householders participating in the program
should be developed in advance of the program being implemented’.
Feedback from meter reading or displays combined with advice
1.54. The figures below summarise quantitative findings for studies where (specific)
advice was given in conjunction with in‐home displays. The outcomes are somewhat
better than for displays alone. The largest study lasted for three years; the others
were of relatively short duration.
Figure 4: Number of households with advice and self-meter-
reading/feedback displays, against measured electricity savings (%). The
study with n=1000 lasted for three years. The 4% savings figure is against
baseline; the other three are against controls.
1
10
100
1000
0 5 10 15 20 25 30
log
sam
ple
siz
e
% savings
19
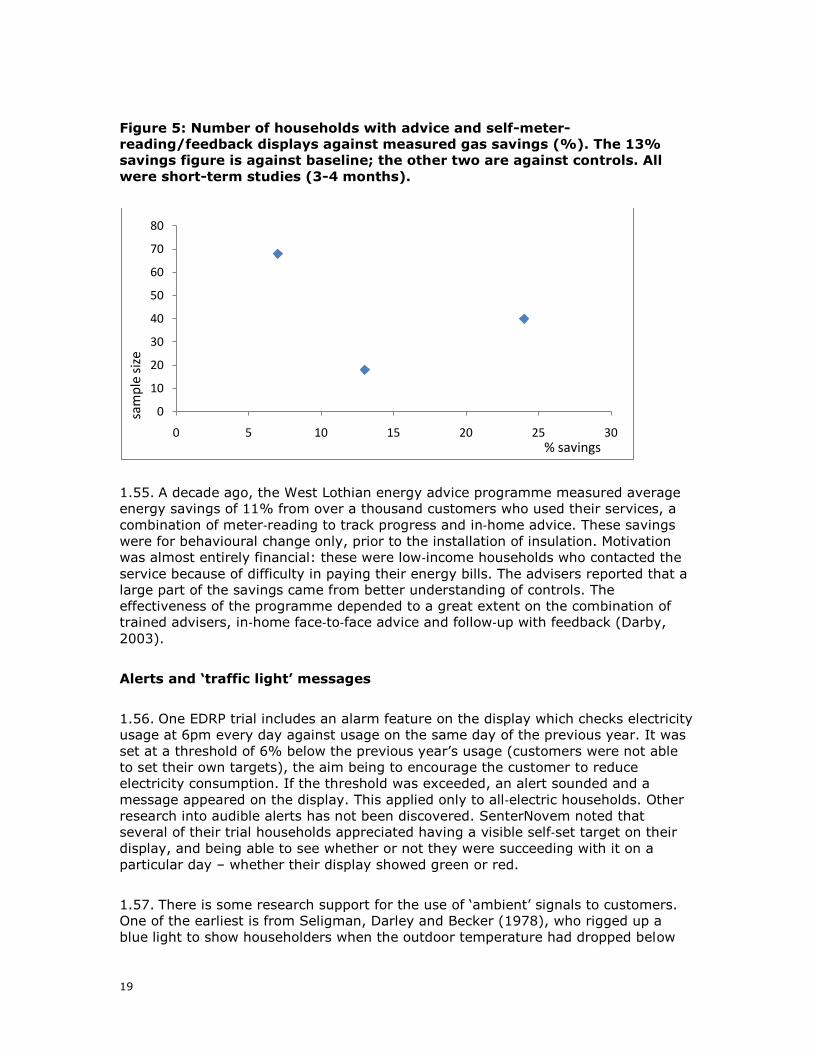
Figure 5: Number of households with advice and self-meter-
reading/feedback displays against measured gas savings (%). The 13%
savings figure is against baseline; the other two are against controls. All
were short-term studies (3-4 months).
1.55. A decade ago, the West Lothian energy advice programme measured average
energy savings of 11% from over a thousand customers who used their services, a
combination of meter‐reading to track progress and in‐home advice. These savings
were for behavioural change only, prior to the installation of insulation. Motivation
was almost entirely financial: these were low‐income households who contacted the
service because of difficulty in paying their energy bills. The advisers reported that a
large part of the savings came from better understanding of controls. The
effectiveness of the programme depended to a great extent on the combination of
trained advisers, in‐home face‐to‐face advice and follow‐up with feedback (Darby,
2003).
Alerts and ‘traffic light’ messages
1.56. One EDRP trial includes an alarm feature on the display which checks electricity
usage at 6pm every day against usage on the same day of the previous year. It was
set at a threshold of 6% below the previous year’s usage (customers were not able
to set their own targets), the aim being to encourage the customer to reduce
electricity consumption. If the threshold was exceeded, an alert sounded and a
message appeared on the display. This applied only to all‐electric households. Other
research into audible alerts has not been discovered. SenterNovem noted that
several of their trial households appreciated having a visible self‐set target on their
display, and being able to see whether or not they were succeeding with it on a
particular day – whether their display showed green or red.
1.57. There is some research support for the use of ‘ambient’ signals to customers.
One of the earliest is from Seligman, Darley and Becker (1978), who rigged up a
blue light to show householders when the outdoor temperature had dropped below
0
10
20
30
40
50
60
70
80
0 5 10 15 20 25 30
sam
ple
siz
e
% savings

20
68oF, to prompt them to turn off their air‐conditioning and open the windows. More
recently, ‘energy orbs’ have been adopted successfully in parts of the USA to
encourage adoption of time‐of‐use pricing; the orb changes colour according to the
current price band and can flash in advance of a period of ‘critical peak’ pricing
(Martinez and Geltz 2005; CNT Energy 2008).
1.58. In their study of ecoMeter use by university students, Black et al. (2009) note
that ‘often power was reduced because the unit displayed red’. The SenterNovem
‘PowerPlayer’ trial participants appreciated the green and red signals on their
displays, according to whether they were meeting their target consumption for the
day. Early findings show a mixed reception to ‘traffic light’ colours on the ecoMeter
display used in three EDRP trials. Mostly positive, but some customers found the red
lights alarming. They could not define for themselves what constituted ‘red’ levels of
consumption: the displays were pre‐set, with the supplier making that decision.
Web‐based display
1.59. The research literature to date, largely based on the use of utility websites,
suggests that this type of feedback is mostly for enthusiasts and/or people who have
been engaged by skilful marketing and good relationships with the supplier. Below
are summaries of several research projects, indicating some likely reasons for
success or failure in achieving demand reduction and/or customer engagement.
1.60. The EDRP trails also included information displayed via the TV. Although
previous research on this has not been identified, the same issues may arise as with
web‐based feedback, in that people are likely to need a strong motivation to use
their TV for energy feedback rather than entertainment.
1.61. Skånska Energi is a small utility with around 70,000 customers, that has been
offering hourly data on electricity use, a day late, to all customers with internet
access since 2001/2 (Ersson E & Pyrko J 2009a). As a local utility it is well‐trusted.
This study looked at trends in consumption over the previous three years, comparing
them with average consumption over the three years before that. 26% of the
customers surveyed by post (n=135, a 45% response rate) said that they used the
statistics to some extent (though not frequently – up to five times a year). The
most‐quoted reason (for 26% of users) was that they wanted better control over
their consumption. However, over three years weather‐corrected consumption by
users of this web‐based feedback rose by 25%, while for non‐users it fell by 8%
(from 18,500 to 17,000 kWh/yr). Of those who said that they didn’t use the
feedback, the main reason was that they didn’t realise it existed (43% of the
sample), in spite of repeated messages about the service from Skånska Energi. A
further 23% of non‐users stated that they didn’t have time, interest or need. The
explanation offered is that customers fall into three categories:
‘Engaged’ customers (or, we might say, concerned/conscientious customers)
People with low usage
People with high and rising usage, accumulating more appliances and applications
for them.

21
1.62. Those in the third group were considered most likely to contact customer
services, out of concern that their bills are incorrect, especially at a time of rising
prices7. Customer services would then direct them in the direction of the website,
where they would see that in fact their bills were accurate, and that they were still in
control of their usage. As they could afford the bills, there was no further reason for
concern. These customers had probably consulted the web data because their
consumption was rising, not vice versa. If the internet consumption graphics were
not a cause of raised usage, though, they did not appear to be doing anything to
counter it in this example, and the reason would seem to lie with customer
motivation – to understand what was going on and to avoid being cheated, not to
reduce consumption. For the first and second groups, the most likely explanation
seems to be that rising prices had had some impact, and consumption came down in
response. These groups are also likely to have had less ability or inclination to buy
more consumer electronics etc. The researchers tested energy awareness through a
series of questions, and the feedback users scored slightly higher (but significantly
so) than non‐users (3.43 v. 1.75 on a scale of minus 10 to plus 14).
1.63. The second case study concerned Öresundskraft (Ersson E & Pyrko J (2009b)),
another local utility with 25,000 customers. They began to offer ‘Dina Sidor’ in 1998,
a self‐meter‐reading arrangement. They offered monthly data online. Participation in
the service appeared high, with 66% of those surveyed (40% response rate) saying
that they used the service at least once a year. However, 23% of that 66% only used
it to send in readings, but did not check the online feedback. 51% of all respondents
sent in readings at least once a year, and checked their feedback. The most common
practice was to send in a meter reading after receiving a bill, which would prompt
the householder to check whether the estimated bill was accurate. 26% of those
surveyed said that the main reason for using ‘Dina Sidor’ was so that they didn’t
have to wait in for a meter reading. 18% wanted better control of usage. Reasons for
not using it were: no access to internet (30%); no time, interest or need (11%);
customers had their own statistics/records (9%). Data was analysed for the three
most recent years, for two groups of customers: those in villas/semis/terraced
houses and those living in flats. For the flats, where the default arrangement is
normally a quarterly bill, usage by ‘Dina Sidor’ participants went up by 18%. (For
non‐participants it varied between 10% up or down over the three years.) For
villas/semis/terraced houses, where the default arrangement is normally a bill at
least every 2 months, usage by participants went down by 13%. (For
non‐participants, it varied between 20% up or down.) A likely explanation for these
results is that customers with houses used the site more frequently (because they
typically checked it on receiving a bill), and they were more likely to be homeowners
rather than tenants, with more scope for savings. Energy awareness scores between
feedback users and non‐users did not differ significantly.
1.64. E.ON piloted a new scheme, ‘Energi Dialog‐Privat’ (Pyrko J, 2009), between
2008 ‐ 2009, giving online feedback showing hourly data and also real‐time data.
They had many problems in rolling out this service, which the customers were not
necessarily aware of, and the study was carried out at a very early stage in the
7 A similar pattern seems to have occurred in Bakersfield, California, where
customers have brought a class action against Pacific Gas &Electric following the
installation of smart meters, claiming that they have caused higher bills.

22
programme. About half of the customers approached by E.ON agreed to use the
service, but only 55% of those actually used it. Between September 2008 and June
2009, 200 users reduced their consumption by .04% on average, while non‐users’
consumption rose by .02% - a negligible effect. Reasons given for using the service
were control over usage (10%); environmental concern (9%); and novelty value
(13%). Reasons for not using it were: no time (26%); problems with the service
(17%); difficult to understand (3%). Energy awareness scores between the feedback
users and non‐users did not differ significantly.
1.65. SEAS‐nve in Denmark is a customer‐owned cooperative, with a strong
customer focus. They demonstrate one of the most successful uses of a website, with
customer data supplemented by competitions, entrance into a lottery for
self‐meter‐readers who send in their readings, a newsletter, and much interaction.
The site is called ‘Min meter’. SEAS‐nve report a ‘Family Challenge’ scheme in which
they offered advice and incentives along with the web service, and participants
achieved impressive savings – 17% on average.
1.66. Karbo and Larsen (2005) describe a national (not utility-supplied)
internet‐based service, Selvtjek, for households, with advice based on specific
appliances and consumption behaviour. It is based on 15‐minute interval metering
(see www.selvtjekbolig.spare.dk/). Data included total annual consumption
compared with predicted consumption, in kroner; load profile for last 24 hrs; and
consumption distribution over five user‐defined periods, day and night. There was
also appliance‐specific breakdown based on interview data, on request. Savings of
around 10% were estimated from use of the service, if the advice was followed.
Almost 40,000 households in Denmark had visited the site at the time of publication;
about a year after the project began (1.7% of all Danish households). Of these, 98%
provided background information and received a graphical comparison with similar
households. About 25% of users moved on to more detailed pages, and almost all of
those ordered a savings report. Approximately 25% of these saved their data by
creating a user profile. The proportion who went all the way through the process was
therefore 25% x 25% x 1.7% = 0.11% of the population. Anecdotally, the site was
thought too complex for widespread usage.
1.67. Benders et al. (2006) describe a web‐based energy information tool, tested in
Groningen with 300 households over 5 months, giving energy reduction of 4.3%
compared with controls (not significant at p<0.05). Take up was low: 5000
households were mailed, 347 started the experiment and 190 completed it ‐ 3.8% of
those mailed. Some participants had to be dropped because of faulty
computers/Internet connections, because they were given miscalculated feedback,
and because household size changed.
1.68. Isaacson et al. (2006) reported on the Energy‐Smart Pricing Plan (ESPP) run by
a community energy cooperative in the Chicago area, which involved some use of
online information. They used real‐time pricing, with interval meters (but no in‐home
displays) and showed that it can be viable for residential electricity consumers. 221
customers were also issued with programmable thermostats for their central air
conditioners. Data over 3 years for more than 1400 participants (1.8% of those who
were offered the service by mail) showed overall savings of 3‐4% in summer against

23
estimated baseline consumption, although the programme was not designed for
energy conservation but for cost savings. Average bill savings were 20%, compared
with standard tariff. Low income households and larger families were more likely to
do more to change usage during high‐priced days. Their feedback came mostly by
way of a written report mailed twice a year or on request and, for those who were
online, a website with password‐protected accounts, with data by month, day and
hour, in table and graphical formats along with comparisons of costs under ESPP and
standard rates. Participants received almost daily reminders of prices at times – by
phone (mostly) or by email. Those with email notifications had higher price elasticity
of demand, while those online were more responsive. The notifications kept energy
use 'top of mind', with 80‐90% finding them useful. 70% of the sample had internet
access at home, but only 220 of them (22%, or 16% of the whole) logged on, for a
total of 696 visits (Marjorie Isaacson, pers. comm.). One of the main issues was the
lack of real time information. Saving money was the primary reason why people
joined ESPP but 41% said that they were also satisfied/very satisfied with how the
programme helped them understand how to use and save energy. They ranked
programmable thermostats lower than the intangible benefits from their increased
ability to control bills and environmental impacts.
1.69. The 'Energikollen initiative' in the central Swedish city of Vaexjoe has been
offered to 28,000 customers of the local electricity supplier. They were able to log on
to a website giving them daily/weekly/monthly/annual feedback charts and also the
outdoor temperature, cost, and comparisons with neighbours. Between May and
October 2008 there were 1,200 unique users logged in – just over 4%. The
organiser for Vaexjoe comments that ‘Activities to make people log on to
Energikollen have been difficult. When logging on, people need their customer
number and code from [the supplier]. These can be read from their bills, but seems
to be something that makes people not log on. Discussions regarding new ways of
logging on to the system are in progress….’ However, ‘The first view where they can
see if they use more or less energy than average has made certain people feel
comfortable, now they can easily see if they change their behaviour. People now
show positive reactions to the possibility of seeing energy consumption day by day.
They are now better able to understand what happens if they change their behaviour
… the reactions from users are very positive…’ (Report by Martin Magnusson for
Vaexjoe Energi AB, 31.10.08).
1.70. In the PA Consulting (2010) smart meter monitoring pilot, a public non-profit
energy services company supplied 91 high-consumption Maine households with
in‐home monitoring systems for a year. They were given information and training,
then had access to a web‐based ‘dashboard’ showing real‐time demand, plus savings
in kWh, $ and carbon dioxide. The site also gave opportunities to learn about and
sign up for energy saving activities. After a majority of participants had been in the
pilot for 5‐8 months, 66 participants and 196 non‐participants were surveyed by
phone. Customer interest was reported to be high, in spite of many installation
difficulties, and 90% said that they were very interested in keeping the monitor and
paying for the service after the 12‐month pilot period. They were most interested in
the 'house monitor graph'; least in CO2. 26% logged in daily, and 21% 3‐6 times per
week; 33% 1‐2 times per week, and 20% less than once a week. Average savings
over the year were 9.3% against controls, with three quarters of the participants

24
making savings. The strongest predictor of savings was the frequency and nature of
interaction with the monitor.
1.71. co2online is a non-profit limited liability company which aims to reduce carbon
dioxide emissions 'through dialogue'. It has implemented several campaigns for
households and communities, works with a wide range of commercial, government
and NGO partners and is now part-funded by the German Federal Ministry for the
Environment. Its offerings include online 'energy advisers' on 12 topics, which have
been used by over 3m clients since 2004; an interactive 'energy savings account'
with personalised monthly email feedback, and heating surveys8. Claims for carbon
savings are backed by a large database of participant meter readings.
1.72. To summarise evidence to date for web‐based feedback:
The most promising uses of the utility-based websites seem to be with particular
subsets of the population and/or specific, focused programmes.
There may well be more scope for non-utility sites.
Substantial demand reductions cited above came from
o a subsample of householders (mostly home owners) who used a site to
check their data when they received a bill, typically every two months;
o participants in the SEAS‐tve Family Challenge, which combined elements
of competition and advice with the use of feedback – own‐meter‐reading
by the families, and web‐based feedback from the utility;
o households who were given information and training online, from a non-
profit company, ie one that did not have a perceived interest in volume
sales.
There is likely to be a segment of the population who will use a website to check
consumption, but may have no intention of reducing it,
There is considerable apathy towards most utility sites: special efforts have to be
made to attract visitors and to build up participation rates,
There is a balance to be struck between offering rich detail to people who are
really interested in researching their usage, and making the sites simple and
attractive for newcomers.
1.73. The evidence to date suggests that online data is more likely to be useful as a
complement to in‐home displays than as a substitute, but this is a fast‐changing area
of research and development. There are already many new web‐based energy
applications now available via mobile phones, personal organisers etc, with one
developer commenting that around 50% of the population now engage hourly with
some form of online material, and that there is already 30% penetration of smart
phones. Another recent development is online feedback that does not come direct
from the utility, (although it may be offered by the utility as a service to customers)
the best-known probably being the Google PowerMeter. Concern about data privacy
is likely to be a consideration for some customers, for all online feedback; for others,
this will seem insignificant in relation to the information that they already exchange
online.
8 http://www.co2online.de/marginal-navigation/international.html

25
Heating controller
1.74. There is a background of research evidence showing that many householders
(a majority) do not use their heating controls in the way intended, and/or fail to
realise the efficiencies intended by programmable controls (e.g. Pett and Guertler,
2004; Stevenson and Rijal, 2008). The CSE qualitative trial of displays found some
unwillingness to use buttons to change screens, and some preferences for the
‘Current Cost’ monitor because everything was on one screen (Anderson and White,
2009). This reflects a widespread caution about fiddling with controls, lest it leads to
a malfunction or the loss of useful information. There may well be a generational
effect at work here, with younger householders more at ease with toggling between
screens.
1.75. The heating controller trial for the EDRP included a real‐time portable display
unit along with a new heating controller and room thermostat. The 'central heating'
screen included a programme to set up to three different heating times and
temperatures, split by week days and the weekend, with default setting of 10oC, an
‘advance’ program to activate the next program, the option of turning off heating
altogether and a scale to show when the heating was programmed to be on or off.
There was a separate hot water screen with similar functionality.
Community trials
1.76. Community initiatives are high‐intensity and expensive in time and resources,
though they can offer economies of scale, e.g. bulk‐buying of insulation. Three
examples are given here: of ‘communities of intention’ (Ecoteams); geographical
communities, activated by an outside initiative ('Green Streets', the closest parallel
with the communities who participated in an EDRP trial); and a fairly homogeneous
student community, living in 8‐person dwellings.
1.77. One of the strongest published examples of a European community initiative is
probably that of the Dutch eco‐teams, as reported by Staats et al. (2004). 150
households met monthly in small groups for nine months. Two years later, they were
making average gas savings of 17% on a weather adjusted baseline and electricity
savings of 8%. At the end of the nine month programme, these figures had been
20% and 5% respectively. The authors noted that a detailed analysis of one
behaviour, means of transportation, suggests that change can be predicted from the
interplay between behavioural intention and habitual performance before
participation, and the degree of social influence experienced in the EcoTeam during
participation.
1.78. The Green Streets competition was a well‐publicised initiative from British Gas.
The project challenged groups of householders in eight streets across the UK to
compete to save energy and CO2, and to win a £50,000 prize for their community.
The households were given an energy audit before the experiment began. They
received advice and support from experts, and each street was given money to
spend on efficiency measures. At the end of the competition, the residents had saved
an average of 25% on their energy usage (against a weather‐adjusted baseline), and

26
23% of their CO2 emissions. The evaluators recommended that ‘the roll‐out of smart
metering, including in‐home displays, should proceed as rapidly as possible, as this is
likely to have a significant impact on awareness of energy use, and stimulate energy
saving. The Government should encourage innovation in the development of different
in‐home displays, but ensure that minimum standards are in place to cover any
display format’ (Lockwood and Platt 2009).
1.79. Black et al. (2009) describe a project carried out with 144 students who lived
in eight-person cottages, in New South Wales. Interventions were in three phases, of
7+8+11 weeks. The main comparisons were between use of the ecoMeter (with
smart meters), a ‘social marketing’ approach (shower timers; night lights, and
weekly feedback reports), and a combination of the two. Overall, the students saved
20% electricity and 19% gas against controls when using the combination, and 24%
and 22% from the ‘social marketing’ alone. The authors concluded that both
strategies contributed to the changes in consumption and that the ecoMeter had
clearly had an impact, probably due to immediacy. There were indications that
students began to develop new social norms, with the greatest effect being noticed
in cottages where the most students 'bought into' the project.
Spill-over effects
1.80. There is very little evidence either for or against spill-over effects, in which
interventions aimed at gas consumption also affect electricity use, or vice versa.
Intuitively it seems likely that increased awareness of energy use will have some
impact in both directions; but heating consumption is normally of a different order of
magnitude from appliance consumption, less visible, and on a different timescale.

27
1.81. References
Abrahamse, W, Steg, L, Vlek, C and Rothengatter, T (2005) A review of
intervention studies aimed at household energy conservation. Journal of
Environmental Psychology 25, 273-291
Anderson, W and White, V (2009) Exploring the functionality of real-time home
energy displays. Report to the Energy Saving Trust. Centre for Sustainable
Energy, Bristol.
Aune, M (2001) Energy technology and everyday life – the domestication of of
Ebox in Norwegian households. Proceedings, European Council for an Energy-
Efficient Economy, Paper 4,002
Aune, M (2007) Energy comes Home. Energy Policy 35, 5457-5465.
Bayard Group (2006) AMI benefits analysis/ Home Energy Efficiency Trial period
2 survey results.
Benders, RMJ, Kok, R, Moll, HC, Wiersma, G, and Noorman, HC (2006) New
approaches for household energy conservation. In search of personal household
energy budgets and energy reduction options. Energy Policy 34 (18), 3612-3622.
R Kok, HC Moll, G Wiersma, KJ Noorman (2006) New approaches for household
energy conservation. In search of personal household energy budgets and energy
reduction options. Energy Policy 34 (18), 3612-3622.
Black, R, Davidson, P and Retra, K (2009) Facilitating energy saving behaviours
among university student residents. Report no. 53, Institute for land, water and
society, Charles Sturt University, Victoria, Australia
Boice, C (2009) Home energy display market test. Demand side plan technical
appendix, Book 4 of 9. Application of Nevada Power Company d/b/a NV Energy
seeking acceptance of its Triennial Integrated Resource Plan covering the period
2010-2029, including authority to proceed with the permitting and construction of
the ON Line transmission project. Before the Public Utilities Commission of
Nevada.
Boyd, J (2008) Presentation to UKERC seminar, Managing residential electricity
demand: Learning from experience in the UK and Ontario, May 21-23.
www.ukerc.ac.uk/Downloads/PDF/Meeting%20Place/Events/2008/05UKcanadade
mandred/Boyd,%20Jenny.pdf
Burgess, J and Nye, M (2008) Re-materialising energy use through transparent
monitoring systems. Energy Policy 36 (12), 4454-4459
Capgemini (2008) Demand Response: a decisive breakthrough for Europe.
Capgemini in collaboration with VaasaETT and Enerdata
Chaiklin, S and Lave, J (1993) Understanding practice: perspectives on activity
and context. Cambridge University Press, UK
CNT Energy (2008) Demonstrating PriceLight Technology to improve household
energy efficiency in Central and Southern Illinois. Final report, CNT Energy at the
Center for Neighbourhood Technology.
Darby, S (2003) Making sense of energy advice. Proceedings, European Council
for an Energy-Efficient Economy summer study. Paper 6, 157
Darby, S (2010) Smart metering: what potential for householder engagement?
Building Research and Information 38 (5), 442-457
De Young, R (1993) Changing behaviour and making it stick: the conceptualistion
and management of conservation behaviour. Environment and behaviour 25 (4),
485-505

28
Dwyer, WO, Leeming, FC, Cobern, MK, Porter, BE and Jackson, JM (1993) Critical
review of behavioural interventions to preserve the environment: research since
1980. Environment and behaviour 25 (3) 275-321.
EPRI (2009) Residential electricity use feedback: a research synthesis and
economic framework. Electric Power Research Institute, Palo Alt.
Ersson, E & Pyrko, J (2009a) El-info via digitala kanaler. Fallstudie 1 ”Min
elförbrukning” hos Skånska Energi. (Information via digital channels. Case study
1 ”My electricity use” at Skanska Energy). Lund University, Energy Sciences,
ITRN LUTMDN/TMHP--09/3039--SE.
Ersson, E & Pyrko, J (2009b) Ersson Elin & Pyrko Jurek, El-info via digitala
kanaler. Potential att förändra elanvändning i bostäder, Fallstudie 2: "Dina Sidor"
hos Öresundskraft, Energivetenskaper, Lunds Universitet - LTH, ISRN
LUTMDN/TMHP-- 09/3042—SE.
Pyrko, J (2009c) Case study with E.ON.
EST (2007) The Ampere strikes back. Energy Saving Trust, London.
Faruqui, A and Sergici, S (2008) The power of experimentation: new evidence on
residential demand response. Discussion paper, Brattle Group.
Faruqui, Ahmad, Harris, Dan and Hledik, Ryan M., Unlocking the €53 Billion
Savings from Smart Meters in the EU - How Increasing the Adoption of Dynamic
Tariffs Could Make or Break the EU’s Smart Grid Investment (December 1, 2009).
Available at SSRN: http://ssrn.com/abstract=1527165
Faruqui, A, Sergici, S and Sharif, A (2010) The impact of informational feedback
on energy consumption - a survey of the experimental evidence. Energy 35 (4),
1598-1608.
Fischer, C (2008) Feedback on household electricity consumption: a tool for
saving energy?. Energy Efficiency 1 (1), 79-104
Garay, J and Lindholm, P (1995) Statistics on the energy bill: better control for
the customer. International Energy Program Evaluation Conference, Chicago,
August 22-25, 1995
Gaskell, G, Ellis, P and Pike, R (1982) The energy literate consumer: the effects
of consumption feedback and information on beliefs, knowledge and behaviour.
Dept of Social Psychology, LSE, London
Gatersleben B, Steg L and Vlek C (2002) The measurement and determinants of
Environmentally significant consumer behaviour. Environment and Behaviour 34,
3, 335-362
Hargreaves,T, Nye, M and Burgess, J (2010 ) Making energy visible: a qualitative
field study of how householders interact with feedback from smart energy
monitors. Energy Policy 38, 6111-6118
Henderson, G, Staniasek, D, Anderson, B and Philipson, M (2003) Energy savings
from insulation improvements in electrically heated dwellings in the UK.
Proceedings, European Council for an Energy-Efficient Economy summer study,
pp325-334
Isaacson, M, Kotewa, L, Star, A and Ozog, M (2006) Changing how people think
about energy. Proceedings, American Council for an Energy-Efficient Economy
summer study
Lutzenhiser, L (1993) Social and behavioural aspects of energy use. Annual
Review of Energy and Environment 18, 247-289
Karbo, P and Larsen, TF (2005) Use of online measurement data for electricity
savings in Denmark. Proceedings, European Council for an Energy-Efficient
Economy summer study, paper 1,180.

29
Kempton, W and Layne, LL (1994) The consumer’s energy analysis environment.
Energy Policy 22 (10), 857-866
Kidd, A and Williams, P (2008) The Talybont trial: exploring the psychology of
smart meters.
King, C and Delurey, D (2005) Twins, siblings or cousins? Analyzing the
conservation effects of demand response programs. Public Utilities Fortnightly,
March 2005
Lockwood, M and Platt, R (2009) Green Streets. Final report to British Gas.
Institute for Public Policy Research, London
Lutzenhiser, L (1993) Social and behavioural aspects of energy use. Annual
review of energy and environment 18, 247-289
Lutzenhiser, L (2002) Marketing household energy conservation: the message
and the reality. Chapter 3 in New tools for Environmental Protection: education,
information and voluntary measures, eds Thomas Dietz and Paul C Stern.
National Academy Press, Washington DC
Lutzenhiser, L and Bender S (2008) The 'average American' unmasked: social
structure and differences in household energy use and carbon emission.
Proceedings, American Council for an Energy-Efficient Economy summer study,
paper 7552
Martinez, MS and Geltz CR (2005) Utilizing a pre-attentive technology for
modifying customer energy usage. Proceedings, European Council for an Energy-
Efficient Economy, 2005 [This paper was not published in the proceedings, but
was presented at the conference. SD has a copy from the authors]
Mountain, DC. 2006. The impact of real-time feedback on residential electricity
consumption:The Hydro One pilot. Mountain Economic Consulting and Associates
Inc., Ontario
Mountain, DC. 2007. Real-time feedback and residential electricity consumption:
British Columbia and Newfoundland and Labrador pilots. Mountain Economic
Consulting and Associates Inc., Ontario
Owen, G and Ward, J (2010a) Smart pre-payment in Great Britain. Sustainability
First, London
Owen, G and Ward, J (2010b) Smart tariffs and household demand response for
Great Britain. Sustainability First, London
New Perspectives / Energy Inform (2004) Savings from behavioural changes
following energy advice: report on a survey. Report to the Energy Efficiency
Partnership for Homes / Energy Saving Trust.
OXERA (2006) Policies for energy efficiency in the UK household sector. A report
for DEFRA. OXERA, Oxford
PA (2010) Residential smart energy monitoring pilot final report. Prepared for
Cape Light Compact by PA consulting group, Madison, WI.
http://tomharrisonjr.com/wp-
content/uploads/2010/08/CLCSmartEnergyMonitoringPilotFinalReport3-31-
2010.pdf
Pett, J and Guertler, P (2004) User behaviour in energy efficient homes. A report
for EST and the Housing Corporation. Association for the Conservation of Energy,
London
Peters, JS, Moezzi, M, Lutzenhiser, S, Woods, J, Dethman, L and Kunkle, R
(2009) Powerchoice residential customer response to TOU rates. Research into
Action, for California Energy Commission, report CEC-5000-2009-XXX
Pyrko, J (2009) El-info via digitala kanaler Potential att förändra elanvändning i
bostäder. Fallstudie 3. ”EnergiDialog-Privat” hos E.ON Sverige ABCase study with

30
E.ON. http://www.ees.energy.lth.se/fileadmin/ees/Publikationer/2009/Rap09-
3044-Pyrko-EOn.pdf
Rossini, G (2009) Hydro One: In-home real time display. Customer feedback
from a 30,000 unit deployment. Presentation to 2nd annual conference on home
energy displays, Orlando, Florida, April 2nd
Schultz, PW, Nolan, JM, Cialdini, RB, Goldstein, NJ and Griskevicius, V (2007).
The constructive, destructive and reconstructive power of social norms.
Psychological Science 18 (5), 429-434
Shove, E (2003) Comfort, cleanliness and convenience: the social organisation of
normality. Berg Publishers, Oxford
Siems, A (2009) Evaluation of the Massachusetts PowerCost Monitor Pilot
Program. Presentation to the ACEEE Symposium on Market Transformation,
Washington DC, 31.3.09
Stevenson, F and Rijal, H (20080 The Sigma Home: towards an authentic
evaluation of a prototype building. Proceedings, 25th conference on passive and
low energy architecture, Dublin
Summerfield, AJ, Pathan, A, Lowe, RJ and Oreszczyn, T (2010) Changes in
energy demand from low-energy homes. Building Research and Information 38
(1), 42-49
UC Partners and Technical University of Eindhoven (2009) PowerPlayer pilot
2008-2009. Final report to Senternovem, Nuon and Home Automation Europe.
UCPartners, Keizersgracht 125-127, 1015 CJ Amsterdam, Netherlands
Utley JI and Shorrock LD (2008) Domestic Energy Fact File 2008. Building
Research Establishment, for the Department of Energy and Climate Change.
Valocchi, M, Juliano J and Schurr A (2009) Lighting the way. Understanding the
smart energy consumer. IBM Institute for Business Value
van Dam, SS, Bakker, CA and van Hal, JDM: Home energy monitors: impact over
the medium-term. Building Research and Information 38 (5), 458-469
Weatherall, B (2009) Final report of the eco-pioneer pilot program. Appendix to
Wheelock, C (2009) Home energy management: consumer preferences and
attitudes. Giga Omni Media, May 2009
Wilhite, H and Ling, R (1995) Measured energy savings from a more informative
energy bill. Energy and buildings 22 pp145-155.
Wilhite, H (1997) Experiences with the implementation of an informative energy
bill in Norway. Ressurskonsult report 750, Oslo
Wilhite, H (2008) New thinking on the agentive relationship between end-use
technologies and energy-using practices. Energy Efficiency 1 (1)
Williams, DI (1983) Understanding people's understanding of energy use in
buildings. Proceedings of a conference on social research on the use of energy in
buildings, ed Bruce Stafford. Conference and seminar papers no 7, Centre for
Urban and Regional Studies, University of Birmingham, UK