Embed Size (px)
Citation preview
i
Literacy Status in Nepal (Literacy rate by age group 5 +)
Submitted to: UNESCO Kathmandu
By: Literacy Mapping Study Team
2013
KAT/2014/PI/H/3
ii
Literacy Mapping Study Team Team Members: 1. Ashim Bajracharya, GIS expert 2. Sameer Khakha, Assistant
i
Table of contents
Acknowledgement ......................................................................................................... iii List of Figures ................................................................................................................ iv
List of Tables................................................................................................................... v
Acronyms ....................................................................................................................... vi
1. Introduction ...................................................................................................... 1
1.1. Literacy Status in Nepal ............................................................................................... 1
2. Literacy Mapping .............................................................................................. 2
2.1. What is GIS? ................................................................................................................ 2
2.2. Main objectives ............................................................................................................ 3
2.3. Methodology ................................................................................................................ 3 2.3.1. Prioritize ................................................................................................................................................ 4 2.3.2. Target ..................................................................................................................................................... 8
2.4. Information needed ................................................................................................... 10
2.5. Limitation ................................................................................................................... 10
3. GIS Map Presentation and Interpretation ..................................................... 11
3.1. National Level ............................................................................................................ 11 3.1.1. Literacy map by Age group 5 + ........................................................................................................... 11 3.1.2. Illiterate map by age 5+ ....................................................................................................................... 13 3.1.3. Female Literacy Status map by Age 5 + .............................................................................................. 15 3.1.4. Female Illiterates Number map by Age 5 ............................................................................................ 17
3.2. Regional Level ........................................................................................................... 19 3.2.1. Regional level literacy map by age 5+ ................................................................................................. 19 3.2.2. Regional level total illiterate map by age group 5+ ............................................................................. 21 3.2.3. Regional level Female literacy map by age 5+ .................................................................................... 23 3.2.4. Regional level Female illiterate map by age 5+ ................................................................................... 25
3.3. District Level ............................................................................................................. 27 3.3.1. Dolkha ................................................................................................................................................. 27
3.3.1.1. Dolkha District literacy map by age 5+ ................................................................................................................. 27 3.3.1.2. Dolkha District illiterate map by age 5+ ............................................................................................................... 29 3.3.1.3. Dolkha VDC and illiterates targeting by age 5+ ................................................................................................... 31 3.3.1.4. Dolkha District Female literacy map by age 5+ .................................................................................................... 33
ii
3.3.1.5. Dolkha District Female illiterate map by age 5+ ................................................................................................... 35 3.3.1.6. Dolkha VDC’s and illiterates targeting by Female age 5+ .................................................................................... 37
3.3.2. Rasuwa ................................................................................................................................................ 40 3.3.2.1. Rasuwa District literacy map by age 5+ ................................................................................................................ 40 3.3.2.2. Rasuwa District illiterate map by age 5+ .............................................................................................................. 42 3.3.2.3. VDC and total illiterates targeting by age 5+ ........................................................................................................ 44 3.3.2.4. Rasuwa District female literacy map by age 5+ .................................................................................................... 46 3.3.2.5. Rasuwa District female illiterate map by age 5+ ................................................................................................... 48 3.3.2.6. VDC and female illiterates targeting by age 5+ .................................................................................................... 50
3.3.3. Kailali .................................................................................................................................................. 52 3.3.3.1. Kailali District literacy map by age 5+ ................................................................................................................. 52 3.3.3.2. Kailali District illiterate map by age 5+ ................................................................................................................ 54 3.3.3.3. VDC and total illiterates targeting by age 5+ ........................................................................................................ 56 3.3.3.4. Kailali District female literacy map by age 5+ ...................................................................................................... 59 3.3.3.5. Kailali District female illiterate map by age 5+ ..................................................................................................... 61 3.3.3.6. VDC and female illiterates targeting by age 5+ .................................................................................................... 63
4. Major Findings ................................................................................................ 66
4.1. Total: Age group 5 + .................................................................................................. 66 4.1.1. Total Literacy rate................................................................................................................................ 66 4.1.2. Total illiterate number ......................................................................................................................... 66 4.1.3. Sum up ................................................................................................................................................. 67
4.2. Female:Age 5+ ........................................................................................................... 67 4.2.1. Literacy rate ......................................................................................................................................... 67 4.2.2. Female illiterates number .................................................................................................................... 68 4.2.3. Sum up ................................................................................................................................................. 69
5. Major Implications .......................................................................................... 70
5.1. Total: Age group 5 + .................................................................................................. 70 5.1.1. Total Literacy rate................................................................................................................................ 70 5.1.2. Total illiterate number ......................................................................................................................... 70
5.2. Female: Age 5+ .......................................................................................................... 71 5.2.1. Female literacy rate.............................................................................................................................. 71 5.2.2. Female illiterates number .................................................................................................................... 71
6. Annexes .......................................................................................................... 72
Annex 1: Literacy Rate Status by Age group 5+ .................................................................. 72
iii
Acknowledgement
We would like to express our gratitude and appreciation to UNESCO Kathmandu for trusting us for such an important assignment. We would also like to express our gratitude and appreciation to NFEC officials, for their commendable input towards the preparation of the report.
I would also like to extend special thanks for CBS for providing the latest 2011 literacy data by age group and gender. A special thanks to Mr. Babu Ram Poudel, Project Director, NFEC‘s for supporting in NFEC’s issues and agenda for preparation of the report. I would also like to extend my special thanks to Mr. Tap Raj Pant, Education Section Chief, UNESCO Kathmandu and UNESCO officials for heartily supporting us during the preparation of the report.
Sugam Bajracharya
Team Leader
iv
List of Figures
Figure 1: Literacy mapping using GIS .....................................................................................................2
Figure 2: Steps in literacy action planning ...............................................................................................3
v
List of Tables
Table 1: Literacy Status in Nepal by age 5 + ...........................................................................................1
Table 2: Score pattern for literacy rate status ...........................................................................................5
Table 3: Score pattern for preparing illiterate map by age 5+ and age 15+ .............................................5
Table 4: score pattern for preparing illiterate map by age 5 – 14 and age 15 – 24 ..................................6
Table 5: District level Score pattern for age group 5+ and 15+ ..............................................................7
Table 6: Example for VDCs and illiterates identification by priority score .............................................8
Table 7: Example for Targeting villages and Illiterates by Priority .........................................................9
Table 8: Districts are selected for district level identifying illiterates by age group 5+ .........................10
Table 9: Villages and illiterates identification by priority score in the Dolkha District .........................31
Table 10: Targeting villages and Illiterates by Priority in Dolkha district .............................................32
Table 11: Villages and female illiterates’ identification by priority score in Dolkha District ...............37
Table 12: Targeting VDCs and female Illiterates by Priority in the Dolkha district ..............................39
Table 13: VDC’s and illiterates’ identification by priority score in the Rasuwa District .....................44
Table 14: Targeting VDCs and illiterates by Priority in the Rasuwa district .........................................45
Table 15: Villages and female illiterates’ identification by priority score in the Rasuwa District........50
Table 16: Targeting villages and female Illiterates by Priority in Rasuwa district ................................51
Table 17: villages and illiterates’ identification by priority score in the Kailali District ......................56
Table 18: Targeting villages and Illiterates by Priority in Kailali district ..............................................57
Table 19: Villages and female illiterates’ identification by priority score in the Kailali District .........63
Table 20: Targeting villages and female illiterates by Priority in the Kailali district ............................64
vi
Acronyms
GIS Geographic Information System CBS Central Bureau of Statistics CLC Community Learning Center
INTRODUCTION
1
1. Introduction
1.1. Literacy Status in Nepal Literacy status by age 5+ is seen boom from year 1981 and it is in increasing trend up to 2001.
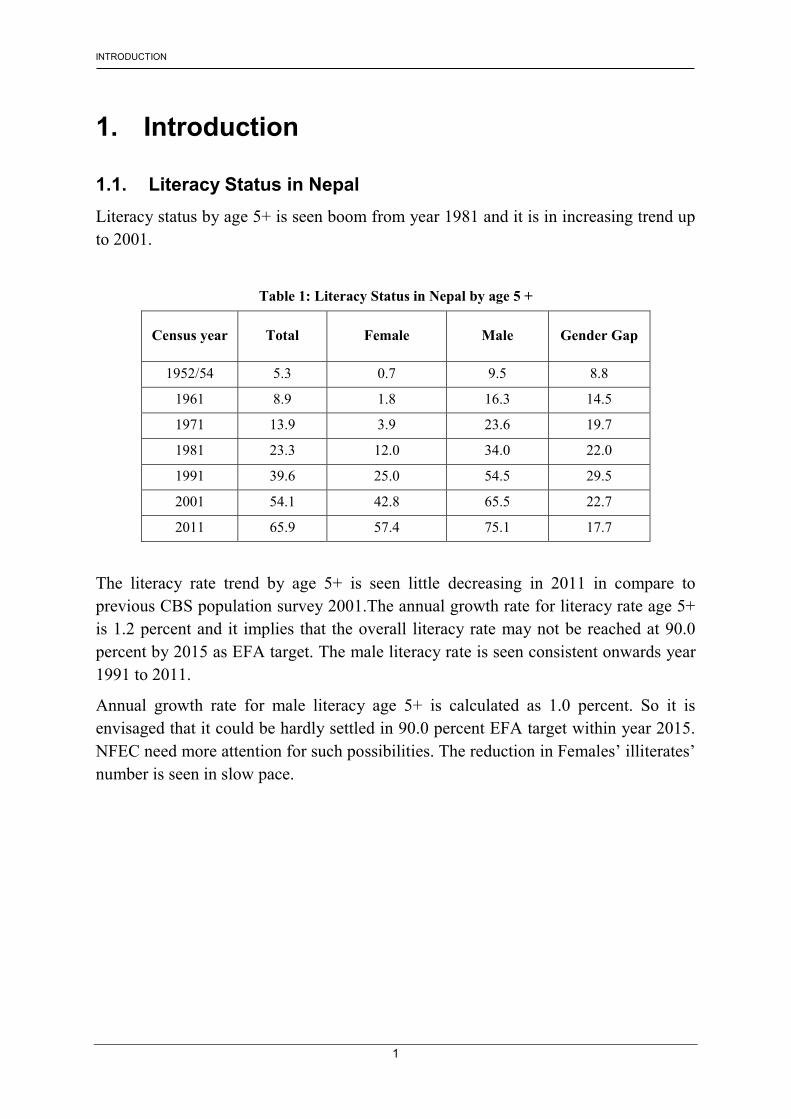
Table 1: Literacy Status in Nepal by age 5 +
Census year Total Female Male Gender Gap
1952/54 5.3 0.7 9.5 8.8
1961 8.9 1.8 16.3 14.5
1971 13.9 3.9 23.6 19.7
1981 23.3 12.0 34.0 22.0
1991 39.6 25.0 54.5 29.5
2001 54.1 42.8 65.5 22.7
2011 65.9 57.4 75.1 17.7
The literacy rate trend by age 5+ is seen little decreasing in 2011 in compare to previous CBS population survey 2001.The annual growth rate for literacy rate age 5+ is 1.2 percent and it implies that the overall literacy rate may not be reached at 90.0 percent by 2015 as EFA target. The male literacy rate is seen consistent onwards year 1991 to 2011.
Annual growth rate for male literacy age 5+ is calculated as 1.0 percent. So it is envisaged that it could be hardly settled in 90.0 percent EFA target within year 2015. NFEC need more attention for such possibilities. The reduction in Females’ illiterates’ number is seen in slow pace.
LITERACY MAPPING
2
2. Literacy Mapping
Literacy mapping can help us to better: (i) identify the priority target groups; (ii) determine the kind of literacy programmes that can be most effective for each of these target groups; and (iii) plan, organize and implement appropriate literacy actions.
Information about where and who are the illiterates may or may not be fully available, up-to-date and reliable at the local level unless there is a systematic tracking system. An approach that can be adopted is to use the results of the latest national population census to produce initial national, regional and district literacy maps as the starting basis for the regional and district education offices to check and update. Such updated literacy maps and data can then be utilized to plan responsive and effective literacy actions.
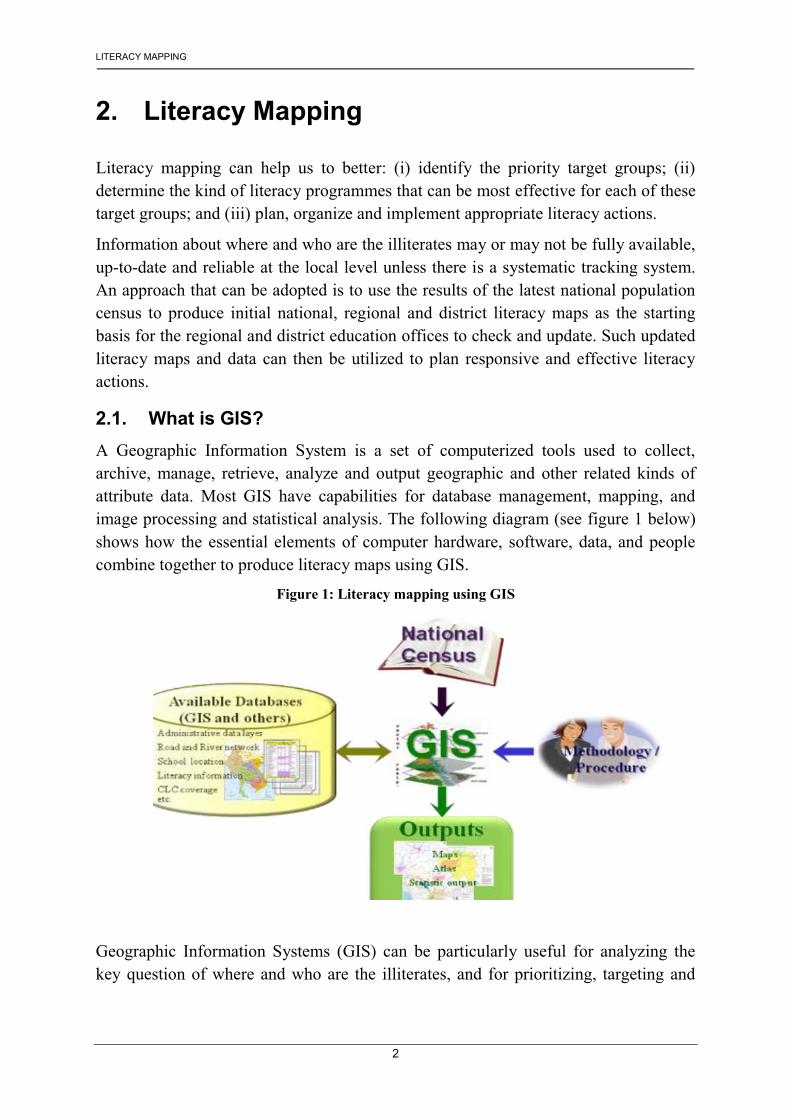
2.1. What is GIS? A Geographic Information System is a set of computerized tools used to collect, archive, manage, retrieve, analyze and output geographic and other related kinds of attribute data. Most GIS have capabilities for database management, mapping, and image processing and statistical analysis. The following diagram (see figure 1 below) shows how the essential elements of computer hardware, software, data, and people combine together to produce literacy maps using GIS.
Figure 1: Literacy mapping using GIS
Geographic Information Systems (GIS) can be particularly useful for analyzing the key question of where and who are the illiterates, and for prioritizing, targeting and
LITERACY MAPPING
3
PRIORITIZ
planning literacy actions. Nowadays, most population census data are geo-referenced for literacy mapping using GIS.
The primary objective of literacy mapping is to identify the geographic locations and concentrations of illiterate persons.
2.2. Main objectives The main objectives of the Literacy Mapping Study are given below;
� To identify the Literacy status across the country through the GIS map.
� To identify the Literacy status by regional, district level and village level.
� To identify the illiterates remained in the district by prioritizing the VDCs
� To identify the needy area for further Literacy programme intervention.
� To help the NFEC for planning purposes and establishment of village level database.
� Literacy mapping study will be milestone for preparing Literacy action plan by national, Districts and even up to village level.
� The literacy maps and data tables produced during the mapping phase provide the basis for evidence-based literacy action planning.
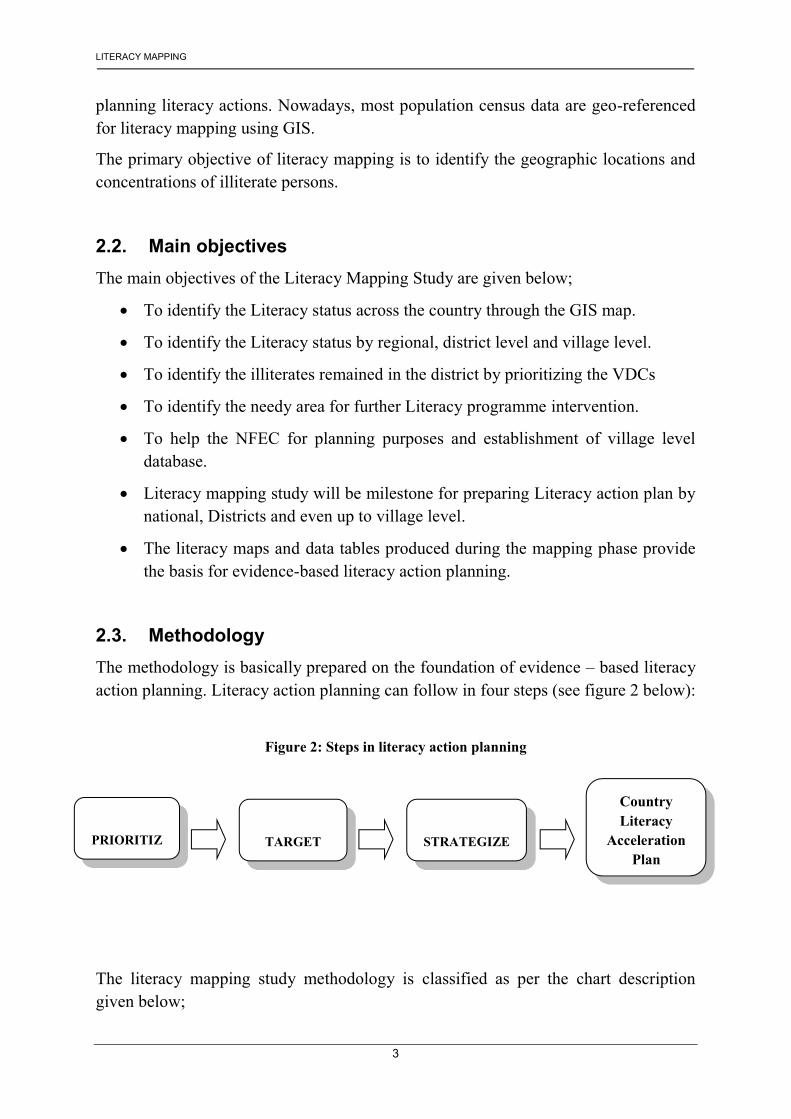
2.3. Methodology The methodology is basically prepared on the foundation of evidence – based literacy action planning. Literacy action planning can follow in four steps (see figure 2 below):
Figure 2: Steps in literacy action planning
The literacy mapping study methodology is classified as per the chart description given below;
TARGET
STRATEGIZE
Country Literacy
Acceleration Plan
LITERACY MAPPING
4
1. Prioritize
� Identification of required indicator for literacy mapping.
� Planning for essential scoring pattern for literacy mapping.
� Literacy priority scores by villages and Municipalities.
2. Target
� Priority scores for both literate and illiterate for identifying crucial area.
� Target villages, Municipalities and illiterates by priority ranking. 3. Strategize
� Information flow to district level regarding the targeting villages and illiterates.
� Local literacy delivery capacities in districts.
� Selecting literacy programmes in various districts by defined age group.
4. Country Literacy action Plan
� Preparing district literacy action framework template
� Preparing regional literacy action framework template
� Preparing Country Literacy Acceleration Plan(CLAP)
2.3.1. Prioritize
First of all the Literacy mapping study is based upon the different core EFA indicators. These different EFA indicators are considered as major factor for strengthening the existing Planning strategies in NFEC. There are many EFA indicators identified for preparing the Literacy maps and that are given as below;
� Literacy rate by age 5+
� Literacy rate by male age 5+
� Literacy rate by female age 5+
� Literacy rate by age 15 +
� Literacy rate by male age 15+
� Literacy rate by female age 15+
� Literacy rate by age 15 – 24
� Literacy rate by male age 15 – 24
� Literacy rate by female age 15 – 24 Statistically valid Literates and illiterates score patterns are developed for preparing the map in the GIS software. The main process for preparing GIS map is followed by well structured score pattern which should be statistically valid.
LITERACY MAPPING
5
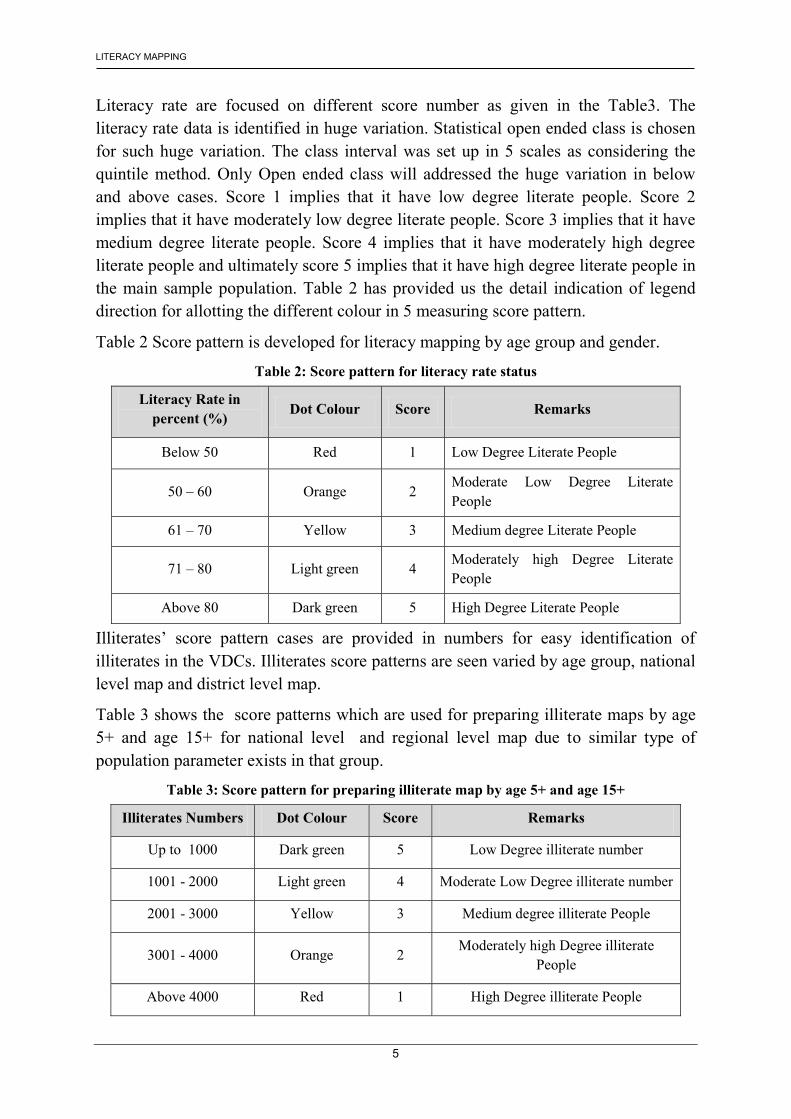
Literacy rate are focused on different score number as given in the Table3. The literacy rate data is identified in huge variation. Statistical open ended class is chosen for such huge variation. The class interval was set up in 5 scales as considering the quintile method. Only Open ended class will addressed the huge variation in below and above cases. Score 1 implies that it have low degree literate people. Score 2 implies that it have moderately low degree literate people. Score 3 implies that it have medium degree literate people. Score 4 implies that it have moderately high degree literate people and ultimately score 5 implies that it have high degree literate people in the main sample population. Table 2 has provided us the detail indication of legend direction for allotting the different colour in 5 measuring score pattern.
Table 2 Score pattern is developed for literacy mapping by age group and gender.
Table 2: Score pattern for literacy rate status Literacy Rate in
percent (%) Dot Colour Score Remarks
Below 50 Red 1 Low Degree Literate People
50 – 60 Orange 2 Moderate Low Degree Literate People
61 – 70 Yellow 3 Medium degree Literate People
71 – 80 Light green 4 Moderately high Degree Literate People
Above 80 Dark green 5 High Degree Literate People
Illiterates’ score pattern cases are provided in numbers for easy identification of illiterates in the VDCs. Illiterates score patterns are seen varied by age group, national level map and district level map.
Table 3 shows the score patterns which are used for preparing illiterate maps by age 5+ and age 15+ for national level and regional level map due to similar type of population parameter exists in that group.
Table 3: Score pattern for preparing illiterate map by age 5+ and age 15+ Illiterates Numbers Dot Colour Score Remarks
Up to 1000 Dark green 5 Low Degree illiterate number
1001 - 2000 Light green 4 Moderate Low Degree illiterate number
2001 - 3000 Yellow 3 Medium degree illiterate People
3001 - 4000 Orange 2 Moderately high Degree illiterate People
Above 4000 Red 1 High Degree illiterate People
LITERACY MAPPING
6
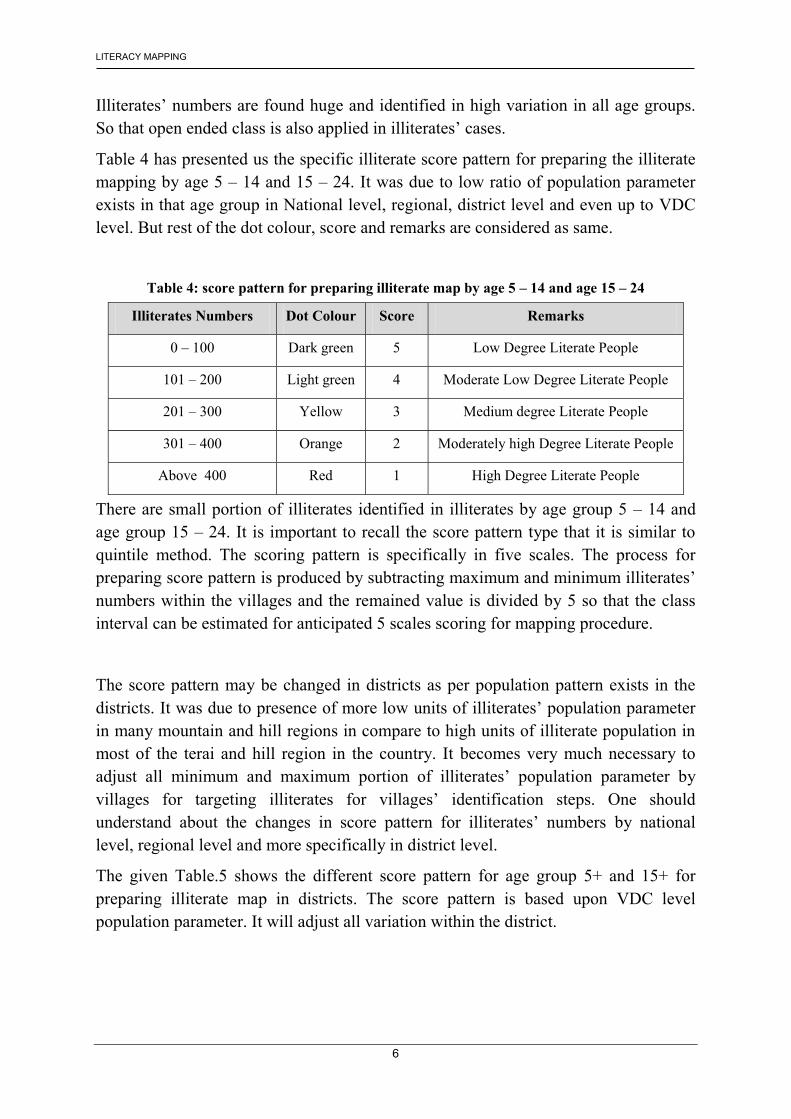
Illiterates’ numbers are found huge and identified in high variation in all age groups. So that open ended class is also applied in illiterates’ cases.
Table 4 has presented us the specific illiterate score pattern for preparing the illiterate mapping by age 5 – 14 and 15 – 24. It was due to low ratio of population parameter exists in that age group in National level, regional, district level and even up to VDC level. But rest of the dot colour, score and remarks are considered as same.
Table 4: score pattern for preparing illiterate map by age 5 – 14 and age 15 – 24 Illiterates Numbers Dot Colour Score Remarks
0 – 100 Dark green 5 Low Degree Literate People
101 – 200 Light green 4 Moderate Low Degree Literate People
201 – 300 Yellow 3 Medium degree Literate People
301 – 400 Orange 2 Moderately high Degree Literate People
Above 400 Red 1 High Degree Literate People
There are small portion of illiterates identified in illiterates by age group 5 – 14 and age group 15 – 24. It is important to recall the score pattern type that it is similar to quintile method. The scoring pattern is specifically in five scales. The process for preparing score pattern is produced by subtracting maximum and minimum illiterates’ numbers within the villages and the remained value is divided by 5 so that the class interval can be estimated for anticipated 5 scales scoring for mapping procedure.
The score pattern may be changed in districts as per population pattern exists in the districts. It was due to presence of more low units of illiterates’ population parameter in many mountain and hill regions in compare to high units of illiterate population in most of the terai and hill region in the country. It becomes very much necessary to adjust all minimum and maximum portion of illiterates’ population parameter by villages for targeting illiterates for villages’ identification steps. One should understand about the changes in score pattern for illiterates’ numbers by national level, regional level and more specifically in district level.
The given Table.5 shows the different score pattern for age group 5+ and 15+ for preparing illiterate map in districts. The score pattern is based upon VDC level population parameter. It will adjust all variation within the district.
LITERACY MAPPING
7
Table 5: District level Score pattern for age group 5+ and 15+
S.N Score
Pattern Districts Selected District
Number
1
Below 500
Darchula, Achham, Humla, Dolpa, Palpa, Gulmi, Parbat, Myagdi, Mustang, Manang, Syangja, Tanahu, Lamjung, Gorkha, Rasuwa, Lalitpur, Kavrepalanchok, Khotang, Okhaladhunga, Solukhumbu, Bhojpur, Terhathum, Dhankuta, Taplejung , Dolkha
25
500 - 1000
1001 - 1500
1501 - 2000
Above 2000
2
500 - 1000
Baitadi , Dadeldhura, Doti, Bajhang, Mugu, Kalikot, Jumla, Jajarkot,Dailiekha, Surkhet, Salyan, Rukum,Rolpa, Pyuthan, Arghakhachi,Banglung,Sindhupalanchok, , Ramechhap, Sankhuwasabha, Ilam, Panchthar
21
1001 - 1500
1501 - 2000
2001 - 2500
Above 2500
3
Up to 1000
Kaski , Nuwakot, Kathmandu, Sindhuli, Udaypur, 5
1001 - 2000
2001 - 3000
3001 - 4000
Above 4000
4
1001 - 2000
Kanchanpur, Kailali, Bajura, Bardiya,Banke, Dang, , Rupandehi, Nawalparasi,Chitwan, Parsa, Bara, Rautahat,Makawanpur,Dhading, haktapur,Sarlahi,Mahottari, Dhanusa, Sirha, Saptari,Sunsari, Morang, Jhapa, Kapilvastu
24
2001 - 3000
3001 - 4000
4001 - 5000
Above 5000
75
Some sorts of examples are highlighted related to district level illiterates score patterns. It is understood that the given examples will be helpful for grabbing all small and huge portion of illiterate from all different geographical distribution of the country. Such as we can use the national level score pattern for targeting illiterates in Kathmandu district because it has similar type of population parameter exists. But the national level score pattern for targeting illiterates may not be suitable for those
LITERACY MAPPING
8
Districts for examples Manang and Rasuwa due to relatively lower population parameter exists in those districts. So the score pattern for targeting illiterates should be different for each districts depending upon their population parameter exists. It implies that the previous score pattern (Table 2 and Table 3) for national level map will give glance of the location of illiterates across the country but the district level revised score pattern will helps to focus the comprehensive picture of illiterates within the districts. That will help any planner for complete direction for targeting every component of illiterates by minimum to maximum units in each and every village.
2.3.2. Target
Two methods of identifying villages and illiterates within the district are focused for further improvement of literacy action plan.
The first method followed by the preparation of priority score matrix and targeting VDCs and illiterates is explained below;
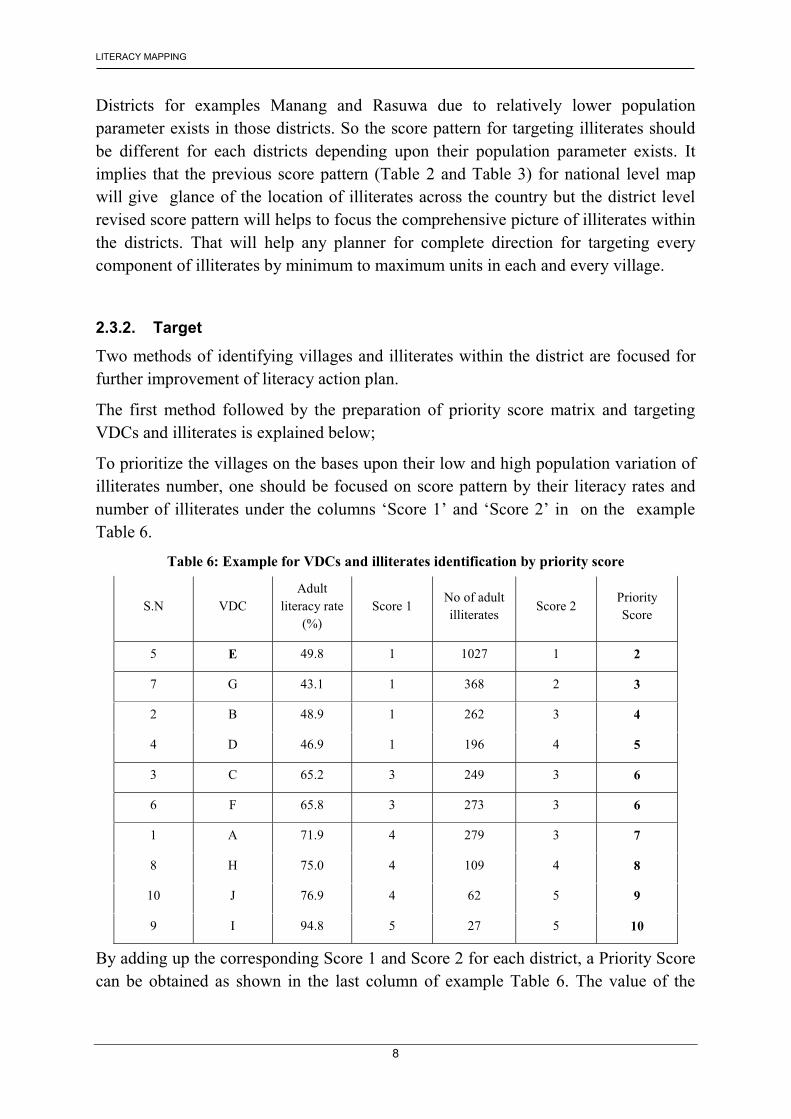
To prioritize the villages on the bases upon their low and high population variation of illiterates number, one should be focused on score pattern by their literacy rates and number of illiterates under the columns ‘Score 1’ and ‘Score 2’ in on the example Table 6.
Table 6: Example for VDCs and illiterates identification by priority score
S.N VDC Adult
literacy rate (%)
Score 1 No of adult illiterates
Score 2 Priority Score
5 E 49.8 1 1027 1 2
7 G 43.1 1 368 2 3
2 B 48.9 1 262 3 4
4 D 46.9 1 196 4 5
3 C 65.2 3 249 3 6
6 F 65.8 3 273 3 6
1 A 71.9 4 279 3 7
8 H 75.0 4 109 4 8
10 J 76.9 4 62 5 9
9 I 94.8 5 27 5 10
By adding up the corresponding Score 1 and Score 2 for each district, a Priority Score can be obtained as shown in the last column of example Table 6. The value of the
LITERACY MAPPING
9
priority scores can vary from 2 to 10, with highest priority to be given to villages with any lowest scores outcomes in the priority scoring.
The priority score below 7 is considered alarming and need extra effort for reduction of illiterates’ number in the respective villages. The priority score above 7 indicated that there are low illiterates numbers remained in the respective villages and they have no problems of the evolution of illiterates. Even little effort is sufficient for them to maintain the current status. It is believed that villages belonging to priority score above 7 might be achieved total reduction of their illiterates’ number of people in the coming days..
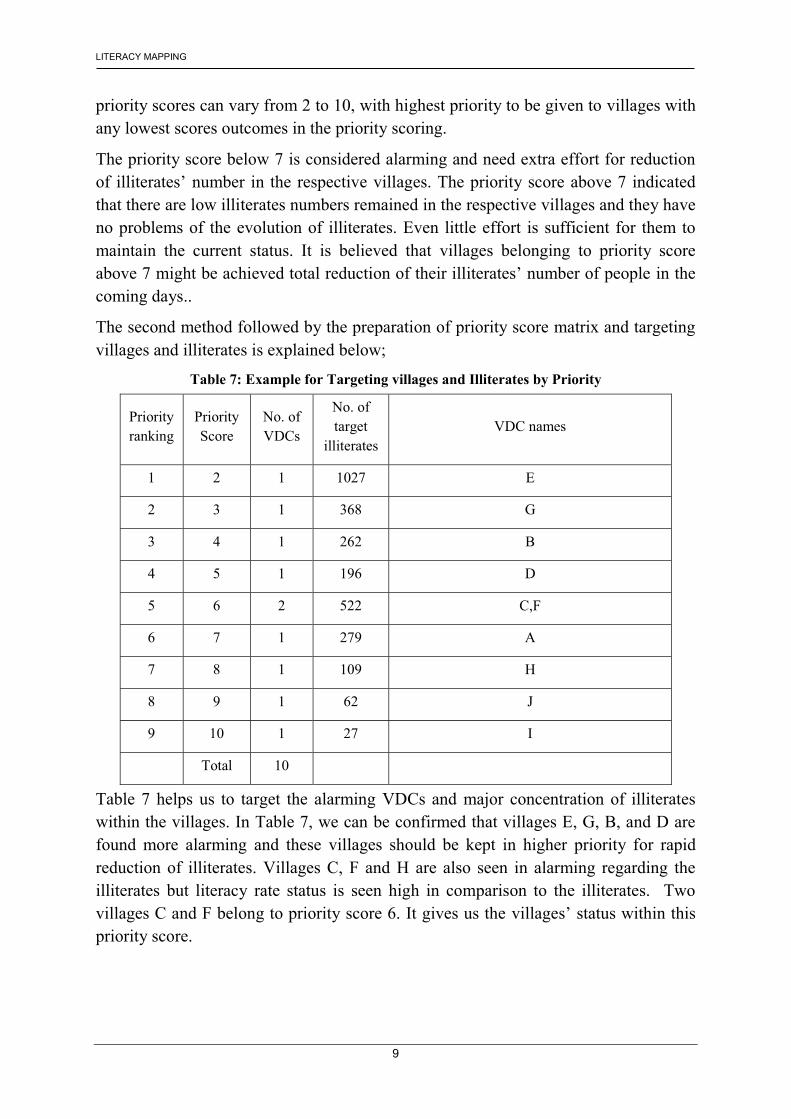
The second method followed by the preparation of priority score matrix and targeting villages and illiterates is explained below;
Table 7: Example for Targeting villages and Illiterates by Priority
Priority ranking
Priority Score
No. of VDCs
No. of target
illiterates VDC names
1 2 1 1027 E
2 3 1 368 G
3 4 1 262 B
4 5 1 196 D
5 6 2 522 C,F
6 7 1 279 A
7 8 1 109 H
8 9 1 62 J
9 10 1 27 I
Total 10
Table 7 helps us to target the alarming VDCs and major concentration of illiterates within the villages. In Table 7, we can be confirmed that villages E, G, B, and D are found more alarming and these villages should be kept in higher priority for rapid reduction of illiterates. Villages C, F and H are also seen in alarming regarding the illiterates but literacy rate status is seen high in comparison to the illiterates. Two villages C and F belong to priority score 6. It gives us the villages’ status within this priority score.
LITERACY MAPPING
10
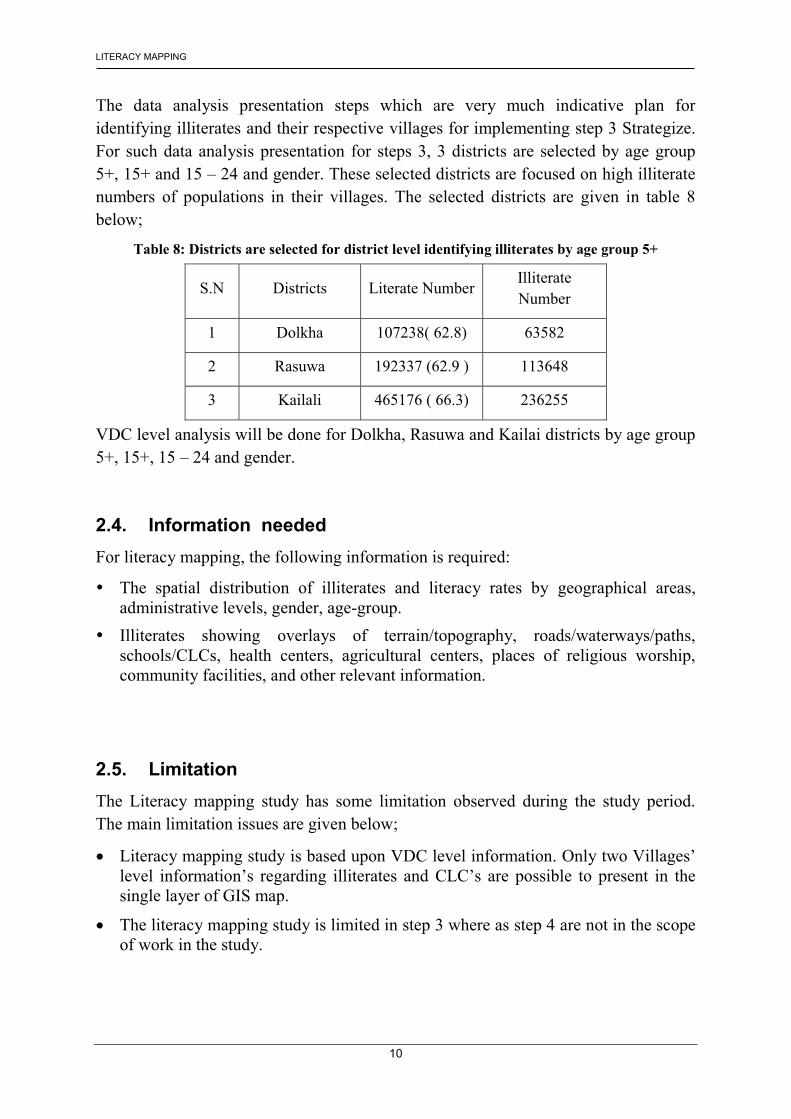
The data analysis presentation steps which are very much indicative plan for identifying illiterates and their respective villages for implementing step 3 Strategize. For such data analysis presentation for steps 3, 3 districts are selected by age group 5+, 15+ and 15 – 24 and gender. These selected districts are focused on high illiterate numbers of populations in their villages. The selected districts are given in table 8 below;
Table 8: Districts are selected for district level identifying illiterates by age group 5+
S.N Districts Literate Number Illiterate Number
1 Dolkha 107238( 62.8) 63582
2 Rasuwa 192337 (62.9 ) 113648
3 Kailali 465176 ( 66.3) 236255
VDC level analysis will be done for Dolkha, Rasuwa and Kailai districts by age group 5+, 15+, 15 – 24 and gender.
2.4. Information needed For literacy mapping, the following information is required:
� The spatial distribution of illiterates and literacy rates by geographical areas, administrative levels, gender, age-group.
� Illiterates showing overlays of terrain/topography, roads/waterways/paths, schools/CLCs, health centers, agricultural centers, places of religious worship, community facilities, and other relevant information.
2.5. Limitation The Literacy mapping study has some limitation observed during the study period. The main limitation issues are given below;
� Literacy mapping study is based upon VDC level information. Only two Villages’ level information’s regarding illiterates and CLC’s are possible to present in the single layer of GIS map.
� The literacy mapping study is limited in step 3 where as step 4 are not in the scope of work in the study.
GIS MAP PRESENTATION AND INTERPRETATION
11
3. GIS Map Presentation and Interpretation
The GIS map presentation is accompanied by both literate map and illiterate map by all age group and gender. Literacy map by age group 5+ is presented by national, regional and various district levels.
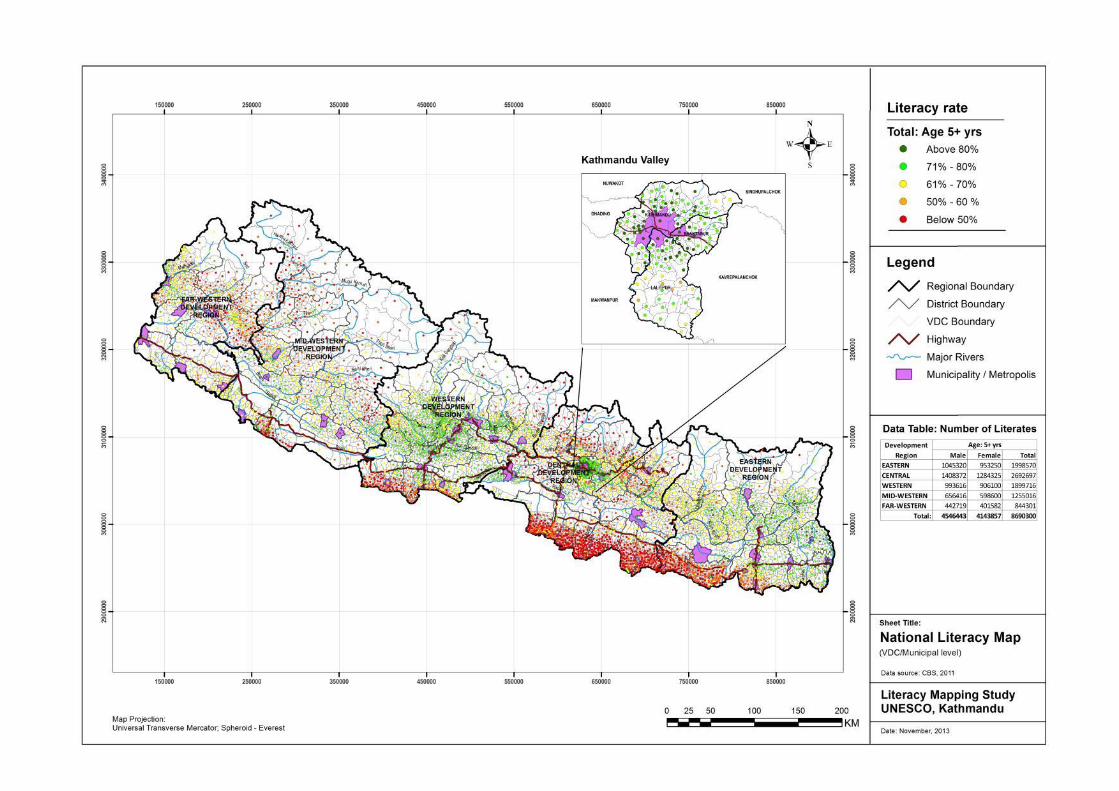
3.1. National Level 3.1.1. Literacy map by Age group 5 +
Map 1 shows the literacy rate status by age 5+. The map is based upon given 5 scale legend. The following observations are drawn from the literacy map by age 5+ as given below;
� Literacy rate by status by age 5+ is seen satisfactory in municipalities and its periphery VDC’s
� Dark green and light green dot are identified sufficiently in Hilly region.
� Eastern terai region is identified far behind in compare to eastern hill and eastern mountain regon in terms of literacy rate age 5+. Central development region is also seen lagging behind in terai and mountain area in terms of literacy age 5+ statuses.
� Mid western development and Far western development region is also seen lagging behind in terms of literacy rate by age group 5+
� The central part of western development region is seen ahead in terms of literacy rate by age group 5+.
GIS MAP PRESENTATION AND INTERPRETATION
12
�
GIS MAP PRESENTATION AND INTERPRETATION
13
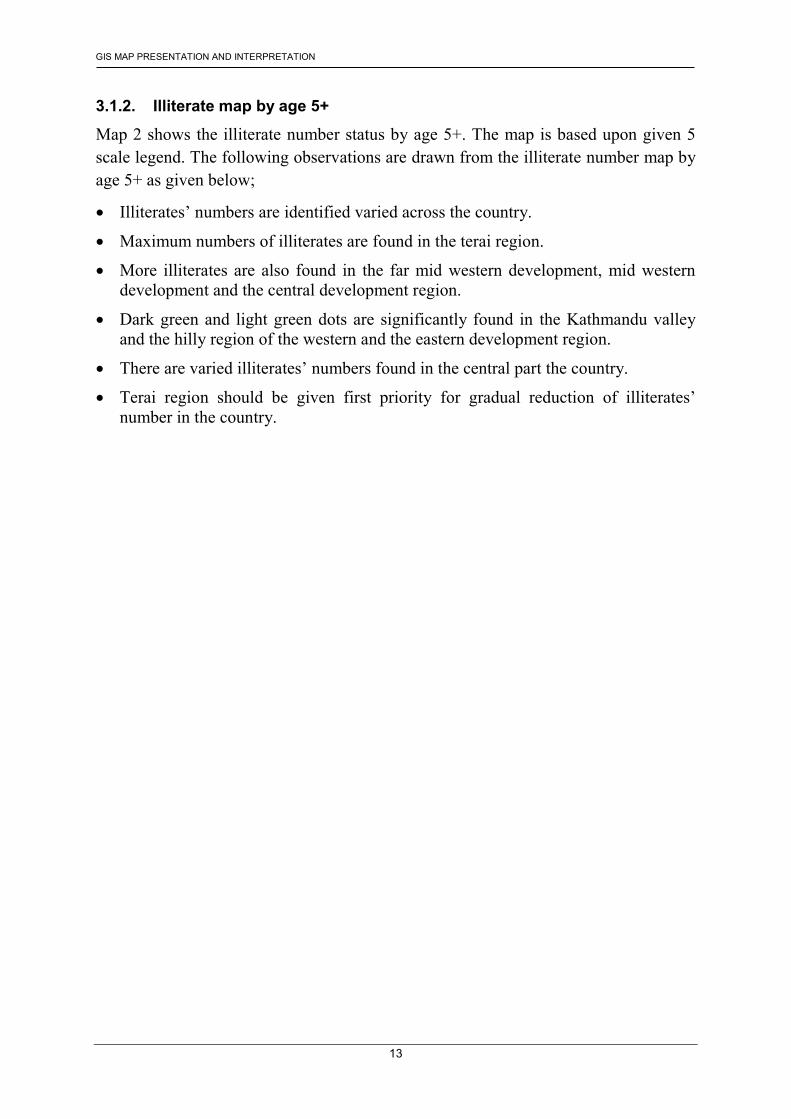
3.1.2. Illiterate map by age 5+
Map 2 shows the illiterate number status by age 5+. The map is based upon given 5 scale legend. The following observations are drawn from the illiterate number map by age 5+ as given below;
� Illiterates’ numbers are identified varied across the country.
� Maximum numbers of illiterates are found in the terai region.
� More illiterates are also found in the far mid western development, mid western development and the central development region.
� Dark green and light green dots are significantly found in the Kathmandu valley and the hilly region of the western and the eastern development region.
� There are varied illiterates’ numbers found in the central part the country.
� Terai region should be given first priority for gradual reduction of illiterates’ number in the country.
GIS MAP PRESENTATION AND INTERPRETATION
14
�
GIS MAP PRESENTATION AND INTERPRETATION
15
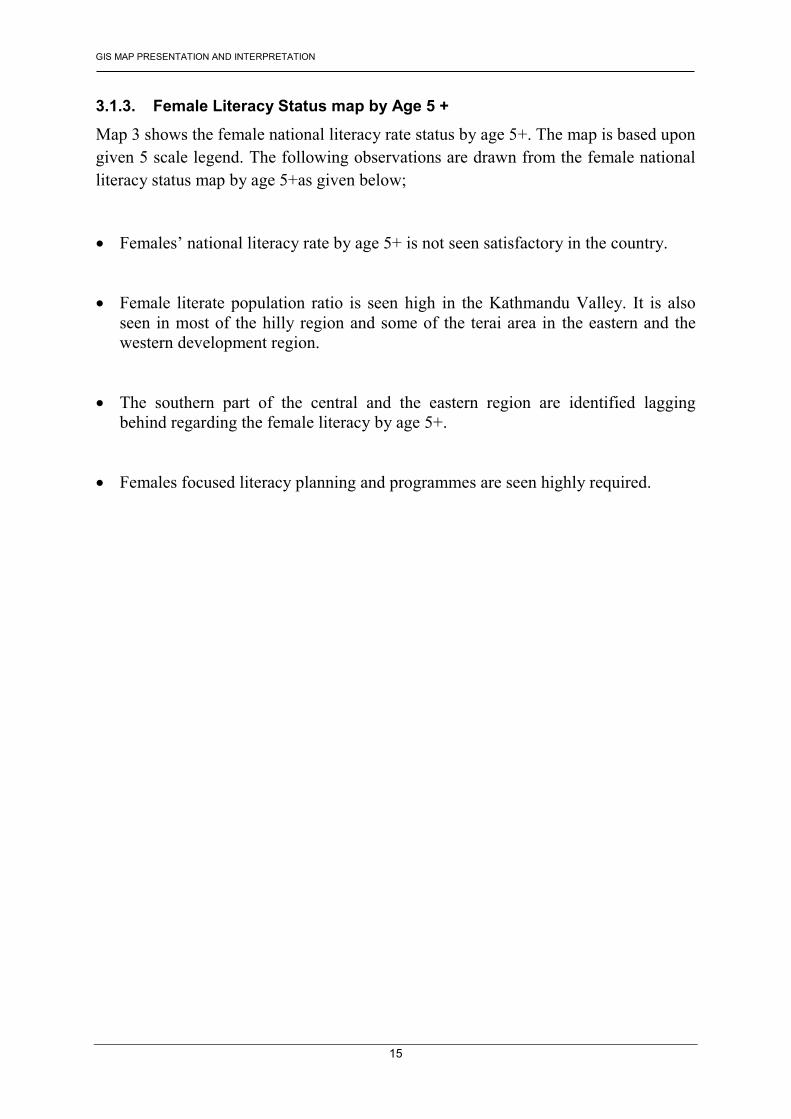
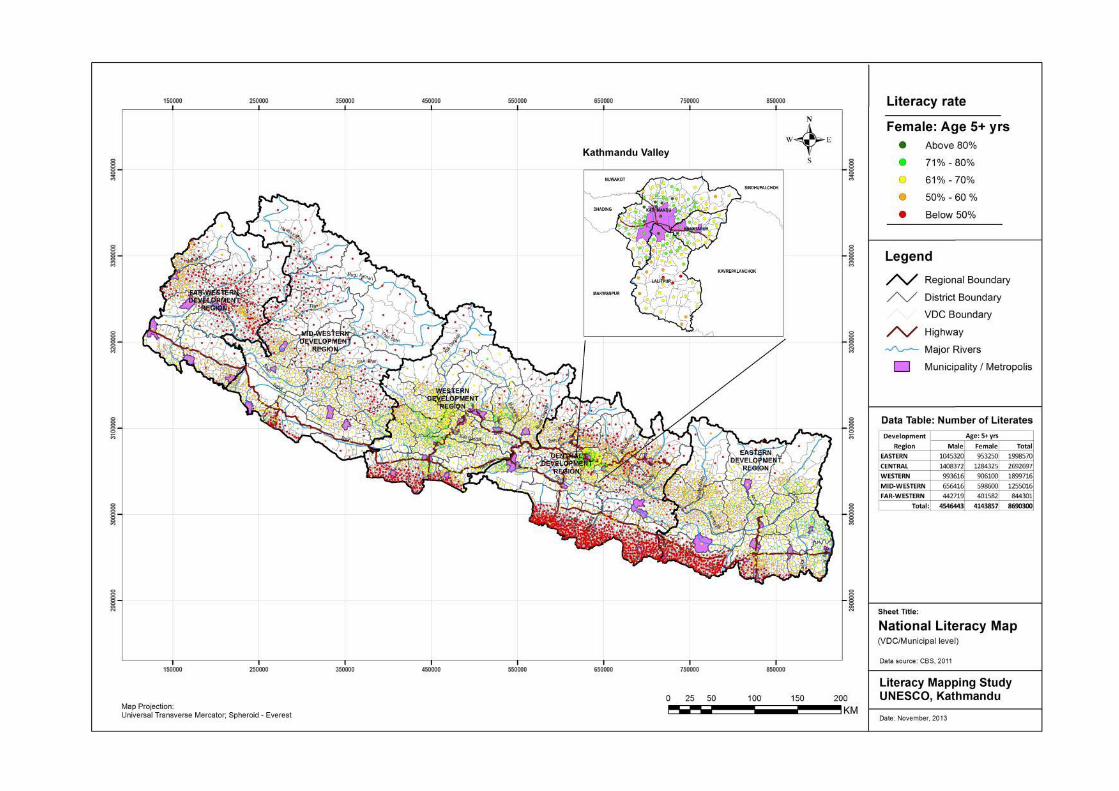
3.1.3. Female Literacy Status map by Age 5 +
Map 3 shows the female national literacy rate status by age 5+. The map is based upon given 5 scale legend. The following observations are drawn from the female national literacy status map by age 5+as given below;
� Females’ national literacy rate by age 5+ is not seen satisfactory in the country.
� Female literate population ratio is seen high in the Kathmandu Valley. It is also seen in most of the hilly region and some of the terai area in the eastern and the western development region.
� The southern part of the central and the eastern region are identified lagging behind regarding the female literacy by age 5+.
� Females focused literacy planning and programmes are seen highly required.
GIS MAP PRESENTATION AND INTERPRETATION
16
GIS MAP PRESENTATION AND INTERPRETATION
17
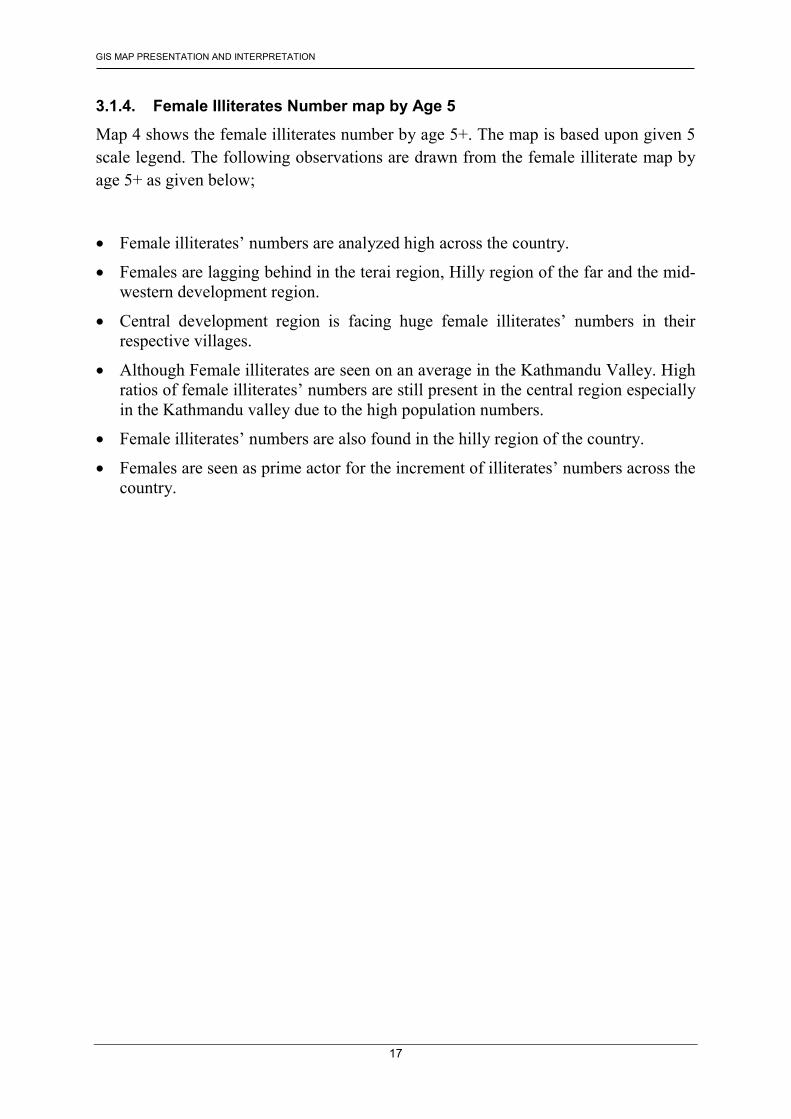
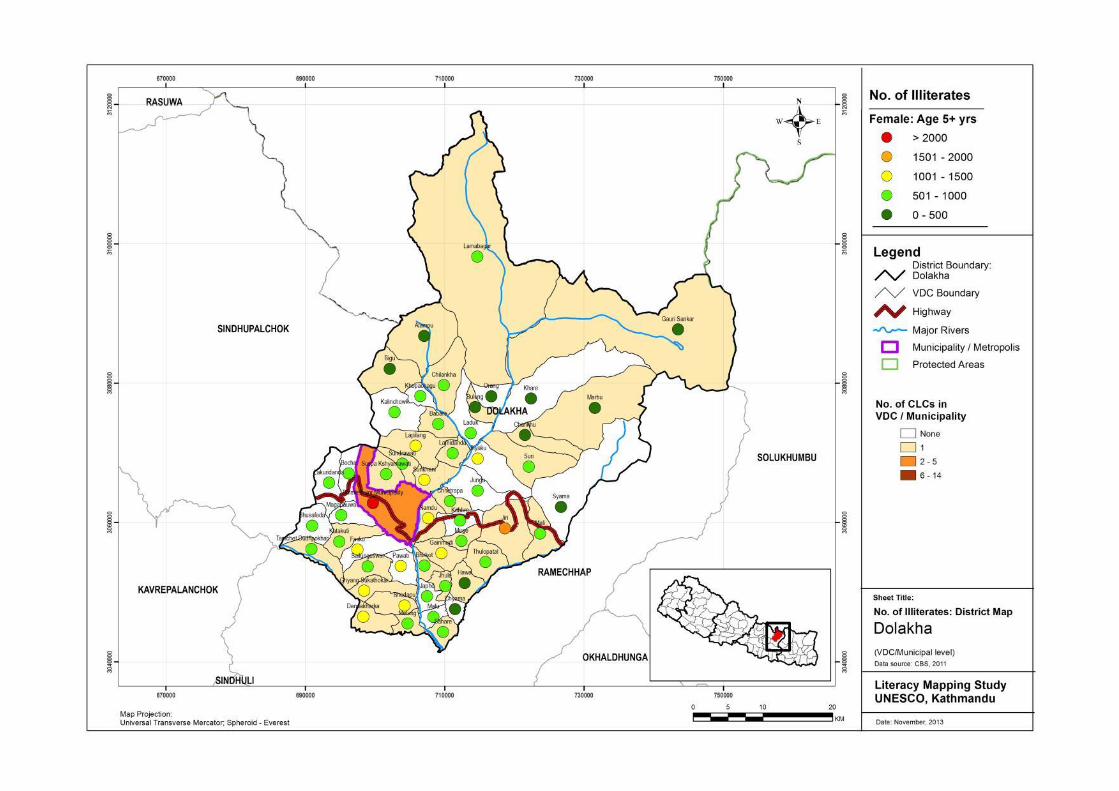
3.1.4. Female Illiterates Number map by Age 5
Map 4 shows the female illiterates number by age 5+. The map is based upon given 5 scale legend. The following observations are drawn from the female illiterate map by age 5+ as given below;
� Female illiterates’ numbers are analyzed high across the country.
� Females are lagging behind in the terai region, Hilly region of the far and the mid-western development region.
� Central development region is facing huge female illiterates’ numbers in their respective villages.
� Although Female illiterates are seen on an average in the Kathmandu Valley. High ratios of female illiterates’ numbers are still present in the central region especially in the Kathmandu valley due to the high population numbers.
� Female illiterates’ numbers are also found in the hilly region of the country.
� Females are seen as prime actor for the increment of illiterates’ numbers across the country.
GIS MAP PRESENTATION AND INTERPRETATION
18
�
GIS MAP PRESENTATION AND INTERPRETATION
19
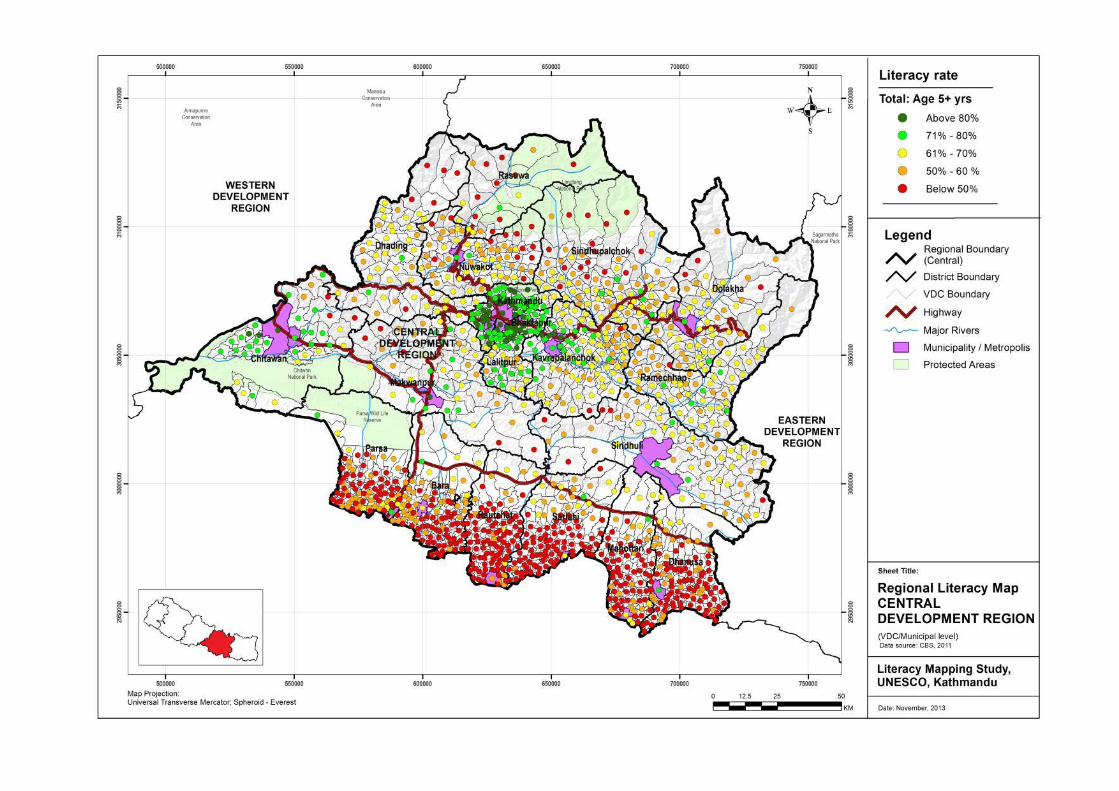
3.2. Regional Level 3.2.1. Regional level literacy map by age 5+
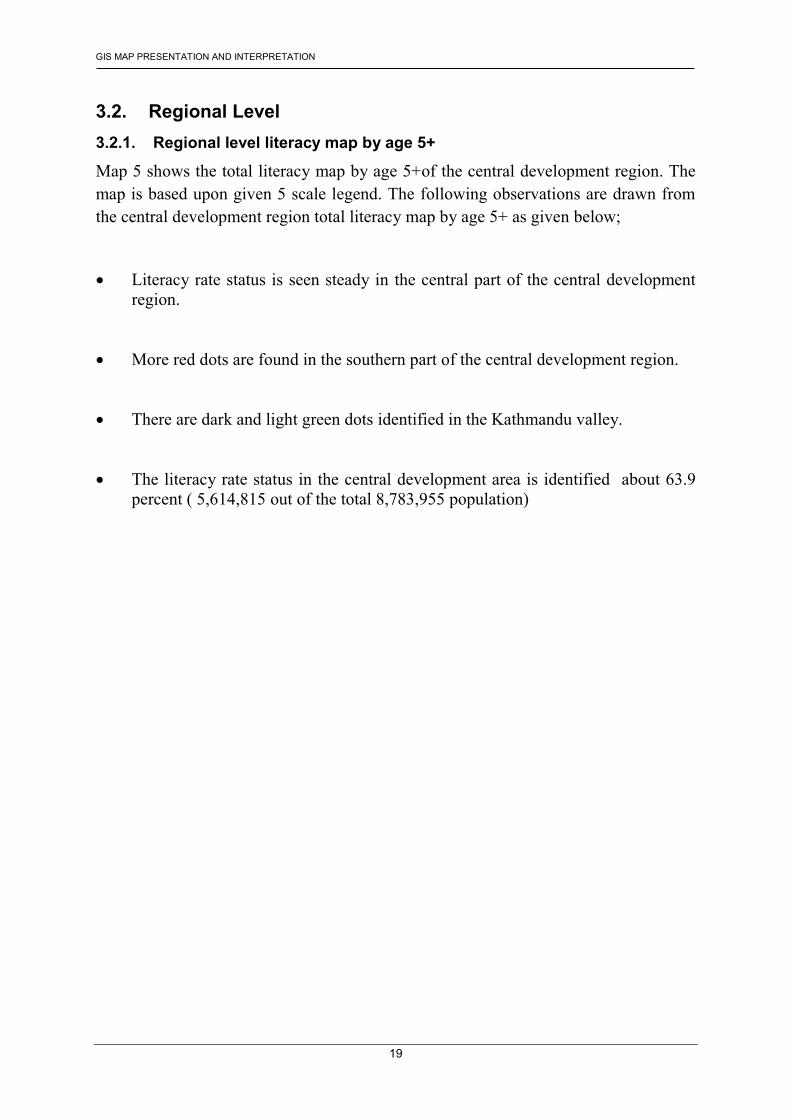
Map 5 shows the total literacy map by age 5+of the central development region. The map is based upon given 5 scale legend. The following observations are drawn from the central development region total literacy map by age 5+ as given below;
� Literacy rate status is seen steady in the central part of the central development region.
� More red dots are found in the southern part of the central development region.
� There are dark and light green dots identified in the Kathmandu valley.
� The literacy rate status in the central development area is identified about 63.9 percent ( 5,614,815 out of the total 8,783,955 population)
GIS MAP PRESENTATION AND INTERPRETATION
20
�
GIS MAP PRESENTATION AND INTERPRETATION
21
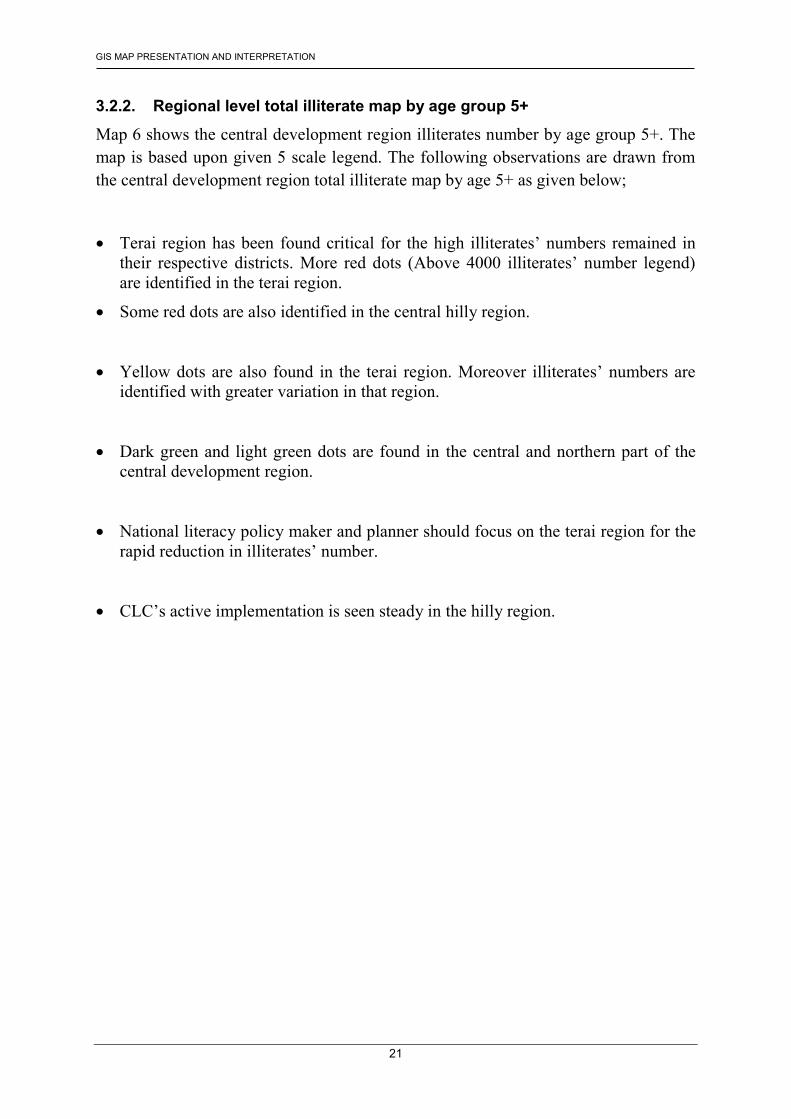
3.2.2. Regional level total illiterate map by age group 5+
Map 6 shows the central development region illiterates number by age group 5+. The map is based upon given 5 scale legend. The following observations are drawn from the central development region total illiterate map by age 5+ as given below;
� Terai region has been found critical for the high illiterates’ numbers remained in their respective districts. More red dots (Above 4000 illiterates’ number legend) are identified in the terai region.
� Some red dots are also identified in the central hilly region.
� Yellow dots are also found in the terai region. Moreover illiterates’ numbers are identified with greater variation in that region.
� Dark green and light green dots are found in the central and northern part of the central development region.
� National literacy policy maker and planner should focus on the terai region for the rapid reduction in illiterates’ number.
� CLC’s active implementation is seen steady in the hilly region.
GIS MAP PRESENTATION AND INTERPRETATION
22
�
GIS MAP PRESENTATION AND INTERPRETATION
23
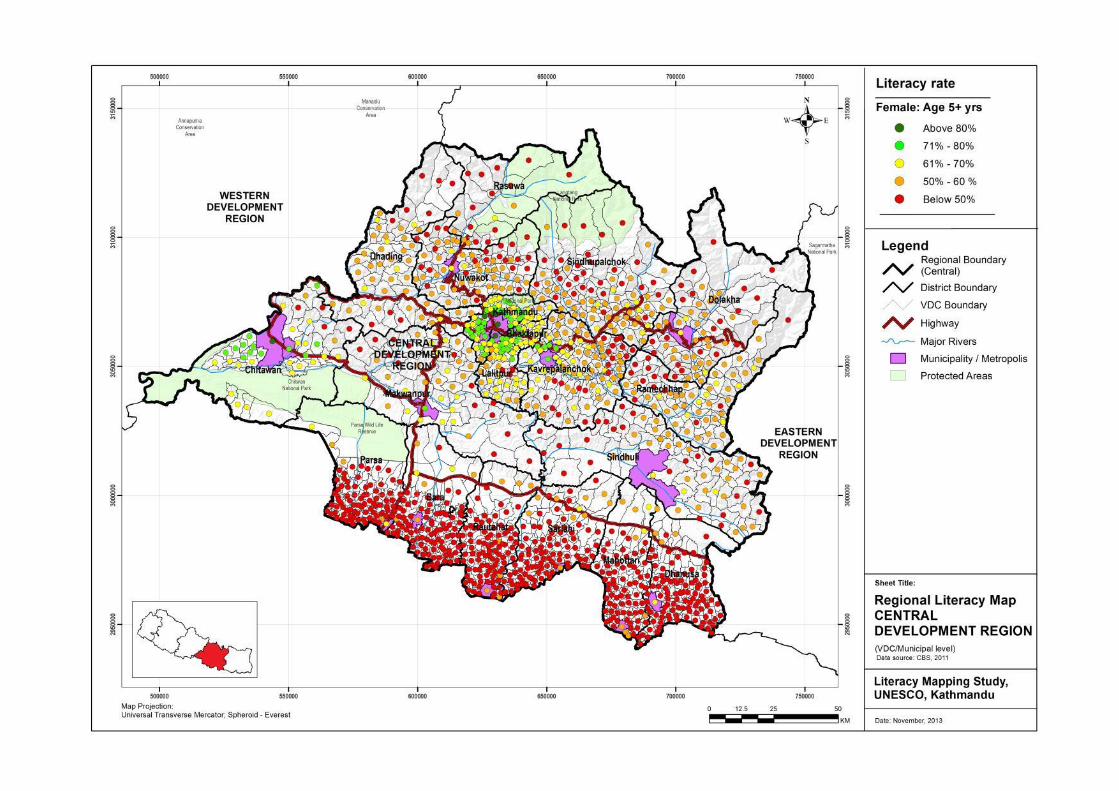
3.2.3. Regional level Female literacy map by age 5+
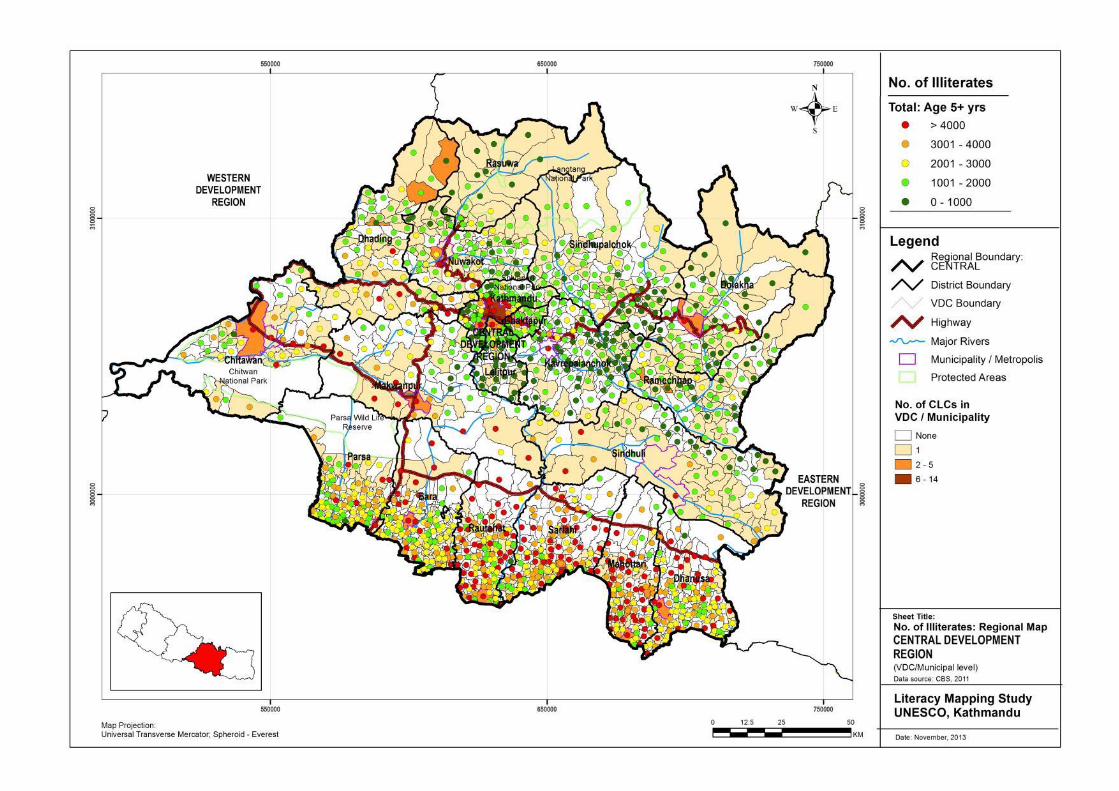
Map 7 shows the central development region literacy status of female by age group 5+. The map is based upon given 5 scale legend. The following observations are drawn from the central development region female literacy status map by age 5+ as given below;
� Red dots are found densely in the terai region where as the red dots are found scattered in many places in central and northern part of the central development region.
� Kathmandu valley is found more improving in the female literacy rate.
� There are more orange and yellow dots also found scattered in the hilly region and the mountain region.
� Female literacy rate is defined 55.2 percent (2,422,669 out of the total 4,389,789 population) in the central development region.
GIS MAP PRESENTATION AND INTERPRETATION
24
�
GIS MAP PRESENTATION AND INTERPRETATION
25
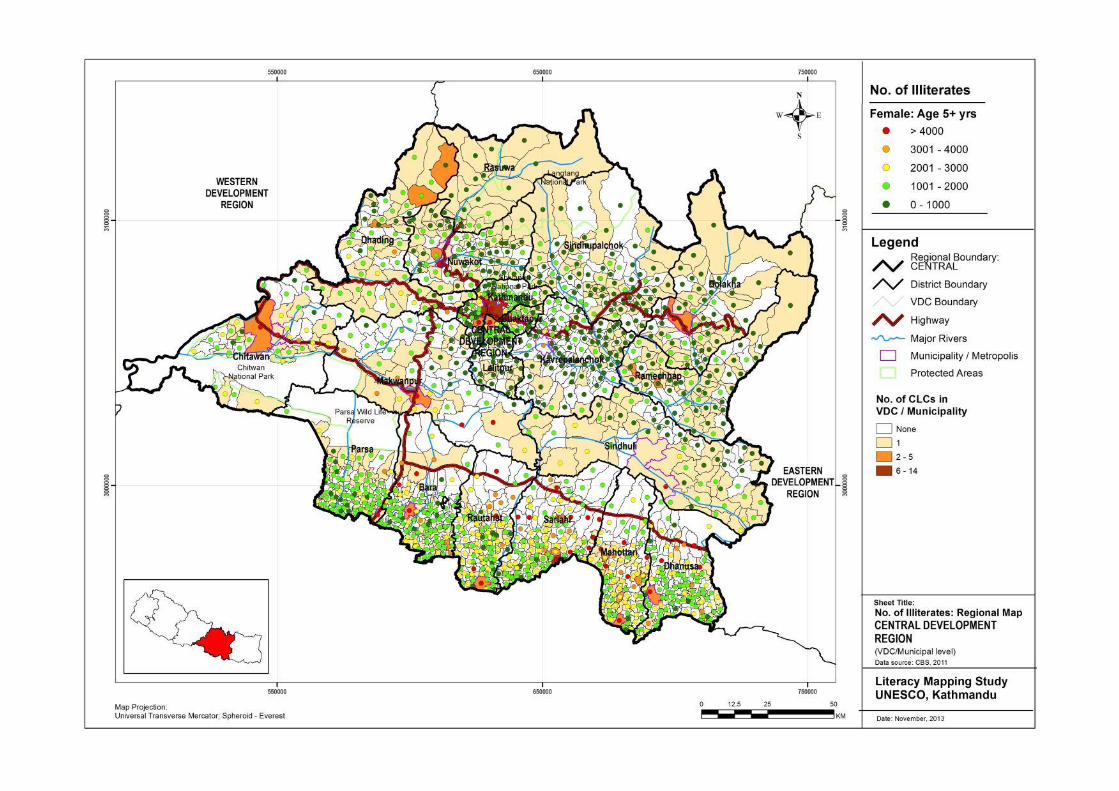
3.2.4. Regional level Female illiterate map by age 5+
Map 8 is based upon given 5 scale legend showing the female illiterate in the central development region. The following observations are drawn from the regional female illiterate map by age 5+ as given below;
� There are variations observed in female illiterates’ number in the central development region.
� Maximum Lower units of female illiterates (below 1000) are found in the central part and northern part of the central development region.
� Female illiterates are found varied in the southern part of the central development region.
� Female illiterates’ numbers are found significantly high in the Kathmandu Valley due to huge population existence.
� The existing CLC’s in the different villages and municipality did not significantly effect in the gradual reduction of illiterates in the central development region.
� There are 1967,120 female illiterates out of the total 436, 9789 population remained in the central development region.
GIS MAP PRESENTATION AND INTERPRETATION
26
�
GIS MAP PRESENTATION AND INTERPRETATION
27
3.3. District Level 3.3.1. Dolkha 3.3.1.1. Dolkha District literacy map by age 5+
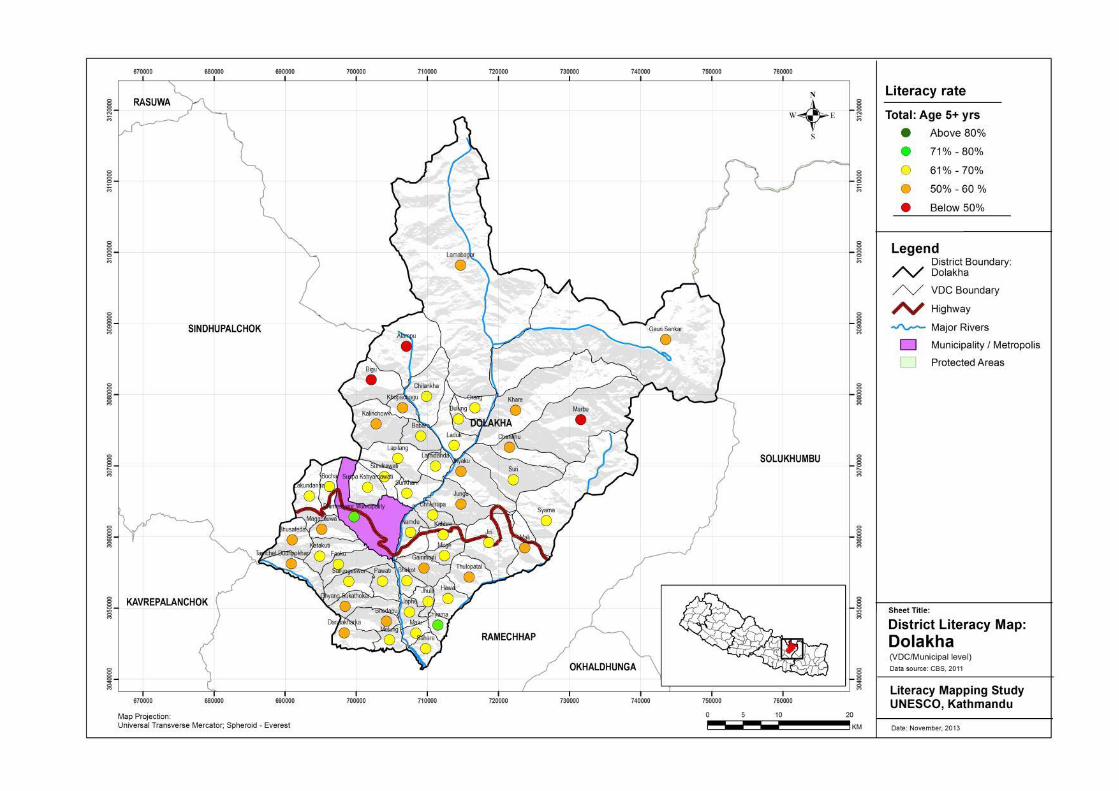
Map 9 shows the district level literacy by age 5+. The map is based upon given 5 scale legend. The following observations are drawn from the Dolkha District literacy map by age group 5+ as given below;
� Dolkha district literacy rate status is analyzed on an average as more yellow dots are seen in the literacy map.
� 3 red dots are identified in the Marbu, Bigu and the Alampu villages.
� 2 light green dots are identified in the Bhemeswor municipality and the Chayama village.
� The literacy rate is defined 62.8 percent for the Dolkha district.
GIS MAP PRESENTATION AND INTERPRETATION
28
�
GIS MAP PRESENTATION AND INTERPRETATION
29
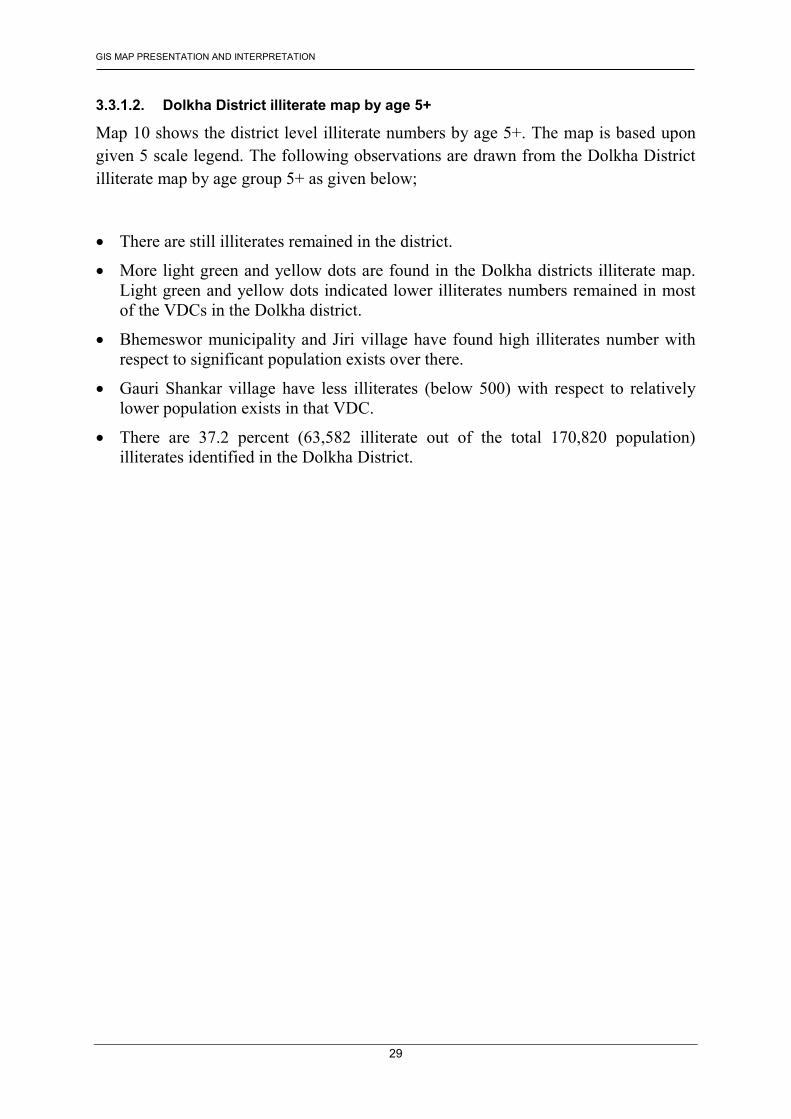
3.3.1.2. Dolkha District illiterate map by age 5+
Map 10 shows the district level illiterate numbers by age 5+. The map is based upon given 5 scale legend. The following observations are drawn from the Dolkha District illiterate map by age group 5+ as given below;
� There are still illiterates remained in the district.
� More light green and yellow dots are found in the Dolkha districts illiterate map. Light green and yellow dots indicated lower illiterates numbers remained in most of the VDCs in the Dolkha district.
� Bhemeswor municipality and Jiri village have found high illiterates number with respect to significant population exists over there.
� Gauri Shankar village have less illiterates (below 500) with respect to relatively lower population exists in that VDC.
� There are 37.2 percent (63,582 illiterate out of the total 170,820 population) illiterates identified in the Dolkha District.
GIS MAP PRESENTATION AND INTERPRETATION
30
�
GIS MAP PRESENTATION AND INTERPRETATION
31
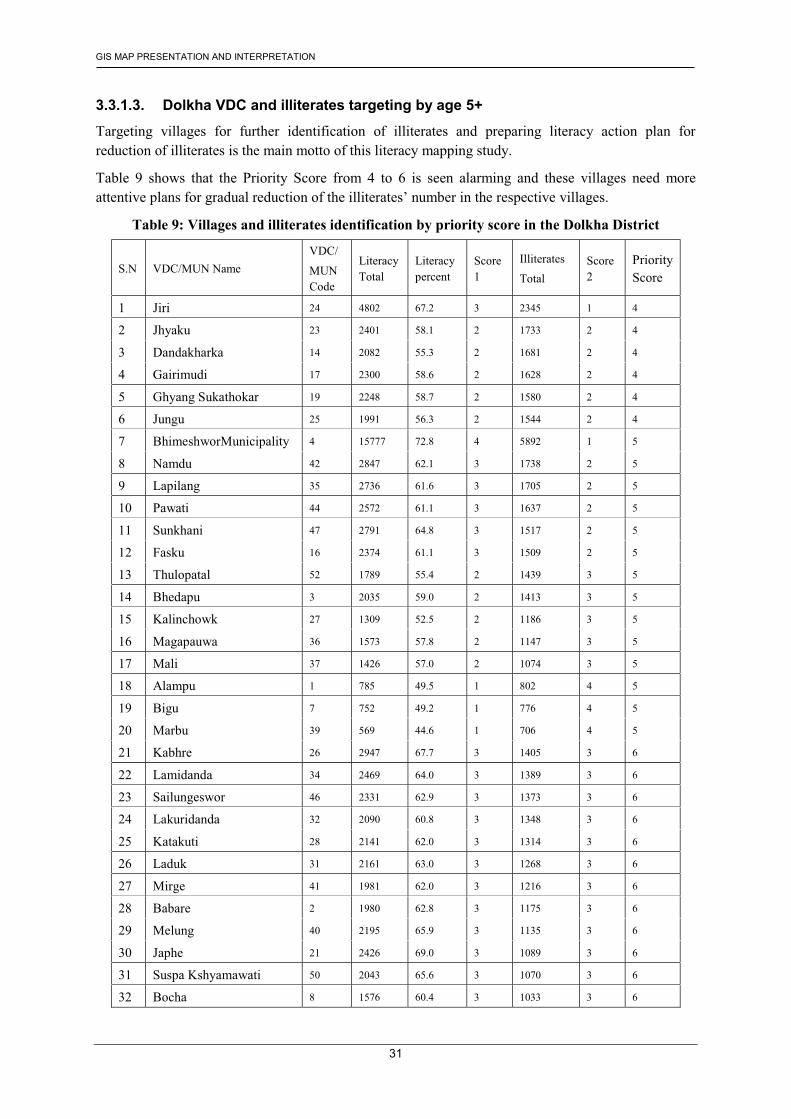
3.3.1.3. Dolkha VDC and illiterates targeting by age 5+
Targeting villages for further identification of illiterates and preparing literacy action plan for reduction of illiterates is the main motto of this literacy mapping study.
Table 9 shows that the Priority Score from 4 to 6 is seen alarming and these villages need more attentive plans for gradual reduction of the illiterates’ number in the respective villages.
Table 9: Villages and illiterates identification by priority score in the Dolkha District
S.N VDC/MUN Name VDC/
MUN Code
Literacy Total
Literacy percent
Score 1
Illiterates
Total Score 2
Priority Score
1 Jiri 24 4802 67.2 3 2345 1 4
2 Jhyaku 23 2401 58.1 2 1733 2 4
3 Dandakharka 14 2082 55.3 2 1681 2 4
4 Gairimudi 17 2300 58.6 2 1628 2 4
5 Ghyang Sukathokar 19 2248 58.7 2 1580 2 4
6 Jungu 25 1991 56.3 2 1544 2 4
7 BhimeshworMunicipality 4 15777 72.8 4 5892 1 5
8 Namdu 42 2847 62.1 3 1738 2 5
9 Lapilang 35 2736 61.6 3 1705 2 5
10 Pawati 44 2572 61.1 3 1637 2 5
11 Sunkhani 47 2791 64.8 3 1517 2 5
12 Fasku 16 2374 61.1 3 1509 2 5
13 Thulopatal 52 1789 55.4 2 1439 3 5
14 Bhedapu 3 2035 59.0 2 1413 3 5
15 Kalinchowk 27 1309 52.5 2 1186 3 5
16 Magapauwa 36 1573 57.8 2 1147 3 5
17 Mali 37 1426 57.0 2 1074 3 5
18 Alampu 1 785 49.5 1 802 4 5
19 Bigu 7 752 49.2 1 776 4 5
20 Marbu 39 569 44.6 1 706 4 5
21 Kabhre 26 2947 67.7 3 1405 3 6
22 Lamidanda 34 2469 64.0 3 1389 3 6
23 Sailungeswor 46 2331 62.9 3 1373 3 6
24 Lakuridanda 32 2090 60.8 3 1348 3 6
25 Katakuti 28 2141 62.0 3 1314 3 6
26 Laduk 31 2161 63.0 3 1268 3 6
27 Mirge 41 1981 62.0 3 1216 3 6
28 Babare 2 1980 62.8 3 1175 3 6
29 Melung 40 2195 65.9 3 1135 3 6
30 Japhe 21 2426 69.0 3 1089 3 6
31 Suspa Kshyamawati 50 2043 65.6 3 1070 3 6
32 Bocha 8 1576 60.4 3 1033 3 6
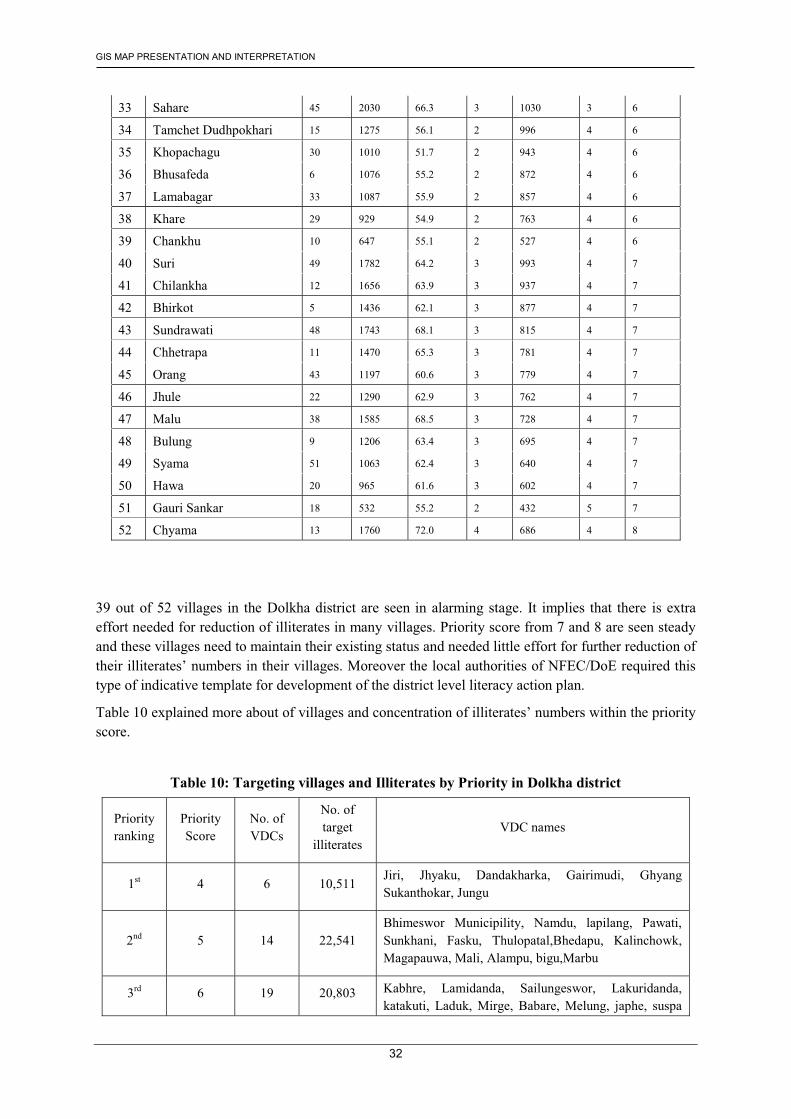
GIS MAP PRESENTATION AND INTERPRETATION
32
33 Sahare 45 2030 66.3 3 1030 3 6
34 Tamchet Dudhpokhari 15 1275 56.1 2 996 4 6
35 Khopachagu 30 1010 51.7 2 943 4 6
36 Bhusafeda 6 1076 55.2 2 872 4 6
37 Lamabagar 33 1087 55.9 2 857 4 6
38 Khare 29 929 54.9 2 763 4 6
39 Chankhu 10 647 55.1 2 527 4 6
40 Suri 49 1782 64.2 3 993 4 7
41 Chilankha 12 1656 63.9 3 937 4 7
42 Bhirkot 5 1436 62.1 3 877 4 7
43 Sundrawati 48 1743 68.1 3 815 4 7
44 Chhetrapa 11 1470 65.3 3 781 4 7
45 Orang 43 1197 60.6 3 779 4 7
46 Jhule 22 1290 62.9 3 762 4 7
47 Malu 38 1585 68.5 3 728 4 7
48 Bulung 9 1206 63.4 3 695 4 7
49 Syama 51 1063 62.4 3 640 4 7
50 Hawa 20 965 61.6 3 602 4 7
51 Gauri Sankar 18 532 55.2 2 432 5 7
52 Chyama 13 1760 72.0 4 686 4 8
39 out of 52 villages in the Dolkha district are seen in alarming stage. It implies that there is extra effort needed for reduction of illiterates in many villages. Priority score from 7 and 8 are seen steady and these villages need to maintain their existing status and needed little effort for further reduction of their illiterates’ numbers in their villages. Moreover the local authorities of NFEC/DoE required this type of indicative template for development of the district level literacy action plan.
Table 10 explained more about of villages and concentration of illiterates’ numbers within the priority score.
Table 10: Targeting villages and Illiterates by Priority in Dolkha district
Priority ranking
Priority Score
No. of VDCs
No. of target
illiterates VDC names
1st 4 6 10,511 Jiri, Jhyaku, Dandakharka, Gairimudi, Ghyang Sukanthokar, Jungu
2nd 5 14 22,541 Bhimeswor Municipility, Namdu, lapilang, Pawati, Sunkhani, Fasku, Thulopatal,Bhedapu, Kalinchowk, Magapauwa, Mali, Alampu, bigu,Marbu
3rd 6 19 20,803 Kabhre, Lamidanda, Sailungeswor, Lakuridanda, katakuti, Laduk, Mirge, Babare, Melung, japhe, suspa
GIS MAP PRESENTATION AND INTERPRETATION
33
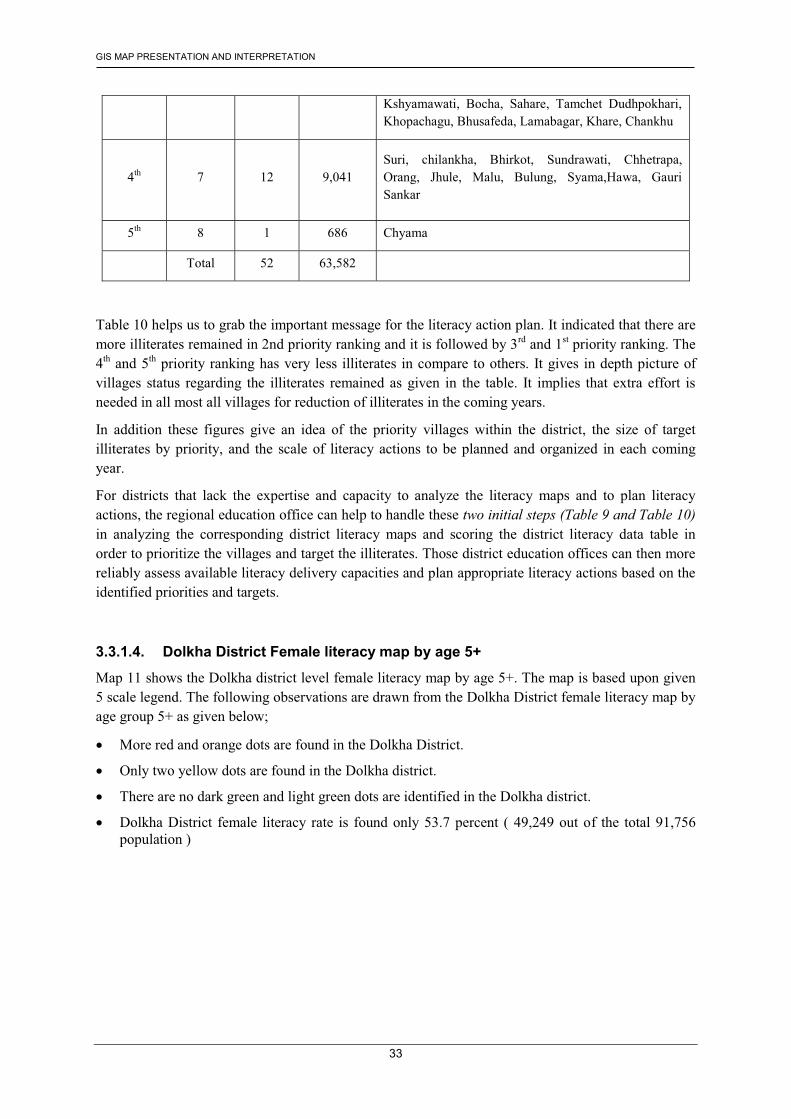
Kshyamawati, Bocha, Sahare, Tamchet Dudhpokhari, Khopachagu, Bhusafeda, Lamabagar, Khare, Chankhu
4th 7 12
9,041
Suri, chilankha, Bhirkot, Sundrawati, Chhetrapa, Orang, Jhule, Malu, Bulung, Syama,Hawa, Gauri Sankar
5th 8 1 686 Chyama
Total 52 63,582
Table 10 helps us to grab the important message for the literacy action plan. It indicated that there are more illiterates remained in 2nd priority ranking and it is followed by 3rd and 1st priority ranking. The 4th and 5th priority ranking has very less illiterates in compare to others. It gives in depth picture of villages status regarding the illiterates remained as given in the table. It implies that extra effort is needed in all most all villages for reduction of illiterates in the coming years.
In addition these figures give an idea of the priority villages within the district, the size of target illiterates by priority, and the scale of literacy actions to be planned and organized in each coming year.
For districts that lack the expertise and capacity to analyze the literacy maps and to plan literacy actions, the regional education office can help to handle these two initial steps (Table 9 and Table 10) in analyzing the corresponding district literacy maps and scoring the district literacy data table in order to prioritize the villages and target the illiterates. Those district education offices can then more reliably assess available literacy delivery capacities and plan appropriate literacy actions based on the identified priorities and targets.
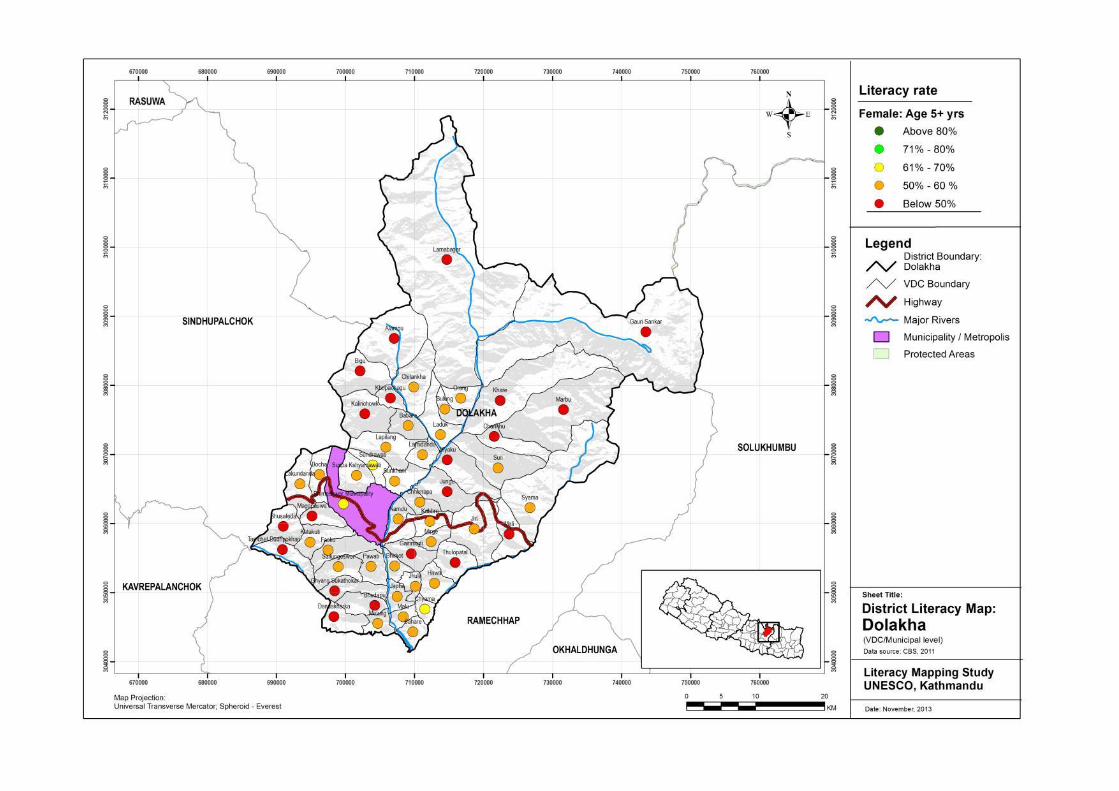
3.3.1.4. Dolkha District Female literacy map by age 5+
Map 11 shows the Dolkha district level female literacy map by age 5+. The map is based upon given 5 scale legend. The following observations are drawn from the Dolkha District female literacy map by age group 5+ as given below;
� More red and orange dots are found in the Dolkha District.
� Only two yellow dots are found in the Dolkha district.
� There are no dark green and light green dots are identified in the Dolkha district.
� Dolkha District female literacy rate is found only 53.7 percent ( 49,249 out of the total 91,756 population )
GIS MAP PRESENTATION AND INTERPRETATION
34
�
GIS MAP PRESENTATION AND INTERPRETATION
35
3.3.1.5. Dolkha District Female illiterate map by age 5+
Map 12 shows the Dolkha district level female illiterate map by age 5+. The map is based upon given 5 scale legend. The following observations are drawn from the Dolkha District female illiterate map by age group 5+ as given below;
� Female Illiterates numbers are found below the average ratio in the Dolkha District.
� The existing CLC’s in the Dolkha villages did not influenced significantly on the reduction of the female illiterates’ number.
� Bhemeswor municipality is still lagging behind the female illiterates number with respect to their relatively high population exists in the municipality.
� 42,507 female out of the total 91756 population are still remained illiterates.
� Bhimeswor municipality has still 4,228 female illiterates out the total 11.281 population still remained.
GIS MAP PRESENTATION AND INTERPRETATION
36
�
GIS MAP PRESENTATION AND INTERPRETATION
37
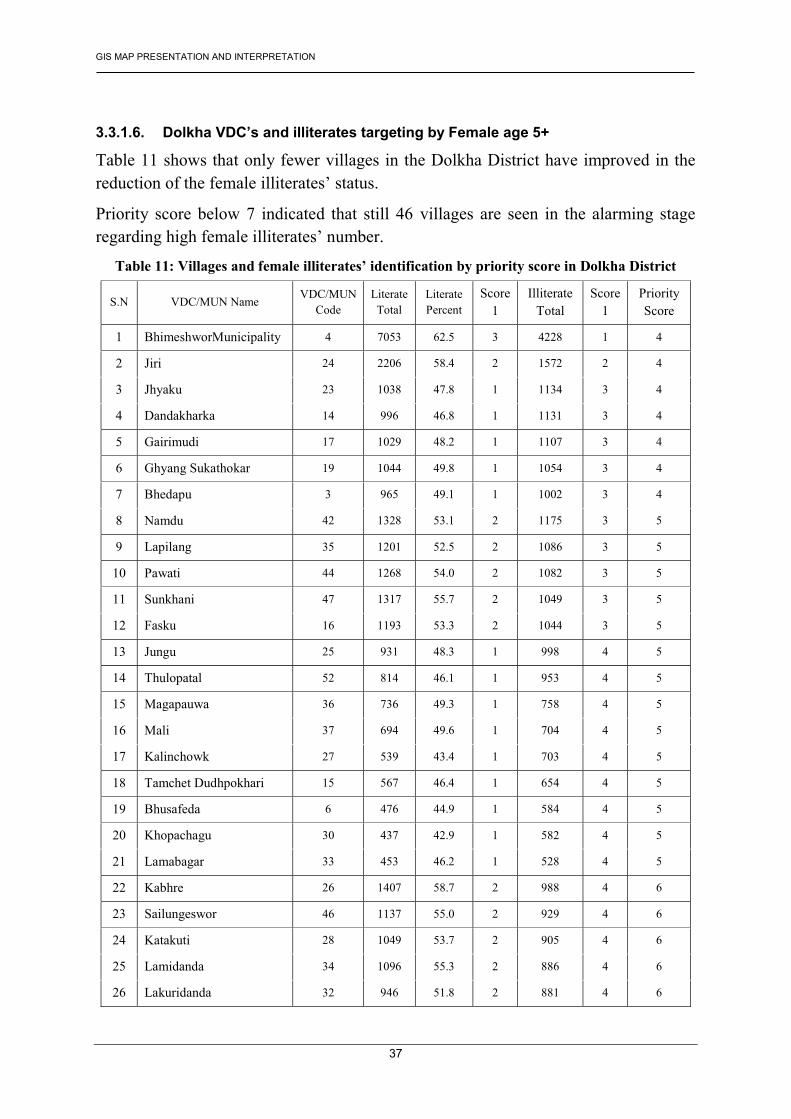
3.3.1.6. Dolkha VDC’s and illiterates targeting by Female age 5+
Table 11 shows that only fewer villages in the Dolkha District have improved in the reduction of the female illiterates’ status.
Priority score below 7 indicated that still 46 villages are seen in the alarming stage regarding high female illiterates’ number.
Table 11: Villages and female illiterates’ identification by priority score in Dolkha District
S.N VDC/MUN Name VDC/MUN Code
Literate Total
Literate Percent
Score 1
Illiterate Total
Score 1
Priority Score
1 BhimeshworMunicipality 4 7053 62.5 3 4228 1 4
2 Jiri 24 2206 58.4 2 1572 2 4
3 Jhyaku 23 1038 47.8 1 1134 3 4
4 Dandakharka 14 996 46.8 1 1131 3 4
5 Gairimudi 17 1029 48.2 1 1107 3 4
6 Ghyang Sukathokar 19 1044 49.8 1 1054 3 4
7 Bhedapu 3 965 49.1 1 1002 3 4
8 Namdu 42 1328 53.1 2 1175 3 5
9 Lapilang 35 1201 52.5 2 1086 3 5
10 Pawati 44 1268 54.0 2 1082 3 5
11 Sunkhani 47 1317 55.7 2 1049 3 5
12 Fasku 16 1193 53.3 2 1044 3 5
13 Jungu 25 931 48.3 1 998 4 5
14 Thulopatal 52 814 46.1 1 953 4 5
15 Magapauwa 36 736 49.3 1 758 4 5
16 Mali 37 694 49.6 1 704 4 5
17 Kalinchowk 27 539 43.4 1 703 4 5
18 Tamchet Dudhpokhari 15 567 46.4 1 654 4 5
19 Bhusafeda 6 476 44.9 1 584 4 5
20 Khopachagu 30 437 42.9 1 582 4 5
21 Lamabagar 33 453 46.2 1 528 4 5
22 Kabhre 26 1407 58.7 2 988 4 6
23 Sailungeswor 46 1137 55.0 2 929 4 6
24 Katakuti 28 1049 53.7 2 905 4 6
25 Lamidanda 34 1096 55.3 2 886 4 6
26 Lakuridanda 32 946 51.8 2 881 4 6
GIS MAP PRESENTATION AND INTERPRETATION
38
27 Laduk 31 931 52.1 2 856 4 6
28 Mirge 41 962 54.2 2 812 4 6
29 Melung 40 1005 55.7 2 799 4 6
30 Babare 2 950 55.5 2 761 4 6
31 Japhe 21 1087 59.7 2 735 4 6
32 Suspa Kshyamawati 50 971 57.4 2 720 4 6
33 Sahare 45 956 57.1 2 717 4 6
34 Bocha 8 815 53.7 2 704 4 6
35 Suri 49 769 52.7 2 689 4 6
36 Chilankha 12 759 56.3 2 589 4 6
37 Bhirkot 5 694 54.3 2 583 4 6
38 Chhetrapa 11 691 55.7 2 549 4 6
39 Jhule 22 635 55.4 2 511 4 6
40 Malu 38 720 58.8 2 505 4 6
41 Alampu 1 346 41.7 1 483 5 6
42 Bigu 7 330 41.1 1 472 5 6
43 Khare 29 355 42.9 1 472 5 6
44 Marbu 39 249 38.4 1 400 5 6
45 Chankhu 10 259 42.5 1 351 5 6
46 Gauri Sankar 18 197 42.3 1 269 5 6
47 Sundrawati 48 809 60.1 3 536 4 7
48 Orang 43 504 50.8 2 488 5 7
49 Bulung 9 536 53.4 2 468 5 7
50 Syama 51 517 54.8 2 427 5 7
51 Hawa 20 456 53.1 2 402 5 7
52 Chyama 13 826 62.7 3 492 5 8
Females’ illiterates’ issues is considered remained in more villages. The given analysis about identifying villages and female illiterates will be instrumental for stakeholders’ for villages level planning for their annual planning in their district.
Table 12 show that the concentration of illiterates and the villages in their respective district.
GIS MAP PRESENTATION AND INTERPRETATION
39
Table 12: Targeting VDCs and female Illiterates by Priority in the Dolkha district
Priority ranking
Priority Score
No. of VDCs
No. of target illiterates
VDC names
1st 4 7 11228 Jiri, Jhyaku, Dandakharka, , Ghyang Sukanthokar, BhemeshworMunicipality, Bhedapu, Gairimudi
2nd 5 14 11900 Namdu, Lapiling, Pawati, sunkhani, Fasku, Jungu, thulopatal, Magapauwa, Mali, Kalinchok, Tamchet dudhpokhari, Bhusafeda, Khopachagu, Lamabagar
3rd 6 25 16566
Kabhre, Sailungeswor, Katakuti, Lamidanda, Lakuridanda, laduk,Mirge, Melung,Babare, Japhe, Suspa Kshyamawati, Sahare, Bocha, Suri, Chilankha, Bhirkot, Chhetrapa, Jhule, Malu, Alampu, Bigu,Khare, Marbu, Chankhu, Gauri Sankar
4th 7 5 2321 Sundrawati, Orang, Bulung, Syama, Hawa
5th 8 1 492 Chyama
Total 52 42507
More illiterates are still remained in the priority ranking 3rd, 2nd and 1st. In 3rd priority ranking there are 16,566 illiterates and 25 villages are found and where as there are only 492 illiterates are found in 5th priority ranking. It implies that illiterates are spread in more districts. About 66.7 percent female (42,507 female illiterates out of 63,582 total illiterates) illiterates are analyzed remained in the Dolkha district.
GIS MAP PRESENTATION AND INTERPRETATION
40
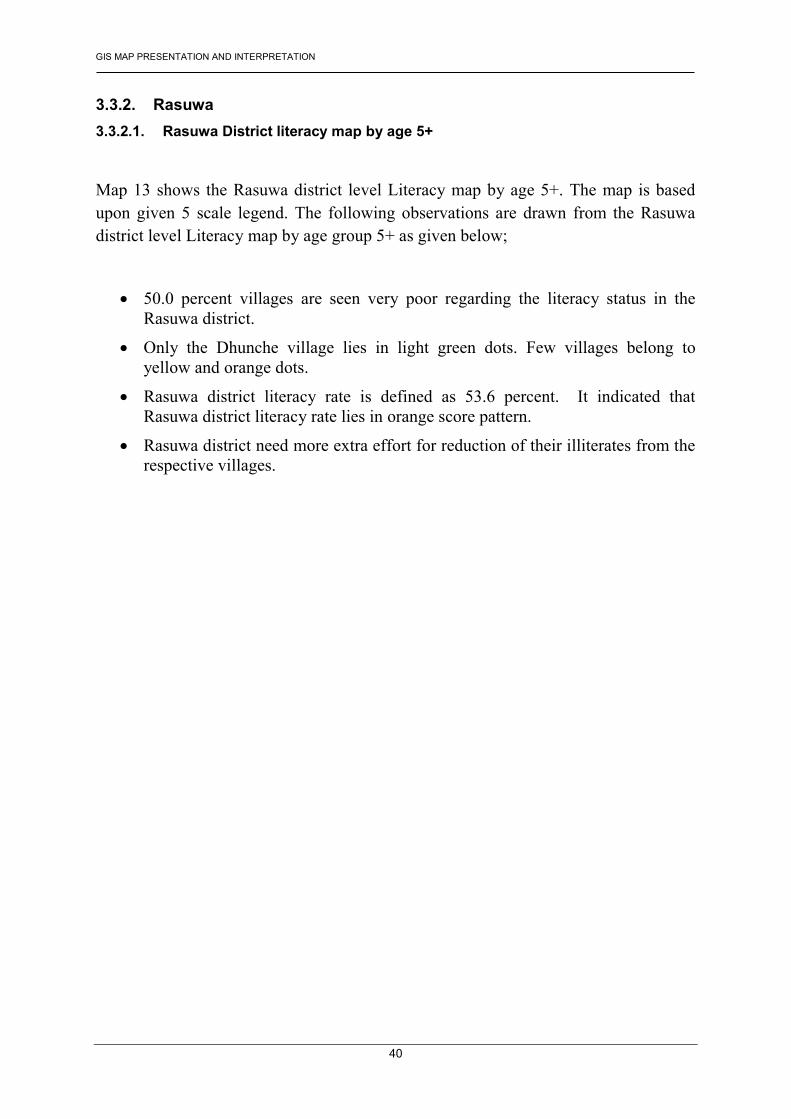
3.3.2. Rasuwa 3.3.2.1. Rasuwa District literacy map by age 5+
Map 13 shows the Rasuwa district level Literacy map by age 5+. The map is based upon given 5 scale legend. The following observations are drawn from the Rasuwa district level Literacy map by age group 5+ as given below;
� 50.0 percent villages are seen very poor regarding the literacy status in the Rasuwa district.
� Only the Dhunche village lies in light green dots. Few villages belong to yellow and orange dots.
� Rasuwa district literacy rate is defined as 53.6 percent. It indicated that Rasuwa district literacy rate lies in orange score pattern.
� Rasuwa district need more extra effort for reduction of their illiterates from the respective villages.
GIS MAP PRESENTATION AND INTERPRETATION
41
�
GIS MAP PRESENTATION AND INTERPRETATION
42
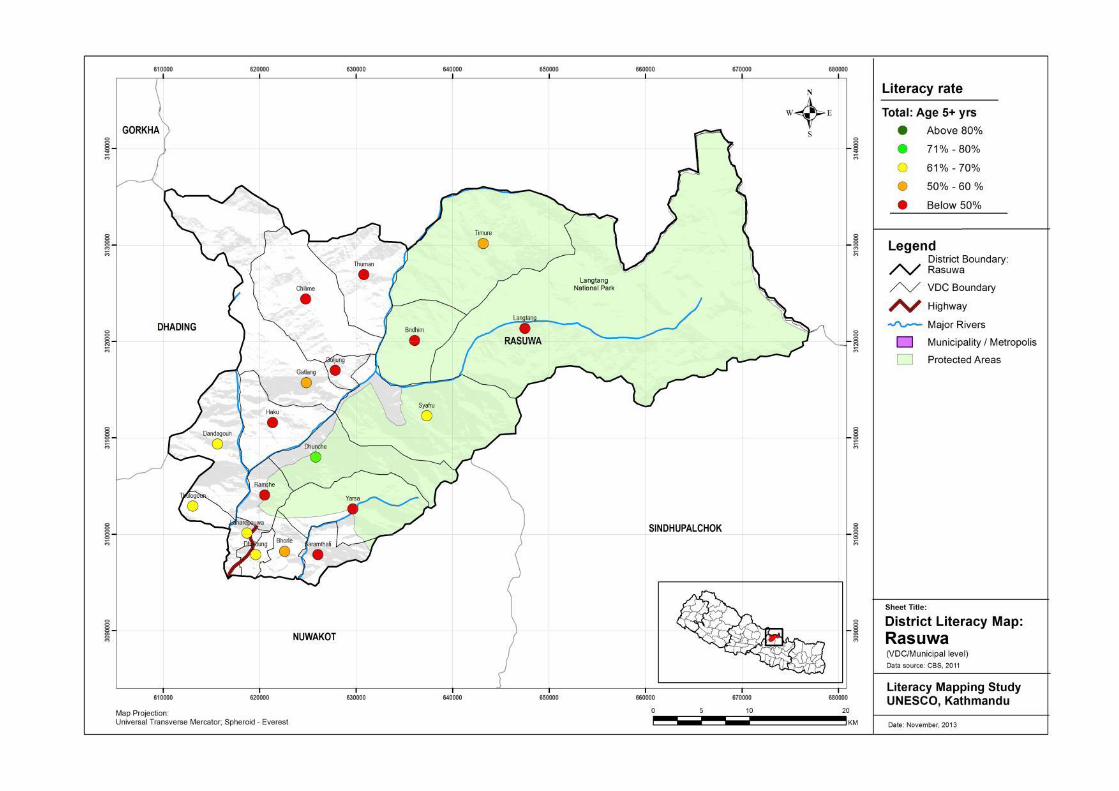
3.3.2.2. Rasuwa District illiterate map by age 5+
Map 14 shows the Rasuwa district level illiterate map by age 5+. The map is based upon given 5 scale legend. The following observations are drawn from the Rasuwa district level illiterate map by age group 5+ as given below;
� CLC is established in all most all villages in the Rasuwa District. The CLC’s activities are seen in steady pace. There are lower illiterates’ numbers in more villages.
� The illiterate are seen in low number in northern part of the Rsuwa district where as illiterates numbers are seen high in southern part of the Rasuwa Dsitrict.
� There are 18,348 illiterates out of the total 39,545 population identified.
GIS MAP PRESENTATION AND INTERPRETATION
43
�
GIS MAP PRESENTATION AND INTERPRETATION
44
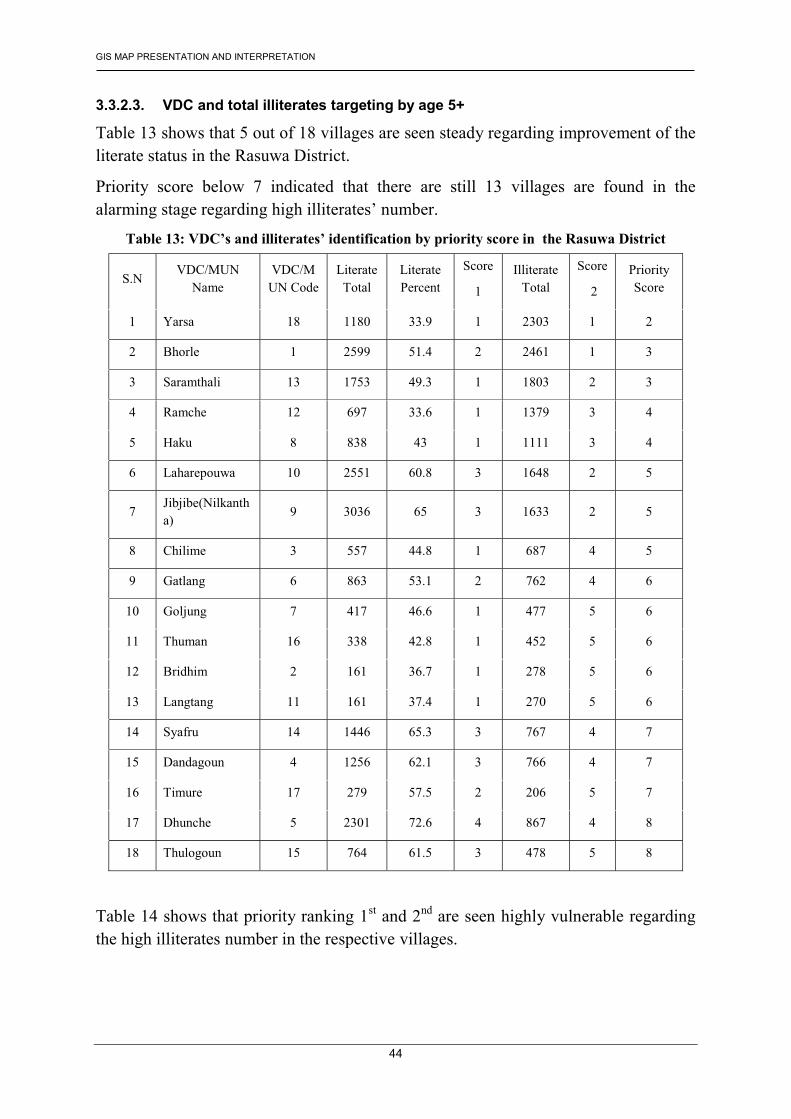
3.3.2.3. VDC and total illiterates targeting by age 5+
Table 13 shows that 5 out of 18 villages are seen steady regarding improvement of the literate status in the Rasuwa District.
Priority score below 7 indicated that there are still 13 villages are found in the alarming stage regarding high illiterates’ number.
Table 13: VDC’s and illiterates’ identification by priority score in the Rasuwa District
S.N VDC/MUN
Name VDC/M
UN Code Literate Total
Literate Percent
Score
1 Illiterate
Total Score
2 Priority Score
1 Yarsa 18 1180 33.9 1 2303 1 2
2 Bhorle 1 2599 51.4 2 2461 1 3
3 Saramthali 13 1753 49.3 1 1803 2 3
4 Ramche 12 697 33.6 1 1379 3 4
5 Haku 8 838 43 1 1111 3 4
6 Laharepouwa 10 2551 60.8 3 1648 2 5
7 Jibjibe(Nilkantha)
9 3036 65 3 1633 2 5
8 Chilime 3 557 44.8 1 687 4 5
9 Gatlang 6 863 53.1 2 762 4 6
10 Goljung 7 417 46.6 1 477 5 6
11 Thuman 16 338 42.8 1 452 5 6
12 Bridhim 2 161 36.7 1 278 5 6
13 Langtang 11 161 37.4 1 270 5 6
14 Syafru 14 1446 65.3 3 767 4 7
15 Dandagoun 4 1256 62.1 3 766 4 7
16 Timure 17 279 57.5 2 206 5 7
17 Dhunche 5 2301 72.6 4 867 4 8
18 Thulogoun 15 764 61.5 3 478 5 8
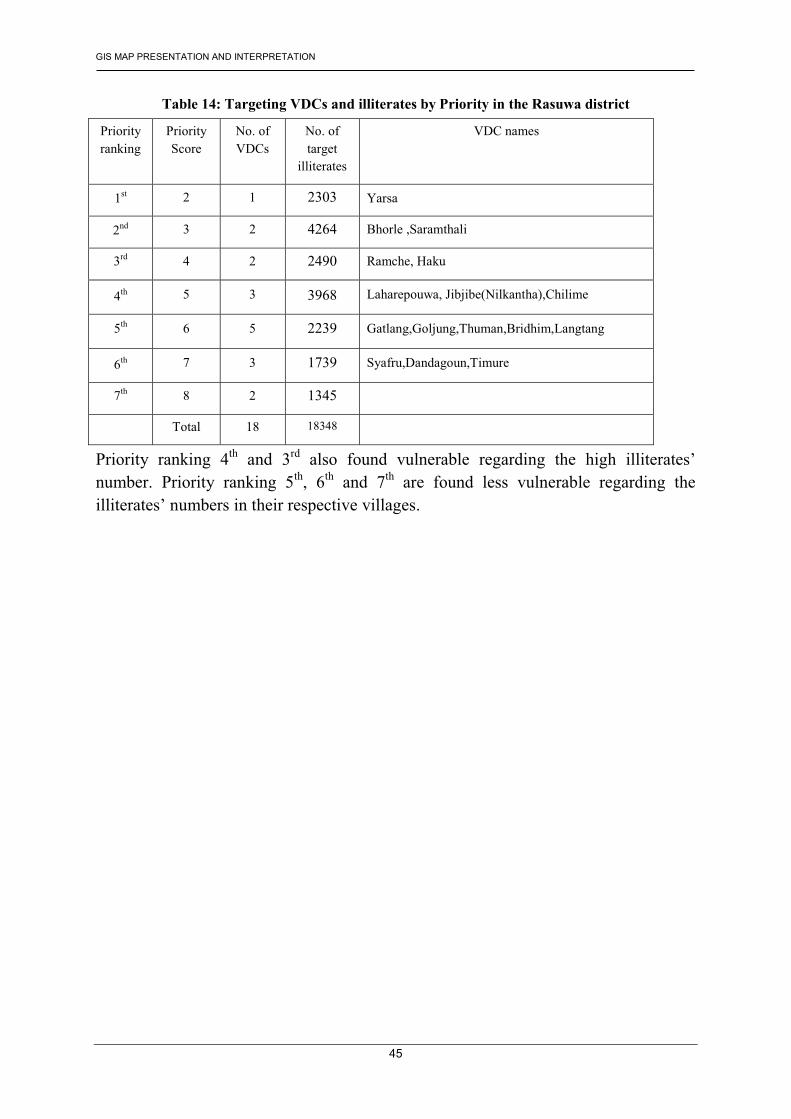
Table 14 shows that priority ranking 1st and 2nd are seen highly vulnerable regarding the high illiterates number in the respective villages.
GIS MAP PRESENTATION AND INTERPRETATION
45
Table 14: Targeting VDCs and illiterates by Priority in the Rasuwa district
Priority ranking
Priority Score
No. of VDCs
No. of target
illiterates
VDC names
1st 2 1 2303 Yarsa
2nd 3 2 4264 Bhorle ,Saramthali
3rd 4 2 2490 Ramche, Haku
4th 5 3 3968 Laharepouwa, Jibjibe(Nilkantha),Chilime
5th 6 5 2239 Gatlang,Goljung,Thuman,Bridhim,Langtang
6th 7 3 1739 Syafru,Dandagoun,Timure
7th 8 2 1345
Total 18 18348
Priority ranking 4th and 3rd also found vulnerable regarding the high illiterates’ number. Priority ranking 5th, 6th and 7th are found less vulnerable regarding the illiterates’ numbers in their respective villages.
GIS MAP PRESENTATION AND INTERPRETATION
46
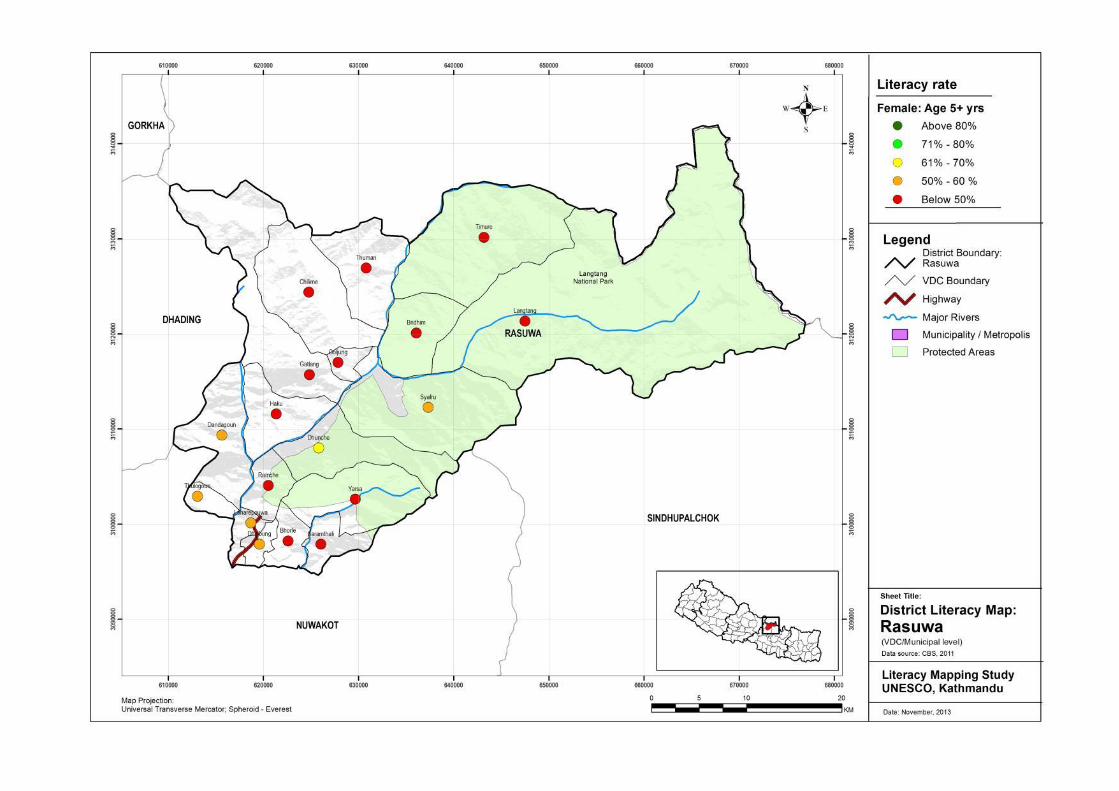
3.3.2.4. Rasuwa District female literacy map by age 5+
Map 15 shows the Rasuwa district female literacy map by age 5+. The map is based upon given 5 scale legend. The following observations are drawn from the Rasuwa district literacy map by age group 5+ as given below;
� More red dots are found in the Rasuwa district regarding the female literacy rate.
� Few orange dots are also found in the Rasuwa district regarding the female literacy rate.
� Only one yellow dot is found in the Dhunche VDC.
� Female literacy rate by age 5+ status in the Rasuwa district is seen very poor.
� Female literacy rate is found only 46.5 percent (9,291 out of the total 19,980 population) in the Rasuwa district.
GIS MAP PRESENTATION AND INTERPRETATION
47
�
GIS MAP PRESENTATION AND INTERPRETATION
48
3.3.2.5. Rasuwa District female illiterate map by age 5+
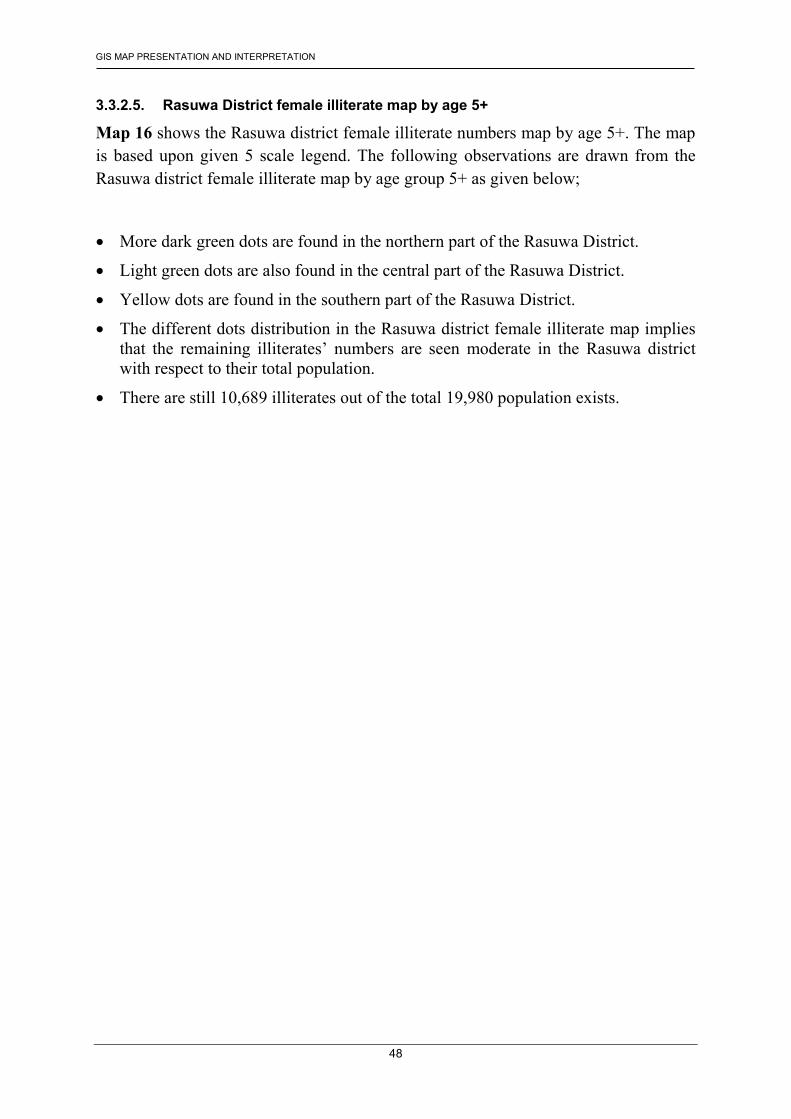
Map 16 shows the Rasuwa district female illiterate numbers map by age 5+. The map is based upon given 5 scale legend. The following observations are drawn from the Rasuwa district female illiterate map by age group 5+ as given below;
� More dark green dots are found in the northern part of the Rasuwa District.
� Light green dots are also found in the central part of the Rasuwa District.
� Yellow dots are found in the southern part of the Rasuwa District.
� The different dots distribution in the Rasuwa district female illiterate map implies that the remaining illiterates’ numbers are seen moderate in the Rasuwa district with respect to their total population.
� There are still 10,689 illiterates out of the total 19,980 population exists.
GIS MAP PRESENTATION AND INTERPRETATION
49
�
GIS MAP PRESENTATION AND INTERPRETATION
50
3.3.2.6. VDC and female illiterates targeting by age 5+
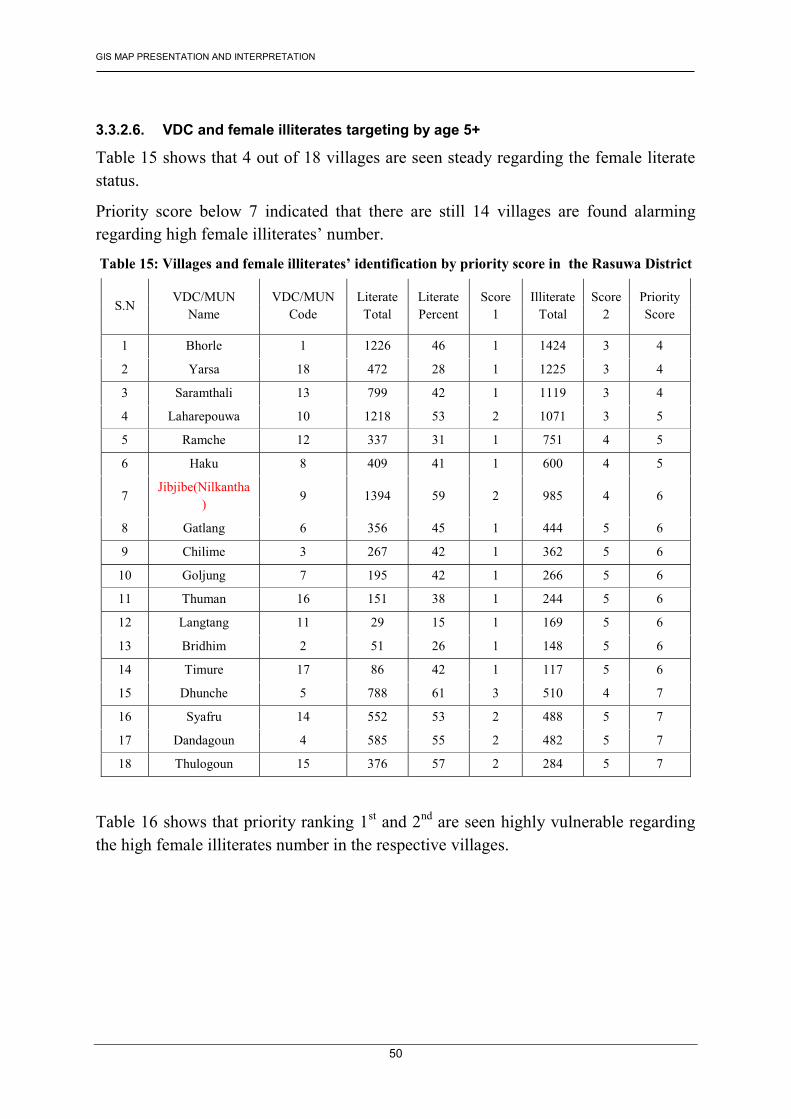
Table 15 shows that 4 out of 18 villages are seen steady regarding the female literate status.
Priority score below 7 indicated that there are still 14 villages are found alarming regarding high female illiterates’ number.
Table 15: Villages and female illiterates’ identification by priority score in the Rasuwa District
S.N VDC/MUN
Name VDC/MUN
Code Literate Total
Literate Percent
Score 1
Illiterate Total
Score 2
Priority Score
1 Bhorle 1 1226 46 1 1424 3 4
2 Yarsa 18 472 28 1 1225 3 4
3 Saramthali 13 799 42 1 1119 3 4
4 Laharepouwa 10 1218 53 2 1071 3 5
5 Ramche 12 337 31 1 751 4 5
6 Haku 8 409 41 1 600 4 5
7 Jibjibe(Nilkantha
) 9 1394 59 2 985 4 6
8 Gatlang 6 356 45 1 444 5 6
9 Chilime 3 267 42 1 362 5 6
10 Goljung 7 195 42 1 266 5 6
11 Thuman 16 151 38 1 244 5 6
12 Langtang 11 29 15 1 169 5 6
13 Bridhim 2 51 26 1 148 5 6
14 Timure 17 86 42 1 117 5 6
15 Dhunche 5 788 61 3 510 4 7
16 Syafru 14 552 53 2 488 5 7
17 Dandagoun 4 585 55 2 482 5 7
18 Thulogoun 15 376 57 2 284 5 7
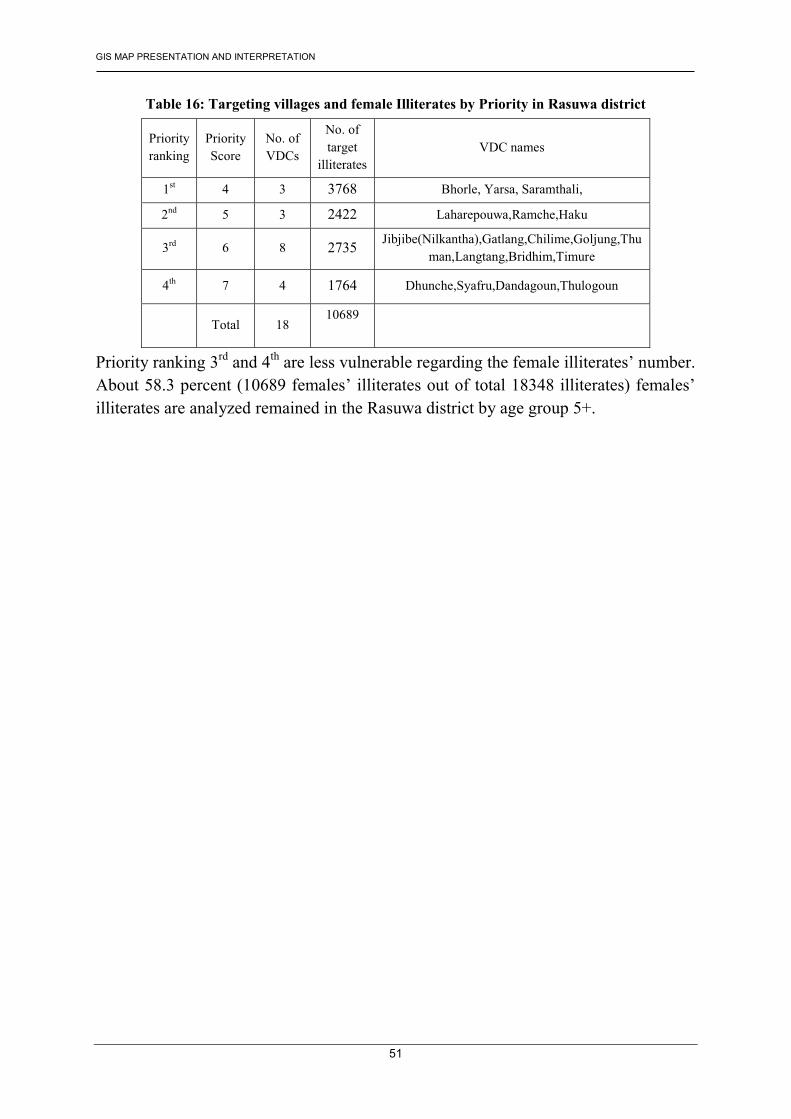
Table 16 shows that priority ranking 1st and 2nd are seen highly vulnerable regarding the high female illiterates number in the respective villages.
GIS MAP PRESENTATION AND INTERPRETATION
51
Table 16: Targeting villages and female Illiterates by Priority in Rasuwa district
Priority ranking
Priority Score
No. of VDCs
No. of target
illiterates VDC names
1st 4 3 3768 Bhorle, Yarsa, Saramthali,
2nd 5 3 2422 Laharepouwa,Ramche,Haku
3rd 6 8 2735 Jibjibe(Nilkantha),Gatlang,Chilime,Goljung,Thuman,Langtang,Bridhim,Timure
4th 7 4 1764 Dhunche,Syafru,Dandagoun,Thulogoun
Total 18 10689
Priority ranking 3rd and 4th are less vulnerable regarding the female illiterates’ number. About 58.3 percent (10689 females’ illiterates out of total 18348 illiterates) females’ illiterates are analyzed remained in the Rasuwa district by age group 5+.
GIS MAP PRESENTATION AND INTERPRETATION
52
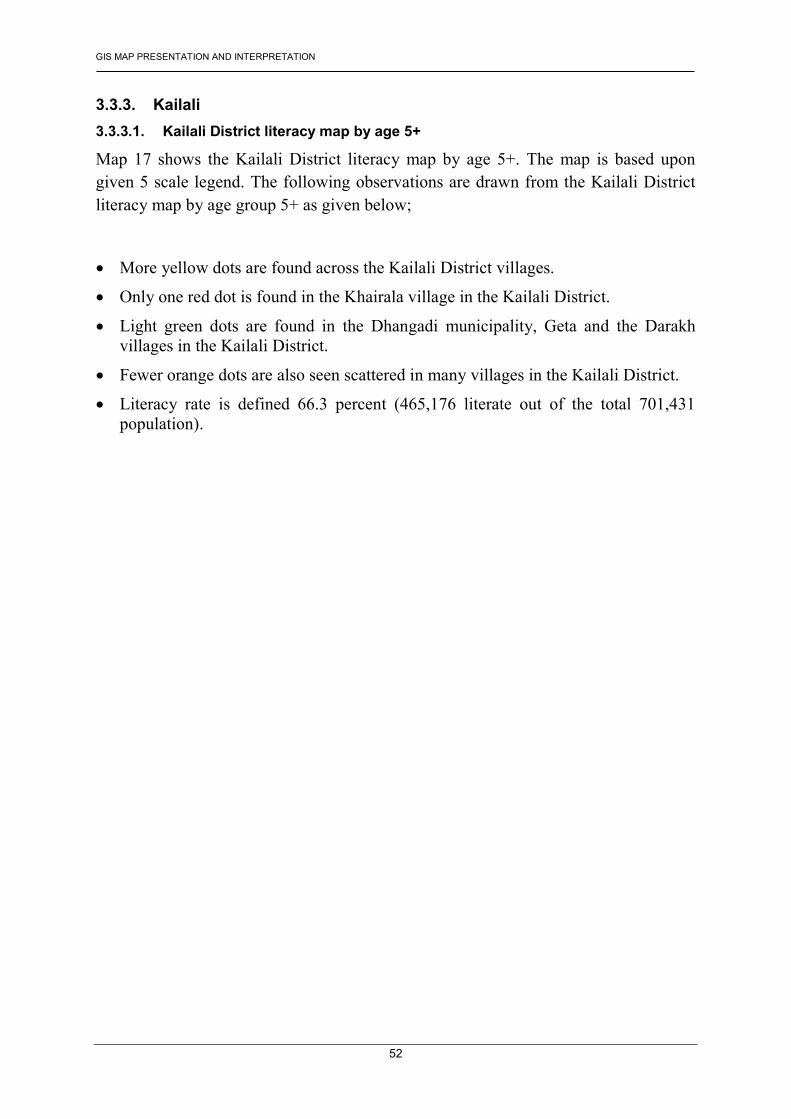
3.3.3. Kailali 3.3.3.1. Kailali District literacy map by age 5+
Map 17 shows the Kailali District literacy map by age 5+. The map is based upon given 5 scale legend. The following observations are drawn from the Kailali District literacy map by age group 5+ as given below;
� More yellow dots are found across the Kailali District villages.
� Only one red dot is found in the Khairala village in the Kailali District.
� Light green dots are found in the Dhangadi municipality, Geta and the Darakh villages in the Kailali District.
� Fewer orange dots are also seen scattered in many villages in the Kailali District.
� Literacy rate is defined 66.3 percent (465,176 literate out of the total 701,431 population).
GIS MAP PRESENTATION AND INTERPRETATION
53
�
GIS MAP PRESENTATION AND INTERPRETATION
54
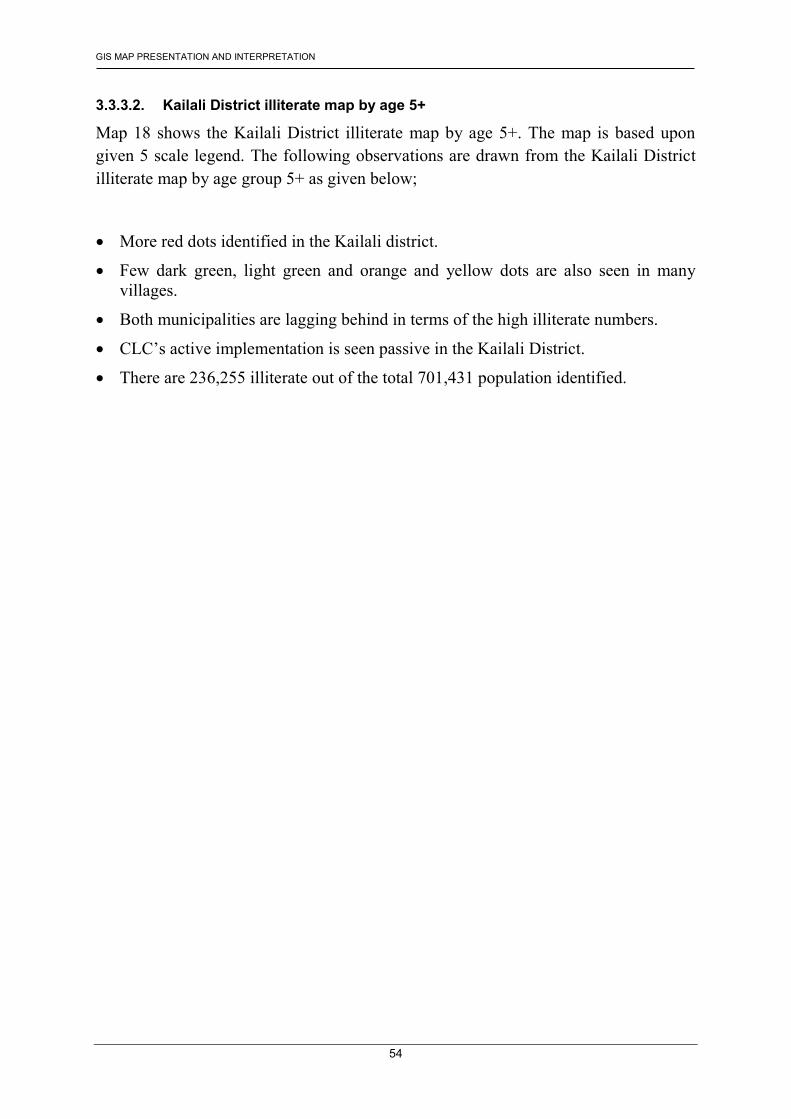
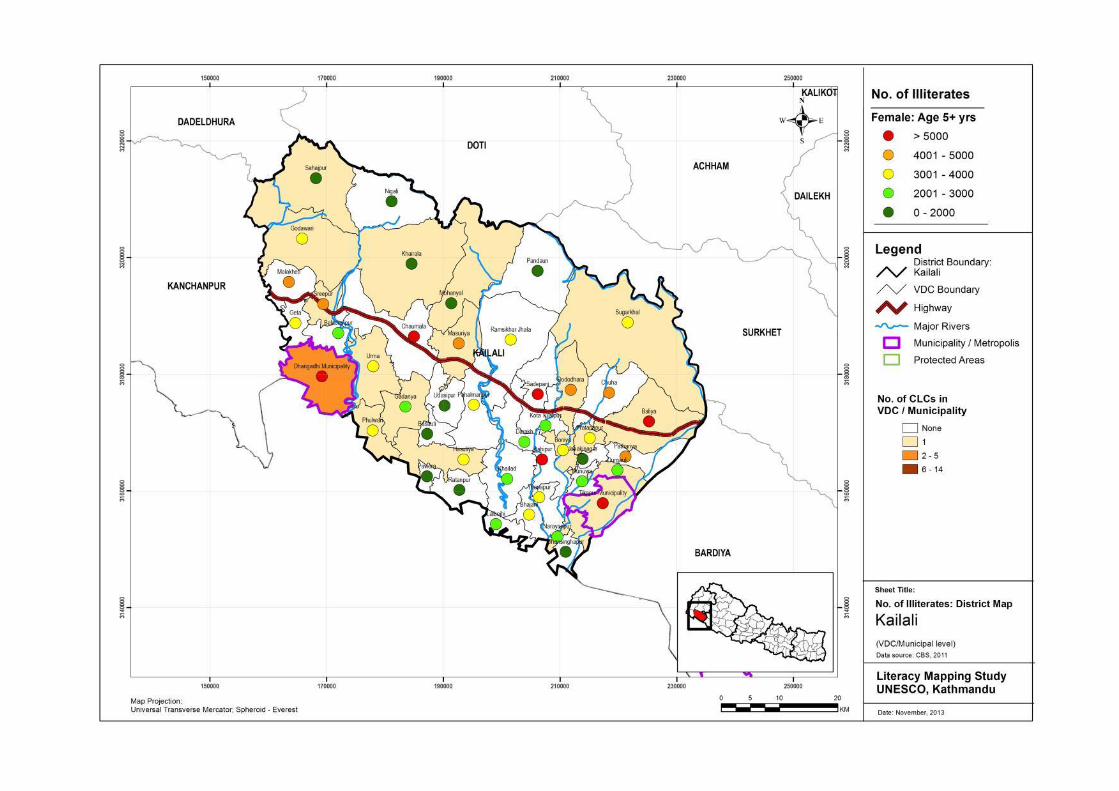
3.3.3.2. Kailali District illiterate map by age 5+
Map 18 shows the Kailali District illiterate map by age 5+. The map is based upon given 5 scale legend. The following observations are drawn from the Kailali District illiterate map by age group 5+ as given below;
� More red dots identified in the Kailali district.
� Few dark green, light green and orange and yellow dots are also seen in many villages.
� Both municipalities are lagging behind in terms of the high illiterate numbers.
� CLC’s active implementation is seen passive in the Kailali District.
� There are 236,255 illiterate out of the total 701,431 population identified.
GIS MAP PRESENTATION AND INTERPRETATION
55
�
GIS MAP PRESENTATION AND INTERPRETATION
56
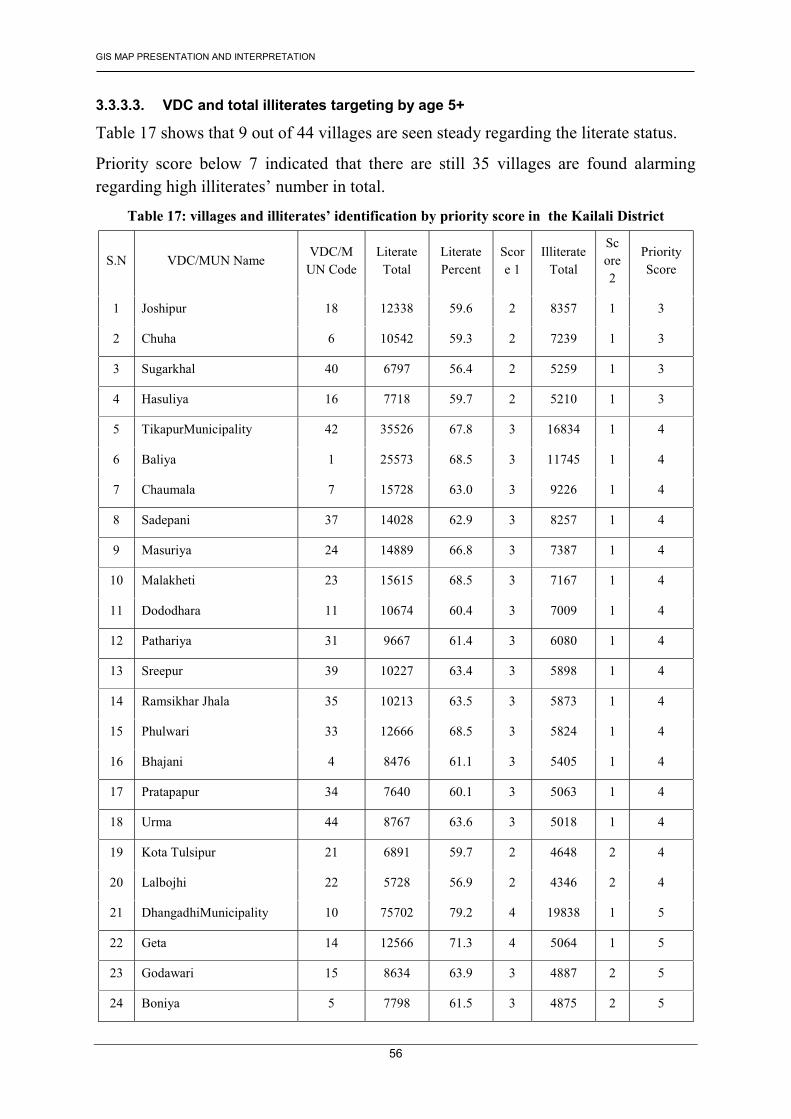
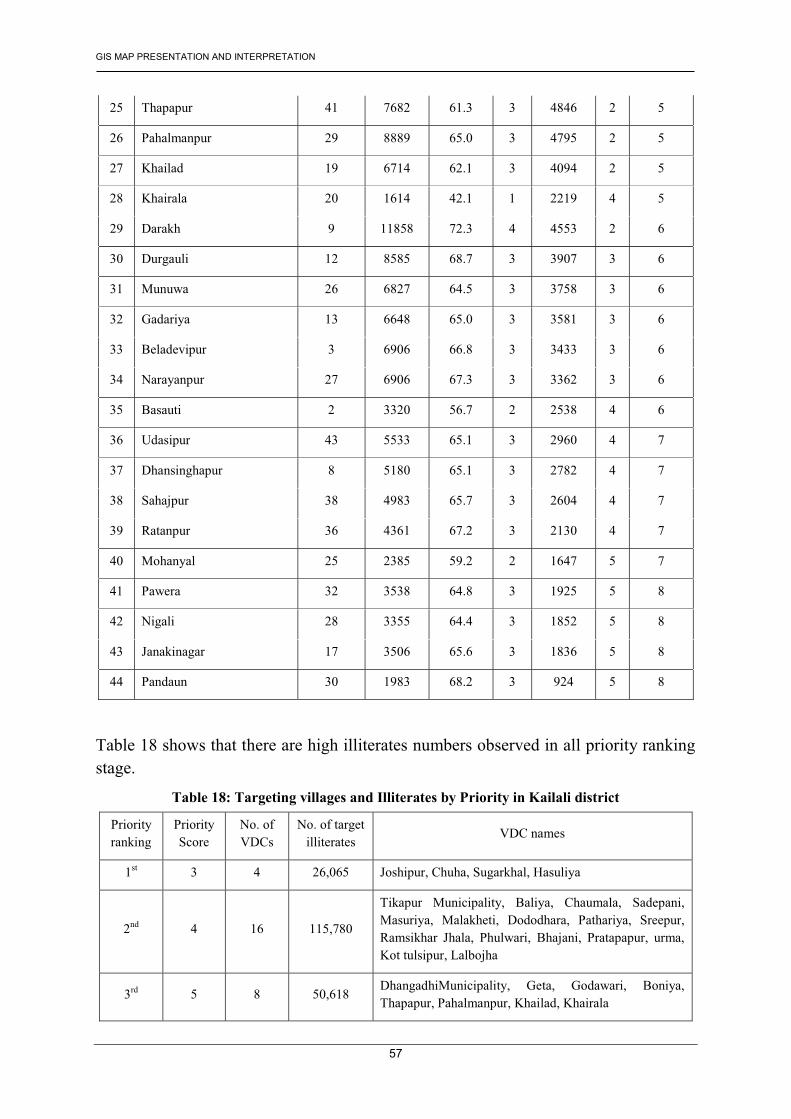
3.3.3.3. VDC and total illiterates targeting by age 5+
Table 17 shows that 9 out of 44 villages are seen steady regarding the literate status.
Priority score below 7 indicated that there are still 35 villages are found alarming regarding high illiterates’ number in total.
Table 17: villages and illiterates’ identification by priority score in the Kailali District
S.N VDC/MUN Name VDC/M
UN Code Literate Total
Literate Percent
Score 1
Illiterate Total
Score 2
Priority Score
1 Joshipur 18 12338 59.6 2 8357 1 3
2 Chuha 6 10542 59.3 2 7239 1 3
3 Sugarkhal 40 6797 56.4 2 5259 1 3
4 Hasuliya 16 7718 59.7 2 5210 1 3
5 TikapurMunicipality 42 35526 67.8 3 16834 1 4
6 Baliya 1 25573 68.5 3 11745 1 4
7 Chaumala 7 15728 63.0 3 9226 1 4
8 Sadepani 37 14028 62.9 3 8257 1 4
9 Masuriya 24 14889 66.8 3 7387 1 4
10 Malakheti 23 15615 68.5 3 7167 1 4
11 Dododhara 11 10674 60.4 3 7009 1 4
12 Pathariya 31 9667 61.4 3 6080 1 4
13 Sreepur 39 10227 63.4 3 5898 1 4
14 Ramsikhar Jhala 35 10213 63.5 3 5873 1 4
15 Phulwari 33 12666 68.5 3 5824 1 4
16 Bhajani 4 8476 61.1 3 5405 1 4
17 Pratapapur 34 7640 60.1 3 5063 1 4
18 Urma 44 8767 63.6 3 5018 1 4
19 Kota Tulsipur 21 6891 59.7 2 4648 2 4
20 Lalbojhi 22 5728 56.9 2 4346 2 4
21 DhangadhiMunicipality 10 75702 79.2 4 19838 1 5
22 Geta 14 12566 71.3 4 5064 1 5
23 Godawari 15 8634 63.9 3 4887 2 5
24 Boniya 5 7798 61.5 3 4875 2 5
GIS MAP PRESENTATION AND INTERPRETATION
57
25 Thapapur 41 7682 61.3 3 4846 2 5
26 Pahalmanpur 29 8889 65.0 3 4795 2 5
27 Khailad 19 6714 62.1 3 4094 2 5
28 Khairala 20 1614 42.1 1 2219 4 5
29 Darakh 9 11858 72.3 4 4553 2 6
30 Durgauli 12 8585 68.7 3 3907 3 6
31 Munuwa 26 6827 64.5 3 3758 3 6
32 Gadariya 13 6648 65.0 3 3581 3 6
33 Beladevipur 3 6906 66.8 3 3433 3 6
34 Narayanpur 27 6906 67.3 3 3362 3 6
35 Basauti 2 3320 56.7 2 2538 4 6
36 Udasipur 43 5533 65.1 3 2960 4 7
37 Dhansinghapur 8 5180 65.1 3 2782 4 7
38 Sahajpur 38 4983 65.7 3 2604 4 7
39 Ratanpur 36 4361 67.2 3 2130 4 7
40 Mohanyal 25 2385 59.2 2 1647 5 7
41 Pawera 32 3538 64.8 3 1925 5 8
42 Nigali 28 3355 64.4 3 1852 5 8
43 Janakinagar 17 3506 65.6 3 1836 5 8
44 Pandaun 30 1983 68.2 3 924 5 8
Table 18 shows that there are high illiterates numbers observed in all priority ranking stage.
Table 18: Targeting villages and Illiterates by Priority in Kailali district
Priority ranking
Priority Score
No. of VDCs
No. of target illiterates
VDC names
1st 3 4 26,065 Joshipur, Chuha, Sugarkhal, Hasuliya
2nd 4 16 115,780
Tikapur Municipality, Baliya, Chaumala, Sadepani, Masuriya, Malakheti, Dododhara, Pathariya, Sreepur, Ramsikhar Jhala, Phulwari, Bhajani, Pratapapur, urma, Kot tulsipur, Lalbojha
3rd 5 8 50,618 DhangadhiMunicipality, Geta, Godawari, Boniya, Thapapur, Pahalmanpur, Khailad, Khairala
GIS MAP PRESENTATION AND INTERPRETATION
58
4th 6 7 25,132 Darakh, Durgauli, Munuwa, Gadariya, Beladevipur, Narayanpur, Basauti
5th 7 5 12,123 Udasipur, Dhansinghapur, Sahajpur, Ratanpur, Mohanyal
6th 8 4 6,537 Pawera, Nigali, Janakinnagar, Pandaun
TOTAL 44 236,255
Priority ranking 2nd, 1st and 3rd has found excess number of illiterates remained in their respective 20 VDCs. These 20 VDCs belongs to priority ranking 2nd, 1st and 3rd should be first priority target for rapid reduction of illiterates numbers. The priority ranking 3rd and 4th should be given second priority target for the reduction of illiterates in their respective 15 VDCs. The priority ranking 5th and 6th should be given third priority for the reduction of illiterates’ number in their respective 11 VDCs.
GIS MAP PRESENTATION AND INTERPRETATION
59
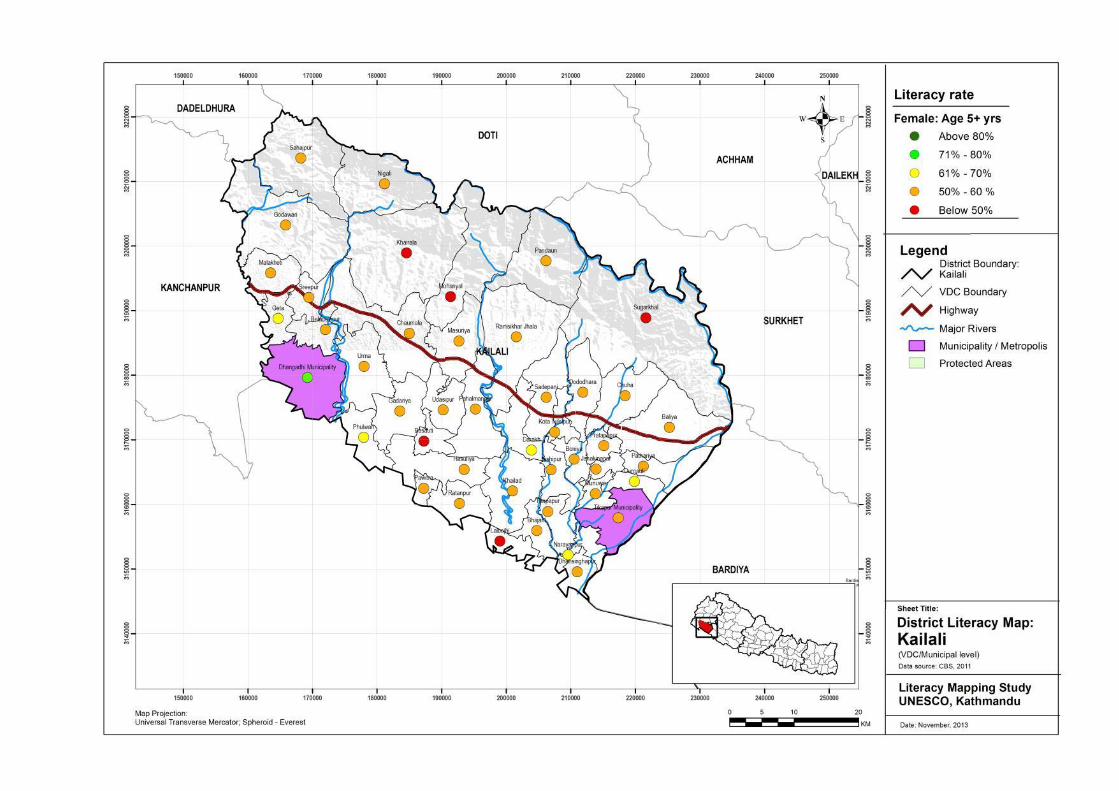
3.3.3.4. Kailali District female literacy map by age 5+
Map 19 shows the Kailali District female literacy map by age 5+. The map is based upon given 5 scale legend. The following observations are drawn from the Kailali District female literacy map by age group 5+ as given below;
� More orange dots are found in the Kailali District.
� Fewer red dots are also seen in the Kailali District.
� Only Dhangadhi municipality female literacy status is seen moderate where as Tikapur municipality is lagging behind.
� The female literacy rate in the Kailali District is found 57.1 percent (206,068 out of the total 361,229 population).
GIS MAP PRESENTATION AND INTERPRETATION
60
�
GIS MAP PRESENTATION AND INTERPRETATION
61
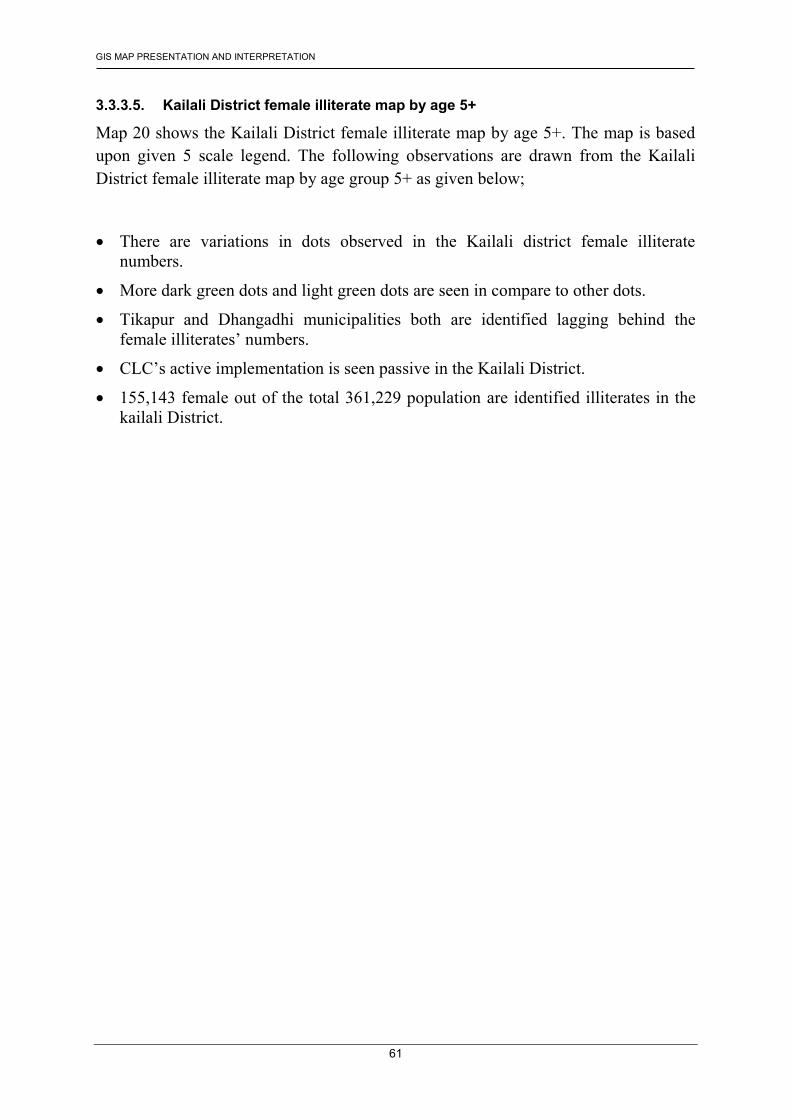
3.3.3.5. Kailali District female illiterate map by age 5+
Map 20 shows the Kailali District female illiterate map by age 5+. The map is based upon given 5 scale legend. The following observations are drawn from the Kailali District female illiterate map by age group 5+ as given below;
� There are variations in dots observed in the Kailali district female illiterate numbers.
� More dark green dots and light green dots are seen in compare to other dots.
� Tikapur and Dhangadhi municipalities both are identified lagging behind the female illiterates’ numbers.
� CLC’s active implementation is seen passive in the Kailali District.
� 155,143 female out of the total 361,229 population are identified illiterates in the kailali District.
GIS MAP PRESENTATION AND INTERPRETATION
62
�
GIS MAP PRESENTATION AND INTERPRETATION
63
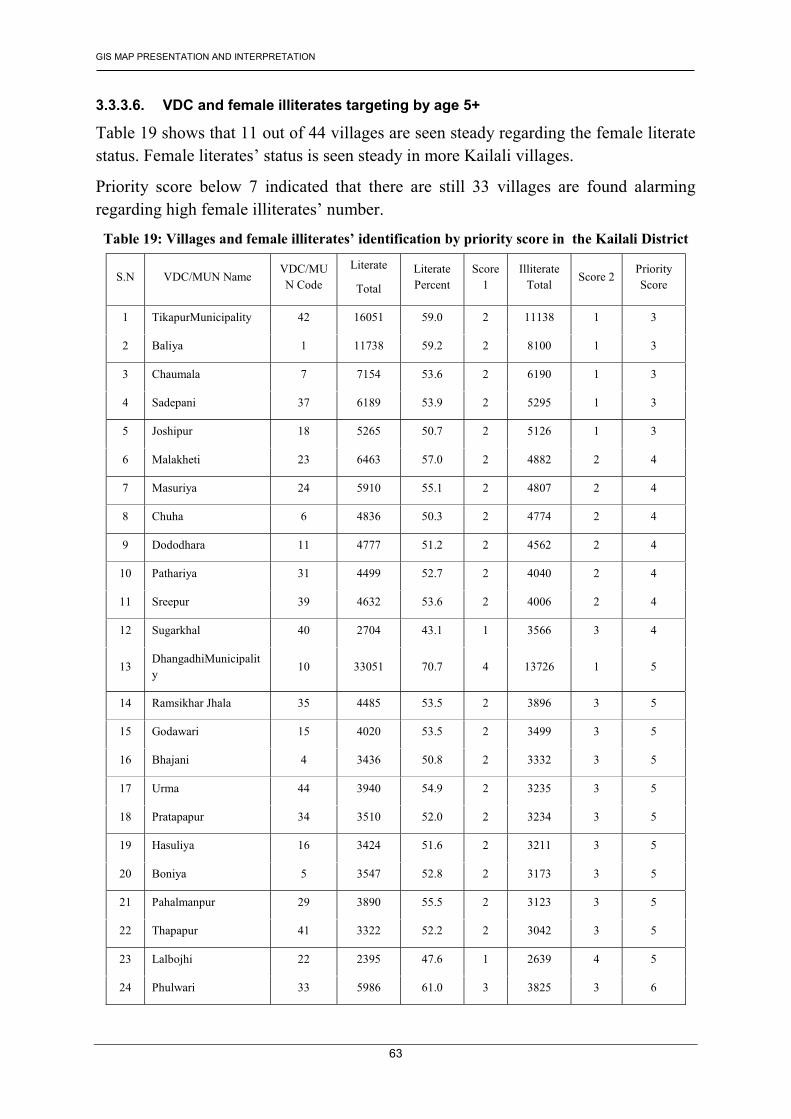
3.3.3.6. VDC and female illiterates targeting by age 5+
Table 19 shows that 11 out of 44 villages are seen steady regarding the female literate status. Female literates’ status is seen steady in more Kailali villages.
Priority score below 7 indicated that there are still 33 villages are found alarming regarding high female illiterates’ number.
Table 19: Villages and female illiterates’ identification by priority score in the Kailali District
S.N VDC/MUN Name VDC/MUN Code
Literate
Total
Literate Percent
Score 1
Illiterate Total
Score 2 Priority Score
1 TikapurMunicipality 42 16051 59.0 2 11138 1 3
2 Baliya 1 11738 59.2 2 8100 1 3
3 Chaumala 7 7154 53.6 2 6190 1 3
4 Sadepani 37 6189 53.9 2 5295 1 3
5 Joshipur 18 5265 50.7 2 5126 1 3
6 Malakheti 23 6463 57.0 2 4882 2 4
7 Masuriya 24 5910 55.1 2 4807 2 4
8 Chuha 6 4836 50.3 2 4774 2 4
9 Dododhara 11 4777 51.2 2 4562 2 4
10 Pathariya 31 4499 52.7 2 4040 2 4
11 Sreepur 39 4632 53.6 2 4006 2 4
12 Sugarkhal 40 2704 43.1 1 3566 3 4
13 DhangadhiMunicipality 10 33051 70.7 4 13726 1 5
14 Ramsikhar Jhala 35 4485 53.5 2 3896 3 5
15 Godawari 15 4020 53.5 2 3499 3 5
16 Bhajani 4 3436 50.8 2 3332 3 5
17 Urma 44 3940 54.9 2 3235 3 5
18 Pratapapur 34 3510 52.0 2 3234 3 5
19 Hasuliya 16 3424 51.6 2 3211 3 5
20 Boniya 5 3547 52.8 2 3173 3 5
21 Pahalmanpur 29 3890 55.5 2 3123 3 5
22 Thapapur 41 3322 52.2 2 3042 3 5
23 Lalbojhi 22 2395 47.6 1 2639 4 5
24 Phulwari 33 5986 61.0 3 3825 3 6
GIS MAP PRESENTATION AND INTERPRETATION
64
25 Geta 14 5745 63.3 3 3324 3 6
26 Kota Tulsipur 21 3009 50.2 2 2983 4 6
27 Khailad 19 3024 54.3 2 2549 4 6
28 Munuwa 26 3060 55.8 2 2420 4 6
29 Beladevipur 3 3159 57.6 2 2330 4 6
30 Gadariya 13 3010 57.8 2 2200 4 6
31 Basauti 2 1472 48.0 1 1597 5 6
32 Khairala 20 627 32.3 1 1317 5 6
33 Mohanyal 25 956 48.4 1 1018 5 6
34 Darakh 9 5249 63.9 3 2963 4 7
35 Durgauli 12 4133 61.4 3 2598 4 7
36 Narayanpur 27 3322 60.1 3 2208 4 7
37 Udasipur 43 2495 56.3 2 1937 5 7
38 Dhansinghapur 8 2373 56.0 2 1868 5 7
39 Sahajpur 38 2022 53.4 2 1766 5 7
40 Ratanpur 36 1842 57.1 2 1385 5 7
41 Nigali 28 1446 53.3 2 1269 5 7
42 Pawera 32 1583 55.6 2 1264 5 7
43 Janakinagar 17 1547 57.8 2 1130 5 7
44 Pandaun 30 788 56.9 2 596 5 7
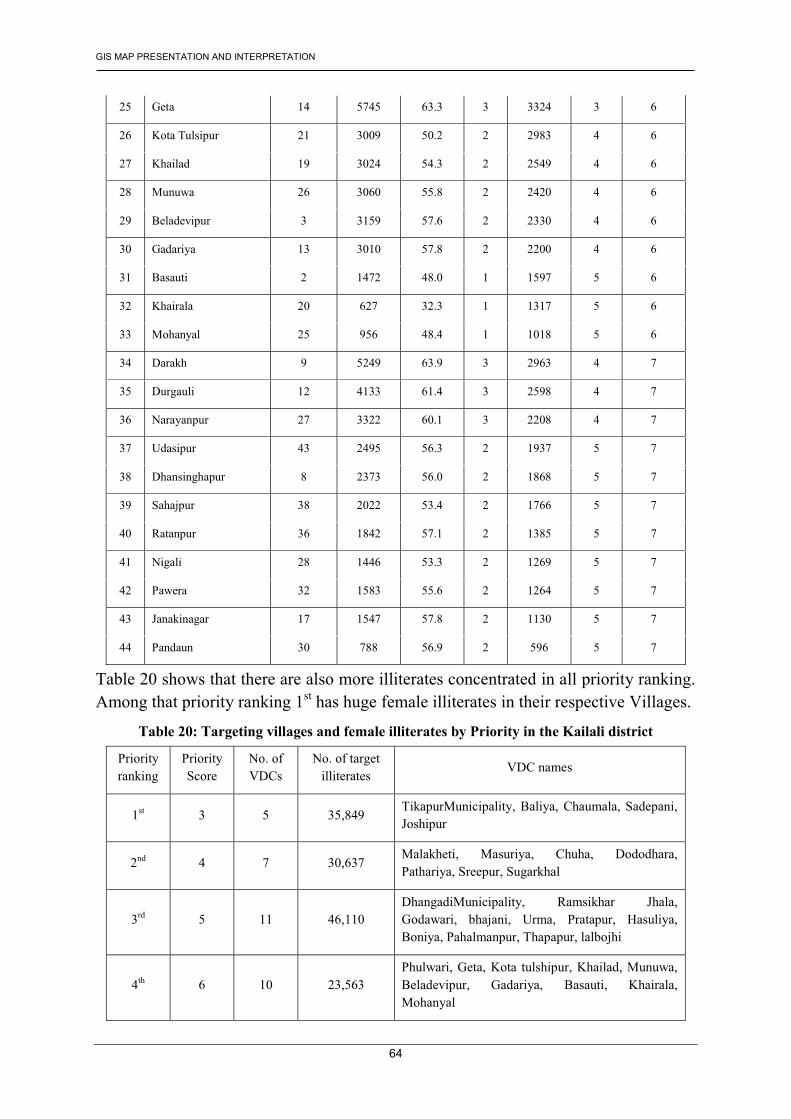
Table 20 shows that there are also more illiterates concentrated in all priority ranking. Among that priority ranking 1st has huge female illiterates in their respective Villages.
Table 20: Targeting villages and female illiterates by Priority in the Kailali district
Priority ranking
Priority Score
No. of VDCs
No. of target illiterates
VDC names
1st 3 5 35,849 TikapurMunicipality, Baliya, Chaumala, Sadepani, Joshipur
2nd 4 7 30,637 Malakheti, Masuriya, Chuha, Dododhara, Pathariya, Sreepur, Sugarkhal
3rd 5 11 46,110 DhangadiMunicipality, Ramsikhar Jhala, Godawari, bhajani, Urma, Pratapur, Hasuliya, Boniya, Pahalmanpur, Thapapur, lalbojhi
4th 6 10 23,563 Phulwari, Geta, Kota tulshipur, Khailad, Munuwa, Beladevipur, Gadariya, Basauti, Khairala, Mohanyal
GIS MAP PRESENTATION AND INTERPRETATION
65
5th 7 11 18,984 Darakh, Durgauli, Naranyanpur, Udasipur, Dhandinghapur, Sahajpur, Ratanpur, Nigali, Pawera, Janakinagar, Pandaun
Total 44 155,143
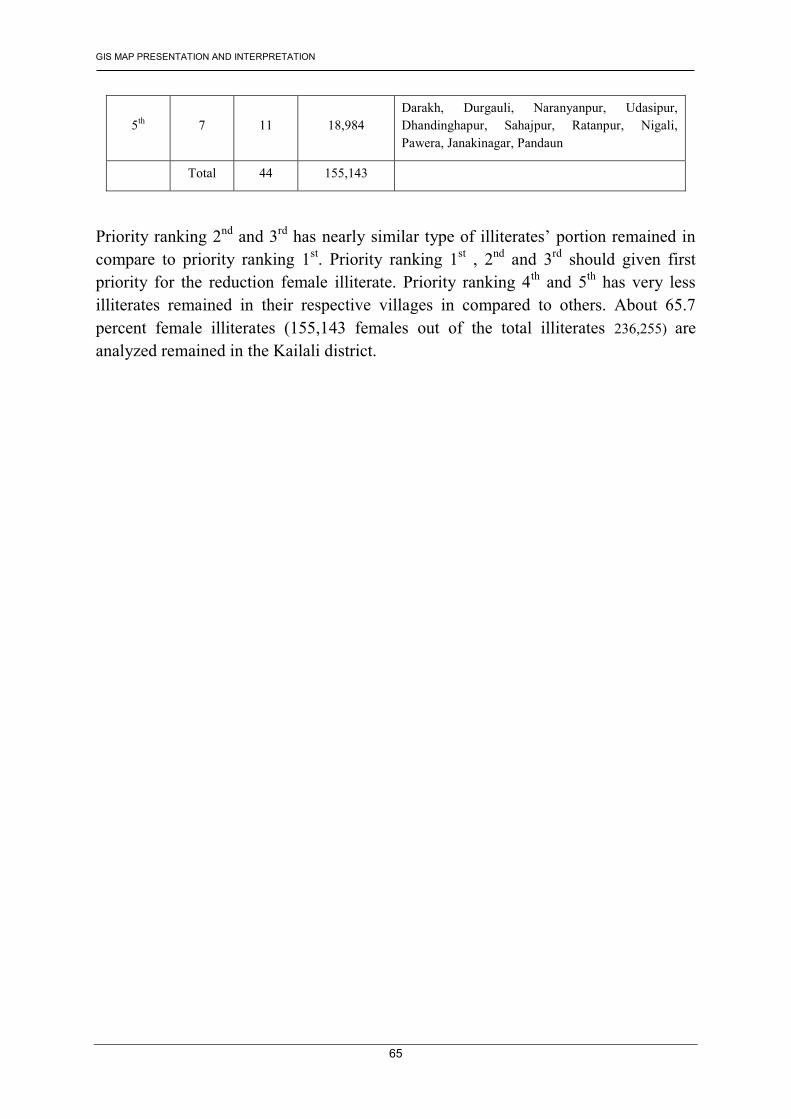
Priority ranking 2nd and 3rd has nearly similar type of illiterates’ portion remained in compare to priority ranking 1st. Priority ranking 1st , 2nd and 3rd should given first priority for the reduction female illiterate. Priority ranking 4th and 5th has very less illiterates remained in their respective villages in compared to others. About 65.7 percent female illiterates (155,143 females out of the total illiterates 236,255) are analyzed remained in the Kailali district.
MAJOR FINDINGS
66
4. Major Findings
The major findings of the literacy mapping study by national level , regional level and district level scenario are presented in sub headings given below;
4.1. Total: Age group 5 + 4.1.1. Total Literacy rate
� Literacy rate by age group 5+ is seen satisfactory in the municipalities and its periphery villages.
� Dark green and light green dot are identified sufficiently in the hilly region.
� Terai region is seen weaker in literacy rate status by age group 5+.
� Literacy rate status is seen steady in hilly region of the central development region.
� More red dots are found in terai region in the central development region.
� Dolkha district literacy rate status is analyzed steady as more yellow dots are seen in the Dolkha district literacy map.
� The literacy rate is defined 62.8 percent for the Dolkha district.
� 50.0 percent villages are seen very poor regarding the literacy status in the Rasuwa district.
� Rasuwa district literacy rate is defined as 53.6 percent.
� More yellow dots are found across the Kailali District villages.
� The literacy rate is found 66.3 in the Kailali District.
4.1.2. Total illiterate number
� Illiterates’ numbers are identified varied across the country.
� Maximum Numbers of illiterates are found in the terai region.
� More illiterates are also found in the far mid western development, mid western development and the central development region.
� Dark green and light green dots are significantly found in the Kathmandu valley, hilly region of western and the eastern development region.
� Southern part of the central development region has found more illiterate numbers in their respective districts.
� Dark green and lighter green dots are found in the central and the northern part of the central development region.
� CLC’s active implementation is seen steady in the hilly region.
� There are still illiterates remained in the Dolkha district.
MAJOR FINDINGS
67
� There are 37.2 percent (63,582 illiterate out of the total 170,820 population) illiterates identified in the Dolkha District.
� There are 53.5 percent( 10,689 out of the total 19,980 population) illiterates remained in the Rasuwa District
� There are more red dots identified in the Kailali district regarding the illiterates.
� CLC’s active implementation is seen passive in the Kailali District.
� 236,255 out of the total 701,431 population are identified illiterates in the kailali District.
4.1.3. Sum up
� 39 out of 52 villages in the Dolkha district are identified as more illiterates dominate villages.
� 13 out of 18 villages in the Rasuwa district are identified as more illiterates dominate villages.
� 35 out of 42 villages in the Kailali district are identified as more illiterates dominate villages.
4.2. Female:Age 5+ 4.2.1. Literacy rate
� Female literacy rate by age 5+ is not seen satisfactory in most part of the country.
� Most of the terai region specifically in the central and the eastern development region are identified far behind regarding the female literacy age 5+.
� Red dots are found densely in the southern part in the central development region where as it is also found scattered in many places in the central and the northern part of the central development region.
� Kathmandu valley is found more improving in the female literacy rate.
� Female literacy rate is found 55.2 percent (2,422,669 out of the total 4,389,789 population)in the central development region
� More red and orange dots are found in the Dolkha District.
� There are no dark green and light green dots are identified in the Dolkha district.
� Female literacy rate is found only 53.7 percent ( 49,249 out of the total 91,756 population ) in the Dolkha District
� More red dots are found in the Rasuwa district regarding the female literacy rate.
� Female literacy rate is found only 46.5 percent (9,291 out of the total 19,980 population) in the Rasuwa district.
MAJOR FINDINGS
68
� Female literacy rate in the Kailali District is found below on an average ratio.
� The female literacy rate in the Kailali District is found 57.1 percent (206,068 out of the total 361,229 population).
4.2.2. Female illiterates number
� Female illiterates’ numbers are analyzed high across the country.
� Females are lagging in the terai region, Hilly region of the far mid western development and the mid western development.
� Females are seen as prime actor for illiterates’ numbers remained in across the country.
� There are variations observed in illiterates’ number in the central development region. Maximum Lower units of female illiterates (below 1000) dots are found in the central part of central development region.
� More light green dots are found across the central development region.
� Illiterates’ numbers are found significantly high in the Kathmandu Valley due to the huge population exists in the valley.
� The existing CLC’s in the different villages and the municipality did not significantly effect in the gradual reduction of illiterates in the central development region.
� There are 1967,120 female illiterates out of the total 436, 9789 population remained in the central development region.
� Dark green dots, light green dots and yellow dots indicated that Female Illiterates are found below the average ratio in the Dolkha District.
� The existing CLC in the Dolkha villages did not influenced significantly on the reduction of the female illiterates’ number.
� There are 42,507 female illiterates out of the total 91756 population still remained in the Dolkha District.
� More dark green dots are found in Northern part of the Rasuwa District.
� Light green dots are found in central part of the Rasuwa District.
� Yellow dots are found in the southern part of the Rasuwa District.
� 10,689 out of the total 19,980 female population are still found illiterates in the Rasuwa District.
� More dark green dots and light green dots are seen in the Kailali District.
� CLC’s active implementation is seen passive in the kailali District.
� 155,143 female out of the total 361,229 population are identified illiterate in the Kailali District.
MAJOR FINDINGS
69
4.2.3. Sum up
� 46 out of the total 52 villages are found in critical situation due to high female illiterates’ number in the Dolkha District.
� 14 out of the total 18 villages are found in critical situation due to high female illiterates’ number in the Rasuwa District.
� 33 out of the total 14 villages are found critical due to female illiterates’ number in the Kailali District.
MAJOR IMPLICATIONS
70
5. Major Implications
The major implications of the literacy mapping study by national level , regional level and district level scenarios are presented in sub headings given below;
5.1. Total: Age group 5 + 5.1.1. Total Literacy rate
� National Literacy programme should be given more focused especially in the Terai region.
� Terai region should be first priority in the central development region for overall development of the literacy status.
� Dolkha District literacy rate should be maintained and need to improve upon the periodic plan.
� Rasuwa district literacy rate should be rapidly improved.
� Kailali District literacy rate should be maintained and need to improve upon the periodic plan.
5.1.2. Total illiterate number
� More priority should be given to the terai region, far mid western development, mid western development and the central development region for the reduction of illiterates.
� In central development region, Terai region (Bara, Parsa, Rautahat, Sarlahi,Mahottari Dhanusa District) should be given in high priority for the reduction of illiterate numbers.
� CLC’s should make more active in the Dolkha, Rasuwa and the kailali District with different strategies and progammes.
� The remained 63,582 illiterate should be identified by the Dolkha villages and periodic plan is required for gradual reduction of illiterates.
� The remained 10,689 illiterates should be identified by the Rasuwa villages and periodic plan is required for gradual reduction of illiterates.
� The remained 236,255 illiterates should be identified in the Kailali villages and periodic plan is required for rapid reduction of illiterates.
� The number of villages’ found critical due to remaining illiterates’ numbers should be identified and need planned strategy for the reduction of illiterates in the same villages are highly required.
MAJOR IMPLICATIONS
71
5.2. Female: Age 5+ 5.2.1. Female literacy rate
� National Female literacy rate should be increased by periodic plan.
� The female literacy rate status of the central development region should be improved.
� Dolkha District female literacy rate 53.7 percent should be improved by periodic plan.
� Female literacy rate should be rapidly improved in the Rasuwa District.
� The existing female literacy rate in the Kailali District should be maintained and improved by periodic plan.
5.2.2. Female illiterates number
� Female illiterates’ number by age group 5+ should be gradually reduced in the country.
� The high variation in female illiterates’ number should be minimized over the country.
� The remaining female illiterates in the central development region should be reduced by periodic plan.
� Dolkha District female illiterates’ numbers should be minimized by implementing various literacy programmes.
� Rasuwa District female illiterates’ number should be reduced by periodic plan.
� Kailai District illiterates’ number should be reduced gradually.
� CLC’s active implementation across the country is highly appreciated.
� The number of villages regarding the illiterate issues in all Dolkha, Rasuwa and Kailali District should be targeted and high priority is required for those villages for rapid reduction in current stage.
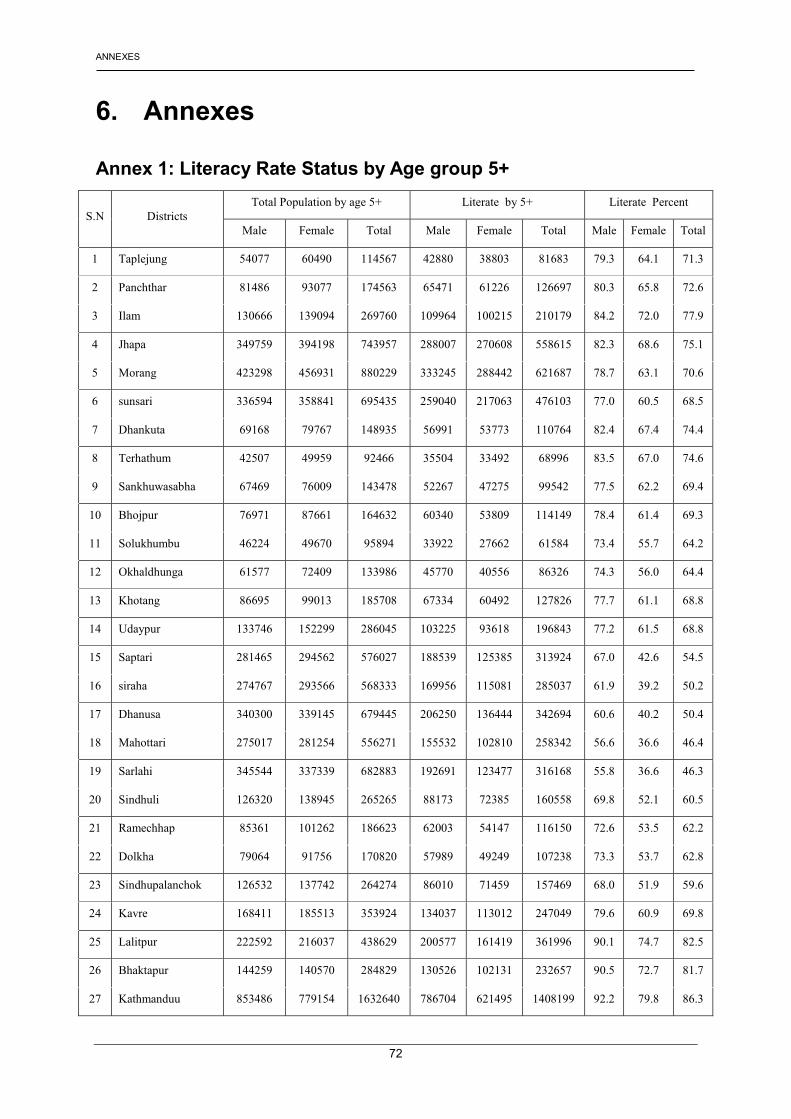
ANNEXES
72
6. Annexes
Annex 1: Literacy Rate Status by Age group 5+
S.N Districts Total Population by age 5+ Literate by 5+ Literate Percent
Male Female Total Male Female Total Male Female Total
1 Taplejung 54077 60490 114567 42880 38803 81683 79.3 64.1 71.3
2 Panchthar 81486 93077 174563 65471 61226 126697 80.3 65.8 72.6
3 Ilam 130666 139094 269760 109964 100215 210179 84.2 72.0 77.9
4 Jhapa 349759 394198 743957 288007 270608 558615 82.3 68.6 75.1
5 Morang 423298 456931 880229 333245 288442 621687 78.7 63.1 70.6
6 sunsari 336594 358841 695435 259040 217063 476103 77.0 60.5 68.5
7 Dhankuta 69168 79767 148935 56991 53773 110764 82.4 67.4 74.4
8 Terhathum 42507 49959 92466 35504 33492 68996 83.5 67.0 74.6
9 Sankhuwasabha 67469 76009 143478 52267 47275 99542 77.5 62.2 69.4
10 Bhojpur 76971 87661 164632 60340 53809 114149 78.4 61.4 69.3
11 Solukhumbu 46224 49670 95894 33922 27662 61584 73.4 55.7 64.2
12 Okhaldhunga 61577 72409 133986 45770 40556 86326 74.3 56.0 64.4
13 Khotang 86695 99013 185708 67334 60492 127826 77.7 61.1 68.8
14 Udaypur 133746 152299 286045 103225 93618 196843 77.2 61.5 68.8
15 Saptari 281465 294562 576027 188539 125385 313924 67.0 42.6 54.5
16 siraha 274767 293566 568333 169956 115081 285037 61.9 39.2 50.2
17 Dhanusa 340300 339145 679445 206250 136444 342694 60.6 40.2 50.4
18 Mahottari 275017 281254 556271 155532 102810 258342 56.6 36.6 46.4
19 Sarlahi 345544 337339 682883 192691 123477 316168 55.8 36.6 46.3
20 Sindhuli 126320 138945 265265 88173 72385 160558 69.8 52.1 60.5
21 Ramechhap 85361 101262 186623 62003 54147 116150 72.6 53.5 62.2
22 Dolkha 79064 91756 170820 57989 49249 107238 73.3 53.7 62.8
23 Sindhupalanchok 126532 137742 264274 86010 71459 157469 68.0 51.9 59.6
24 Kavre 168411 185513 353924 134037 113012 247049 79.6 60.9 69.8
25 Lalitpur 222592 216037 438629 200577 161419 361996 90.1 74.7 82.5
26 Bhaktapur 144259 140570 284829 130526 102131 232657 90.5 72.7 81.7
27 Kathmanduu 853486 779154 1632640 786704 621495 1408199 92.2 79.8 86.3
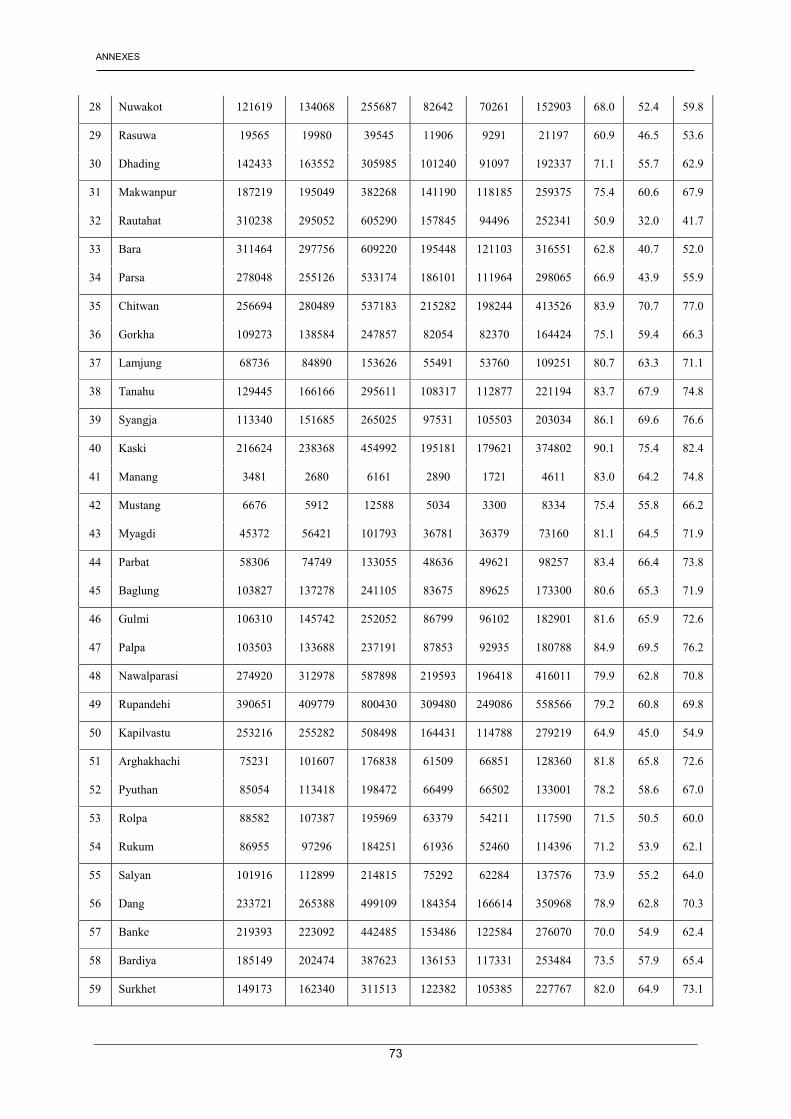
ANNEXES
73
28 Nuwakot 121619 134068 255687 82642 70261 152903 68.0 52.4 59.8
29 Rasuwa 19565 19980 39545 11906 9291 21197 60.9 46.5 53.6
30 Dhading 142433 163552 305985 101240 91097 192337 71.1 55.7 62.9
31 Makwanpur 187219 195049 382268 141190 118185 259375 75.4 60.6 67.9
32 Rautahat 310238 295052 605290 157845 94496 252341 50.9 32.0 41.7
33 Bara 311464 297756 609220 195448 121103 316551 62.8 40.7 52.0
34 Parsa 278048 255126 533174 186101 111964 298065 66.9 43.9 55.9
35 Chitwan 256694 280489 537183 215282 198244 413526 83.9 70.7 77.0
36 Gorkha 109273 138584 247857 82054 82370 164424 75.1 59.4 66.3
37 Lamjung 68736 84890 153626 55491 53760 109251 80.7 63.3 71.1
38 Tanahu 129445 166166 295611 108317 112877 221194 83.7 67.9 74.8
39 Syangja 113340 151685 265025 97531 105503 203034 86.1 69.6 76.6
40 Kaski 216624 238368 454992 195181 179621 374802 90.1 75.4 82.4
41 Manang 3481 2680 6161 2890 1721 4611 83.0 64.2 74.8
42 Mustang 6676 5912 12588 5034 3300 8334 75.4 55.8 66.2
43 Myagdi 45372 56421 101793 36781 36379 73160 81.1 64.5 71.9
44 Parbat 58306 74749 133055 48636 49621 98257 83.4 66.4 73.8
45 Baglung 103827 137278 241105 83675 89625 173300 80.6 65.3 71.9
46 Gulmi 106310 145742 252052 86799 96102 182901 81.6 65.9 72.6
47 Palpa 103503 133688 237191 87853 92935 180788 84.9 69.5 76.2
48 Nawalparasi 274920 312978 587898 219593 196418 416011 79.9 62.8 70.8
49 Rupandehi 390651 409779 800430 309480 249086 558566 79.2 60.8 69.8
50 Kapilvastu 253216 255282 508498 164431 114788 279219 64.9 45.0 54.9
51 Arghakhachi 75231 101607 176838 61509 66851 128360 81.8 65.8 72.6
52 Pyuthan 85054 113418 198472 66499 66502 133001 78.2 58.6 67.0
53 Rolpa 88582 107387 195969 63379 54211 117590 71.5 50.5 60.0
54 Rukum 86955 97296 184251 61936 52460 114396 71.2 53.9 62.1
55 Salyan 101916 112899 214815 75292 62284 137576 73.9 55.2 64.0
56 Dang 233721 265388 499109 184354 166614 350968 78.9 62.8 70.3
57 Banke 219393 223092 442485 153486 122584 276070 70.0 54.9 62.4
58 Bardiya 185149 202474 387623 136153 117331 253484 73.5 57.9 65.4
59 Surkhet 149173 162340 311513 122382 105385 227767 82.0 64.9 73.1
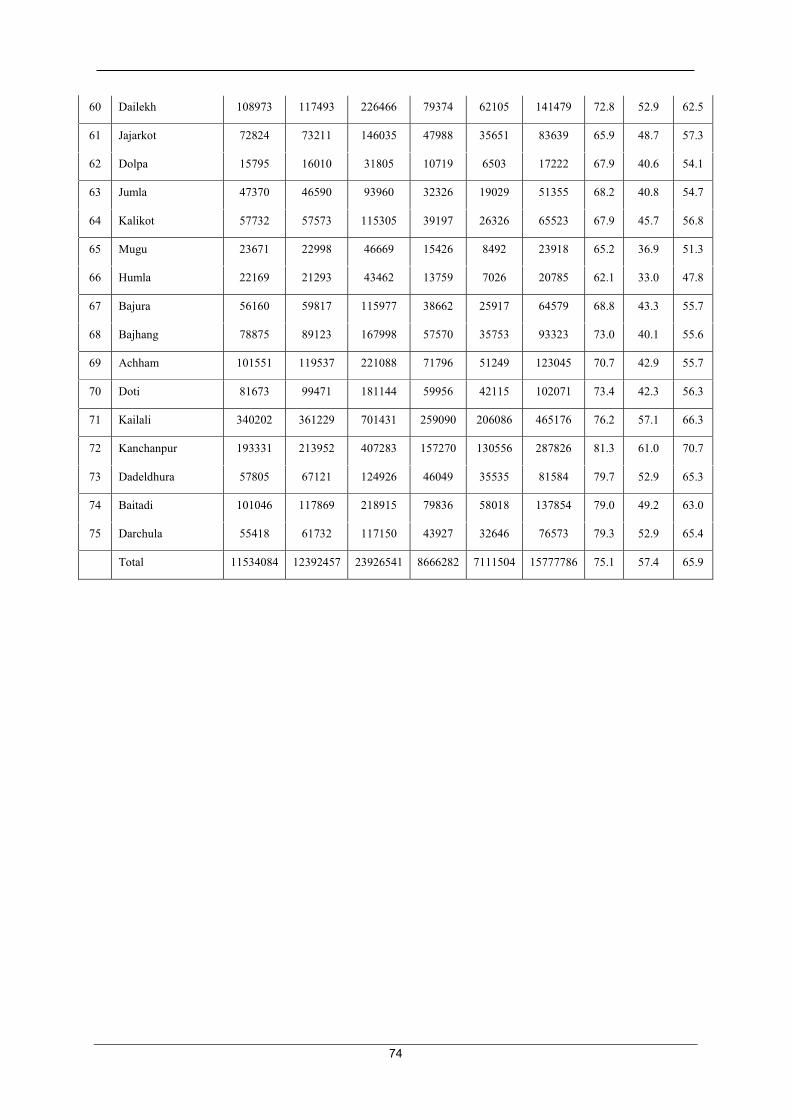
74
60 Dailekh 108973 117493 226466 79374 62105 141479 72.8 52.9 62.5
61 Jajarkot 72824 73211 146035 47988 35651 83639 65.9 48.7 57.3
62 Dolpa 15795 16010 31805 10719 6503 17222 67.9 40.6 54.1
63 Jumla 47370 46590 93960 32326 19029 51355 68.2 40.8 54.7
64 Kalikot 57732 57573 115305 39197 26326 65523 67.9 45.7 56.8
65 Mugu 23671 22998 46669 15426 8492 23918 65.2 36.9 51.3
66 Humla 22169 21293 43462 13759 7026 20785 62.1 33.0 47.8
67 Bajura 56160 59817 115977 38662 25917 64579 68.8 43.3 55.7
68 Bajhang 78875 89123 167998 57570 35753 93323 73.0 40.1 55.6
69 Achham 101551 119537 221088 71796 51249 123045 70.7 42.9 55.7
70 Doti 81673 99471 181144 59956 42115 102071 73.4 42.3 56.3
71 Kailali 340202 361229 701431 259090 206086 465176 76.2 57.1 66.3
72 Kanchanpur 193331 213952 407283 157270 130556 287826 81.3 61.0 70.7
73 Dadeldhura 57805 67121 124926 46049 35535 81584 79.7 52.9 65.3
74 Baitadi 101046 117869 218915 79836 58018 137854 79.0 49.2 63.0
75 Darchula 55418 61732 117150 43927 32646 76573 79.3 52.9 65.4
Total 11534084 12392457 23926541 8666282 7111504 15777786 75.1 57.4 65.9


![LITERACY FOR ALL g]kfndf ;a}sf nflu ;fIf/tf · LITERACY FOR ALL IN NEPAL 2015 Kathmandu Office United Nations Educational, Scientific and Cultural Organization Government of Nepal](https://img.pdfslide.us/doc/110x75/5ea239b8bb4787553045f7f0/literacy-for-all-gkfndf-asf-nflu-fiftf-literacy-for-all-in-nepal-2015-kathmandu.jpg)