Embed Size (px)
Citation preview
INSTITUTE FOR STATISTICS
UN
ES
CO
INS
TIT
UT
Efo
rS
TA
TIS
TIC
S
[ ]Executive Summary
Literacy Skills for the World of Tomorrow FURTHER RESULTS from PISA 2000
ORGANISATION for ECONOMIC CO-OPERATION and DEVELOPMENT
LITERACY SKILLS FOR THE WORLD OF TOMORROW –
FURTHER RESULTS FROM PISA 2000
EXECUTIVE SUMMARY
ORGANISATION FOR ECONOMIC CO-OPERATION AND DEVELOPMENT
UNESCO INSTITUTE FOR STATISTICS
2
Organisation for Economic Co-operation and DevelopmentPursuant to Article 1 of the Convention signed in Paris on December 14, 1960, and which came into force onSeptember 30, 1961, the Organisation for Economic Co-operation and Development (OECD) shall promote policiesdesigned to:
• achieve the highest sustainable economic growth and employment and a rising standard of living in Membercountries, while maintaining financial stability, and thus to contribute to the development of the world economy;
• contribute to sound economic expansion in Member as well as non-member countries in the process of economicdevelopment; and
• contribute to the expansion of world trade on a multilateral, non-discriminatory basis in accordance withinternational obligations.
The original Member countries of the OECD are Austria, Belgium, Canada, Denmark, France, Germany, Greece,Iceland, Ireland, Italy, Luxembourg, the Netherlands, Norway, Portugal, Spain, Sweden, Switzerland, Turkey, theUnited Kingdom and the United States.The following countries became Members subsequently through accession atthe dates indicated hereafter: Japan (April 28, 1964), Finland (January 28, 1969), Australia (June 7, 1971), NewZealand (May 29, 1973), Mexico (May 18, 1994), the Czech Republic (December 21, 1995), Hungary (May 7, 1996),Poland (November 22, 1996), Korea (December 12, 1996) and the Slovak Republic (December 14, 2000). TheCommission of the European Communities takes part in the work of the OECD (Article 13 of the OECDConvention).
UNESCOThe constitution of the United Nations Educational, Scientific and Cultural Organization (UNESCO) was adopted by20 countries at the London Conference in November 1945 and entered into effect on November 4, 1946. TheOrganization currently has 188 Member States.
The main objective of UNESCO is to contribute to peace and security in the world by promoting collaboration amongnations through education, science, culture and communication in order to foster universal respect for justice, the ruleof law, and the human rights and fundamental freedoms that are affirmed for the peoples of the world, withoutdistinction of race, sex, language or religion, by the Charter of the United Nations.
To fulfill its mandate, UNESCO performs five principal functions: 1) prospective studies on education, science, cultureand communication for tomorrow’s world; 2) the advancement, transfer and sharing of knowledge through research,training and teaching activities; 3) standard-setting actions for the preparation and adoption of internal instrumentsand statutory recommendations; 4) expertise through technical co-operation to Member States for their developmentpolicies and projects; and 5) the exchange of specialized information.
UNESCO is headquartered in Paris, France.
The UNESCO Institute for StatisticsThe UNESCO Institute for Statistics (UIS) is the statistical office of UNESCO and is the UN depository for globalstatistics in the fields of education, science and technology, culture and communication.
UIS was established in 1999. It was created to improve UNESCO’s statistical programme and to develop and deliverthe timely, accurate and policy-relevant statistics needed in today’s increasingly complex and rapidly changing social,political and economic environments.
UIS is based in Montréal, Canada.
Photo credit: PhotoDisc.
Copyright OECD/UNESCO-UIS 2003Permission to reproduce a portion of this work for non-commercial purposes or classroom use should be obtainedthrough the Centre français d’exploitation du droit de copie (CFC), 20, rue des Grands-Augustins, 75006 Paris, France,tel. (33-1) 44 07 47 70, fax (33-1) 46 34 67 19, for every country except the United States. In the United States,permission should be obtained through the Copyright Clearance Center, Customer Service, (508) 750-8400,222 Rosewood Drive, Danvers, MA 01923, USA, or CCC Online (www.copyright.com). All other applications forpermission to reproduce or translate all or part of this book should be made to OECD Publications, 2, rue André-Pascal, 75775 Paris Cedex 16, France or UNESCO Publishing, Editorial and Rights Division, 7, place de Fontenoy,75352 Paris 07 SP or 1, rue Miollis, 75732 Paris Cedex 15, France. Fax: (33-1) 45 68 57 39.Tel. (33-1) 45 68 49 92.Email: [email protected]
The designations employed and the presentation of material throughout this publication do not imply the expression of any opinionwhatsoever on the part of UNESCO and OECD concerning the legal status of any country, territory, city or area or of its authorities,or the delimitation of its frontiers or boundaries.
3
Literacy Skills for the World of Tomorrow –Further results from PISA 2000
Executive Summary
The Programme for International Student Assessment (PISA) is a collaborativeeffort among the participating countries to measure how well 15-year-olds,approaching the end of compulsory schooling, are prepared to meet thechallenges of today’s societies. PISA administers tests and backgroundquestionnaires to between 4,500 and 10,000 students in each participatingcountry to assess three forms of literacy: reading, mathematical and scientific.The assessments focus on how well students apply knowledge and skills to tasksthat are relevant to their future life, rather than on the memorisation of subjectmatter knowledge.
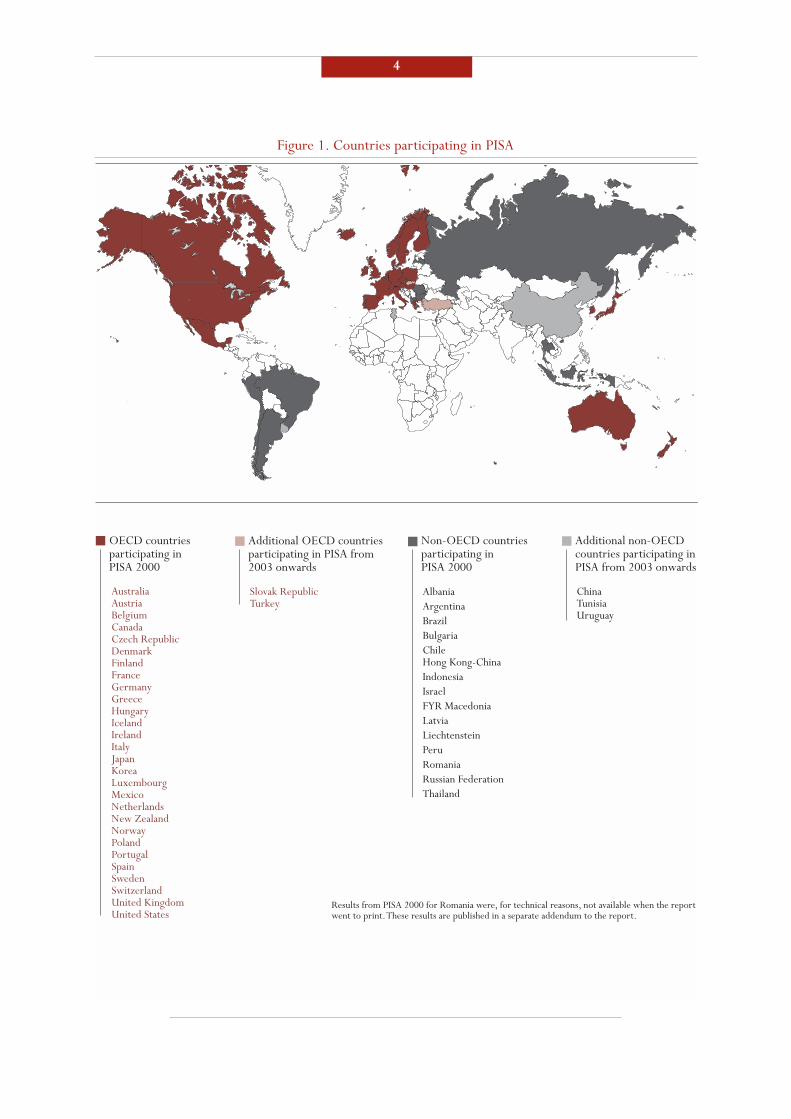
The assessment was first administered in 2000 in 32 countries, all but four ofthem members of the Organisation for Economic Co-operation andDevelopment (OECD) (See Figure 1). In response to considerable worldwideinterest in the study, the assessment was extended in 2001 to 11 additional non-OECD countries, bringing the total number of countries surveyed to 43. Theresults for the first 32 countries were reported in Knowledge and Skills for Lifepublished in 2001. Literacy Skills for the World of Tomorrow expands on this analysiswith particular reference to the results in the 15 non-OECD countries.
PISA provides important information on factors associated with students’literacy proficiency, including student engagement in the learning process,gender and family background, and offers insights into how characteristics ofschools, such as the organisation of learning and the availability andmanagement of resources, are associated with educational success.
As the programme is administered once every three years, it offers policy-makers a lens through which to monitor student outcomes over time and toassess the strengths and weaknesses of their own systems in the light of othercountries’ performance.Through PISA and related work, OECD and UNESCOseek to contribute to a shift in policy focus from educational inputs to learningoutcomes, in order to assist countries in seeking to bring about improvementsin schooling and better preparation for young people as they enter an adult lifeof rapid change and deepening global interdependence.
4
Figure 1. Countries participating in PISA
ChinaTunisiaUruguay
Additional non-OECD countries participating in PISA from 2003 onwards
AustraliaAustriaBelgiumCanadaCzech RepublicDenmarkFinlandFranceGermanyGreeceHungaryIcelandIrelandItalyJapanKoreaLuxembourgMexicoNetherlandsNew ZealandNorwayPolandPortugalSpainSwedenSwitzerlandUnited KingdomUnited States
OECD countries participating in PISA 2000
AlbaniaArgentinaBrazilBulgariaChileHong Kong-ChinaIndonesiaIsraelFYR MacedoniaLatviaLiechtensteinPeruRomaniaRussian FederationThailand
Non-OECD countries participating in PISA 2000
Slovak RepublicTurkey
Additional OECD countries participating in PISA from 2003 onwards
Results from PISA 2000 for Romania were, for technical reasons, not available when the report went to print. These results are published in a separate addendum to the report.
5
STUDENT PERFORMANCE IN READING LITERACY
Reading is an increasingly essential prerequisite for success in today’s societies.The interest, attitude and capacity of individuals to appropriately access,manage, integrate, evaluate and reflect on written information are all central tothe full participation of individuals in modern life.
PISA constructed a reading literacy scale that summarises student performanceacross various aspects of reading literacy, with 500 the average score for OECDcountries and two-thirds of students in these countries in the 400 to 600 range.To facilitate interpretation, the reading literacy scale was divided into five levelsof proficiency. Level 1 represents those students who have serious difficulties inusing reading as a tool to advance and extend their knowledge and skills in otherareas. Level 5 indicates those students who are able to manage information thatis presented in unfamiliar texts, show detailed understanding of complex textsand infer which information is relevant to the task, and critically evaluate andbuild hypotheses with the capacity to draw on specialised knowledge andconcepts that may be contrary to expectations.The difference in reading scoresbetween two adjacent proficiency levels is 72 points.
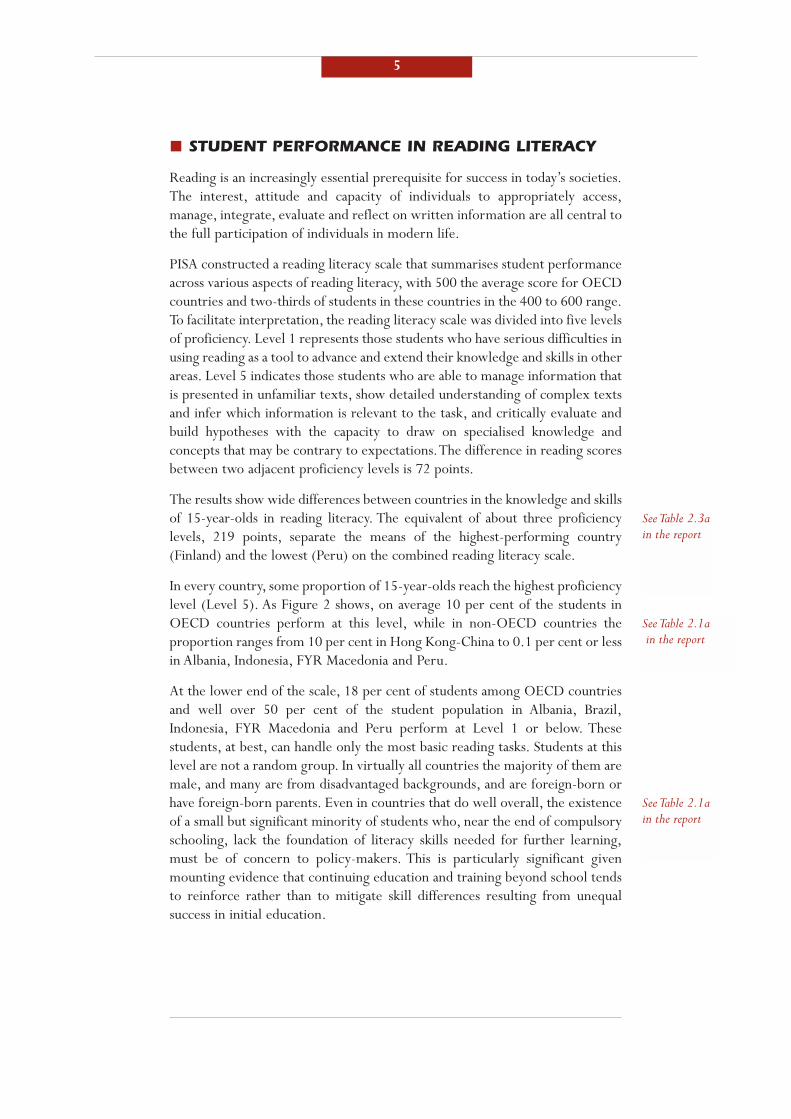
The results show wide differences between countries in the knowledge and skillsof 15-year-olds in reading literacy. The equivalent of about three proficiencylevels, 219 points, separate the means of the highest-performing country(Finland) and the lowest (Peru) on the combined reading literacy scale.
In every country, some proportion of 15-year-olds reach the highest proficiencylevel (Level 5). As Figure 2 shows, on average 10 per cent of the students inOECD countries perform at this level, while in non-OECD countries theproportion ranges from 10 per cent in Hong Kong-China to 0.1 per cent or lessin Albania, Indonesia, FYR Macedonia and Peru.
At the lower end of the scale, 18 per cent of students among OECD countriesand well over 50 per cent of the student population in Albania, Brazil,Indonesia, FYR Macedonia and Peru perform at Level 1 or below. Thesestudents, at best, can handle only the most basic reading tasks. Students at thislevel are not a random group. In virtually all countries the majority of them aremale, and many are from disadvantaged backgrounds, and are foreign-born orhave foreign-born parents. Even in countries that do well overall, the existenceof a small but significant minority of students who, near the end of compulsoryschooling, lack the foundation of literacy skills needed for further learning,must be of concern to policy-makers. This is particularly significant givenmounting evidence that continuing education and training beyond school tendsto reinforce rather than to mitigate skill differences resulting from unequalsuccess in initial education.
See Table 2.1ain the report
See Table 2.3ain the report
See Table 2.1ain the report
6
Figure 2 Percentage of students performing at each of the proficiency levels on the combined reading literacy scale
See Table 2.3ain the report
%100
100
80
80
60
60
40
40
20
20
0
Source: OECD PISA database, 2003. Table 2.1a.
Bulg
aria
Arg
entin
aT
haila
nd
Braz
il
Liec
hten
stei
n
New
Zea
land
Aus
tral
iaU
nite
d K
ingd
om
Hon
g K
ong-
Chi
na
Hun
gary
Can
ada
Irel
and
Ger
man
y
Mex
ico
Aus
tria
Pola
nd
Switz
erla
nd
Gre
ece
Swed
en
Port
ugal
Italy
Fran
ce
Den
mar
k
Icel
and
Kor
ea
Nor
way
Belg
ium
Finl
and
Japa
n
Cze
ch R
epub
lic
Chi
le
Latv
ia
Peru
Uni
ted
Stat
es
Spai
n
Luxe
mbo
urg
Isra
el
Indo
nesia
Alb
ania
FYR
Mac
edon
ia
Below Level 1 At Level 1 At Level 2 At Level 3 At Level 4 At Level 5 Percentage of students
Rus
sian
Fede
ratio
n
18
32
3131
2829
2726 25 24
2626 25 24 24 24
21 2122 21 20
31332829273128313030 2626 272530333339
29 28 31 27 30 28 28 27 27 25 25 22 20 21 19 17 13 11 8 6 515
25
28
28303037
27
27
22
2724
2121
2626 2525242323 2226252621212222171717 181818 222020201919142629
2828 33
24 21
27
38
26
2429
19 19 19 19 18 17 17 13 14 15 119 9 5
53 2 1 10
0 0 0 0
6
610 10 14
19 18 16 11 12 9 9 11 128 8 9 4 7 5 5 6 5 5 4
4 42
2 21 1 1
1
3
9
17
2231
5 5 73 3 5 3 4
4 4 446 6 6 5 10
10
10 16
13 1514 18
18181817161615151313
141111111111
10121212
23
2023 35
31
5444
8 9 99
77
63 8
7 8 9 9 9 97
Differences between countries represent, however, only a fraction of overallvariation in student performance. Addressing the diversity of student learningneeds and narrowing the gaps in student performance represent formidablechallenges for all countries. For example, the difference between the scores ofstudents at the 75th and 25th percentiles of the performance distribution – astatistic that is often used as a measure of equality in learning outcomes –ranges from less than 111 score points in the five Asian countries – Hong Kong-China, Indonesia, Japan, Korea and Thailand – to more than 150 points inArgentina and Israel. Disparities are apparent even within countries withsimilar levels of average performance. Indonesia and FYR Macedonia, forexample, have similar mean scores on the combined reading literacy scale (371and 373 respectively), but the range for the middle half of the studentpopulation in FYR Macedonia is 135 points, or 34 points higher than that ofIndonesia.
7
To what extent is the variation in student performance on the PISA assessmentsa reflection of the distribution of students’ innate abilities, and thus, a challengefor education systems that cannot be influenced directly by education policy?PISA shows that wide disparities in performance are not a necessary conditionfor a country to attain a high level of overall performance. Four out of the sevencountries with the smallest differences between the 75th and 25th percentiles– Finland, Hong Kong-China, Japan and Korea – are also among the best-performing countries in reading literacy as measured by their mean score.Conversely, two countries with wide performance gaps – Argentina and Israel– have mean scores that are significantly below the OECD average.
Many factors contribute to variation in student performance. As the causes ofvariation in student performance vary, countries adopt different approaches toaddress the challenge. Some countries have school systems that seek to provideall students with the same opportunities for learning and require each schoolto accommodate to the full range of student learning needs. Other countriesrespond to diversity by grouping students of similar levels of performance intothe same classes or schools.
How do such policies and practices affect actual student performance? There isno clear answer since differentiation is often applied informally within schools,which makes cross-national comparisons difficult. Nevertheless PISA revealsthat in most countries, a considerable proportion of the variation in studentperformance lies between schools. Differences between schools exceed onethird of the overall variation in student performance in a typical OECDcountry. Independent of whether overall variation is large or small, between-school variation amounts to more than half of total variation in 13 countriesand 67 per cent or more in Austria, Belgium, Germany, Hungary and Poland.Non-OECD countries do not belong to the five most extreme cases.Nevertheless, in all of the non-OECD countries except Indonesia, Latvia, theRussian Federation and Thailand, performance differences between schools arelarger than the OECD average level where between-school variance represents36 per cent of total variance.
PISA results suggest that both overall variation in student performance, and therelative proportion of that variation that is found between schools, tend to begreater in those countries with explicit differentiation at an early age betweentypes of programme and school.The data also suggest that the effects of socialclustering are larger in school systems with differentiated types of school thanin systems in which the curriculum does not vary significantly betweenschools.
See Table 2.3a inthe report
See Table 7.1a inthe report
8
STUDENT PERFORMANCE IN MATHEMATICAL ANDSCIENTIFIC LITERACY
For much of the last century, the content of school mathematics and sciencecurricula has been dominated by the need to provide the foundation for theprofessional training of a small number of mathematicians, scientists andengineers.Today, however, literacy in mathematics and science is important forall to understand medical, economic, environmental and other issues that shapemodern societies, which rely heavily on technological and scientific advances.PISA looked at mathematics in relation to its use in people’s lives and assessedthe capacity of students to recognise and interpret mathematical problems;translate these problems into a mathematical context; use mathematicalknowledge and procedures to solve problems; interpret the results in terms ofthe original problem; reflect on the methods applied; and formulate andcommunicate the outcomes.
As with reading literacy, PISA found wide variation between countries inoverall performance in mathematics across these different aspects. Students inHong Kong-China, Japan and Korea displayed the highest mean scores inmathematical literacy. The lowest average score came from Peru. Other thanHong Kong-China, only one non-OECD country, Liechtenstein, registered amean score above the OECD average.
Differences in mathematical performance within countries are alsopronounced, but, as in the case of reading, some countries succeed in reachinghigh levels of student performance without large disparities. It is striking thatfive out of the seven countries with the smallest differences between the 75thand 25th percentiles – Canada, Finland, Iceland, Japan and Korea – all performstatistically significantly above the OECD average. Likewise, the five countrieswith the most unequal distribution of mathematical literacy skills – Albania,Argentina, Bulgaria, Greece and Israel – all perform significantly below thislevel.
Scientific literacy in PISA was scored on a scale measuring students’ capacityto: use scientific knowledge; recognise scientific questions; identify what isinvolved in scientific investigations; relate scientific data to claims andconclusions; and to communicate these aspects of science.
As with mathematical literacy, Hong Kong-China, Japan and Korea show thehighest overall performance in scientific literacy. The range of average scoresbetween the highest and the lowest performing countries in scientific literacyis also very large, with very high performing countries scoring around 0.5standard deviations above the OECD average and the five lowest performingcountries – all non-OECD – performing between 1.0 and 1.7 standarddeviations below this level.The distribution of scientific literacy scores withincountries is similar to the patterns found in mathematics.
See Table 3.1in the report
See Table 3.1in the report
See Table 3.2in the report
9
THE ECONOMIC CONTEXT AND EDUCATION SYSTEMS
When comparing the results from PISA across countries, it is important toconsider the context in which education systems operate. The 15 non-OECDcountries participating in PISA share demographic, educational and economicfeatures that distinguish them from the OECD countries.
For example, sizeable proportions of children do not make it to secondaryschool in some of the non-OECD countries, with enrolment rates in secondaryschools ranging from close to the OECD average of 89 per cent in Israel andBulgaria to 48 per cent in Indonesia. High repetition rates are also a frequentproblem. Finally, enrolment rates in tertiary education vary widely across non-OECD countries, from 15 per cent in Albania and Brazil to 65 per cent in theRussian Federation.
The non-OECD countries also vary widely in their financial capacity to providequality education services. The wealthiest of them, have per capita incomesmore than four times greater than the poorest ones, and there are non-OECDcountries where the distribution of income is both more equal and less equalthan the OECD average.The share of national wealth spent on education alsovaries across countries.
Countries with higher national income or gross domestic product (GDP) tendto perform better than countries with lower national income on a scale thatcombines results in reading, mathematical and scientific literacy. Withoutnecessarily constituting a causal relationship, 43 per cent of the variationbetween countries’ mean scores can be predicted on the basis of their GDP percapita. Beyond the relationships between average performance and averageGDP per capita, PISA also suggests that higher levels of income inequality tendto be associated with lower levels of average performance. The relationship isfairly consistent, with a measure of income inequality (Gini index) explaining26 per cent of the variation in average performance among the participatingcountries.
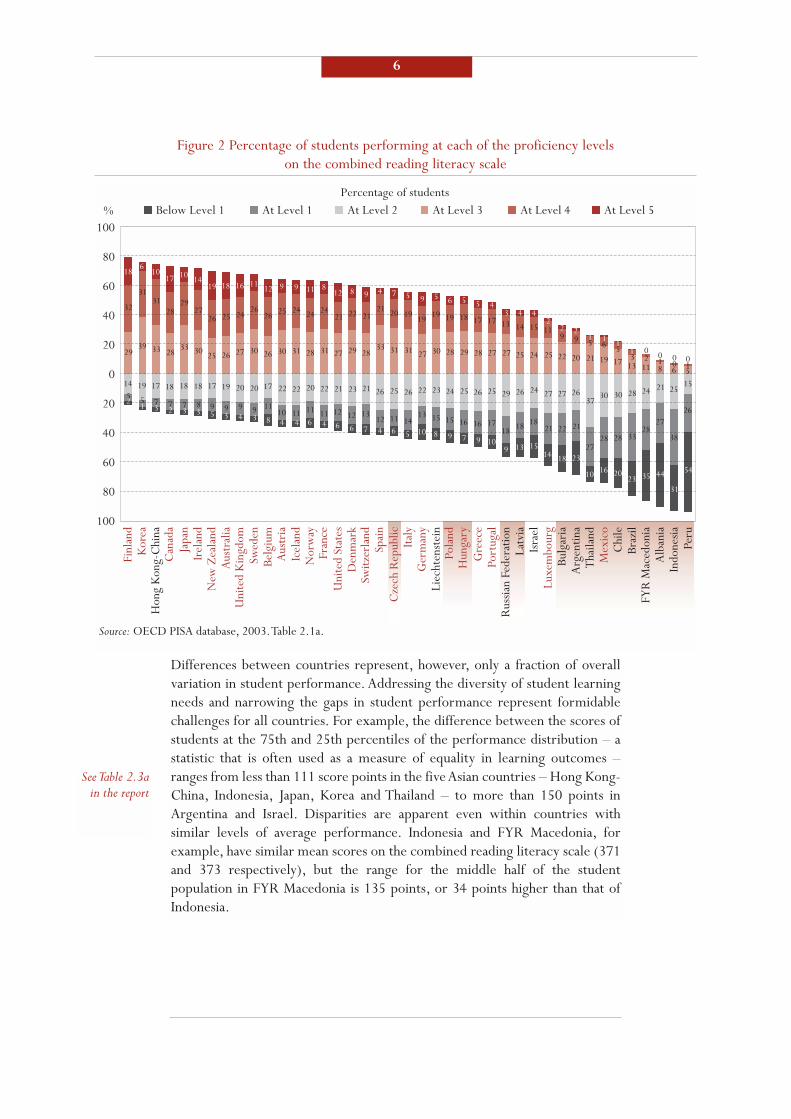
While GDP provides a measure of a country’s ability to pay for education, itdoes not directly measure the financial resources actually invested ineducation. PISA therefore also compared the average amount of money thatcountries spend per student from the beginning of primary education up to theage of 15 with average student performance across the three assessmentdomains. Figure 3 shows a positive relationship between spending per studentand mean country performance averaged across the three assessment domains.As expenditure per student on educational institutions increases, so also doesa country’s mean performance, with expenditure per student explaining 54 percent of the variation between countries in mean performance.
See Table 1.3in the report
See Tables 1.4and 3.3 in thereport
See Table 3.3in the report
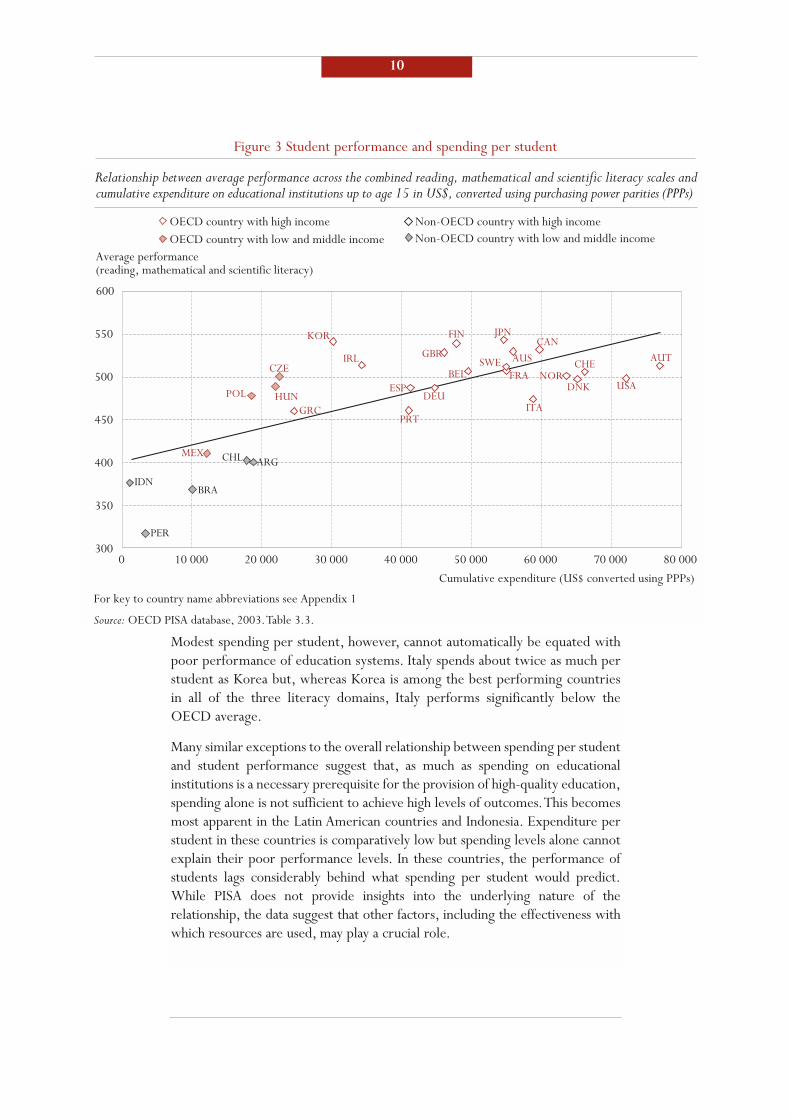
Modest spending per student, however, cannot automatically be equated withpoor performance of education systems. Italy spends about twice as much perstudent as Korea but, whereas Korea is among the best performing countriesin all of the three literacy domains, Italy performs significantly below theOECD average.
Many similar exceptions to the overall relationship between spending per studentand student performance suggest that, as much as spending on educationalinstitutions is a necessary prerequisite for the provision of high-quality education,spending alone is not sufficient to achieve high levels of outcomes.This becomesmost apparent in the Latin American countries and Indonesia. Expenditure perstudent in these countries is comparatively low but spending levels alone cannotexplain their poor performance levels. In these countries, the performance ofstudents lags considerably behind what spending per student would predict.While PISA does not provide insights into the underlying nature of therelationship, the data suggest that other factors, including the effectiveness withwhich resources are used, may play a crucial role.
10
Figure 3 Student performance and spending per student
Cumulative expenditure (US$ converted using PPPs)
300
350
400
450
500
550
600
0 10 000 20 000 30 000 60 000 80 00070 00040 000 50 000
Relationship between average performance across the combined reading, mathematical and scientific literacy scales and cumulative expenditure on educational institutions up to age 15 in US$, converted using purchasing power parities (PPPs)
AUS AUTBEL
CAN
CZE
DNK
FIN
FRA
DEUGRC
HUN
IRL
ITA
JPNKOR
MEX
NOR
POL
PRT
ESP
SWE CHEGBR
USA
ARG
BRA
CHL
IDN
PER
For key to country name abbreviations see Appendix 1
Source: OECD PISA database, 2003. Table 3.3.
Average performance(reading, mathematical and scientific literacy)
OECD country with high income OECD country with low and middle income
Non-OECD country with high income Non-OECD country with low and middle income
11
THE IMPACT OF GENDER
Recognising the impact that education has on participation in the labourmarket, occupational mobility and the quality of life, all countries emphasisethe importance of reducing educational disparities between males and females.Significant progress has been achieved in reducing the gender gap in educationalattainment. Younger women today are far more likely to have completed atertiary qualification than women 30 years ago. In 13 of the 30 OECD countrieswith comparable data, more than twice as many women aged 25 to 34 havecompleted tertiary education as women aged 55 to 64 years. Furthermore,university-level graduation rates for women now equal or exceed those for menin 17 of the 30 OECD countries and in all but one of the non-OECD countriesfor which comparable data are available.
Nevertheless, in certain fields of study, gender differences in tertiaryqualifications remain persistently high. International studies have indicated thatrelatively small gender differences in favour of males in mathematics andscience performance in the early years of schooling become more pronouncedand pervasive at higher grade levels in many countries.
To shed light on these issues, PISA analysed gender differences in three areas:
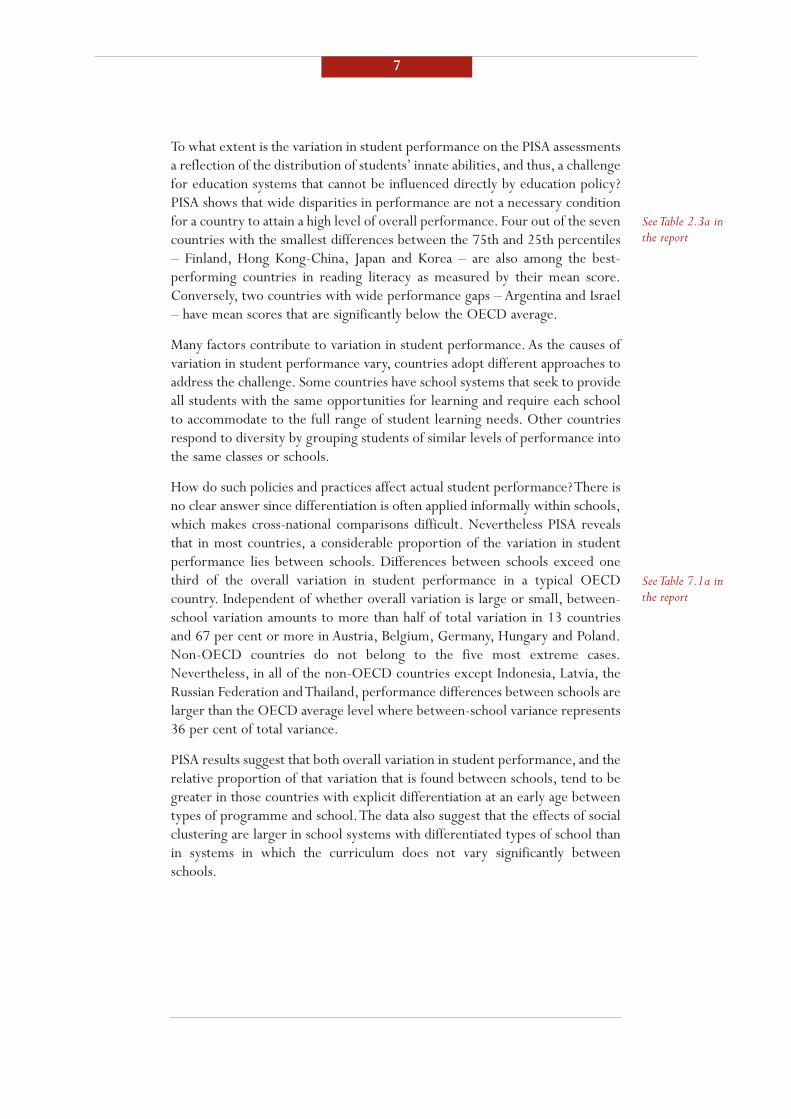
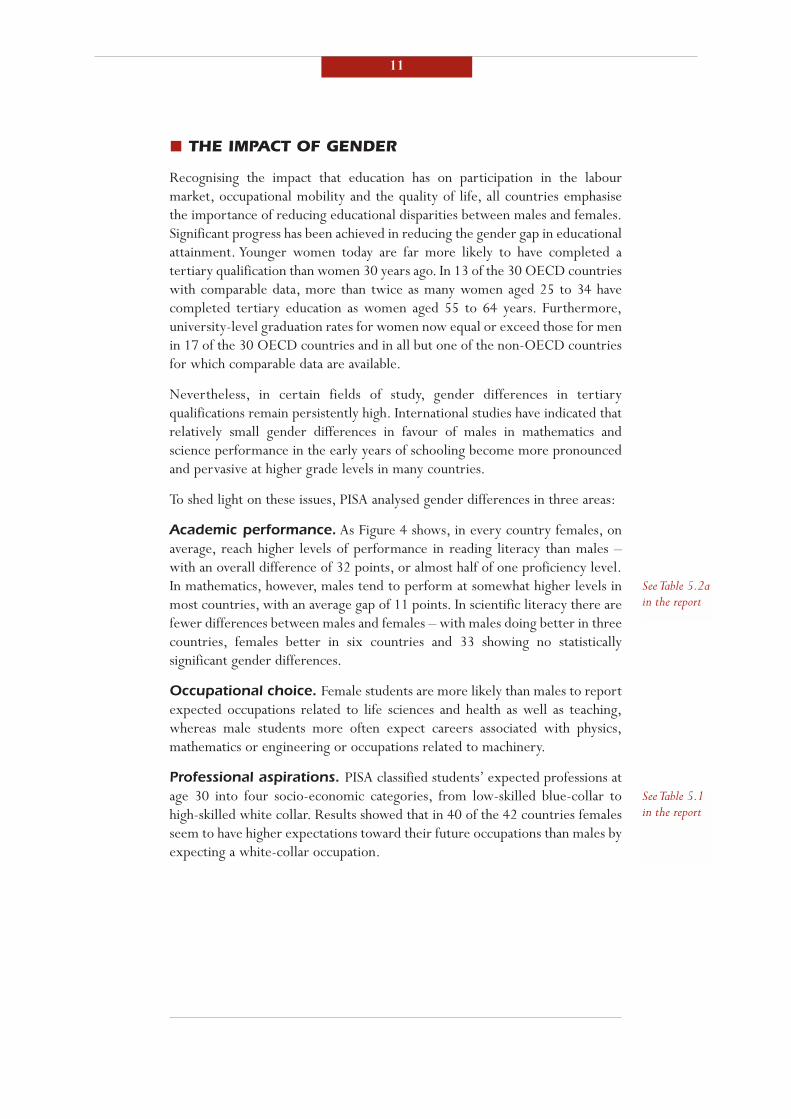
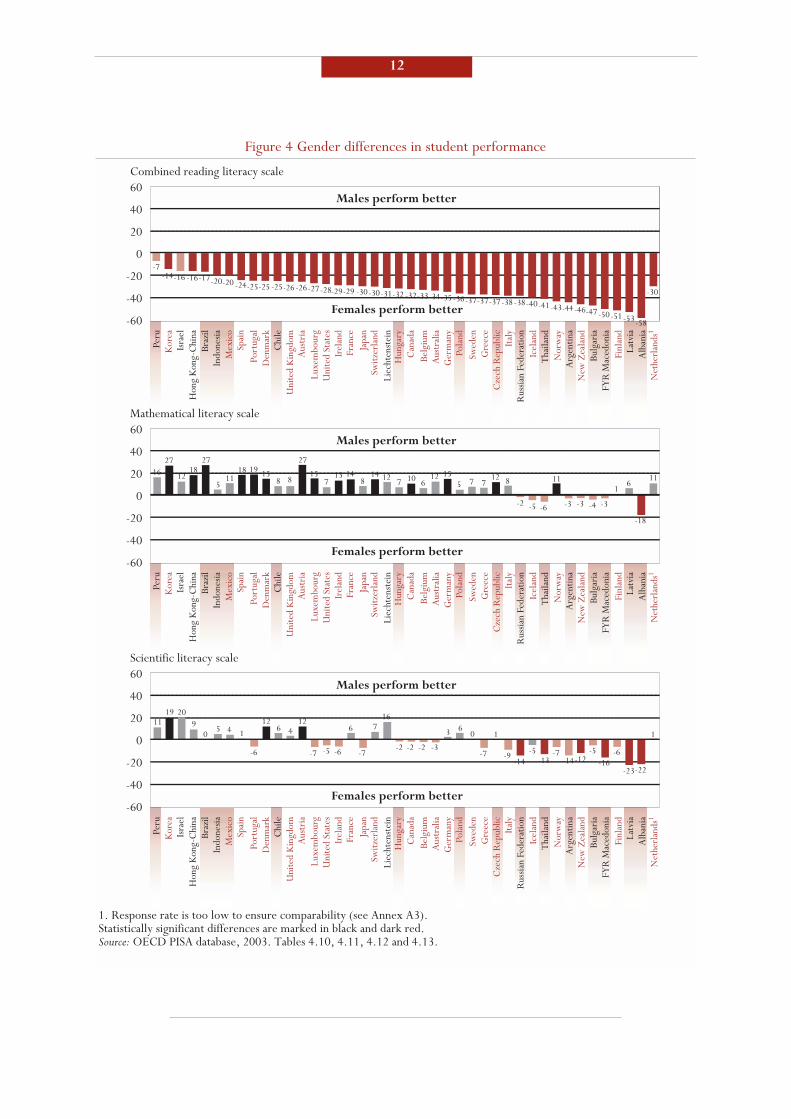
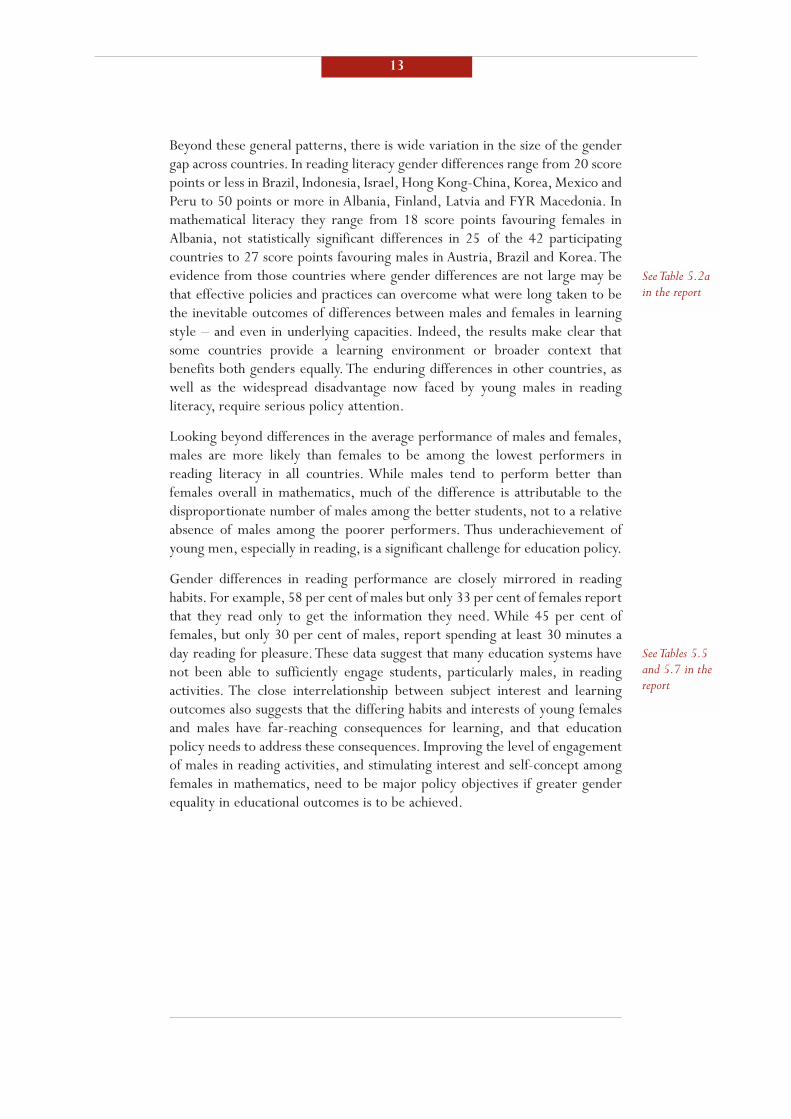
Academic performance. As Figure 4 shows, in every country females, onaverage, reach higher levels of performance in reading literacy than males –with an overall difference of 32 points, or almost half of one proficiency level.In mathematics, however, males tend to perform at somewhat higher levels inmost countries, with an average gap of 11 points. In scientific literacy there arefewer differences between males and females – with males doing better in threecountries, females better in six countries and 33 showing no statisticallysignificant gender differences.
Occupational choice. Female students are more likely than males to reportexpected occupations related to life sciences and health as well as teaching,whereas male students more often expect careers associated with physics,mathematics or engineering or occupations related to machinery.
Professional aspirations. PISA classified students’ expected professions atage 30 into four socio-economic categories, from low-skilled blue-collar tohigh-skilled white collar. Results showed that in 40 of the 42 countries femalesseem to have higher expectations toward their future occupations than males byexpecting a white-collar occupation.
See Table 5.2ain the report
See Table 5.1in the report
12
Figure 4 Gender differences in student performance
1. Response rate is too low to ensure comparability (see Annex A3).Statistically significant differences are marked in black and dark red.Source: OECD PISA database, 2003. Tables 4.10, 4.11, 4.12 and 4.13.
Combined reading literacy scale60
40
20
0
-20
-40
-60
Males perform better
Females perform better
Bulg
aria
Arg
entin
a
Tha
iland
Braz
il
Liec
hten
stei
n
New
Zea
land
Aus
tral
ia
Hun
gary
Can
ada
Irel
and
Ger
man
y
Mex
ico
Aus
tria
Pola
nd
Switz
erla
nd
Gre
ece
Swed
en
Port
ugal
Italy
Fran
ce
Den
mar
k
Icel
and
Kor
ea
Nor
way
Belg
ium
Finl
and
Japa
n
Cze
ch R
epub
lic
Chi
le
Latv
ia
Peru
Uni
ted
Stat
es
Spai
n
Luxe
mbo
urg
Isra
el
Indo
nesia
Alb
ania
FYR
Mac
edon
ia
Rus
sian
Fede
ratio
n
Hon
g K
ong-
Chi
na
Uni
ted
Kin
gdom
Net
herl
ands
1
Mathematical literacy scale60
40
20
0
-20
-40
-60
Males perform better
Females perform better
-7
1627
1218
27
511
18 19 158 8
27
157 7 6 5 7 7
13 14 14 12 12 111
6118
-2
1119
90
5 4 112 12 16
6 64
-6 -7 -7-2 -2 -2 -3
-7 -7-9 -5 -5 -6-14 -14 -16
-23-22-12-13
3 60 1 1
7
-5 -6
20
-5 -6 -3 -3 -4 -3
-18
1512 108
Scientific literacy scale60
40
20
0
-20
-40
-60
Males perform better
Females perform better
-14-16 -16-17-20-20 -24-25-25 -25-26 -26-27-28-29-29 -30-30-31-32 -32-33-34-35 -36-37-37-37 -38 -38-40-41-43-44-46-47 -50-51 -53-58
-30
13
Beyond these general patterns, there is wide variation in the size of the gendergap across countries. In reading literacy gender differences range from 20 scorepoints or less in Brazil, Indonesia, Israel, Hong Kong-China, Korea, Mexico andPeru to 50 points or more in Albania, Finland, Latvia and FYR Macedonia. Inmathematical literacy they range from 18 score points favouring females inAlbania, not statistically significant differences in 25 of the 42 participatingcountries to 27 score points favouring males in Austria, Brazil and Korea. Theevidence from those countries where gender differences are not large may bethat effective policies and practices can overcome what were long taken to bethe inevitable outcomes of differences between males and females in learningstyle – and even in underlying capacities. Indeed, the results make clear thatsome countries provide a learning environment or broader context thatbenefits both genders equally. The enduring differences in other countries, aswell as the widespread disadvantage now faced by young males in readingliteracy, require serious policy attention.
Looking beyond differences in the average performance of males and females,males are more likely than females to be among the lowest performers inreading literacy in all countries. While males tend to perform better thanfemales overall in mathematics, much of the difference is attributable to thedisproportionate number of males among the better students, not to a relativeabsence of males among the poorer performers. Thus underachievement ofyoung men, especially in reading, is a significant challenge for education policy.
Gender differences in reading performance are closely mirrored in readinghabits. For example, 58 per cent of males but only 33 per cent of females reportthat they read only to get the information they need. While 45 per cent offemales, but only 30 per cent of males, report spending at least 30 minutes aday reading for pleasure.These data suggest that many education systems havenot been able to sufficiently engage students, particularly males, in readingactivities. The close interrelationship between subject interest and learningoutcomes also suggests that the differing habits and interests of young femalesand males have far-reaching consequences for learning, and that educationpolicy needs to address these consequences. Improving the level of engagementof males in reading activities, and stimulating interest and self-concept amongfemales in mathematics, need to be major policy objectives if greater genderequality in educational outcomes is to be achieved.
See Tables 5.5and 5.7 in thereport
See Table 5.2ain the report
14
THE IMPACT OF ENGAGEMENT ON LEARNING
Most children come to school ready and willing to learn. How can schoolsfoster and strengthen this predisposition and ensure that young adults leaveschool with the capacity to continue learning throughout life? Students needeffective approaches to learning both to succeed at school and to meet theirlearning needs later in life. In particular, they need to regulate the learningprocess, taking responsibility for reaching particular goals. These types ofoutcomes are not pursued as a specific part of the curriculum, yet they can bestrongly influenced by students’ experiences at school and play a crucial part intheir future.To address this, PISA also looked at student approaches to learning.Specifically, it examined the way students handle and address learning tasks inschool and the extent to which they are able to identify and pursue their ownlearning goals by applying strategies and drawing on their motivation.
Regarding study habits, the average difference in reading scores between thosewho reported that they “almost always” study as hard as possible and thosereporting that they “almost never” do was 13 points in OECD countries. InBrazil, Bulgaria, Denmark, FYR Macedonia and Hong Kong-China the gapsranged from 61 to 73 points. Data also show that the difference in readingperformance between those students who reported not skipping class andthose who reported doing so five times or more was 75 score points or morein 12 countries including Argentina, Chile and Thailand.
The development of control strategies, whereby students selectively process,monitor and organise information, is positively related to student performance inall countries, although a causal relationship cannot be established. Likewise, thereis a strong positive association between elaboration strategies, whereby studentsrelate material to things learned in other contexts, and academic performance inall countries except Belgium, Israel, Netherlands and the United States. Theresults show that those most likely to memorise information do not always achievethe best results, while those who process or elaborate what they learn do well.
Students who spend more time reading for pleasure, read more varieties ofmaterials and show more positive attitudes towards reading tend to be betterreaders, regardless of their family background and the wealth level of thecountry that they are from. Students who are among the least diversifiedreaders have, on average, the lowest mean scores; while students who are themost diversified readers have higher mean scores
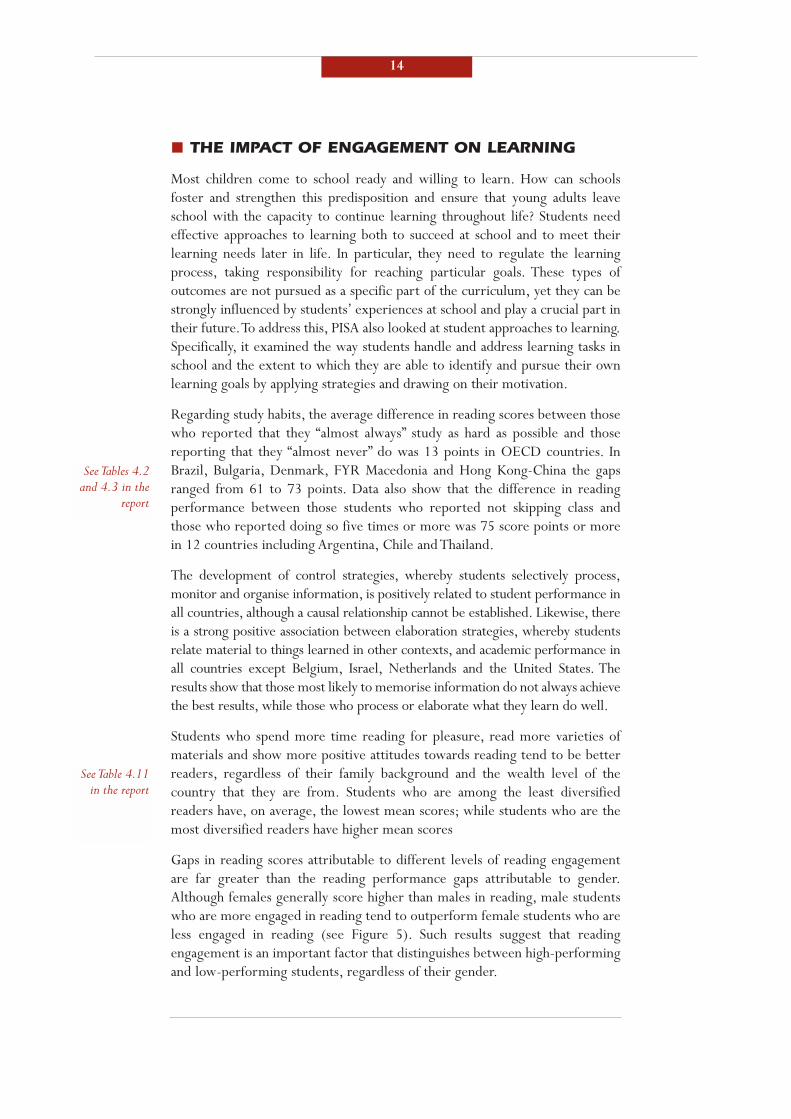
Gaps in reading scores attributable to different levels of reading engagementare far greater than the reading performance gaps attributable to gender.Although females generally score higher than males in reading, male studentswho are more engaged in reading tend to outperform female students who areless engaged in reading (see Figure 5). Such results suggest that readingengagement is an important factor that distinguishes between high-performingand low-performing students, regardless of their gender.
See Table 4.11in the report
See Tables 4.2and 4.3 in the
report
15
Figure 5 Expected performance for males and females with different levels of engagement in reading but the same family characteristics
Performance on the combined reading literacy scale
Source: OECD PISA database, 2003.
High LowLevel of reading engagement
516
464
494
442
Females Males
400
420
440
460
480
500
520
540
Fifteen-year-olds whose parents have the lowest occupational status but who arehighly engaged in reading achieve better reading scores than students whoseparents have high or medium occupational status but who are poorly engaged inreading. All students who are highly engaged in reading achieve reading literacyscores that, on average, are significantly above the OECD mean, whatever theirparents’ occupational background. This suggests that student engagement inreading may be an important policy lever to counter social disadvantage.
These results should not be taken as evidence of the causal relationshipbetween reading engagement and reading performance. Reading engagementand reading performance may be mutually reinforcing. In this sense, animportant policy tool is to encourage schools and parents to cultivate goodreading habits in students.
THE IMPACT OF FAMILY BACKGROUND
Home background influences educational success, and socio-economic statusmay reinforce its effects. Although PISA shows that poor performance in schooldoes not automatically follow from a disadvantaged socio-economic background,it appears to be one of the most powerful factors influencing performance on thereading, mathematical and scientific literacy scales.
PISA examined the relationship between student family background andliteracy performance both in terms of the impact of background characteristicson individual students and the overall situation in participating countries.
16
While PISA consistently shows a relationship between advantaged familybackgrounds and higher levels of literacy performance for students in everycountry, the patterns of this influence varied both within and betweencountries. Analysis covered the following areas:
Parental occupational status. The effects of parental occupational statuson literacy performance differ across countries. Differences in reading scoresbetween students in the top and bottom quarters on the international socio-economic index of occupational status range from less than 50 points in HongKong-China, Korea and Thailand to more than 110 points in Germany andSwitzerland. In half of the non-OECD countries, these differences are eitherequal to, or larger than, 81 points, which is the average difference for OECDcountries as a whole.
Family wealth. In every country except Albania and Iceland, students fromwealthier families on average tend to have higher reading scores. For non-OECD countries, the gaps in reading scores between the top and bottomquarters of the index of family wealth range from 16 points in Latvia and FYRMacedonia to 91 points in Argentina.
Possessions related to “classical” culture. PISA assessed the extent towhich students come from homes where cultural possessions such as classicliterature and works of art are present and how this factor related toachievement. The differences in mean scores on the combined literacy scalebetween the top and bottom quarters of the national index of culturalpossessions range from 10 and 12 points in Indonesia and Thailand to 100 pointsin Luxembourg.The gaps associated with cultural possessions are smallest in thefive Asian countries (less than 52 points).
Parental education. In all countries students whose mothers havecompleted upper secondary education (ISCED3) have higher levels ofperformance in the three domains of literacy than students whose mothers havenot completed upper secondary education. Nevertheless, in Hong Kong-Chinathe mean reading score of students with the least educated mothers is higherthan the mean scores of students whose mothers have completed uppersecondary or even tertiary education (ISCED5/6) in all the other non-OECDcountries except Liechtenstein.
Communication with parents on social issues and aspects ofculture. PISA surveyed students on how often they interacted orcommunicated with their parents in three cultural areas (discussing political orsocial issues; discussing books, films or television programmes; and listening tomusic together) and in three social areas (discussing how well the student wasdoing in school; eating the main meal with the student; and spending time justtalking). Results show that students who report more frequent interaction withtheir parents on both cultural and social issues tend to perform better on the
See Table 6.3 inthe report
See Table 6.4 inthe report
See Table 6.1ain the report
See Table 6.2 inthe report
17
combined reading literacy scale in every country. Social communication isclosely related to reading scores in most non-OECD countries, while culturalcommunication is closely related in most OECD countries. (See Tables 6.5 and6.6 in the report)
Family structure. Since single-parent families on average have lower incomethan two-parent families and must cope with the double responsibility of workand child-rearing, it may be more challenging for them to provide and maintaina supportive learning environment for the children. The relative performancein reading literacy of students from single-parent families is mixed. In OECDcountries students from single-parent families have reading scores that are onaverage 12 points lower than students from other types of families. In non-OECD countries the same pattern holds in Hong Kong-China, Israel,Liechtenstein and Latvia. In the remaining non-OECD countries, however,students from single-parent families have roughly similar levels of readingliteracy as students from other types of families.
To determine how various background characteristics interact and relate tostudent performance an index was constructed to summarise parents’occupational status and years of schooling as well as family wealth, homeeducational resources and possessions related to “classical” culture. Asexpected, students from advantaged socio-economic backgrounds tend to havehigher reading scores than students from disadvantaged backgrounds.
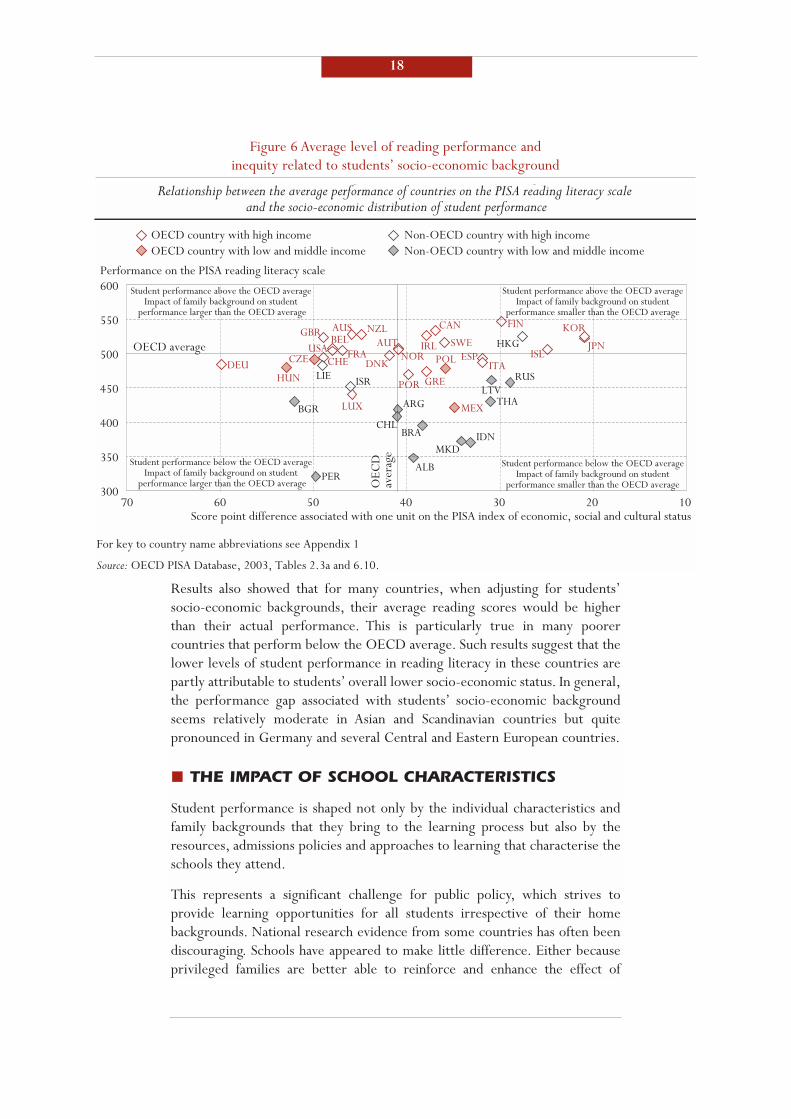
More importantly, while all countries show a clear positive relationshipbetween home background and educational outcomes, some countriesdemonstrate that high average quality and equality of educational outcomes cango together: Canada, Finland, Hong Kong-China, Iceland, Japan, Korea andSweden all display above-average levels of student performance on thecombined reading literacy scale and, at the same time, a below-average impactof economic, social and cultural status on student performance (see Figure 6,top-right quadrant). Conversely, average performance in reading literacy in theCzech Republic, Germany, Hungary and Luxembourg is significantly below theOECD average while, at the same time, there are above-average disparitiesbetween students from advantaged and disadvantaged socio-economicbackground (see Figure 6, bottom-left quadrant).
The finding that some countries are able to achieve high levels of performancewhile reducing disparities is encouraging. Showing that countries differ not justin their mean performance but also in the extent to which they are able to closethe gap between the students with the lowest and the highest levels ofperformance offers encouragement to national policy-makers seeking toprovide equal opportunities and equitable learning outcomes for all students.
See Table 6.11in the report
See Tables 6.5and 6.6 in thereport
See Table 6.7in the report
18
Figure 6 Average level of reading performance and inequity related to students’ socio-economic background
g p y g
OECD country with high incomeOECD country with low and middle income
Performance on the PISA reading literacy scale
Score point difference associated with one unit on the PISA index of economic, social and cultural status
Non-OECD country with high income Non-OECD country with low and middle income
300
350
400
450
500
550
600
6070 50 40 30 20 10
For key to country name abbreviations see Appendix 1
Source: OECD PISA Database, 2003, Tables 2.3a and 6.10.
OEC
D
aver
age
Relationship between the average performance of countries on the PISA reading literacy scale and the socio-economic distribution of student performance
OECD average
FINCANAUSGBR
ESPDNK
IRLNOR ISL
SWENZL
USA FRABEL
POR
KOR
JPNCHE
GRE
MEX
ITACZE
AUT
HUN
POLDEU
LUX
ISR RUSLTV
LIE
BGRCHL
PER
MKDIDNBRA
THA
HKG
ALB
ARG
Student performance above the OECD average Impact of family background on student
performance larger than the OECD average
Student performance below the OECD average Impact of family background on student
performance larger than the OECD average
Student performance above the OECD averageImpact of family background on student
performance smaller than the OECD average
Student performance below the OECD averageImpact of family background on student
performance smaller than the OECD average
Results also showed that for many countries, when adjusting for students’socio-economic backgrounds, their average reading scores would be higherthan their actual performance. This is particularly true in many poorercountries that perform below the OECD average. Such results suggest that thelower levels of student performance in reading literacy in these countries arepartly attributable to students’ overall lower socio-economic status. In general,the performance gap associated with students’ socio-economic backgroundseems relatively moderate in Asian and Scandinavian countries but quitepronounced in Germany and several Central and Eastern European countries.
THE IMPACT OF SCHOOL CHARACTERISTICS
Student performance is shaped not only by the individual characteristics andfamily backgrounds that they bring to the learning process but also by theresources, admissions policies and approaches to learning that characterise theschools they attend.
This represents a significant challenge for public policy, which strives toprovide learning opportunities for all students irrespective of their homebackgrounds. National research evidence from some countries has often beendiscouraging. Schools have appeared to make little difference. Either becauseprivileged families are better able to reinforce and enhance the effect of
19
schools, or because schools are better able to nurture and develop youngpeople from privileged backgrounds, it has often been apparent that schoolsreproduce existing patterns of privilege rather than delivering equalopportunities in a way that can distribute outcomes more equitably.
PISA underlines the fact that a student’s home background is only part of thestory of socio-economic disparities in education – and in most countries thesmaller part.The combined impact of the school’s socio-economic compositioncan have an appreciable effect on the student’s performance, and generally has agreater effect on predicted student scores than the student’s own familycharacteristics. In fact, in about one third of all PISA countries, the impact of theschool-level effects are greater than the impact of student-level characteristics.
Another key finding is that beneficial school effects are reinforced by socio-economic background. Schools with more resources and policies and practicesassociated with better student performance tend, to varying degrees, to havemore advantaged students.The net result of this effect is that in countries wherethere is a high degree of segregation along socio-economic lines, students fromdisadvantaged socio-economic backgrounds do worse.This, in turn, means thatsome of the inequality of outcomes observed in the analysis of socio-economicgradients is associated with inequality of opportunity. In such circumstances,talent remains underdeveloped and human resources are wasted.
In some countries, students are highly segregated along socio-economic lines, inpart because of residential segregation and economic factors, but also because offeatures of the education system. Education policy in such countries mightattempt to moderate the impact of socio-economic background on studentperformance by reducing the extent of segregation along socio-economic lines,or by allocating resources to schools differentially. In these countries, it may benecessary to examine how the allocation of school resources relates to the socio-economic composition of schools. In other countries, there is relatively littlesocio-economic segregation, i.e., schools tend to be similar in their socio-economic composition. Education policy in these countries might aim atmoderating the impact of socio-economic background through measures aimedat improving school resources and reducing within-school segregation accordingto students’ economic, social and cultural status. In the end, of course, whatmatters most is how effectively resources are used. Approaches might include,for example, eliminating classroom streaming or providing more assistance forstudents with a poor level of performance.
In countries where the impact of socio-economic background on studentperformance is moderate, not all successes can be credited to the educationsystem and, in countries where the impact is considerable, not all of theproblems should be attributed to schools either. The analysis shows that thechallenges which education systems face as a result of the differences in the
20
distribution of home background factors among the student population differwidely. Many of the factors of socio-economic disadvantage are not directlyamenable to education policy, at least not in the short term. For example, theeducational attainment of parents can only gradually improve, and familywealth will also depend on long-term national economic development.
PISA results suggest that school policy and schools themselves can play a crucialrole in moderating the impact of social disadvantage on student performance.Theresults reveal some school resource factors, school policies and classroompractices that appear to make a significant difference to student performance.Theextent to which students make use of school resources, and the extent to whichspecialist teachers are available, can both have an impact on student performance.According to principals’ perceptions of teacher-related factors affecting schoolclimate, teacher morale and commitment, and school autonomy, also appear tomake a difference. Finally, there are aspects of classroom practice that show apositive relationship with student performance, such as teacher-student relationsand the disciplinary climate in the classroom.
There is no single factor that explains why some schools or some countries havebetter results than others. Successful performance is attributable to aconstellation of factors, including school resources, school policy and practice,and classroom practice. It will require much further research and analysis toidentify how these factors operate, interact with home background, and influencestudent performance.
In pursuit of this deeper understanding, a series of thematic PISA reports willanalyse the impact of school and system-level factors on student performancemore extensively, and will seek to understand in more detail why somecountries achieve better and more equitable learning outcomes than others. Inthe meantime, the mere fact that high-quality learning outcomes are already areality for most students in some countries is, in itself, an encouraging resultthat shows that the challenges ahead can be tackled successfully.
21
Appendix 1
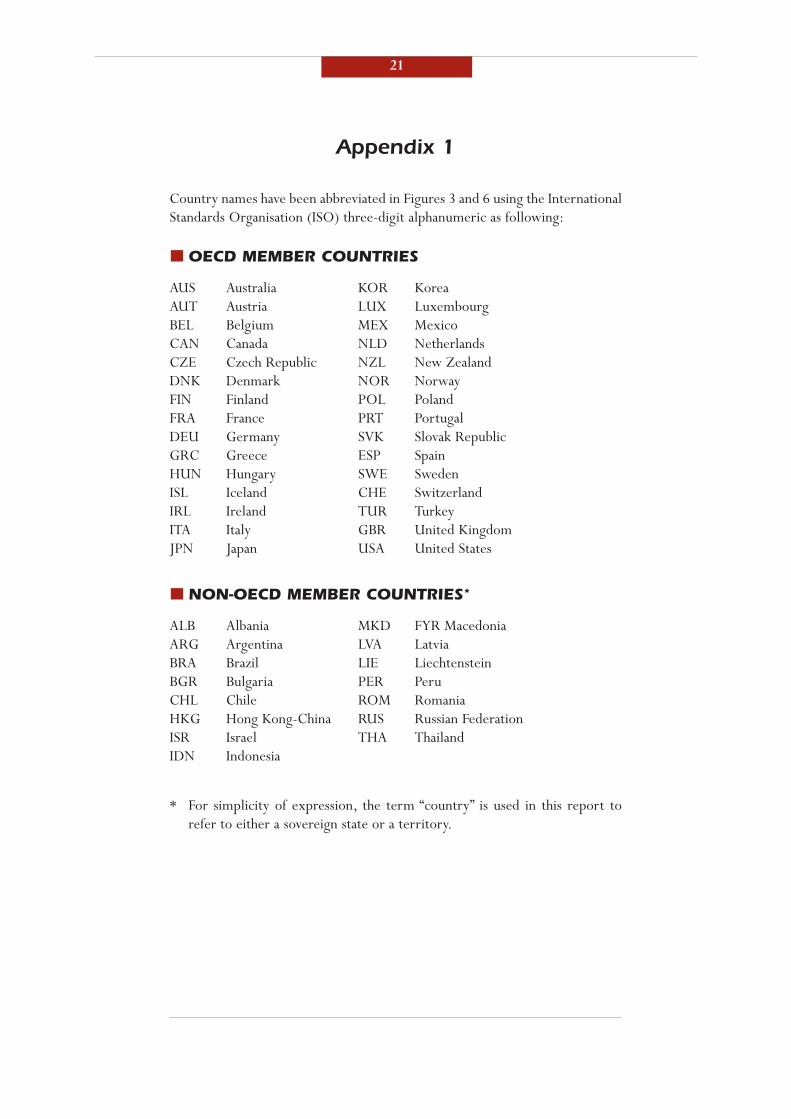
Country names have been abbreviated in Figures 3 and 6 using the InternationalStandards Organisation (ISO) three-digit alphanumeric as following:
OECD MEMBER COUNTRIES
AUS Australia KOR KoreaAUT Austria LUX LuxembourgBEL Belgium MEX MexicoCAN Canada NLD NetherlandsCZE Czech Republic NZL New ZealandDNK Denmark NOR NorwayFIN Finland POL PolandFRA France PRT PortugalDEU Germany SVK Slovak RepublicGRC Greece ESP SpainHUN Hungary SWE SwedenISL Iceland CHE SwitzerlandIRL Ireland TUR TurkeyITA Italy GBR United KingdomJPN Japan USA United States
NON-OECD MEMBER COUNTRIES*
ALB Albania MKD FYR MacedoniaARG Argentina LVA LatviaBRA Brazil LIE LiechtensteinBGR Bulgaria PER PeruCHL Chile ROM RomaniaHKG Hong Kong-China RUS Russian Federation ISR Israel THA ThailandIDN Indonesia
* For simplicity of expression, the term “country” is used in this report torefer to either a sovereign state or a territory.

22
23
UNESCO PUBLISHING
7, place de Fontenoy, 75352 Paris 07 SP, FranceUIS Ref.: UIS/AP/03-02ISBN: 92-9189-002-2PRINTED IN CANADA
OECD PUBLICATIONS
2, rue André-Pascal, 75775 Paris Cedex 16, FranceOECD Code: (96 2003 01 1 P1)ISBN: 92-64-10286-8 - n°53081 2003
INSTITUTE FOR STATISTICS HAMBURG
Literacy Skills for the World of Tomorrow Further results from PISA 2000
Are students well prepared to meet the challenges of the future? Are theyable to analyse, reason and communicate their ideas effectively? Do theyhave the capacity to continue learning throughout life? These are questionsthat parents, students, the public and those who run education systemscontinually ask.
The OECD Programme for International Student Assessment (PISA) providessome answers to these questions. It assesses the extent to which students,who are near the end of compulsory education, have acquired some of theknowledge and skills that are essential for full participation in society. Itpresents evidence on student performance in reading, mathematical andscientific literacy; reveals factors that influence the development of theseskills at home and at school; and examines the implications for policydevelopment.
With the report Literacy Skills for the World of Tomorrow - Further results fromPISA 2000, OECD and the UNESCO Institute for Statistics extend the picturethat PISA provides to additional countries that have recently joined theprogramme: Albania, Argentina, Bulgaria, Chile, Hong Kong-China,Indonesia, Israel, FYR Macedonia, Peru, Romania and Thailand.
The report shows considerable variation in levels of knowledge and skillsbetween students, schools and countries. Not all of these differences are dueto the social and economic conditions in which students live and schools orcountries operate. Some countries have managed to mitigate the influenceof social background and some have achieved this while reaching a highoverall level of performance. These are noteworthy achievements. Willother countries take up the challenge?
For further information or to purchase the full report, please contact:www.unesco.org/publications www.oecd.org
UNESCO Publishing OECD Publications7, place de Fontenoy 2, rue André-Pascal
75352 PARIS 07 SP 75775 PARIS Cedex 16France France
To download an electronic copy of the full report, please visit:www.uis.unesco.org or www.pisa.oecd.org
The data underlying this report are available at:www.pisa.oecd.org
Ref: UIS/AP/03-02S