Embed Size (px)
Citation preview
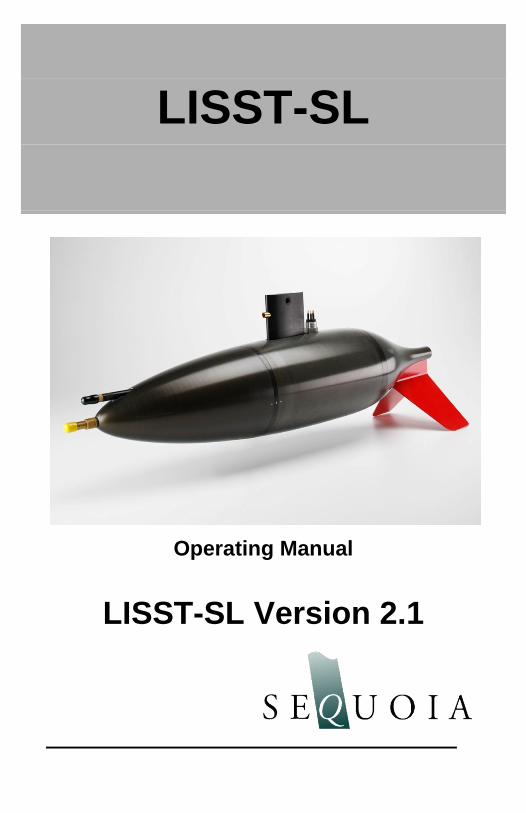
Operating Manual
LISST-SL Version 2.1
LISST-SL

Technical assistance
To obtain technical assistance please contact your local distributor (a list can be found on http://www.SequoiaSci.com/contact/international.aspx?SectionName=contact) or a Sequoia Technical Service Representative listed below.
Please be sure to include the instrument serial number
with any correspondence.
Factory Technical Service Representatives
Randy Srnsky
(+1) 425-641-0944 ext. 110
Chuck Pottsmith
(+1) 425-641-0944 ext. 107
Ole Mikkelsen
(+1) 425-641-0944 ext. 108
©This document is copyrighted by SEQUOIA SCIENTIFIC, INC. It shall not be reproduced, disclosed, used in whole or part, for any purpose, without the specific written authorization of SEQUOIA SCIENTIFIC, INC.

Contents
I. Introduction ............................................................................ 1
1.1 LISST-SL Sensor ..................................................................... 1 1.2 The B-reel ................................................................................ 2 1.3 The Topside Control Box (TCB) .............................................. 3 1.4 Terminology ............................................................................. 4
II. Contents and Technical Specifications ............................... 7
1. Parameters Displayed on TCB ................................................ 8 2. Operating Specifications .......................................................... 8 3. Datalogger Specifications ........................................................ 8 4. Power ....................................................................................... 8 5. Physical Dimensions ................................................................ 8 6. Datafiles and Contents ............................................................ 9 7. Size Ranges .......................................................................... 10
III. Learning the LISST-SL System .......................................... 11
1. Basics .................................................................................... 11 2. The B-Reel ............................................................................. 11 3. Topside Control Box (TCB).................................................... 11 4. Battery Charging .................................................................... 17 5. Data Download from TCB ...................................................... 17
IV. Using the LISST-SL System in a Laboratory .................... 18
1. First Assembly and Test in Laboratory .................................. 18 2. Background File acquisition ................................................... 19 3. Instrument health check......................................................... 19 4. Collecting Test Data in a Lab ................................................ 20 5. Temporary Storage ................................................................ 21
V. Field Deployment ................................................................. 22
1. Preparing for a Field Experiment ........................................... 22 2. Getting set up on the bridge .................................................. 22 3. Collecting Data ...................................................................... 23 4. Shutting Down ....................................................................... 24 5. Clean up ................................................................................ 24 6. Viewing Saved Data .............................................................. 24
VI. Software Installation and Viewing Data ............................. 25
1. Overview ................................................................................ 25 2. Software Installation .............................................................. 25 3. Learning the Software ............................................................ 26 4. Downloading Data Files from TCB ........................................ 26 5. Processing Raw Data File ..................................................... 27 6. Viewing Results ..................................................................... 27 7. Formats of Results file ........................................................... 28 8. Presenting Results ................................................................. 28
VII. Handling, Cleaning, Maintenance and Storage ................ 29
1. Handling ................................................................................. 29 2. Cleaning ................................................................................. 29 3. Storage .................................................................................. 30
VIII. FAQ’s .................................................................................... 31
APPENDIX A: File names, File Formats, and Size Classes ........... 33
APPENDIX B: Purging the Pitot System ............................................. 37
APPENDIX C: Cleaning the Optics ...................................................... 40
APPENDIX D: Background Files ......................................................... 42
APPENDIX E: Detailed Accessories List ............................................ 43
APPENDIX F: B-Reel Cable Termination ........................................... 45
APPENDIX G: List of Videos ............................................................... 46
Warranty ................................................................................................. 48
LISST-SL V2.1 User’s Guide
1
I. Introduction Dear LISST-SL Customer: Thank you for purchasing the LISST-SL iso-kinetic sediment grain-size analyzer. It is a sophisticated system for use from bridges. It provides all the data necessary to compute sediment transport in a river. The measured parameters are: river velocity, sediment concentration and size distribution as a function of depth, depth of the instrument at any time, and water temperature. The combination of sediment, velocity, and depth data permit estimation of sediment transport rate, also called sediment flux. In the shipment to you, you will find 3 main items which comprise the LISST-ST Instrument System. These are: the LISST-SL submersible sensor, a Topside Controller Box (TCB), and a B-reel if you ordered one. If you did not order a B-reel, you will need to procure one from one of many vendors in the US. There are many more items of accessories, and software for downloading and processing raw data. A full list of items shipped to you appears in Chapter 2, Contents and Technical Specifications. We now introduce you to each of these.
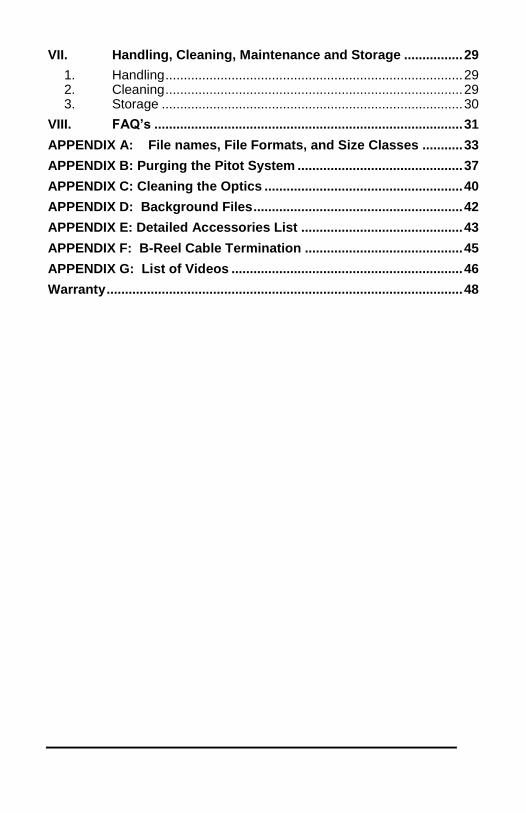
1.1 LISST-SL Sensor The main system is the streamlined submersible LISST-SL sensor. This is only a sensor; it needs power to operate, and it has no data storage capacity. So, it must be connected to the Topside Controller Box (See Section 1.3).
The LISST-SL sensor contains the laser optics, scattered light sensing photodiodes and amplifiers, and an iso-kinetic pump. Whenever power is applied to the -SL (from the TCB, via a short SL-to-TCB cable, or via the B-reel cable), a dedicated microprocessor inside the –SL begins operation. It senses stream velocity from the pitot tube (5), turns on and controls operation of the internal pump to match stream velocity (i.e. in iso-kinetic mode),

LISST-SL V2.1 User’s Guide
2
and immediately begins transmitting data to the TCB. It continues transmitting data regardless of if the TCB is capturing it or not. In this regard, it is a ‘dumb’ sensor. The –SL needs the TCB for power. The TCB executes the user commands, e.g. capturing a background scattering file, or capturing river data. The sensor is the entire streamlined instrument which enters the water. At the top of the LISST-SL sensor is the cable attachment point (1), which is hidden in a streamlined black ‘housing’ that looks like the sail of a submarine. Immediately behind is the underwater connector (2) to which the cable from the B-reel will be connected [see Appendix F for connector pin outs]. Note the exit point for the intake flow – it is behind the connector (3). Three dots are shown (4), for aligning the nose, the front bulkhead, and the mid-section of the LISST-SL. A hole on the far side in this image, exactly behind the mark (4), and on the bulkhead is a static pressure port. Depth of the instrument below water surface is sensed through 2 small holes on the side of the bulkhead (‘static port’), connected to a pressure sensor. The hole at top (8) of the bulkhead is to purge air. If over years of operation, sediment fills the static ports, you may use the top static port to inject water and blow out the sediment. The three radial holes in the bulkhead are connected to a common cavity that is applying the static pressure for the flow velocity and the pressure for the depth sensor. Temperature is sensed in the water passage, within the instrument. On the nose is an intake tube (9) on the instrument axis, and above it is the pitot-tube velocity sensor (5). To prevent large sediment grains from entering the pitot tube, a 35 micron metal screen is fitted behind the conical opening. Whenever not in use, KEEP THE PITOT TUBE covered with a pinched tube or a plastic cap provided with the shipment. Not doing so may dry up the passage to the pitot pressure sensor and introduce bubbles. We will describe separately how to identify if bubbles are present in the pitot tube and how to remove bubbles. This is a time consuming process, so best to keep the pitot tube covered. Note that the front (6) and rear (7) bulkheads are identified on the photo. A large fin is provided to stabilize the LISST-SL Sensor and point it into the flow. The downward fin, as against the upward surfaces on airplanes is chosen so that the fins enter water first, immediately spinning the instrument and pointing it into the flow. Do not be alarmed if the LISST-SL sways in the river current – turbulent eddies in the river cause the instantaneous flow direction to veer; the instrument follows this instantaneous direction.
1.2 The B-reel This is an essential system. It has 50m of a strong cable wrapped on a barrel and a handle to manually operate it as a winch. The B-reel serves a dual purpose: it is used to lower the LISST-SL sensor from the bridge, and also, it provides electrical connection between the sensor and the Topside Controller Box (TCB) which houses data scheduling and controlling electronics. The B-reel cable has a river side end, which splits into a Y. One
LISST-SL V2.1 User’s Guide
3
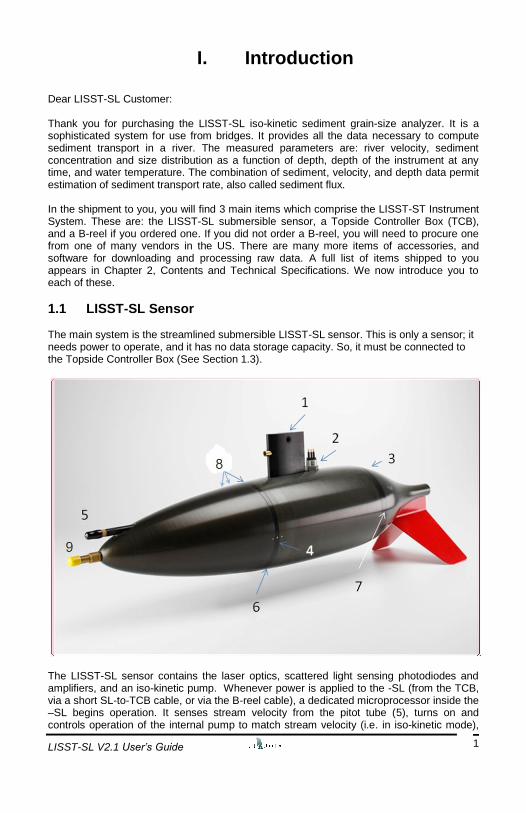
end of the Y is tied to the lifting point on the –SL, and the other end is a female submersible connector. It is connected to the –SL underwater electrical connector. If you ordered the B-reel from Sequoia, the termination is done by us. See Appendix F for connector type and wiring instructions. The other end of the cable is permanently attached to slip-rings. The slip-rings are permanently fastened to the rotating barrel of the B-reel. The slip rings connect to 2 terminal posts. A provided cable is used to connect to these terminal posts and to the –SL power-and-signal connector.
1.3 The Topside Control Box (TCB) Control of the systems is from the TCB. This plastic box contains a powerful 25V 19.2A-hr Lithium-ion battery, and a computer system that controls the display on a touch-screen panel. The battery powers the LISST-SL sensor, the computer within the TCB, and the touch-screen, All commands are through this touch-screen and are menu driven. The interface is described in Chapter 3. On the left lower corner is the power button, and the communication/battery recharge connector. Two separate cables are provided, one for communication with a computer, the other to recharge the battery. YOU CAN ONLY CHARGE THE BATTERY WHEN THE TCB POWER IS TURNED OFF. Operations Overview: Once the TCB – B-reel – LISST-SL system is connected together, operations involve these 3 simple steps:
1 Verify that the pitot tube is free of air bubbles. 2 Acquire a background datafile; this contains measurements of scattering from
optics on to the detectors and some other parameters. 3 Capture river /stream data. We will describe each of these 3 steps in Chapter 3.
LISST-SL V2.1 User’s Guide
4
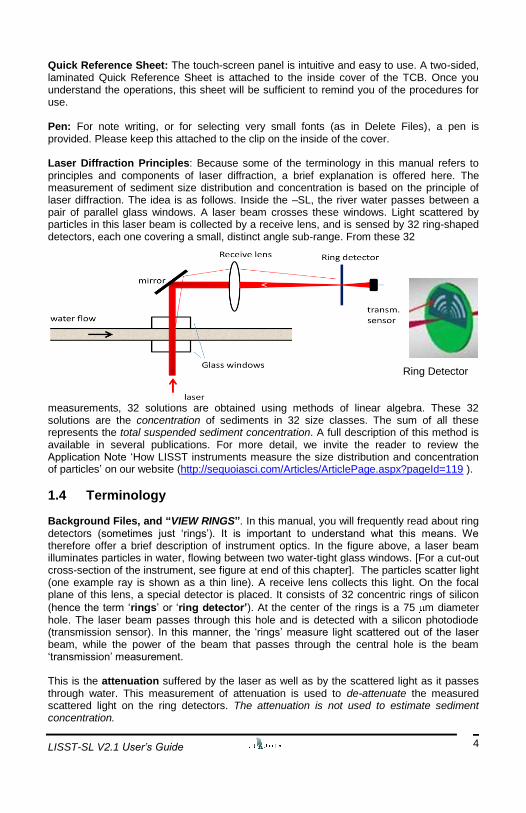
Quick Reference Sheet: The touch-screen panel is intuitive and easy to use. A two-sided, laminated Quick Reference Sheet is attached to the inside cover of the TCB. Once you understand the operations, this sheet will be sufficient to remind you of the procedures for use. Pen: For note writing, or for selecting very small fonts (as in Delete Files), a pen is provided. Please keep this attached to the clip on the inside of the cover. Laser Diffraction Principles: Because some of the terminology in this manual refers to principles and components of laser diffraction, a brief explanation is offered here. The measurement of sediment size distribution and concentration is based on the principle of laser diffraction. The idea is as follows. Inside the –SL, the river water passes between a pair of parallel glass windows. A laser beam crosses these windows. Light scattered by particles in this laser beam is collected by a receive lens, and is sensed by 32 ring-shaped detectors, each one covering a small, distinct angle sub-range. From these 32 Ring Detector measurements, 32 solutions are obtained using methods of linear algebra. These 32 solutions are the concentration of sediments in 32 size classes. The sum of all these represents the total suspended sediment concentration. A full description of this method is available in several publications. For more detail, we invite the reader to review the Application Note ‘How LISST instruments measure the size distribution and concentration of particles’ on our website (http://sequoiasci.com/Articles/ArticlePage.aspx?pageId=119 ).
1.4 Terminology Background Files, and “VIEW RINGS”. In this manual, you will frequently read about ring detectors (sometimes just ‘rings’). It is important to understand what this means. We therefore offer a brief description of instrument optics. In the figure above, a laser beam illuminates particles in water, flowing between two water-tight glass windows. [For a cut-out cross-section of the instrument, see figure at end of this chapter]. The particles scatter light (one example ray is shown as a thin line). A receive lens collects this light. On the focal plane of this lens, a special detector is placed. It consists of 32 concentric rings of silicon
(hence the term ‘rings’ or ‘ring detector’). At the center of the rings is a 75 m diameter hole. The laser beam passes through this hole and is detected with a silicon photodiode (transmission sensor). In this manner, the ‘rings’ measure light scattered out of the laser beam, while the power of the beam that passes through the central hole is the beam ‘transmission’ measurement. This is the attenuation suffered by the laser as well as by the scattered light as it passes through water. This measurement of attenuation is used to de-attenuate the measured scattered light on the ring detectors. The attenuation is not used to estimate sediment concentration.
LISST-SL V2.1 User’s Guide
5
It is important that you understand the significance of the patterns of light on the rings. The total amount of light on rings is a combination of a ‘Background’ and light scattered by particles. The Background arises from imperfections and micro-scratches on optical windows. This Background is very carefully measured to create a Background File. The background is subtracted from the total signal on the rings to compute the scattering from particles alone. The background changes due to age, or due to particle deposition on windows. Hence, it is necessary to measure the background before every experiment.
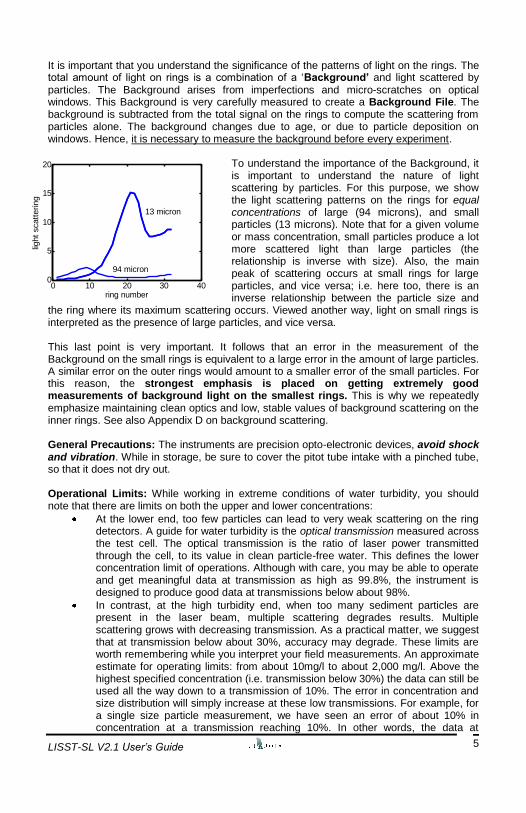
To understand the importance of the Background, it is important to understand the nature of light scattering by particles. For this purpose, we show the light scattering patterns on the rings for equal concentrations of large (94 microns), and small particles (13 microns). Note that for a given volume or mass concentration, small particles produce a lot more scattered light than large particles (the relationship is inverse with size). Also, the main peak of scattering occurs at small rings for large particles, and vice versa; i.e. here too, there is an inverse relationship between the particle size and
the ring where its maximum scattering occurs. Viewed another way, light on small rings is interpreted as the presence of large particles, and vice versa. This last point is very important. It follows that an error in the measurement of the Background on the small rings is equivalent to a large error in the amount of large particles. A similar error on the outer rings would amount to a smaller error of the small particles. For this reason, the strongest emphasis is placed on getting extremely good measurements of background light on the smallest rings. This is why we repeatedly emphasize maintaining clean optics and low, stable values of background scattering on the inner rings. See also Appendix D on background scattering. General Precautions: The instruments are precision opto-electronic devices, avoid shock and vibration. While in storage, be sure to cover the pitot tube intake with a pinched tube, so that it does not dry out. Operational Limits: While working in extreme conditions of water turbidity, you should note that there are limits on both the upper and lower concentrations:
At the lower end, too few particles can lead to very weak scattering on the ring detectors. A guide for water turbidity is the optical transmission measured across the test cell. The optical transmission is the ratio of laser power transmitted through the cell, to its value in clean particle-free water. This defines the lower concentration limit of operations. Although with care, you may be able to operate and get meaningful data at transmission as high as 99.8%, the instrument is designed to produce good data at transmissions below about 98%.
In contrast, at the high turbidity end, when too many sediment particles are present in the laser beam, multiple scattering degrades results. Multiple scattering grows with decreasing transmission. As a practical matter, we suggest that at transmission below about 30%, accuracy may degrade. These limits are worth remembering while you interpret your field measurements. An approximate estimate for operating limits: from about 10mg/l to about 2,000 mg/l. Above the highest specified concentration (i.e. transmission below 30%) the data can still be used all the way down to a transmission of 10%. The error in concentration and size distribution will simply increase at these low transmissions. For example, for a single size particle measurement, we have seen an error of about 10% in concentration at a transmission reaching 10%. In other words, the data at
0 10 20 30 400
5
10
15
20
ring number
light
scatt
ering
13 micron
94 micron
94 micron
13 micron
LISST-SL V2.1 User’s Guide
6
transmissions below 30% are still usable, though with awareness that the errors (bias) is growing. Please visit our website for articles on this topic.
The Remaining Manual: In the chapters that follow, we first provide a list of all items shipped to you, and specifications of the instrument system, along with file names of files generated when operating the system, and what their contents are (section xx). We then provide step by step instructions on a first, quick connection of the instruments, a laboratory run to collect test data for practice, and guidance for a field test (section xxx). We will then explain data offloading and processing methods on the provided software (section xxxx). A number of Appendices provide in-detail information about some special topics.
5,7,13 Videos In This Manual: In this manual, you will occasionally see this video icon, preceded by one or more numbers. It means that video(s) of this number is associated with the topic at hand. See Appendix G for a list of all videos. A number of other videos, not referenced in this manual, are provided to you, with self-evident names.
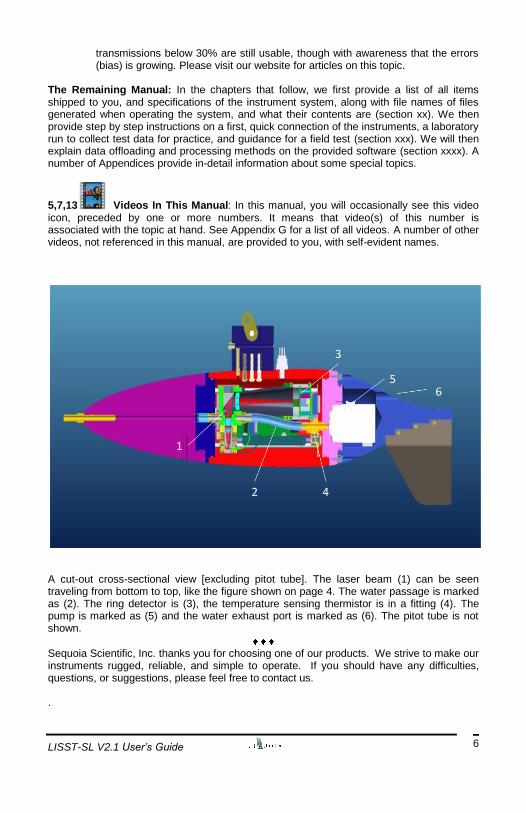
A cut-out cross-sectional view [excluding pitot tube]. The laser beam (1) can be seen traveling from bottom to top, like the figure shown on page 4. The water passage is marked as (2). The ring detector is (3), the temperature sensing thermistor is in a fitting (4). The pump is marked as (5) and the water exhaust port is marked as (6). The pitot tube is not shown.
Sequoia Scientific, Inc. thanks you for choosing one of our products. We strive to make our instruments rugged, reliable, and simple to operate. If you should have any difficulties, questions, or suggestions, please feel free to contact us. .

LISST-SL V2.1 User’s Guide
7
II. Contents and Technical Specifications
These items are in your shipment: LISST-SL Sensor Topside Control Box (TCB) B-reel (if ordered) Sensor-to-TCB cable Quick reference guide B-reel to TCB cable 25.2V Lithium Battery Charger Communications Cable Copper cooling coil 5-conductor impulse plug (attached to –SL) Hex Tool Kit O-ring kit [sizes 2-007,009,012,015,109, 156] Pin Clips (2) 2 –instrument foam stands Nose wrench 3 ea. 1-m flex tubes Filter wing nuts 2 Funnels Cleaning solution Tweezers Cleaning Rod Plastic sampling tube caps Rubber bands Syringes(2 ea) Red Taper Plugs Cleaning patches 35 micron filter disks for pitot tube nose 3 hose pinch clamps 0.2 micron filter cartridge 2 ea. ½” x 3/8” tube adapters Packet of ISO coarse sediment 3/8 x 3/8” tube adapters -SL Tail 3-pin impulse plug (attached to TCB) Plastic Pitot Tube cover cups Tail screws Ship Disk for Instrument System Impulse sleeve (attached to –SL) Tube adapter clips (Red) Copy of Pack List Photographs of all items are included in Appendix E.
LISST-SL V2.1 User’s Guide
8
1. Parameters Displayed on TCB Particle Concentration [mg/l]
Mean Particle Size [µm)
Optical Transmission
Depth of instrument
Temperature of water
Water velocity in the river
Pump drive voltage and current (semi-quantitative, bars)
State of Charge of the Battery
2. Operating Specifications
Sediment Concentration: 10-2000 mg/l (nominal) [Depends on grain size]. Silt Density is assumed to be 2.65. [for other values, you will need to adjust the density as follows: first divide by 2.65 then multiply by new density].
Size Ranges: 1.9 – 381 µm for randomly shaped grains (versus spheres).
Size Resolution: 32 log spaced size classes [each size is 1.1809 times
previous].Mean Size: 1.9 to 381 microns. See Appendix A. Optical Transmission: 0 to 100%. Useful range: 30-98%.
Depth of operation: 0 - 30 m (100ft). Operating Temperature: 0 – 40
0C (32 – 104
0F)
River velocity: 0 – 3 m/sec, or 0-10 ft/sec;
Isokinetic control range – 0.5 to 3 m/sec, or 1.5 to 10 ft/sec. [pump minimum speed is set to a low value to prevent sediment accumulation within it].
Power consumption: 24V, 2.5Amp (with pump full on)
3. Datalogger Specifications
128 MB storage capacity; corresponding to at least 100,000 size distributions and associated sample information [over 20 hours operation.]
Expandable to 4 GB.
RS232 Interface 4. Power
Battery – Rechargeable Lithium-ion battery pack. 24V x 19.2 A-hr. (inside TCB)
Battery life on bridge: 8 Hours, nominal. [WILL NOT CHARGE WHILE TCB IS IN
USE]
Battery Alarm will sound when ½-hour life left on battery.
AC battery charger (120/240VAC) [ 8 hrs recharge time]. 5. Physical Dimensions LISST-SL Sensor
With tail and sail attached: 25.4 x 63.5 x 76.2 cm. [H x W x L]
Weight (in air): 16 kg (35 lbs)
Weight (in water): 7 kg (15 lbs).
Topside Control Box
17.8 x 29.2 x 44.5 cm
Weight: 9 Kg (19 lbs).
LISST-SL V2.1 User’s Guide
9
6. Datafiles and Contents Each data run includes the following automatically named files. All files have the same filename format as Rdddhhmm, where ddd is the day of the year, hh is the hour of the day, and mm is the minute of the hour. Data files start with the letter R. Only the Background files start with the letter Z. For file types and how many files are saved, please consult Appendix A. The background is subtracted before computing sediment concentration and size distribution. The background should be taken immediately prior to every data run (see Chapter 3). It also zeros out any depth sensor drift and atmospheric pressure changes to yield the correct water depth.
R0641443.TXT Text file with details of all related files below. Contains ‘memory’ of when created, instrument serial number, firmware version in TCB, name of file with Concentration and Mean Size; name of Raw Scattering data binary file; associated background file (Z***,asc below) , and units.
Z0641443.ASC Background scatter file, to be used for processing .dat file. See Appendix A for order of variables.
R0641443.CSV Comma-separated file, saves data displayed on TCB during data collection. Contains Date, Time, Depth, Velocity, Mean Size, TSS, Temperature, Optical Transmission, Pump state (1 = ON, 0 = OFF), and Battery Voltage.
R0641443.DAT Binary data file, 50 variables per record. See Appendix A to see order of variables (needed if processing data in Matlab).
R0641443.psd Particle Size Distribution, from post-processing .dat file. It is a binary file, only used by the VIEW PSD FILE function on the PC software.
R0641443.ASC This file is produced after processing the .dat file. It is an ASCII file containing size distribution and other variables. See Appendix A for order of variables.

LISST-SL V2.1 User’s Guide
10
7. Size Ranges There are 32 size ranges (also called size bins) logarithmically placed from 1.9 – 381 microns. The table below shows the lower limit, upper limit and and median size of each size bin in microns.
Sizes (microns) Size Bin # Lower Upper Median
1 1.90 2.25 2.07 2 2.25 2.65 2.44 3 2.65 3.13 2.88 4 3.13 3.69 3.40 5 3.69 4.35 4.01 6 4.35 5.14 4.73 7 5.14 6.06 5.58 8 6.06 7.15 6.59 9 7.15 8.44 7.77 10 8.44 9.96 9.17 11 9.96 11.8 10.8 12 11.8 13.9 12.8 13 13.9 16.4 15.1 14 16.4 19.3 17.8 15 19.3 22.8 21.0 16 22.8 26.9 24.8 17 26.9 31.8 29.2 18 31.8 37.5 34.5 19 37.5 44.2 40.7 20 44.2 52.2 48.0 21 52.2 61.6 56.7 22 61.6 72.7 66.9 23 72.7 85.7 78.9 24 85.7 101 93.1 25 101 119 110 26 119 141 130 27 141 166 153 28 166 196 181 29 196 232 213 30 232 273 252 31 273 322 297 32 322 381 350
LISST-SL V2.1 User’s Guide
11
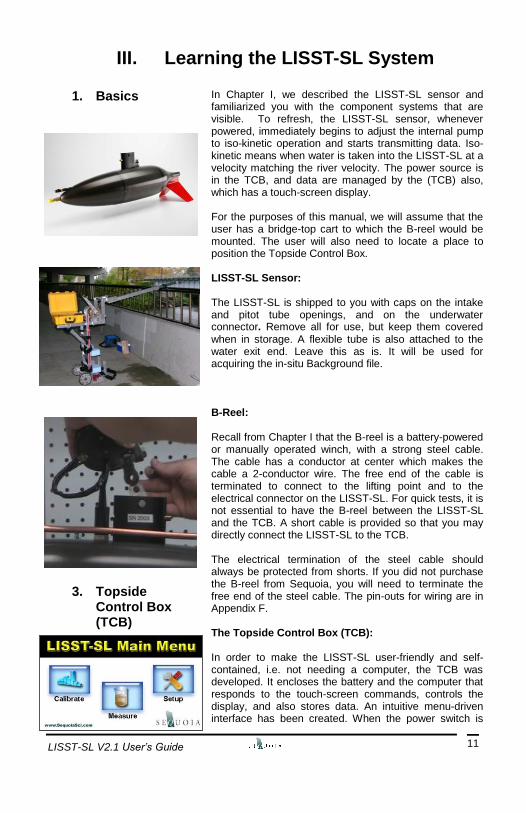
III. Learning the LISST-SL System
1. Basics
2. The B-Reel
Cable termination
3. Topside Control Box (TCB) Main menu
In Chapter I, we described the LISST-SL sensor and familiarized you with the component systems that are visible. To refresh, the LISST-SL sensor, whenever powered, immediately begins to adjust the internal pump to iso-kinetic operation and starts transmitting data. Iso-kinetic means when water is taken into the LISST-SL at a velocity matching the river velocity. The power source is in the TCB, and data are managed by the (TCB) also, which has a touch-screen display. For the purposes of this manual, we will assume that the user has a bridge-top cart to which the B-reel would be mounted. The user will also need to locate a place to position the Topside Control Box. LISST-SL Sensor: The LISST-SL is shipped to you with caps on the intake and pitot tube openings, and on the underwater connector. Remove all for use, but keep them covered when in storage. A flexible tube is also attached to the water exit end. Leave this as is. It will be used for acquiring the in-situ Background file. B-Reel: Recall from Chapter I that the B-reel is a battery-powered or manually operated winch, with a strong steel cable. The cable has a conductor at center which makes the cable a 2-conductor wire. The free end of the cable is terminated to connect to the lifting point and to the electrical connector on the LISST-SL. For quick tests, it is not essential to have the B-reel between the LISST-SL and the TCB. A short cable is provided so that you may directly connect the LISST-SL to the TCB. The electrical termination of the steel cable should always be protected from shorts. If you did not purchase the B-reel from Sequoia, you will need to terminate the free end of the steel cable. The pin-outs for wiring are in Appendix F. The Topside Control Box (TCB): In order to make the LISST-SL user-friendly and self-contained, i.e. not needing a computer, the TCB was developed. It encloses the battery and the computer that responds to the touch-screen commands, controls the display, and also stores data. An intuitive menu-driven interface has been created. When the power switch is

LISST-SL V2.1 User’s Guide
12
Setup Menu
Set Units
pressed on the TCB, first a brief picture of the LISST-SL is flashed. After that, the main menu appears. The main menu is where you make the key selections: The SETUP button is for settings on the firmware of the TCB (e.g. setting the clock, units etc.). The CALIBRATE button is to collect a Background Scatter file. The MEASURE button is to operate the instrument to collect data. We now describe details of operation. These same guidelines are also graphically shown on the Quick Reference Sheet attached to the inside of the lid of the TCB. SET UP: Pressing the SETUP button takes you to a panel with 4 choices – (i) Set Clock, (ii) Set Units, (iii) List saved files, and (iv) Delete saved files. From each of these, you return to the SETUP menu by pressing the CANCEL button at bottom right. Pressing the CANCEL button again, from the SETUP menu takes you back to the MAIN MENU. Now, more details.
First the small buttons: Click on the symbol at bottom center, and you will see a panel showing information on the instrument. Pressing the Done button returns to the Setup Menu.
The button leads you to an option to set pump speed. Leave it on Auto. For some laboratory work, e.g. to blast the water channel at high velocity for cleaning or for blowing out sediment in the system, choose MAX power. Press cancel to return to Main Menu. To set clock, press the SET CLOCK button. A new screen will open and guide you to set the current time. Use the key pad to set the date and time in the displayed format. Please note that the date format is mm:dd:yy. Once you have set up the clock and date, check the SET CLOCK button at the bottom of the screen. By pressing the CANCEL, you will go back to the Setup Menu above. You may next choose to set the units of the display, e.g. British units (feet, pounds,.) or SI units (m, Kg etc.). Temperature is always only displayed in
oC. From the Set
Up menu, choose Set Units. The display on left gives you the simple option to press the FEET or METERS button to set display in your chosen units. Again, press the CANCEL button to return to the SETUP menu. The remaining choice on the SETUP menu is to display a list of saved data files. The list only shows the .asc files,

LISST-SL V2.1 User’s Guide
13
Files to delete CALIBRATE
Clean Water Calibration
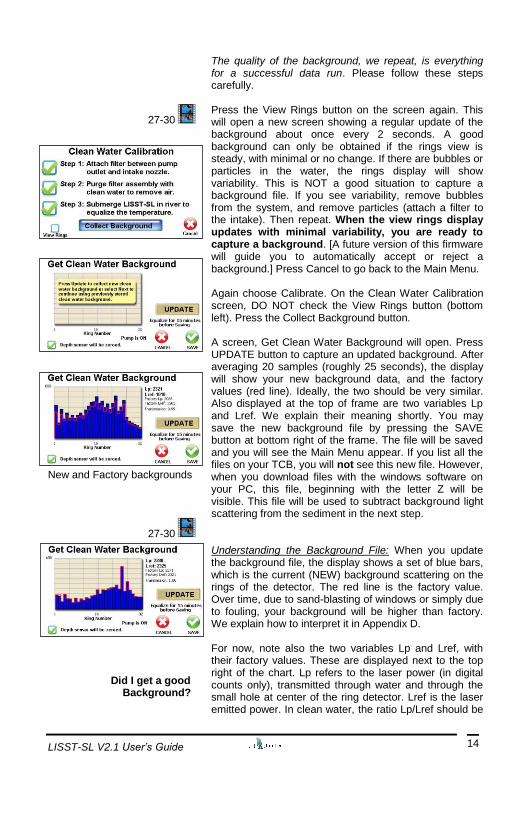
although all associated files have also been saved. There are no options to change the list of files saved. Again, press CANCEL to return to the SETUP menu. Selecting the DELETE FILES button from the Set Up menu opens a window with a list of all saved files. You may now select the file that you wish to delete. You may select only one file at a time to delete by using your Pen and by pressing on the file name. The next panel shows all files with the same root name that will be deleted. Whether you select yes or no, you will return to the SETUP menu. To delete more than one file at a time, you must use the Windows program provided separately for your PC. CAUTION: Once the files are deleted, they can not be recovered. Press CANCEL again to return to the MAIN MENU. You have completed the SET UP of the TCB. You are now ready to learn the next 2 operations: capturing a Background file, and then the real thing – river data (or data from a laboratory system). CALIBRATION: Recall that the Calibrate function records a Background file. This file contains measurements of light scattered from imperfections of optics on the 32 ring detectors. A few other parameters are also stored. This file is CRITICAL to the quality of data you will obtain with the MEASURE function. You must never skip the Calibrate step. Preparing the LISST-SL sensor for the Calibrate step is described in the next sections. Here we describe TCB operation only. To record the Background file for a particular experiment, open the MAIN MENU. Recall that you enter the MAIN MENU by either turning on power, or by hitting CANCEL button from any menu a few times. Once on the MAIN MENU panel, press the CALIBRATE button. A new window opens titled Clean Water Calibration. It is a helpful guide to remind the user to perform 3 steps to prepare the LISST-SL instrument to acquire a background file. These steps are fairly intuitive, but will be described in more detail in the section Field Experiment. After each step is performed, press the check box. After checking all boxes, press View Rings button on bottom left. This button enables you to view the background in comparison to its ideal, factory value (red line).
LISST-SL V2.1 User’s Guide
14
27-30
New and Factory backgrounds
27-30 Did I get a good Background?
The quality of the background, we repeat, is everything for a successful data run. Please follow these steps carefully. Press the View Rings button on the screen again. This will open a new screen showing a regular update of the background about once every 2 seconds. A good background can only be obtained if the rings view is steady, with minimal or no change. If there are bubbles or particles in the water, the rings display will show variability. This is NOT a good situation to capture a background file. If you see variability, remove bubbles from the system, and remove particles (attach a filter to the intake). Then repeat. When the view rings display updates with minimal variability, you are ready to capture a background. [A future version of this firmware will guide you to automatically accept or reject a background.] Press Cancel to go back to the Main Menu. Again choose Calibrate. On the Clean Water Calibration screen, DO NOT check the View Rings button (bottom left). Press the Collect Background button. A screen, Get Clean Water Background will open. Press UPDATE button to capture an updated background. After averaging 20 samples (roughly 25 seconds), the display will show your new background data, and the factory values (red line). Ideally, the two should be very similar. Also displayed at the top of frame are two variables Lp and Lref. We explain their meaning shortly. You may save the new background file by pressing the SAVE button at bottom right of the frame. The file will be saved and you will see the Main Menu appear. If you list all the files on your TCB, you will not see this new file. However, when you download files with the windows software on your PC, this file, beginning with the letter Z will be visible. This file will be used to subtract background light scattering from the sediment in the next step. Understanding the Background File: When you update the background file, the display shows a set of blue bars, which is the current (NEW) background scattering on the rings of the detector. The red line is the factory value. Over time, due to sand-blasting of windows or simply due to fouling, your background will be higher than factory. We explain how to interpret it in Appendix D. For now, note also the two variables Lp and Lref, with their factory values. These are displayed next to the top right of the chart. Lp refers to the laser power (in digital counts only), transmitted through water and through the small hole at center of the ring detector. Lref is the laser emitted power. In clean water, the ratio Lp/Lref should be
LISST-SL V2.1 User’s Guide
15
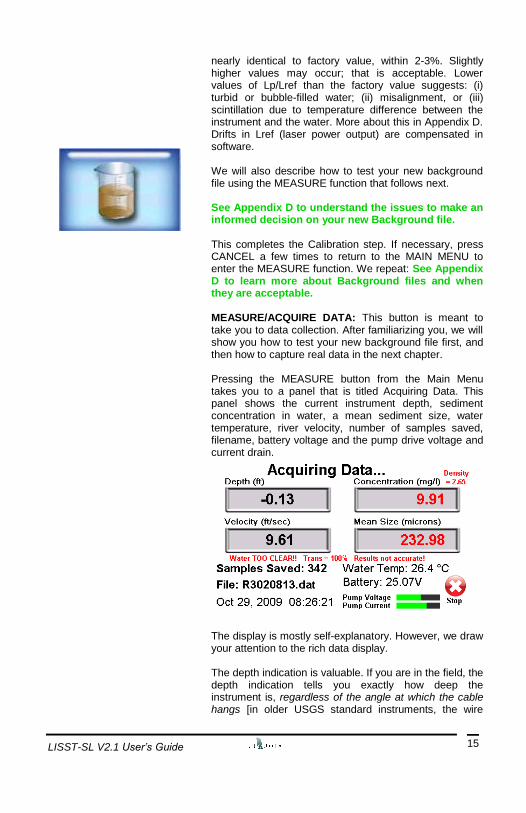
MEASURE
nearly identical to factory value, within 2-3%. Slightly higher values may occur; that is acceptable. Lower values of Lp/Lref than the factory value suggests: (i) turbid or bubble-filled water; (ii) misalignment, or (iii) scintillation due to temperature difference between the instrument and the water. More about this in Appendix D. Drifts in Lref (laser power output) are compensated in software. We will also describe how to test your new background file using the MEASURE function that follows next. See Appendix D to understand the issues to make an informed decision on your new Background file. This completes the Calibration step. If necessary, press CANCEL a few times to return to the MAIN MENU to enter the MEASURE function. We repeat: See Appendix D to learn more about Background files and when they are acceptable. MEASURE/ACQUIRE DATA: This button is meant to take you to data collection. After familiarizing you, we will show you how to test your new background file first, and then how to capture real data in the next chapter. Pressing the MEASURE button from the Main Menu takes you to a panel that is titled Acquiring Data. This panel shows the current instrument depth, sediment concentration in water, a mean sediment size, water temperature, river velocity, number of samples saved, filename, battery voltage and the pump drive voltage and current drain. The display is mostly self-explanatory. However, we draw your attention to the rich data display. The depth indication is valuable. If you are in the field, the depth indication tells you exactly how deep the instrument is, regardless of the angle at which the cable hangs [in older USGS standard instruments, the wire

LISST-SL V2.1 User’s Guide
16
Now, back to Testing your New Background File
Battery Caution
angle is used to estimate depth, or error in depth]. If the background was acquired recently, the depth should show a small value (if the LISST-SL is in the lab, or held just below water surface in a river). The sediment concentration is displayed in units of mass per volume. This display assumes a mass density of 2.65 g/ml. If you believe the mass density to be different, a correction will need to be applied to your final processed results. In field use, the velocity display will fluctuate with the passage of turbulent eddies, and also due to the movement of the cable itself. However, unreasonable fluctuations may be due to bubbles in the pitot tube. See Appendix B for instructions on how to remove bubbles. The Mean Size on the display is calculated using a simplified method and is not an exact match to the data you will process on your PC after downloading. In extremely clear waters, this number may be erratic. With increasing turbidity, this number becomes stable. Note the display of number of samples saved in the data file, the filename, the date and local time, the water temperature, and the state of the battery. Pump supply voltage and current are displayed in a crude semi-quantitative way. The purpose of this is to help you identify if the pump is operating. Do not try to interpret this display in a quantitative way. Digital data on pump voltage and current are saved in data files. To stop data acquisition, the STOP button at bottom right of the display is pressed. Testing the New Background File: The idea is that if you measure non-existing sediments in the same clean water that you used to get your background, the concentrations should be small. So, to test your background, from the MAIN MENU, press the MEASURE button. If the background file is good, the Concentration display will show small values, of magnitude 0-3 mg/l. This means the background is good. In our laboratory, this number is often much less than 1 mg/l. Large and unsteady values imply a bad background file (unless, of course, your water has since become contaminated!). The TCB is programmed to give you a sound alert when the battery voltage drops to 21.5V. At this time, there is about 20 minutes of life left on the battery. If you do not shut down, the instrument will itself shut down when battery drops to 20V.
LISST-SL V2.1 User’s Guide
17
DO NOT TRY TO CHARGE THE BATTERY WHEN THE TCB IS IN USE. THE BATTERY WILL NOT ACCEPT CHARGE. ALWAYS SHUT DOWN POWER FIRST. Pressing the STOP button from this panel takes you back to the Main Menu. That completes a description of the use of the TCB.
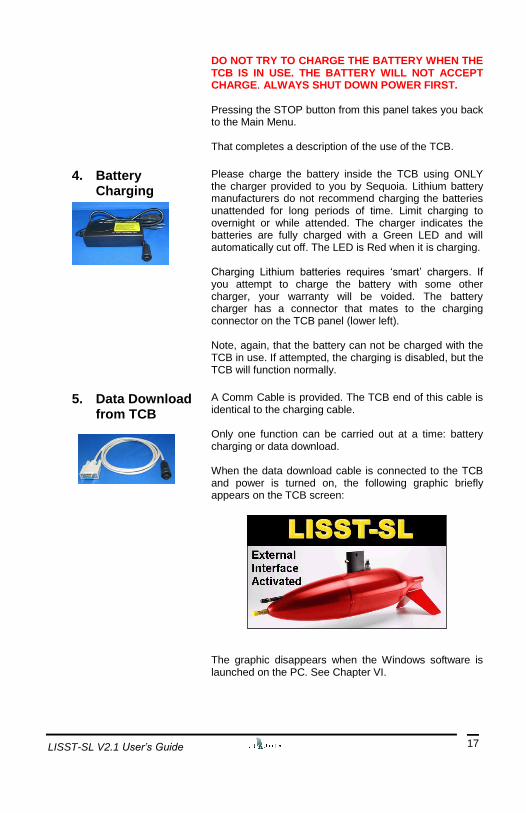
4. Battery Charging
Please charge the battery inside the TCB using ONLY the charger provided to you by Sequoia. Lithium battery manufacturers do not recommend charging the batteries unattended for long periods of time. Limit charging to overnight or while attended. The charger indicates the batteries are fully charged with a Green LED and will automatically cut off. The LED is Red when it is charging. Charging Lithium batteries requires ‘smart’ chargers. If you attempt to charge the battery with some other charger, your warranty will be voided. The battery charger has a connector that mates to the charging connector on the TCB panel (lower left). Note, again, that the battery can not be charged with the TCB in use. If attempted, the charging is disabled, but the TCB will function normally.
5. Data Download from TCB
A Comm Cable is provided. The TCB end of this cable is identical to the charging cable. Only one function can be carried out at a time: battery charging or data download. When the data download cable is connected to the TCB and power is turned on, the following graphic briefly appears on the TCB screen:
The graphic disappears when the Windows software is launched on the PC. See Chapter VI.
LISST-SL V2.1 User’s Guide
18
IV. Using the LISST-SL System in a Laboratory
1. First Assembly and Test in Laboratory
14,20,21
17,18,19
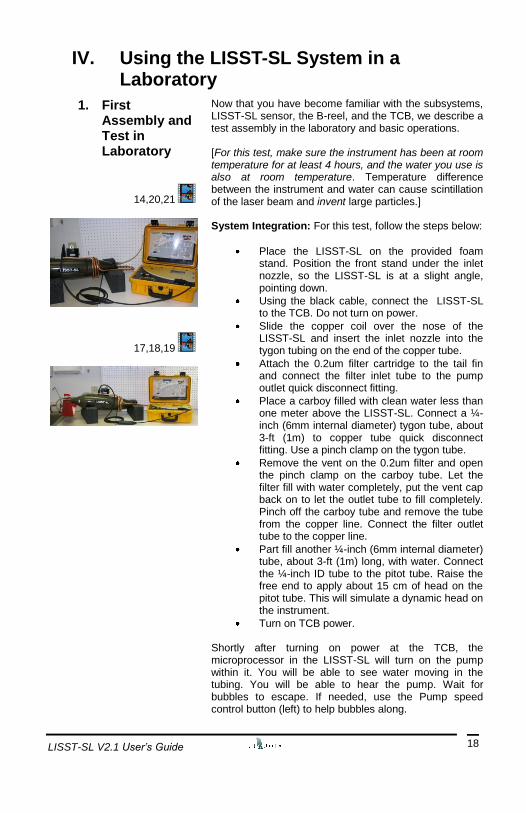
Now that you have become familiar with the subsystems, LISST-SL sensor, the B-reel, and the TCB, we describe a test assembly in the laboratory and basic operations. [For this test, make sure the instrument has been at room temperature for at least 4 hours, and the water you use is also at room temperature. Temperature difference between the instrument and water can cause scintillation of the laser beam and invent large particles.] System Integration: For this test, follow the steps below:
Place the LISST-SL on the provided foam stand. Position the front stand under the inlet nozzle, so the LISST-SL is at a slight angle, pointing down.
Using the black cable, connect the LISST-SL to the TCB. Do not turn on power.
Slide the copper coil over the nose of the LISST-SL and insert the inlet nozzle into the tygon tubing on the end of the copper tube.
Attach the 0.2um filter cartridge to the tail fin and connect the filter inlet tube to the pump outlet quick disconnect fitting.
Place a carboy filled with clean water less than one meter above the LISST-SL. Connect a ¼-inch (6mm internal diameter) tygon tube, about 3-ft (1m) to copper tube quick disconnect fitting. Use a pinch clamp on the tygon tube.
Remove the vent on the 0.2um filter and open the pinch clamp on the carboy tube. Let the filter fill with water completely, put the vent cap back on to let the outlet tube to fill completely. Pinch off the carboy tube and remove the tube from the copper line. Connect the filter outlet tube to the copper line.
Part fill another ¼-inch (6mm internal diameter) tube, about 3-ft (1m) long, with water. Connect the ¼-inch ID tube to the pitot tube. Raise the free end to apply about 15 cm of head on the pitot tube. This will simulate a dynamic head on the instrument.
Turn on TCB power. Shortly after turning on power at the TCB, the microprocessor in the LISST-SL will turn on the pump within it. You will be able to see water moving in the tubing. You will be able to hear the pump. Wait for bubbles to escape. If needed, use the Pump speed control button (left) to help bubbles along.

LISST-SL V2.1 User’s Guide
19
SETUP
2. Background File acquisition
3. Instrument health check
Background good?
Pitot Tube clear?
Next proceed as follows:
On the TCB, from the MAIN MENU, use the SET UP button to set instrument clock, and units of operation. Return to the MAIN MENU.
Press the CALIBRATE button. Follow procedures as explained in the preceding section on TCB. Check off the 3 boxes, and then also check the View Rings button. At the next frame, press View Rings button again. In the background collection mode, the pump runs at full power. If the rings view is steady, cancel out, and re-enter the Background mode. Press Update to capture a new Background file following procedure described in the introduction to the TCB. It will be named automatically. The new background is shown in contrast to factory values.
If your background is very similar to the factory value, the optics are in good health. If not, check which of the following applies to your data, and what it means.
Your background is higher than factory background in the middle rings. This means the optics can be cleaned. Dirt on the windows of the test cell can explain this excess light.
The inner rings show large amount of light, but the Lp and Lref ratio is nearly same as factory value. This may be due to scintillation; it means that water and instrument temperatures are not sufficiently close.
The inner rings show large values AND the Lp/Lref ratio is smaller than factory. In this case, misalignment of optics is indicated. If the Lp/Lref ratio is 90% of factory value or lower, you may need to have the optics adjusted by a trained technician. Please contact your in-country Distributor or contact Sequoia.
We hope none of the above errors occur. If so, the instrument is in good shape! Now, still with the clean water in circulation, cancel out of the Calibrate mode and press the MEASURE button to test your background, as before. The display will show small values on the concentration if the background file was good. If not, capture another background (make sure the view rings function shows steady rings). Check if Pitot Tube is free of air: Air in the pitot system can cause faulty operation of the iso-kinetic pump controller. The simplest test is as follows.
LISST-SL V2.1 User’s Guide
20
4. Collecting
Test Data in a Lab
Set up a head on the pitot tube as in the last test. Apply about 10 cm of head.
Turn on the TCB and go directly to MEASURE.
Observe the indicated velocity on the display. It should be fairly steady. Its magnitude should also be consistent with the formula:
Velocity (ft/sec) = 8 H fps; H in feet. Or,
Velocity (m/sec) = 4.43 H m/s; H in meters
If the numbers show more than 10% variability, try again. If the variability persists, you may need to purge air from the pitot tube. This procedure is described in Appendix B.
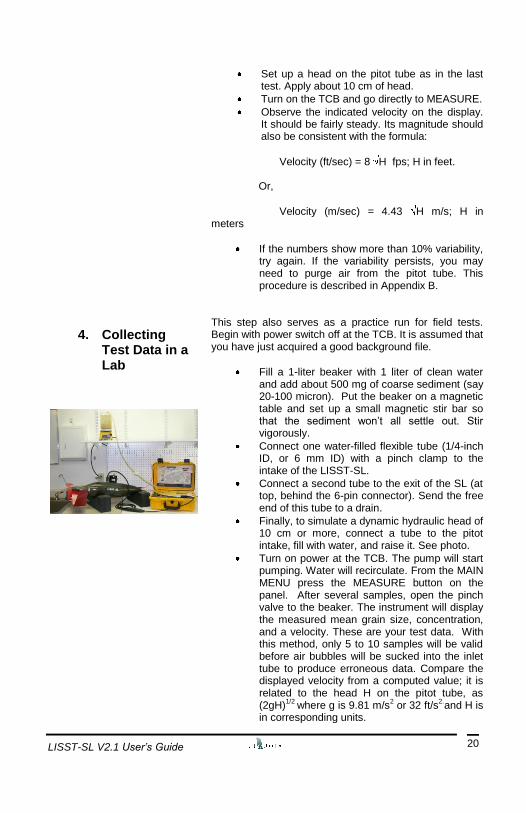
This step also serves as a practice run for field tests. Begin with power switch off at the TCB. It is assumed that you have just acquired a good background file.
Fill a 1-liter beaker with 1 liter of clean water and add about 500 mg of coarse sediment (say 20-100 micron). Put the beaker on a magnetic table and set up a small magnetic stir bar so that the sediment won’t all settle out. Stir vigorously.
Connect one water-filled flexible tube (1/4-inch ID, or 6 mm ID) with a pinch clamp to the intake of the LISST-SL.
Connect a second tube to the exit of the SL (at top, behind the 6-pin connector). Send the free end of this tube to a drain.
Finally, to simulate a dynamic hydraulic head of 10 cm or more, connect a tube to the pitot intake, fill with water, and raise it. See photo.
Turn on power at the TCB. The pump will start pumping. Water will recirculate. From the MAIN MENU press the MEASURE button on the panel. After several samples, open the pinch valve to the beaker. The instrument will display the measured mean grain size, concentration, and a velocity. These are your test data. With this method, only 5 to 10 samples will be valid before air bubbles will be sucked into the inlet tube to produce erroneous data. Compare the displayed velocity from a computed value; it is related to the head H on the pitot tube, as (2gH)
1/2 where g is 9.81 m/s
2 or 32 ft/s
2.and H is
in corresponding units.

LISST-SL V2.1 User’s Guide
21
5. Temporary Storage
Draining Turbid Water
A recirculating method of sampling can be implemented by sending the drain line back to the beaker. Data accuracy will suffer due to sediment settling in or releasing from the pump cavity and bubbles being introduced from the pump. These effects can be minimized, but the best results will be obtained from a well mixed single pass through source.
Download data from the instrument to your PC and process it. See Chapter VI. Turn off power on the TCB. You can now store the instrument. TO AVOID FOULING THE INTERNAL WINDOWS. ALWAYS DRAIN ALL TURBID WATER OUT OF THE SYSTEM BEFORE STORAGE. A simple way to do this is to remove the intake tube from the turbid water tank and put it in a clean water tank. Turn on TCB power, and select Calibrate. The pump will run full power. Pump a few liters of clean water through. You may add a little bleach to prevent algae growth in the water passage and pump. To prevent air from entering the pitot tube, cover the pitot opening with a pinched tube.
LISST-SL V2.1 User’s Guide
22
V. Field Deployment
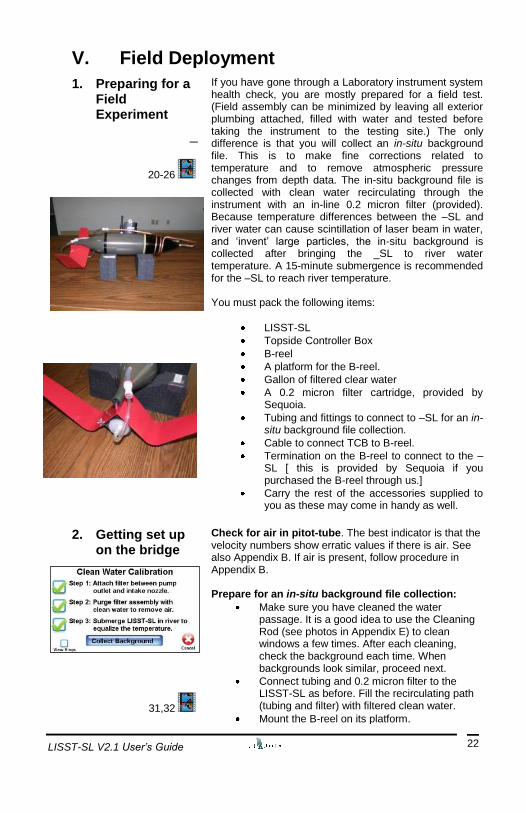
1. Preparing for a Field Experiment
20-26
If you have gone through a Laboratory instrument system health check, you are mostly prepared for a field test. (Field assembly can be minimized by leaving all exterior plumbing attached, filled with water and tested before taking the instrument to the testing site.) The only difference is that you will collect an in-situ background file. This is to make fine corrections related to temperature and to remove atmospheric pressure changes from depth data. The in-situ background file is collected with clean water recirculating through the instrument with an in-line 0.2 micron filter (provided). Because temperature differences between the –SL and river water can cause scintillation of laser beam in water, and ‘invent’ large particles, the in-situ background is collected after bringing the _SL to river water temperature. A 15-minute submergence is recommended for the –SL to reach river temperature. You must pack the following items:
LISST-SL
Topside Controller Box
B-reel
A platform for the B-reel.
Gallon of filtered clear water
A 0.2 micron filter cartridge, provided by Sequoia.
Tubing and fittings to connect to –SL for an in-situ background file collection.
Cable to connect TCB to B-reel.
Termination on the B-reel to connect to the –SL [ this is provided by Sequoia if you purchased the B-reel through us.]
Carry the rest of the accessories supplied to you as these may come in handy as well.
2. Getting set up on the bridge
31,32
Check for air in pitot-tube. The best indicator is that the velocity numbers show erratic values if there is air. See also Appendix B. If air is present, follow procedure in Appendix B. Prepare for an in-situ background file collection:
Make sure you have cleaned the water passage. It is a good idea to use the Cleaning Rod (see photos in Appendix E) to clean windows a few times. After each cleaning, check the background each time. When backgrounds look similar, proceed next.
Connect tubing and 0.2 micron filter to the LISST-SL as before. Fill the recirculating path (tubing and filter) with filtered clean water.
Mount the B-reel on its platform.
LISST-SL V2.1 User’s Guide
23
Place the TCB on the platform in a safe secure place.
Connect power cable from TCB to the slip ring on the B-reel.
Connect the LISST-SL underwater connector to the termination of the B-reel.
Remove any caps on the pitot tube.
Lower the instrument in water. Hold just below the surface.
Tie off the platform to the bridge rail or otherwise secure the system to prevent accidents.
Turn on power at the TCB.
Press the SETUP button, set clock and units. Return to MAIN MENU.
Press CALIBRATE button.
Follow directions. Check that Steps 1-3 are done, and ‘check’ them by touching the screen.
Press the COLLECT BACKGROUND button.
Press UPDATE. When data looks favorable compared to factory values, press SAVE.
When finished, press CANCEL button to go back to MAIN MENU.
Test your background: with the instrument still in river with the filter etc. connected, use the MEASURE button to view Concentration. If it is in the range of approximately 1 mg/l, the background is good.
Cancel, and stop the instrument. Pull up the LISST-SL to remove filter etc.
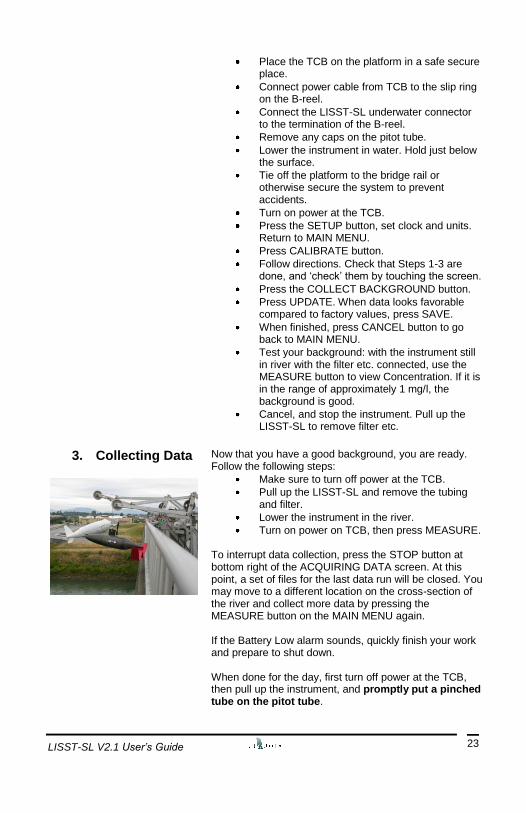
3. Collecting Data
Now that you have a good background, you are ready. Follow the following steps:
Make sure to turn off power at the TCB.
Pull up the LISST-SL and remove the tubing and filter.
Lower the instrument in the river.
Turn on power on TCB, then press MEASURE. To interrupt data collection, press the STOP button at bottom right of the ACQUIRING DATA screen. At this point, a set of files for the last data run will be closed. You may move to a different location on the cross-section of the river and collect more data by pressing the MEASURE button on the MAIN MENU again. If the Battery Low alarm sounds, quickly finish your work and prepare to shut down. When done for the day, first turn off power at the TCB, then pull up the instrument, and promptly put a pinched tube on the pitot tube.
LISST-SL V2.1 User’s Guide
24
4. Shutting Down Always, first turn off power at the TCB to avoid electrical shorts while disassembling equipment. Again, make sure the pitot tube is pinched off. You may delete unwanted files at this time. However, it is a good idea to do that after downloading ALL files on a PC. To delete unwanted files, if you decide to do so, turn on power on the TCB, go to SETUP, then choose DELETE FILES from the menu. Follow procedures described in section 3.1
5. Clean up Always immediately cover the pitot tube with a pinched tube or plastic cap provided with the instrument. It is a good idea to wash the exterior of the instrument and remove sediment from the pressure ports and connector area. Attach a clean water tube to the intake of the LISST-SL and wash out the internal surfaces by passing a strong flow of water through. If preparing to store for a long duration, it is a good idea to run chlorinated water through the system to prevent biological growth on the internal surfaces.
6. Viewing Saved Data
The next Section describes opening and processing the .dat raw binary data files. All other files can be opened and viewed with standard Windows software.
LISST-SL V2.1 User’s Guide
25
VI. Software Installation and Viewing Data
1. Overview Each data collection exercise produces a large number of data files. These were described in Section 2.6. To recap, the following files are produced:
Rxxxxxxx.TXT Text file with details of all related files below. Contains ‘memory’ of when created, instrument serial number, firmware version in TSB, name of file with Concentration and Mean Size; name of Raw Scattering data binary file; associated background file (Z***,asc below) , and units Zxxxxxxx.ASC Background scatter file, used for processing .dat file. Rxxxxxxx.CSV Comma-separated file, saves data displayed on TCB during data collection. Contains Date, Time, Depth, Velocity, Mean Size, TSS, Temperature, Optical Transmission, Pump state (1 =ON, 0=OFF), and Battery Voltage. Rxxxxxxx.DAT Binary data file, 50 variables per record. See Appendix A to see order of variables (needed if processing data in Matlab).
The Particle Size Distribution, which contains the 32-bin size distributions are created , from post-processing .dat file through the Windows software. These Particle Size Distribution files have the name Rxxxxxxx.psd. See Appendix A for order of variables in the .psd files. You will notice that so far, even including a field test, no PC use was required. The Windows Software provided by Sequoia is needed only to process the .dat binary data file. You will only process one file: the .dat file on your PC. This is the raw binary data file. Processing this file takes some time, hence it is done on a PC. It produces the size distribution file, .psd . To process the file, you will need 2 other files: the background saved with this file, and the ringarea file (provided with the software). The software always needs calibration parameters of the instrument which are included in the .ini file. In the next step, you will load software on your PC.
2. Software Installation
Load the CD supplied to you with the instrument, and type setup when ready. The software will be installed in a folder selected by you. Create a short-cut to the executable program on your desktop.
LISST-SL V2.1 User’s Guide
26
3. Learning the Software
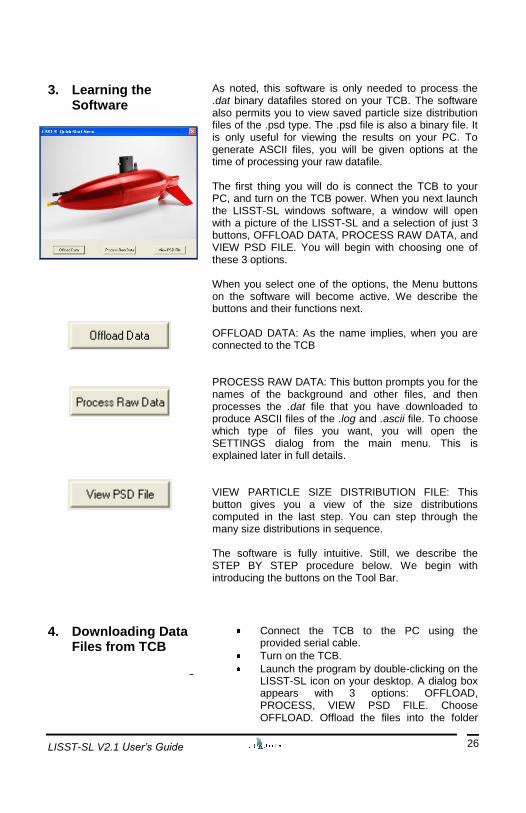
As noted, this software is only needed to process the .dat binary datafiles stored on your TCB. The software also permits you to view saved particle size distribution files of the .psd type. The .psd file is also a binary file. It is only useful for viewing the results on your PC. To generate ASCII files, you will be given options at the time of processing your raw datafile. The first thing you will do is connect the TCB to your PC, and turn on the TCB power. When you next launch the LISST-SL windows software, a window will open with a picture of the LISST-SL and a selection of just 3 buttons, OFFLOAD DATA, PROCESS RAW DATA, and VIEW PSD FILE. You will begin with choosing one of these 3 options. When you select one of the options, the Menu buttons on the software will become active. We describe the buttons and their functions next. OFFLOAD DATA: As the name implies, when you are connected to the TCB PROCESS RAW DATA: This button prompts you for the names of the background and other files, and then processes the .dat file that you have downloaded to produce ASCII files of the .log and .ascii file. To choose which type of files you want, you will open the SETTINGS dialog from the main menu. This is explained later in full details. VIEW PARTICLE SIZE DISTRIBUTION FILE: This button gives you a view of the size distributions computed in the last step. You can step through the many size distributions in sequence. The software is fully intuitive. Still, we describe the STEP BY STEP procedure below. We begin with introducing the buttons on the Tool Bar.
4. Downloading Data Files from TCB
Connect the TCB to the PC using the provided serial cable.
Turn on the TCB.
Launch the program by double-clicking on the LISST-SL icon on your desktop. A dialog box appears with 3 options: OFFLOAD, PROCESS, VIEW PSD FILE. Choose OFFLOAD. Offload the files into the folder
LISST-SL V2.1 User’s Guide
27
that you wish to use later. If the LISST-SL software is already running, choose the Quick Launch button under the File menu option. Then select Offload Data button.
This completes the download process. You may select another file to download the same way. You can also select a number of files at once to download by following procedures identical to the Microsoft File Manager.
5. Processing Raw Data File
This button processes your raw data file to produce files containing size distributions. After downloading data, or directly from the Quick Launch button, press the PROCESS RAW DATA button. You will be prompted to select the file to process, the instrument serial number, and the background file that was collected with this data file. The processing takes very little time, and is typically finished in a few seconds to a few tens of seconds, depending on file size. A size distribution file of the .psd type, and of the .asc type will result.
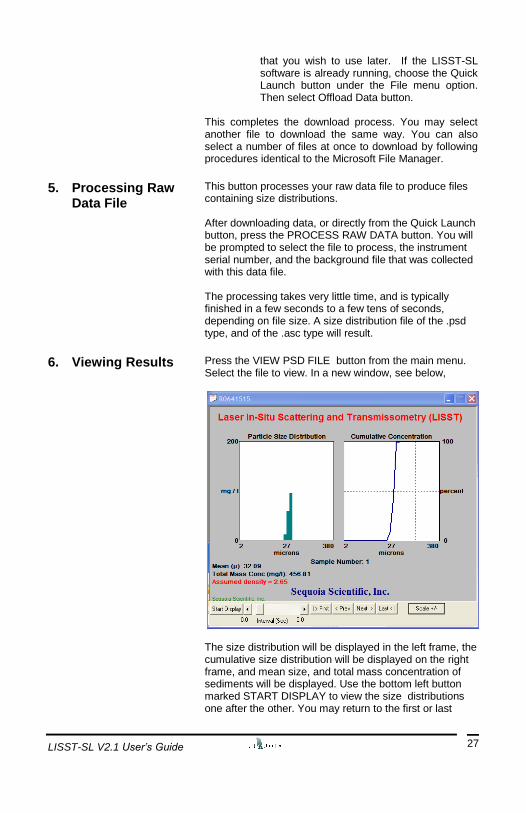
6. Viewing Results Press the VIEW PSD FILE button from the main menu. Select the file to view. In a new window, see below,
The size distribution will be displayed in the left frame, the cumulative size distribution will be displayed on the right frame, and mean size, and total mass concentration of sediments will be displayed. Use the bottom left button marked START DISPLAY to view the size distributions one after the other. You may return to the first or last
LISST-SL V2.1 User’s Guide
28
sample and review the data. The scale on the ordinate (y-axis) of the size distribution can be adjusted at any time using the Scale button, bottom right.
7. Formats of Results file
The formats of all files, (.txt, .csv, and .asc) are provided in Appendix A.
8. Presenting Results
Sequoia Scientific, Inc. does not provide software for you to prepare your reports. You may load the .csv and/or .asc files into any plotting software for report preparation. If using Excel, note that the .csv file is a comma-separated-variable file.
LISST-SL V2.1 User’s Guide
29
VII. Handling, Cleaning, Maintenance and Storage
1. Handling
When handling the instrument, at all times please remember that the LISST-SL is a high-precision optical instrument.
Avoid mechanical shocks and impact to the LISST-SL or the TCB as this may cause misalignment of the optical parts, or damage to electronic assemblies.
Avoid scratching the touch panel display.
2. Cleaning
Clean the LISST-SL body with water each time after use, and before storage. It is a good idea to connect a hose to the intake and run tap water through the system. This removes any grains that may have accumulated in the pump. Remove the pitot tube cap and clean the screen. Replace. Remove the red tapered plug form the top static port. Flush water through all three static ports. Replace the tapered plug and put a rubber band around the sensor over the ports. Clean the panel of the TCB using only a soft cloth. Never apply abrasives or abrasive surfaces to the touch panel. It scratches easily.
Do not use abrasive cleaners.
NEVER use solvents such as toluene or acetone
for cleaning the TCB. If you do so the warranty will be immediately voided!

LISST-SL V2.1 User’s Guide
30
For cleaning of the windows inside the test section of the LISST-SL, see Appendix C.
3. Storage
Put plastic caps on the intake and pitot tube openings. Place the LISST-SL on its foam stands or inside the shipping box. Before storage, be sure to turn off power on the TCB. Extended storage may cause weakening of the battery. You should recharge the battery before use if the TCB has not been used for long (month or more). If preparing to store the instrument system for a long duration, it is a good idea to run chlorinated water through the system to prevent biological growth on internal surfaces. The same is recommended with the filter provided for Background file collection. The 5 pin connector on the LISST-SL sensor and the rectangular connectors that mate to the TCB should be dressed with a silicone lubricant spray to make insertion easier and to prevent damage to the rubber. A 5 pin Impulse plug and sleeve is provided to protect the connector on the LISST-SL when the sensor is not in use. The 3 pin Impulse plug should be put on the TCB connector and the rubber cover put on the communications connector to keep the connections dry and clean.
LISST-SL V2.1 User’s Guide
31
VIII. FAQ’s
How do I evaluate the background measurement?
Upon obtaining a background, the red line shows the factory background and the blue bars show the current background. If they are close, well and good. Increased scattering on the middle rings results from just one source: dirt or fine scratches on the windows.Try cleaning the windows a few times. They are acceptable. If you see increase in the inner-most rings, i.e. rings 1-8 the explanation is more complex. See Appendix D. In the end, what really matters is that the instrument is reasonably aligned, and that the background be STABLE. Try to MEASURE with the clean water that you used for Background. If the displayed concentration is small (<5mg/l), you may use the instrument, knowing that that is the noise floor.
Does the LISST-SL take into account the irregular shape of the natural sediment grains?
Yes. This was published in a study by our scientists (see Agrawal YC,Whitmire A, Mikkelsen OA, Pottsmith HC (2008); download from our website: http://www.sequoiasci.com/library/technical.aspx?SectionName=library). Our software that processes raw data files incorporates irregular particle shape.
Does the LISST-SL require any calibration?
No. All that is required is that the user makes a background measurement before a sample is taken. This is in order to evaluate the state and cleanliness of the optical system. If this is good (e.g. the current background measurement is close to the factory background, see FAQ above) the instrument will deliver good data. Drifts in laser power output are taken care of by the data processing software.
What happens if there are particle present outside of the size range covered by my LISST-SL?
This is a more complex question. Very briefly, the presence of sediment particles outside the size range covered by the instrument will cause some additional scattering on the inner- or outermost rings of the ring detector. In turn, this increased scattering will be interpreted as particle volume, so that the net effect is to increase the particle volume in the smallest and/or largest size classes. Typically, the effect can be seen if there is a significant amount of particles outside the size range, so that a rising tail will appear in the coarse and/or fine end of the size spectrum.
Does the instrument No. All laser diffraction based instruments measure the
LISST-SL V2.1 User’s Guide
32
measure NTU, FTU or any other turbidity units?
volume distribution of the suspended particles. This may or may not be related to NTU.
Can the LISST-SL be cross-calibrated with NTU’s
No. The calibration of the NTU unit itself is based on a specific size of particles. With changing grain size, NTU itself changes, and it is meaningless to do a cross-calibration.
Can I overcharge the rechargeable battery inside the instrument?
If you charge the battery with the power adaptor supplied by Sequoia as part of the instrument you cannot overcharge the battery.
Do you have an FAQ not answered here? Try the FAQ webpage on our website (http://www.SequoiaSci.com/faq/?SectionName=faq)! Otherwise contact us; see the front of this manual for detailed contact information.
LISST-SL V2.1 User’s Guide
33
APPENDIX A: File names, File Formats, and Size Classes
lisstsl.ini
File provided on the CD accompanying the instrument. Contains data on the instrument.
InstrumentData.txt
File containing information about the instrument. Here’s an example of content of one file for instrument Serial number 2005: [ S/N, instrument type C, ******, Calibration Constant, and the x denotes data are saved in high sensitivity mode] 2005, C, 8192, 1169, x
Factory_zsc_YYYY.asc
File containing the Background data on the instrument in format identical to the Background file (see later in this Appendix). The YYYY refers to instrument serial number.
Ringarea_2005.asc
A file used by the data processing program. It applies geometrical factors to raw data. Also used in processing data in MATLAB.
Rxxxxxxx.txt
Text File created with data. For easy reading. Contains information about the other files. Here is an example of one such file:
LISST-SL Data File Created on: Thursday, March 04, 2010 12:31:36 Day: 063 LISST-SL Serial number = 2005 Firmware Version 2.200 Mar 1 2010 16:45:31 Concentration and Mean Size Data in file: R0631231.csv Raw Scattering Data in binary file: R0631231.dat Background file used for Calculations: Z0620631.asc Units for Depth are Feet. Unit for Velocity are Feet/sec.
Rxxxxxxx.csv
Comma-separated file (opens in MS Excel), saves data displayed on TCB during data collection. Contains columns with these titles:
LISST-SL V2.1 User’s Guide
34
Rxxxxxxx.dat
Binary data file, 50 variables per record. All values are digital counts, and therefore are uncalibrated. A 200 byte header has also been added to the file format. The description of the 50 values is below.
Zxxxxxxx.ASC
Background file. The format is identical to the .dat file, shown above.
Rxxxxxxx.psd
Particle Size Distribution, from post-processing .dat file. It is a binary file, only used by the VIEW PSD FILE function on the PC software.
Rxxxxxxx.ASC
Particle Size Distribution, from post-processing .dat file. This is an ASCII file, for use with user’s plotting software or report preparation.

LISST-SL V2.1 User’s Guide
35

LISST-SL V2.1 User’s Guide
36
Size Classes: The size distribution is presented as concentrations of sediments in 32 size classes. The median diameter of each of the size classes is presented below.
Sizes (microns) Size Bin # Lower Upper Median
1 1.90 2.25 2.07 2 2.25 2.65 2.44 3 2.65 3.13 2.88 4 3.13 3.69 3.40 5 3.69 4.35 4.01 6 4.35 5.14 4.73 7 5.14 6.06 5.58 8 6.06 7.15 6.59 9 7.15 8.44 7.77 10 8.44 9.96 9.17 11 9.96 11.8 10.8 12 11.8 13.9 12.8 13 13.9 16.4 15.1 14 16.4 19.3 17.8 15 19.3 22.8 21.0 16 22.8 26.9 24.8 17 26.9 31.8 29.2 18 31.8 37.5 34.5 19 37.5 44.2 40.7 20 44.2 52.2 48.0 21 52.2 61.6 56.7 22 61.6 72.7 66.9 23 72.7 85.7 78.9 24 85.7 101 93.1 25 101 119 110 26 119 141 130 27 141 166 153 28 166 196 181 29 196 232 213 30 232 273 252 31 273 322 297 32 322 381 350

LISST-SL V2.1 User’s Guide
37
APPENDIX B: Purging the Pitot System This section is best understood by watching a video, Appendix G.:
Trouble spots
1-13
Purging air from Cavity
Nose Removal
O-ring Placement
The pitot tube system consists of the nozzle, the 35 micron screen in the pitot cap, a cavity between the nose section and the front bulk-head, and a differential pressure sensor. There are two places where problems may develop. First, at the screen in the pitot cap. Second, trapped air in the cavity. Cleaning the fine screen in the pitot cap is simple. Remove the screw-on pitot cap, remove the screen behind the o-ring, and replace with a cleaned or new screen. The removal of air from the cavity is more complex and requires some time and patience as you have to un-screw the nose section from the front bulkhead. You will then reassemble the nose to the bulkhead underwater in a tank. Preparation of the pitot velocity sensor prior to deployment can reduce the need for purging the instrument in the field. Remove the tail fin if it is necessary to fit it into a tank of water. A minimal tank size of 0.8 meter long, 0.3 meter wide, and 0.3 meter deep will be required for this process. With the provided nose wrench, remove the nose. The threads and the o-rings on the nose piece require special attention. Dirt in the threads can cause serious binding and prevent the proper alignment and sealing of the nose when screwing it back on. A good quality zinc anti-seize compound on the threads helps to secure the nose in place when re-assembling and prevents galling of the threads. After removing the nose: There are three o-rings inside the nose that need to be properly seated when the nose is screwed back on. One large o-ring (2-156) is a face seal outside the thread diameter. Two other o-rings are
LISST-SL V2.1 User’s Guide
38
Removing Bubbles
CAUTION: Pressure Limitations
around the center sampling hole with a plastic ring between the larger o-ring (2-015) against the nose and the smaller o-ring (2-012) that will seal against the bulkhead. Be careful to maintain the o-rings and spacer in place while removing dirt and bubbles from the cavity. A light coat of o-ring lubricant will help to hold the o-rings in place during reassembly. Submerge the nose and SL sensor. Remove the pitot cap. Clean the cap. Remove the 2-007 o-ring that holds the 35um screen in the bottom of the cap. Clean or replace the screen. Place it underwater and remove all bubbles from it. Remove the bubbles from the three radial static ports and the pitot port on the stainless steel plate on the face of the SL bulkhead. It is also helpful to remove any other bubbles from the mating pieces and threads as they may move during reassembling. The syringe provided can be helpful for dislodging bubbles. Various pumping schemes can also be used for cleaning and de-bubbling. The differential pressure sensor used for the pitot static velocity measurements is a delicate sensor. Since we are recommending water columns on the inlet for purging, it should be noted that the head should not be greater than 10 feet (3m). If other means of water flow to the passages are implemented, please be careful not to exceed 5 psi. Screw the nose onto the LISST-SL while it is still under water. Align the three white marks on the side. Screw on the pitot cap. At this point all accessible air has been removed from the passages leading up to the differential pressure sensor to the pitot tube system. Some bubbles can still reside in the solenoid of the system. Slight pressure and activation of the solenoid may be required to allow the bubbles to escape. Fill a one meter long ¼” tygon tube with water and attach it to the pitot cap (a short 3/8” diameter tube can be added
LISST-SL V2.1 User’s Guide
39
Final Purge
Checking Velocity Functionality
to adapt it to the pitot). Do not introduce any air in the tubing to the pitot cap. Raise the free end of the tubing above the water surface between 0.5 to 1 meter above the water surface. Plug in the power cable from the TCB to the SL sensor. Turn on the TCB. When the data light on the TCB is blinking, the audible clicking sound from the LISST-SL is the solenoid activating. Any bubbles that were in the system should escape within 15 minutes. As a quick check of the velocity sensor, a measured head can be applied to the pitot and the results viewed on the TCB. Set the column of water in the tubing at 30 cm (12 inches) above the water surface. Select the Measure mode on the TCB. The velocity should be approximately 2.4 m/sec (8 ft/sec). Lower the column water to 7 cm (3 inches) and the velocity should be approximately 1.2 m/sec (4 ft/sec). This verifies that the pitot tube system is functioning properly. Turn off the TCB. Remove the tubing and put a plastic cap or a short tube with a pinch clamp on the pitot. Put a rubber band around the sensor over the static ports. The pitot tube system is now ready for deployment. If for some reason the sensor is operated in air without caps on the pitot tube system, a meter length of tubing filled with water can be attached to the pitot nozzle and purged for 15 minutes at the deployment site.

LISST-SL V2.1 User’s Guide
40
APPENDIX C: Cleaning the Optics See also video:
15,16 After a deployment, connect a tygon tube to the sample intake fitting and flush it with clean water. A funnel is included in the accessories kit. Fill it with water and with a pinch clamp on the tygon tubing, capture a volume of water inside to keep the windows wetted until a convenient time and place is available for cleaning. Cleanliness of the optics can be determined by observing the ring values in the Background Calibration function. Cleaning should be repeated until the ring values do not decrease any further. Refer to Appendix D for a discussion on the acceptable quality of clean optics. Set the LISST-SL on the instrument stands. Angle the SL so the nose is higher than the nose (to prevent contamination from the pump cavity from flowing back onto the windows). Drain out all water, rinse it with clean water. Attach a cleaning patch on the cleaning rod using the tweezers provided. Wet the cleaning patch with the cleaning solution. Insert it into the sampling tube. Rotate it and stroke it over the last 3 cm of travel. The windows are 32 cm from the end of the sampling tube. Some resistance can be felt as the patch is passing between the windows. Repeat this procedure 3 or 4 times and rinse with clean water. Replace the cleaning patches frequently. To verify the cleanliness of the windows, check the View Rings function under the Background Calibration (check the View Rings box on the lower left). This will be like a normal calibration, but the View Rings screen will update after each sample. Since the pump is running whenever the LISST-SL is in the Background Calibration mode, a large clean water source or the copper tube loop including the 0.2 micron filter needs to be filled and purged first. If extensive cleaning is required, a pumping loop may help. Set up a circulating loop with an external pump. Pump from a one liter volume container through the LISST-SL and returning to the liter container. Add some cleaning solution or mild detergent to the water and let it circulate for 15 to 30 minutes. Letting the solution foam and having lots of bubbles helps to clean the windows. Even adding some sediment such as the AC Coarse will help. After this cleaning, a thorough rinsing will be necessary again. Water spots on the windows must be avoided. Do not leave water inside the LISST-SL to dry out. Either leave it filled with water (for short periods of time) or if uncertain when it will be used again, dry it out. Dry it out by draining the water through the tail. Leave the nose slightly elevated. Canned air can be used to blow the inside dry from the sample tube end. Check that the passage to the window is dry by inserting a clean patch on the cleaning rod. The LISST-SL is now ready for long term storage.
Photo showing instrument ready for recirculation of slightly soapy water for cleaning

LISST-SL V2.1 User’s Guide
41
LISST-SL V2.1 User’s Guide
42
APPENDIX D: Background Files
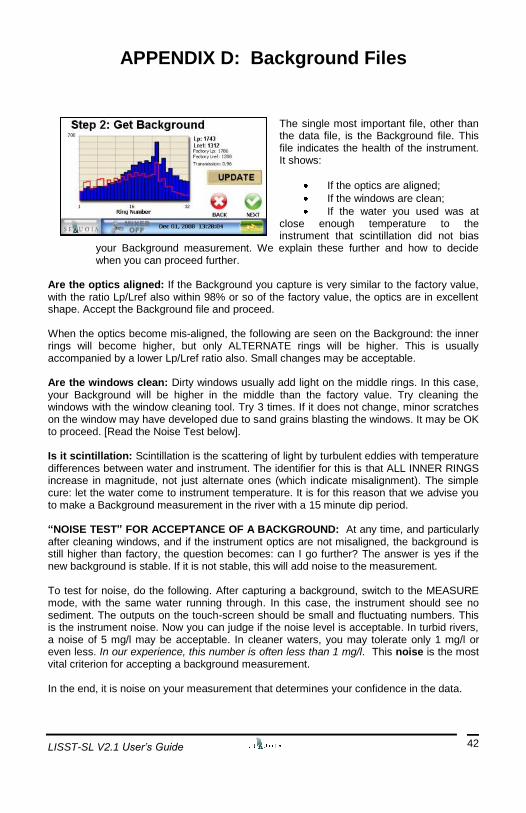
The single most important file, other than the data file, is the Background file. This file indicates the health of the instrument. It shows:
If the optics are aligned;
If the windows are clean;
If the water you used was at close enough temperature to the instrument that scintillation did not bias
your Background measurement. We explain these further and how to decide when you can proceed further.
Are the optics aligned: If the Background you capture is very similar to the factory value, with the ratio Lp/Lref also within 98% or so of the factory value, the optics are in excellent shape. Accept the Background file and proceed. When the optics become mis-aligned, the following are seen on the Background: the inner rings will become higher, but only ALTERNATE rings will be higher. This is usually accompanied by a lower Lp/Lref ratio also. Small changes may be acceptable. Are the windows clean: Dirty windows usually add light on the middle rings. In this case, your Background will be higher in the middle than the factory value. Try cleaning the windows with the window cleaning tool. Try 3 times. If it does not change, minor scratches on the window may have developed due to sand grains blasting the windows. It may be OK to proceed. [Read the Noise Test below]. Is it scintillation: Scintillation is the scattering of light by turbulent eddies with temperature differences between water and instrument. The identifier for this is that ALL INNER RINGS increase in magnitude, not just alternate ones (which indicate misalignment). The simple cure: let the water come to instrument temperature. It is for this reason that we advise you to make a Background measurement in the river with a 15 minute dip period. “NOISE TEST” FOR ACCEPTANCE OF A BACKGROUND: At any time, and particularly after cleaning windows, and if the instrument optics are not misaligned, the background is still higher than factory, the question becomes: can I go further? The answer is yes if the new background is stable. If it is not stable, this will add noise to the measurement. To test for noise, do the following. After capturing a background, switch to the MEASURE mode, with the same water running through. In this case, the instrument should see no sediment. The outputs on the touch-screen should be small and fluctuating numbers. This is the instrument noise. Now you can judge if the noise level is acceptable. In turbid rivers, a noise of 5 mg/l may be acceptable. In cleaner waters, you may tolerate only 1 mg/l or even less. In our experience, this number is often less than 1 mg/l. This noise is the most vital criterion for accepting a background measurement. In the end, it is noise on your measurement that determines your confidence in the data.
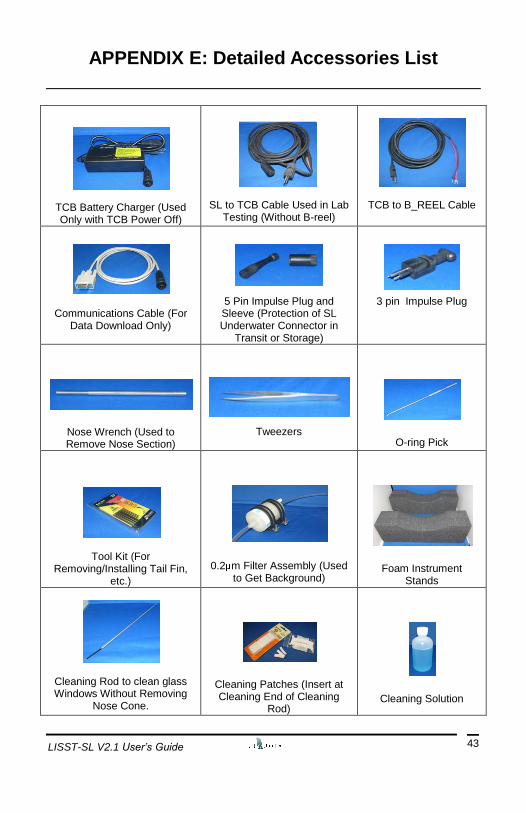
LISST-SL V2.1 User’s Guide
43
APPENDIX E: Detailed Accessories List
TCB Battery Charger (Used Only with TCB Power Off)
SL to TCB Cable Used in Lab
Testing (Without B-reel)
TCB to B_REEL Cable
Communications Cable (For
Data Download Only)
5 Pin Impulse Plug and Sleeve (Protection of SL Underwater Connector in
Transit or Storage)
3 pin Impulse Plug
Nose Wrench (Used to Remove Nose Section)
Tweezers
O-ring Pick
Tool Kit (For Removing/Installing Tail Fin,
etc.)
0.2 m Filter Assembly (Used to Get Background)
Foam Instrument Stands
Cleaning Rod to clean glass Windows Without Removing
Nose Cone.
Cleaning Patches (Insert at Cleaning End of Cleaning
Rod)
Cleaning Solution

LISST-SL V2.1 User’s Guide
44
Red Taper Plugs (for Plugging Pressure Sensor Ports)
35 m Screen Spares for Pitot Nozzle
Pins and Clips
Copper Cooling Coil
Rubber Bands (to Cover Pressure Ports)
Plastic Pitot Tube Caps for Pitot Tube Tozzle in
Storage
Plastic Intake Tube Caps
Syringes
3/8” x 3/8” Tube Adapter
½” x 3//8” Tube Adapter
Tube Adapter Clips
¼” ID Tygon Tubing
Hose Pinch Clamps
Wing Nuts to Hold Filter to Tail
ISO Coarse Sediment
LISST-SL Tail Fin
Tail fin Screws

LISST-SL V2.1 User’s Guide
45
APPENDIX F: B-Reel Cable Termination
The LISST-SL has a 5-pin underwater connector on the sensor. The inner wire on the B-Reel steel cable is the Power In for the LISST-SL. The Signal Ground is the outer jacket of the steel cable. Appropriate sealing and potting compounds should be used to maintain a waterproof isolated connection to the Power In. The wires for the Test Points are not used, and should be terminated and sealed. The text and illustrations below describe the wiring details for this connector. Communications and Power Connector (5 pin connector) Connector Manufacturer: Impulse Enterprise, Inc. San Diego, CA, USA Connector Part Number (Bulkhead): MCBH-5-MP Stainless Steel Mating Cable Part Number: MCIL-5-FS
Connector Pin # Use
1 Power /Signal Ground
2 Power In (+24VDC)
3 Test Point 1
4 Test Point 2
5 Test Point 3
LISST-SL V2.1 User’s Guide
46
APPENDIX G: List of Videos
1. Preparing to purge the nose by removing the tail fin.
2. Removing the nose.
3. Removing bubbles that are in the ports.
4. Taking out the pitot cap o-ring.
5. Removing the 35um filter screen inside the pitot cap.
6. Installing a 35um filter screen.
7. Clearing the bubbles out of the nose ports.
8. Removing the bubbles on the nose cone.
9. Purging the pitot cap.
10. Showing the o-rings in the nose cone.
11. Assembling the o-rings in the nose.
12. Screwing on the nose.
13. Adjusting the nose to the alignment marks.
14. Attaching the tail fin.
15. Attaching the cleaning patch to clean the optics.
16. Inserting the cleaning rod to clean the optics.
17. An example of a head pressure applied to the pitot tube.
18. Applying an artificial head on the pitot tube to purge the velocity sensor.
19. Purging through the pitot tube until water drips from the static port.
20. Mounting the 0.2um filter to the tail fin.
21. Attaching the copper tube for filtered background collection.
22. Filling the 0.2um filter.
23. Filling tubes and connecting filter outlet to the copper tube.
24. Connecting the filter outlet to the copper tube (on the correct side).
25. Connecting the SL to TCB cable.
26. Operating the TCB to purge the 0.2um filter.
27. Using the View Rings feature on the TCB.
28. An example of View Rings Before Cleaning the optics.

LISST-SL V2.1 User’s Guide
47
29. An example of View Rings After Cleaning the optics.
30. Switching from View Rings to Background Collection.
31. Connecting the B-Reel cable to the SL.
32. Connecting the TCB to B-Reel cable.

LISST-SL V2.1 User’s Guide
48
Warranty STATEMENT OF LIMITED, EXTENDED WARRANTY
This Statement of Limited, Extended Warranty applies to the products ("Products") being purchased by ("Customer") from Sequoia Scientific, Inc. ("SEQUOIA") pursuant to PO (the "Order"). The Products include, but are not necessarily limited to, the following:
LISST-SL Particle Size Analyzer Serial Number #
SEQUOIA and Customer agree as follows:
1. Limited Warranty
SEQUOIA warrants that upon delivery by SEQUOIA (a) the Products will be free from
defects in materials and workmanship, (b) the Products will perform substantially in
accordance with SEQUOIA's applicable specifications, and (c) any Products (or
components or parts thereof) that are manufactured by SEQUOIA do not infringe any U.S.
patent or copyright.
2. Correction of Non-Compliance
If any Product does not comply with the warranties set forth in 1(a) and 1(b) above,
SEQUOIA will, at its option, either (a) repair the Product, (b) replace the Product, or
(c) refund the purchase price paid by Customer to SEQUOIA for the Product; provided that
Customer gives SEQUOIA written notice of the noncompliance within one (1) year after
SEQUOIA's delivery of the Product (as the same may be extended for repaired or
replacement Products as provided for herein, the "Warranty Period"). If Customer does not
give SEQUOIA such written notice within the Warranty Period, then such warranties will be
satisfied in full. Customer will cooperate with SEQUOIA's efforts to repair or replace any
noncomplying Product. Without limiting the generality of the foregoing, Customer will
comply with SEQUOIA's request for return of any such Product to SEQUOIA (in which
event SEQUOIA will pay for round-trip shipment within the United States) or for access to
accomplish the repair or replacement on Customer's premises. As to any Product repaired
or replaced by SEQUOIA, the Warranty Period will end upon the later of one (1) year after
SEQUOIA's delivery of the original Product or 90 days after SEQUOIA's delivery of the
repaired or replacement Product. Any Product, component, part or other item replaced by
SEQUOIA becomes the property of SEQUOIA.
3. Infringement Indemnification
If any Product does not comply with the warranty set forth in 1(c) above, SEQUOIA will
defend and indemnify Customer against any third-party claim asserted in any proceeding
against Customer based on this noncompliance; provided that Customer gives SEQUOIA
prompt written notice of the claim, SEQUOIA has exclusive control over the defense and
settlement of the claim, Customer provides such assistance as SEQUOIA may request in
LISST-SL V2.1 User’s Guide
49
connection with the defense and settlement of the claim (in which event SEQUOIA will
reimburse the reasonable out-of-pocket costs incurred by Customer to provide such
assistance), Customer does not settle the claim without the prior written consent of
SEQUOIA and, upon SEQUOIA's request, Customer returns the Non-Complying Product to
SEQUOIA for modification, replacement or a refund of the purchase price paid by
Customer to SEQUOIA for the Non-Complying Product, less a reasonable allowance for
Customer's use prior to return.
4. Exclusive Warranties
THE WARRANTIES SET FORTH IN PARAGRAPH 1 ABOVE ARE EXCLUSIVE AND IN
LIEU OF ALL OTHER WARRANTIES, EXPRESS OR IMPLIED. SEQUOIA DISCLAIMS
ANY AND ALL WARRANTIES, EXPRESS OR IMPLIED (INCLUDING, BUT NOT LIMITED
TO, ANY IMPLIED WARRANTY OF MERCHANTABILITY OR FITNESS FOR A
PARTICULAR PURPOSE, AND ANY IMPLIED WARRANTY ARISING FROM COURSE
OF PERFORMANCE, COURSE OF DEALING, OR USAGE OF TRADE) OTHER THAN
THOSE SPECIFICALLY SET FORTH IN PARAGRAPH 1.
5. Exclusive Remedies
CUSTOMER'S RIGHTS AND REMEDIES SET FORTH IN PARAGRAPHS 2 AND 3
ABOVE ARE EXCLUSIVE AND IN LIEU OF ANY AND ALL OTHER RIGHTS AND
REMEDIES FOR ANY BREACH OF OR OTHER FAILURE TO COMPLY WITH ANY
WARRANTY WITH REGARD TO ANY PRODUCT.
6. No Consequential Damages
SEQUOIA will not be liable for any indirect, incidental, special or consequential damages,
any cover, or any loss of revenue, profit, data or use.
7. Limitations of Liability
SEQUOIA's liability (whether in contract, tort, or otherwise; and notwithstanding any fault,
negligence, strict liability or product liability) with regard to any Product (including, but not
limited to, any breach of or default under the Order by SEQUOIA) will in no event exceed
the purchase price paid by Customer to SEQUOIA for such Product. Further, SEQUOIA
will not be liable for, or be in breach of or default under the Order on account of, any delay
or failure to perform as a result of any cause, condition or circumstance beyond
SEQUOIA's reasonable control.
8. Statute of Limitations
Customer will not commence any action based on breach of warranty with respect to any
Product more than 18 months after SEQUOIA's delivery of such Product.
9. Software
LISST-SL V2.1 User’s Guide
50
The Products may include or be delivered with certain computer programs, databases or
other software that is proprietary to SEQUOIA. SEQUOIA hereby grants Customer a
nonexclusive license to use such software solely for the purpose of operating Products.
Customer will not: use any such software for any other purpose; modify, adapt, translate,
or create derivative works based on any such software; or disassemble, decompile or
reverse engineer any such software. No title to or ownership of any software or intellectual
property rights are transferred to Customer.
10. U.S. Government Restricted Rights Notice
All software, data, technical information, and written materials provided by SEQUOIA are
provided with restricted rights. Use, duplication, or disclosure by the government is subject
to restrictions as set forth in subparagraph (c)(1)(ii) of the Rights in Technical Data and
Computer Software clause at 48 C.F.R. § 252.227-7013 or in subparagraph (c)(2) of the
Commercial Computer Software-Restricted Rights clause at 48 C.F.R. § 52.227-19, as
applicable. Portions of these items may be unpublished. SEQUOIA reserves all rights
under applicable copyright laws.
11. Controlling Document
In the event of any conflict or inconsistency between any provision of this Statement of
Limited Warranty and any other provision of the Order, the provision of this Statement of
Limited Warranty will control.
12. Controlling Law
This Statement of Limited Warranty will be governed by the laws of the State of
Washington without reference to its rules relating to choice of law, except to the extent
preempted by the laws of the United States. The U.N. Convention on Contracts for the
International Sale of Goods will not apply.
CUSTOMER:
By:_______________________
______________
Title:______________________
______________
SEQUOIA:
Sequoia Scientific, Inc.
By:__________________________________
___
Title:_________________________________
___

LISST-SL V2.1 User’s Guide
51
NOTES

LISST-SL V2.1 User’s Guide
52
Copyright Sequoia Scientific, Inc. 2700 Richards Rd., Suite 107 Bellevue, WA 98005 http://www.SequoiaSci.com