Embed Size (px)
Citation preview

LIS research across 50 years:content analysis of journal articles
Kalervo J€arvelin and Pertti VakkariFaculty of Information Technology and Communication Sciences,
Tampere University, Tampere, Finland
Abstract
Purpose – This paper analyses the research in Library and Information Science (LIS) and reports on (1) thestatus of LIS research in 2015 and (2) on the evolution of LIS research longitudinally from 1965 to 2015.Design/methodology/approach –The study employs a quantitative intellectual content analysis of articlespublished in 30þ scholarly LIS journals, following the design by Tuomaala et al. (2014). In the content analysis,we classify articles along eight dimensions covering topical content and methodology.Findings – The topical findings indicate that the earlier strong LIS emphasis on L&I services has declinednotably, while scientific and professional communication has become the most popular topic. Informationstorage and retrieval has given up its earlier strong position towards the end of the years analyzed. Individualsare increasingly the units of observation. End-user’s and developer’s viewpoints have strengthened at the costof intermediaries’ viewpoint. LIS research is methodologically increasingly scattered since survey,scientometric methods, experiment, case studies and qualitative studies have all gained in popularity.Consequently, LIS may have become more versatile in the analysis of its research objects during the yearsanalyzed.Originality/value –Among quantitative intellectual content analyses of LIS research, the study is unique inits scope: length of analysis period (50 years), width (8 dimensions covering topical content and methodology)and depth (the annual batch of 30þ scholarly journals).
Keywords Content analysis, Statistical analysis, Information science, Library and information science,
Longitudinal study, Scholarly journal articles
Paper type Research paper
1. IntroductionSeveral studies indicate that (Library and) Information Science (LIS) is under reorientation bothtopically and methodologically (Hsiao and Chen, 2020; Ma and Lund, 2020). Pressures towardthis are due to developments in underlying technologies of dissemination of information and inthe corresponding research areas like digital libraries, data mining, machine learning and webscience, among others. It is timely to investigate how these pressures materialize in thepublished LIS research.
To understand the state of a discipline, and consciously build its possible futures, it isnecessary to know how the characteristics of its research have developed to date. This requiresanalysis of the development of research foci and methodological choices. Understanding thecurrent state also helps planning the curricula and research. For the former one learns whatcourses are necessary, which strategically desirable, which minors are most useful and fromwhere to recruit students and teachers. For research planning, one gains amapping of the activeresearch areas and hints for building successful alliances.
When building such understanding, past literature has analyzed research topics andmethods in LIS (e.g. �Astr€om, 2007; Tuomaala et al., 2014). The present paper reports acontent analysis of articles published in top scholarly journals of LIS, following the study
LIS researchacross 50 years
65
© Kalervo J€arvelin and Pertti Vakkari. Published by Emerald Publishing Limited. This article ispublished under the Creative Commons Attribution (CC BY 4.0) licence. Anyone may reproduce,distribute, translate and create derivative works of this article (for both commercial and non-commercialpurposes), subject to full attribution to the original publication and authors. The full terms of this licencemay be seen at http://creativecommons.org/licences/by/4.0/legalcode
The current issue and full text archive of this journal is available on Emerald Insight at:
https://www.emerald.com/insight/0022-0418.htm
Received 19 March 2021Revised 4 June 2021
Accepted 6 June 2021
Journal of DocumentationVol. 78 No. 7, 2022
pp. 65-88Emerald Publishing Limited
0022-0418DOI 10.1108/JD-03-2021-0062
design by Tuomaala et al. (2014) and covering research from 1965 to 2015 at 20 years’intervals.
The paper has two research questions (RQs): (1) What was the topical and methodologicalstate of LIS research in 2015?We analyze this through articles published in core LIS journalsin 2015. (2) How has LIS evolved from 1965 to 2015? We examine this in the light ofcomparable statistics for the years 1965, 1985 and 2005 and 2015, reporting on the rise and fallof LIS research foci and methodological choices.
Our dataset comes from scholarly English language LIS journals. Journal articles havebeen almost the sole data source in recent studies of LIS research publications (e.g. Milojevicet al., 2011; Figuerola et al., 2017; Han, 2020). We analyze the trends in LIS research over 50years. The period covered is notably longer than in earlier studies, which typically coverabout 20 years (e.g. Hou et al., 2018; Han, 2020), at most 36 years (Figuerola et al., 2017). Toenhance comparability of findings with Tuomaala et al. (2014) we tried to keep the set of LISjournals stable over the years.
By following Tuomaala et al. (2014) we also adopted their criteria in journal selection.Their theoretically oriented criteria meant purposive selection of core journals matching thecharacterization of LIS as the provision of access to desired information (Vakkari, 1994). Wehave therefore avoided inclusion of journals belonging to other disciplines, like managementinformation systems, as suggested by Abritzah et al. (2015) and Huang et al. (2019). Theirpractical criteria meant focusing on scholarly LIS journals with wide distribution,international editorial board and publication policy – which had been assessed as corejournals by other researchers (e.g. by Peritz, 1980; Tuomaala et al., 2014).We arrived at a set of30þ journals for collecting an article set of 1,514 articles.
To construct the dataset for analysis, we performed a quantitative intellectual contentanalysis, classifying articles along eight dimensions covering their topical content andmethodology. Our LIS classification is based on Tuomaala et al. (2014) and provides a tool fororganizing and interpreting findings without an atheoretical selection and naming of topicalclusters to represent LIS quite typical in scientometric analyses. In addition to the topicaldevelopments, we report onmethodological developments of LIS during 50 years. Intellectualcontent analysis is appropriate in separating topical and methodological aspects. Forexample, it becomes natural to classify an article that topically belongs to scientometrics butemploys a mathematical research strategy (non-empirical), and another topically inscientometrics but employs citation analysis (an empirical strategy).
2. Literature reviewThere are no recent major conceptual analyses of LIS like in earlier years (c.f. Tuomaala et al.,2014), while there are empirical ones. Most of these studies have applied scientometricresearch strategies, and only a few have used content analysis. Next, we will present studieswhich have analyzed LIS research after 2014.
2.1 Research topicsMa and Lund (2020) is the only study using content analysis to explore the evolution ofLIS. They analyzed the topics and methods of scholarly articles in 31 major LIS journals in2006, 2012 and 2018, using categorizations of Tuomaala et al. (2014). The findingsindicated a shift of emphasis toward scholarly communication and information seekingtopics, along with a reduction of the share of information storage and retrieval (IS&R) andL&I service topics. In 2018 IS&R was the most common research topic followed byscholarly communication.
Chang et al. (2015) analyzed the evolution of LIS based on keywords, bibliographicalcoupling and co-citation analyses during four five-year periods between 1995 and 2014. Data
JD78,7
66

consisted of research articles in 10 major LIS journals. The cited top-5% journal articles wereanalyzed. The authors reduced LIS intellectually from various numbers of clusters into fourmajor fields. Information seeking and retrieval took the largest share of articles followed bybibliometrics in 1995–1999. In the later periods, the popularity of bibliometrics increased itsshare beyond 75% during 2005–2014.
Liu et al. (2015) detected the topical structure of LIS in 2001–2013 by formal conceptanalysis. Data consisted of first authors and keywords of articles in 16 prominent LISjournals. Authors were chosen based on their productivity and impact. From the articles ofthe 60 key authors, 99 keywords with highest frequency were selected for the analysis. Ninemain topics were identified: bibliometrics, scientometrics and informetrics, citation analysis,IR, information behavior, libraries, user studies, social network analysis, informationvisualization and webometrics.
Onyancha (2016) explored the evolution of LIS using author-supplied keywords inresearch articles between 1971 and 2015. Data were collected from Web of Science in theresearch area “Information Science Library Science”. The results hint that the focus of LIS haschanged from information system design and management in the 1970s to scientificcommunication, information retrieval, information management and user education by 2015.The data consist of a mix of articles representing management information systems and LISdue to the classification of research fields in WoS. In addition, only 26% of the articlesincluded author-supplied keywords reducing the representativeness of the data. Author-supplied keywords also run the risk of being inconsistent due to varying (or missing)keyword authority lists; low interest and motivation, and vague indexing skills on behalf ofthe authors. One may therefore ask to what extent the findings reliably reflect the evolutionof LIS.
Figuerola et al. (2017) mapped the evolution of LIS in 1978–2014 by topic modeling.Their data included titles and abstracts of peer-reviewed publications in Lisa covering92,705 items from 737 journals. Modeling produced 19 topics, which were grouped byhuman experts into four broader areas: process, information technology, libraries andspecific areas of application. During the years topics associated with libraries lost in theirshare, while topics concerning searching and evaluation of search systems, and specificareas of application like digital humanities or informetrics, in particular, have gainedweight.
Hou et al. (2018) analyzed the structure information science between 1996 and 2016applying document co-citation analysis. They selected ten representative journals for theyears 2009–2016 based on the journal co-citation analysis of JASIST, Scientometrics andJournal of Informetrics, while 12 core journals from an earlier study represented the earlieryears. The results show that the core topics from 1996 to 2008 were IR, webometrics andcitation behavior, while in the latter period scientometric indicators, citation analysis,scientific collaboration and information behavior, and particularly science evaluationindicators formed the core. Thus, the core topics in information science have developedtowards scientific and professional communication (S&PC). The results are biased towardsscientometrics, because two-thirds of journals on which journal selection was based,represented scientometrics.
Li et al. (2019) surveyed LIS trends between 1989 and 2018 by document co-citationanalysis. Data consisted of documents retrieved from Web of Science by the theme field“information science and library science”. The output included 88,304 publications from159 journals and proceedings. The study produced eight clusters: IR, social media,information systems, information behavior, bibliometrics and webometrics, scienceevaluation and knowledge management. IR, information systems and bibliometrics andwebometrics are the oldest topics, while social media and science evaluation are the mostrecent ones.
LIS researchacross 50 years
67
Han (2020) investigated LIS evolution by analyzing journal articles using Latent DirichletAllocation. The explored period was between 1996 and 2019, which were divided into fivesub-periods. For each period, 10 highest scoring LIS journals in journal ranking (JCR) wereselected for analysis which focused on title, abstract and keywords in each article(n 5 14,053). Ten clusters in each period were chosen for final analysis.
The results show that library service-related topics disappear after 1996–2005, whiletopics in IR proliferate during 2000–2010. Various topics in citation analysis andbibliometrics are well represented during the years. The topics belonging to informationand knowledge management increase after 2005. The author divided the 10 topics into threelarger fields in LIS: library science, bibliometrics and information science and other relatedissues. Library science disappeared after 2005, bibliometrics was a well-represented fielduntil the last period, while information science and related issues were a strong field acrossthe periods.
The results are biased in two ways. First, the highest-ranking journals varied greatlybetween the periods producing highly varied clusters. It is an open question howrepresentative these topical changes are in LIS. Second, it has been shown that LISjournals in JCR represent two different fields: management information systems and LIS(Abritzah et al., 2015; Huang et al., 2019). The topical structures of these fields differ notably.Thus, the produced topical map of LIS contains topics from other fields.
Hsiao and Chen (2020) investigated LIS subfields between 2009 and 2018 by wordbibliographic coupling. They selected 44 journals from JCR in the category “Informationscience, library science”. They included only LIS journals, excluding journals belonging tomanagement information systems. The data consisted of abstracts and author keywordsin 21,066 articles. The observation period was divided into two: 2009–2013 and 2014–2018. The top-3 subtopics among 25 subtopics in both periods were scientific impact andresearch quality, information behavior and users and technology adoption. By groupingthe subtopics, the study identified six main topics, including scholarly communicationand scientometrics, information behavior and IR, applications of technology, libraryservices and management, health information and technology and computer sciencetechniques.
Miyata et al. (2020) applied Latent Dirichlet Allocation to identify LIS topics. Theyanalyzed full texts of articles in five LIS journals in 2000–2002 and 2015–2017. Thirty topicsin each period were labeled. The first period topics were grouped into six fields: IR (10subtopics), information search and user (10), library (4), scholarly communication (4), libraryand information science (1) and bibliometrics (1). In 2015–2017, topics were grouped into fivefields: IR (2 subtopics), information search and user (16), library (1), scholarly communication(6) and tweet analysis (5). In the first period, IR and information search (IS) included mosttopics, while in the second, the number of topics in IR decreased and in IS increased notably.In the field library, the number of topics decreased during the periods observed, while that ofscholarly communication increased.
2.2 Research methodsMa and Lund (2020) found that in LIS, experiment was the most popular method in 2006,2012 and 2018 with a share of about 30%. The second in popularity was survey. Its shareincreased from about 19% to 25%. Citation analysis was the third with about a 13–14%share. The shares of the top research methods of the major topics of IR, informationseeking, scholarly communication and L&I services remained relatively stable across thedata points. Experiment was the most common method both in IR and informationseeking, while citation analysis dominated in scholarly communication, and survey in L&Iservices.
JD78,7
68
Chu (2015) identified research methods in LIS by analyzing research articles in Journal ofDocumentation, JASIST and LISR in 2001–2010. The four most common methods in alljournals were theoretical approach, content analysis, questionnaire and experiment.
Ullah and Ameen (2018) provided a meta-analysis of methods applied in LIS based on 58source publications published in 1980–2016. They created unifying categorizations ofvariables by re-coding method variables in the source publications. They found thatempirical, descriptive and quantitative methods were used in most LIS research. Survey wasthe most popular strategy and descriptive statistics mostly used for data analysis.
2.3 SummaryDuring the last years, the topical structure of LIS has been analyzed almost solely byscientometric methods. Only one of the eight studies used content analysis. The topicalstructure of LIS varies between studiesmostly due to the journal set and publications selectedfor analysis. The emergingmain trend is the decline of librarymatters as research objects andthe proliferation of scientometric topics. IR and information seeking have been popularresearch topics, but slightly losing in popularity. Empirical, descriptive quantitative studieshave been the most common in LIS with survey as the most popular strategy.
3. Research questions, data and methods3.1 Research questionsThe paper has twomain research questions (RQs) and several sub-questions (SQs) as follows:
RQ1. What was the topical and methodological state of LIS research in 2015?
RQ2. How has LIS evolved from 1965 to 2015?
SQ1a-e: What are the shares of various (a) topics, (b) research strategies, (c) methods ofdata collection, (d) types of analysis and (e) types of investigation (or contributions) in LISresearch in the year 2015?
SQ2a: How have the shares of article types (scholarly vs non-scholarly) evolved from 1965to 2015?
SQ3a-e: How have the shares of various (a) topics, (b) viewpoints (c) social levels, (d)research strategies and (e) the application of research strategies within topics evolvedfrom 1965 to 2015?
We investigate RQ1 through articles published in core LIS journals in 2015. The researchdesign (concepts and methodology) and data are explained next in sections 3.2 and 3.3. Weexamine RQ2 in the light of comparable statistics for the years 1965, 1985, and 2005 and 2015,reporting on the rise and fall of LIS research foci and methodological choices. The papercontributes to our understanding of what LIS is and how it has evolved.
3.2 DataA reliable account of LIS research based on publications requires data that includes all or arepresentative sample of research publications in the field. One has to define LIS to tell thedifference to other disciplines, what characterizes research for excluding non-researchpublications and how to identify publications in LIS among all other publications.
Although it is difficult to find a definition of LIS satisfying all scholars, it is widelyaccepted that the unifying characteristic of LIS is the study on the provision of access todesired information (Vakkari, 1994). However, this brief characterization is challenging tooperationalize. We set the criteria for what constitutes LIS research by the classification
LIS researchacross 50 years
69
system for LIS topics (Appendix 2): publications whose topic can be positioned within itsclasses belong to LIS. This solution has limitations, but using the same, although somewhatrevised operationalization across the period examined fosters comparability of findings.Thus, our notion of LIS may not be shared by the entire LIS community, but it producescomparable results on the trends in LIS research.
In several leading journals, many authors come from other fields than LIS. One mightsuggest that LIS articles could be identified through their authors’ disciplinary backgrounds.We think that an article’s “LISness”must be determined topically – as being classifiable in theLIS classification and not by authors’ background – because LIS is a crossroad of study fieldsrather than a tightly buttoned discipline.
There is nevertheless one limitation in the above notion of LIS – a rigid topical LISclassification becoming a straitjacket. If the classification does not evolve throughomission of old, and/or addition of new (sub)classes over time, one may only analysechanges in relative weights of the originally selected classes. Such an approach does notwelcome the evolution of LIS as a discipline and is blind to the growth of knowledge. Ourclassification of LIS topics originates from the one by J€arvelin and Vakkari (1990, 1993)which they used for the analysis of LIS research in 1965, 1975 and 1985. It is now about 30years old so it risks becoming anachronous. Therefore, we have revitalized theclassification scheme by introducing new subclasses. However, major newdevelopments do not necessarily fit in the classification but accumulate in the catch-allclass “Another discipline” (Class A 5 900).
We limit the publications to core scholarly journals in LIS which causes some bias in theresults. Not all types of LIS research are equally well represented in journal articles asSugimoto (2011) has noted. However, research articles form the core of the literature cited inLIS. Moreover, journal articles have been almost the sole source of data in recent studies ofLIS research. Our aim to analyse a standard set of scholarly LIS journals over the yearsenhances comparability of findings. Naturally, we have included new journals under pressingneeds and removed others which have ceased to exist (see Appendix 1).
Our unit of analysis is an article; we are not trying to describe the content profiles ofjournals, which function only as intermediate steps in reaching the articles. Therefore, theuneven productivity of journals in the number of articles is not problematic. However,changes in editorial policies of journals, or the in/exclusion of a prolific journal in a subarea(like the journal Scientometrics) certainly tilt the findings. Tuomaala et al. (2014) tackled thisissue by presenting the key findings with and without the data derived throughScientometrics. We include this journal because there are compatible earlier results for2005 and because there is no reasonable justification for selecting some proportion of articlesin Scientometrics to represent this subarea in LIS. Scientometric studies have been consideredas part of LIS by several scholars (e.g. Abritzah et al., 2015; Huang et al., 2019).
All journals are in English. This choice, while possibly causing some bias in the findings,is typical in analyses of LIS. The year 2015 volumes were taken as the sources of researcharticles – because it follows with the same interval (a decade) earlier analyses of LIS utilizingthe same approach. Only potential research articles were collected (full articles, briefcommunications and critical reviews) and other texts (errata, letters-to-the-editors, bookreviews, announcements and ads) were excluded. The basis of content analysis of each articlewas its metadata, i.e. title, abstract and keywords, or title and first page, depending on whatwas available. If an article proved impossible to analyse based on suchmetadata, its body textwas consulted.
The total number of articles in the data for 2015 is 1,514. We excluded from the analysisarticles which were classified as non-LIS studies (A 5 900) (n 5 192) and non-scholarlyarticles (n 5 112). The number of articles in the main analysis is thus 1,210.
JD78,7
70
3.3 Methods of content classificationThe articles were classified according to eight dimensions (see Appendix 2):
Among them, LIS topic and Viewpoint represent the topical content, and Scholarlinessindicates research articles that we focus on. The remaining five dimensions represent articles’methodological aspects. We discuss these dimensions, and their modifications briefly below.
Articles’ topicswere classified using the classificationLIS topic. This classification systemhas been used widely (e.g. Hider and Pymm, 2008; J€arvelin and Vakkari, 1990; Ma and Lund,2020) and contains the following major classes:
Classes 400–700 also have sub-classes. In view of the development of the field, the sub-classes were conservatively updated on the basis of (Tuomaala et al., 2014) as follows:
(1) 020-The class library history was focused to history of L&I institutions, activities orphenomena
(2) 030-Publishing was extended to cover even archival document and informationhistory
(3) 410-The study of circulation and interlibrary loan activities was generalized todocument delivery using documents in any physical forms and delivery means.
(4) 440-The study on user education was broadened to information literacy education(incl. information skills).
(5) 530-The subclasses of information search and retrieval were extended to coverstudies in live collections as well.
(6) 534-The class on social media retrieval (e.g. Facebook, Twitter) was added.
We believe that these modifications, in contrast to the study by Tuomaala et al. (2014), servemaintaining the classification up-to-date and retaining comparability across the datasets.
Each article was classified under a single topical class; in the main classes 400–700, onlythe sub-classes were used for classification. When an article had many topics, its main topicwas identified for classification. For instance, an article on education in information retrievalwas classified as education and an article on information retrieval for education asinformation retrieval. The class “Other aspect of LIS” did not grow unduly large, which hintsthat it was possible to reliably select the major topic among the sub-topics of articles.
Scholarliness indicates whether the article reports scholarly research or not. The criterionfor research is that the article reports on at least somewhat systematic approach to constructnew concepts, knowledge and ideas (Peritz, 1980). This means that, typically, some researchquestion is presented, some research method is identified and some results are acquired.
Classification of the viewpoint on information dissemination was based on traditionallyrecognized actors in the process of information dissemination (author, intermediary, end user,etc.) and their organizations. To classify we ask, whose needs, interests or opinions areanalyzed in the study. The class p5 19 for other viewpoint is a new class in the present paper.
The classification of social level differentiates among the individual, organizational andsocietal levels, also separating out multi-level analyses. The class individual was used when
000: LIS context (professions, history and publishing) 400: library and information-service (L&I) activities500: information storage and retrieval
100: education in LIS 600: information-seeking200: methodology 700: scientific and professional communication300: analysis of LIS 800: other aspects of LIS
900: another discipline
LIS researchacross 50 years
71

the objects studied in the article were individuals. For example, a study on intermediarybehavior through analysis of search protocols has the social level individual. The classorganizational was used when the objects studied in the article were organizations (e.g.library institutions, end-user institutions) even if the informants were individuals. The classsocietal was used when the objects studied in the article were, e.g. municipalities or societies.“Not applicable” was used when the objects studied in the article were at no level of socialorganization, as in studies of bibliometric laws or digital collections.
The methodological aspect of a study consists of research strategy, data-collection method,type of analysis and type of investigation. Research strategy is an overall approach to the studywithin which, for example, the decisions on data collection and the type of analysis are made.Among the typical strategies for empirical research are the historical, survey and qualitativestrategy. The other main strategies are referred to as conceptual research strategy (e.g. verbalargumentation or concept analysis),mathematical or logical strategy and system and softwareanalysis and design (Tuomaala et al., 2014).
In the original classification system of J€arvelin and Vakkari (1990), evaluation andexperiment were kept as different research strategies. However, for 2005, they were mergedbecause both surveys and experimentsmay have elements of evaluation. In the present studytheywere kept separate. Therefore, the VariableM (Research Strategy) has three new classes:M 5 14 (evaluation strategy),M 5 22 (experiment, incl. field experiment) and M5 29 (otherempirical strategy as a catch-all for any other qualitative or quantitative strategy), partiallyoverlapping the earlier ones.
In empirical research the data are collected through various data-collection methods.These are listed in the classification Data-collection method. For the present analysis, thisvariable has two changes: new class C 5 15 (harvesting databases or their log files) andextended class C 5 20 (observation, incl. eye-tracking, screen capture, wearable recorders).
The classification Type of Analysis indicates whether the article reports qualitative,quantitative or mixed type of empirical research, or whether it is non-empirical.
Each article was classified under one content class for each variableA, . . ., I. The data for2015 were divided evenly between the researchers for classification. For reliability analysis,the researchers reclassified 31 articles independently. Reliability was calculated by means ofFleiss’ Kappa, the value of which ranges from �1 for complete disagreement, to ±0 forrandom choices, and to þ1 for complete agreement. Kappa values 0.41–0.60 are moderate,0.61–0.80 good and 0.81–1.0 very good. The agreement results are in Table 1. Theclassifications of Scholarliness, Main topic, Topic, Social level, Type of analysis and Type ofinvestigation have (at least) good agreement, while Viewpoint, Research strategy and Data-collection method have moderate. For p, a major source of inconsistency was p5 0 vs p5 17(no viewpoint vs developer’s viewpoint): often disagreement onmethodology followed in lieu –Is this paper mathematical, software or empirical, or a bit of all?
Variable Fleiss’ Kappa p Agreement
Topic 0.619 0.000 GoodMain topic 0.684 0.000 GoodScholarliness 0.631 0.000 GoodViewpoint on dissemination process 0.555 0.000 ModerateSocial level 0.622 0.000 GoodResearch strategy 0.532 0.000 ModerateData-collection method 0.603 0.000 ModerateType of analysis 0.852 0.000 Very goodType of investigation 0.601 0.000 Good
Table 1.Analysis ofclassification reliability– Fleiss’ Kappa for twoclassifiers
JD78,7
72
A plausible explanation for the moderate reliabilities is that classification of the viewpointand methodology-related aspects based on article metadata often left much room forinterpretation. Even scholarly articles in LIS core journals may be quite scarce in describing, intheir metadata, the methods used in the study, and the body text does not always reveal thesecret without serious effort unless themethods are well-established with a standard name tag.
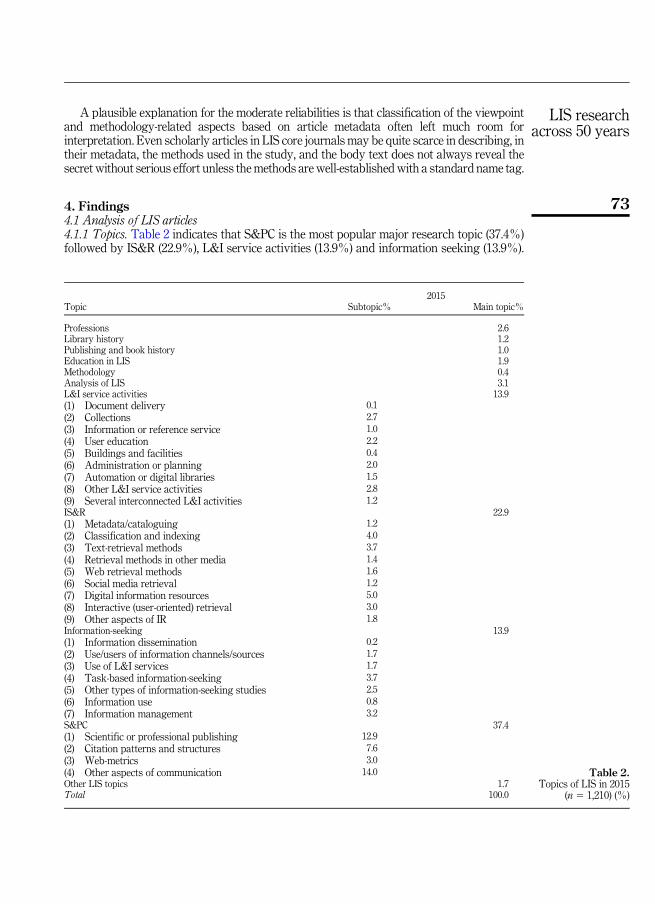
4. Findings4.1 Analysis of LIS articles4.1.1 Topics. Table 2 indicates that S&PC is the most popular major research topic (37.4%)followed by IS&R (22.9%), L&I service activities (13.9%) and information seeking (13.9%).
Topic2015
Subtopic% Main topic%
Professions 2.6Library history 1.2Publishing and book history 1.0Education in LIS 1.9Methodology 0.4Analysis of LIS 3.1L&I service activities 13.9(1) Document delivery 0.1
(2) Collections 2.7
(3) Information or reference service 1.0
(4) User education 2.2
(5) Buildings and facilities 0.4
(6) Administration or planning 2.0
(7) Automation or digital libraries 1.5
(8) Other L&I service activities 2.8
(9) Several interconnected L&I activities 1.2IS&R 22.9(1) Metadata/cataloguing 1.2
(2) Classification and indexing 4.0
(3) Text-retrieval methods 3.7
(4) Retrieval methods in other media 1.4
(5) Web retrieval methods 1.6
(6) Social media retrieval 1.2
(7) Digital information resources 5.0
(8) Interactive (user-oriented) retrieval 3.0
(9) Other aspects of IR 1.8Information-seeking 13.9(1) Information dissemination 0.2
(2) Use/users of information channels/sources 1.7
(3) Use of L&I services 1.7
(4) Task-based information-seeking 3.7
(5) Other types of information-seeking studies 2.5
(6) Information use 0.8
(7) Information management 3.2S&PC 37.4(1) Scientific or professional publishing 12.9
(2) Citation patterns and structures 7.6
(3) Web-metrics 3.0
(4) Other aspects of communication 14.0
Other LIS topics 1.7Total 100.0
Table 2.Topics of LIS in 2015
(n 5 1,210) (%)
LIS researchacross 50 years
73
The four most frequently published major topics cover 88.1% of all scholarly articles. Othermajor topics were notably less popular with analysis of LIS (3.1%) and professions (2.6%) asmost frequent research topics. The results show that in 2015 research published in journalsaccumulated heavily on S&PC, which took almost four out of ten articles.
Most popular sub-topics within the major topics were other aspects of S&PC (14.0%) suchas research assessments or various co-word analyses of research specialties. The nextpopular sub-topics were scientific and professional publishing (12.9%), citation patterns andstructures (7.6%). These three most popular sub-topics belong to the area of S&PC.
Within IS&R the most studied sub-topics were digital information resources (5.0%),classification and indexing (4.0) and text-retrieval methods (3.7%). The proportion ofinteractive, user-oriented IR was only 3.0% of all research output. Neither had social mediaretrieval stimulated much interest (1.2%) in 2015.
Within the area of information seeking task-based information seeking (3.7%),information management (3.2%) and other types of information seeking studies (2.5%)(e.g. about serendipity) were the most popular sub-topics. Within L&I service activities otherL&I service activities (2.8%), collections (2.7%) and user education (2.2%) were the mostfrequently studied sub-topics.
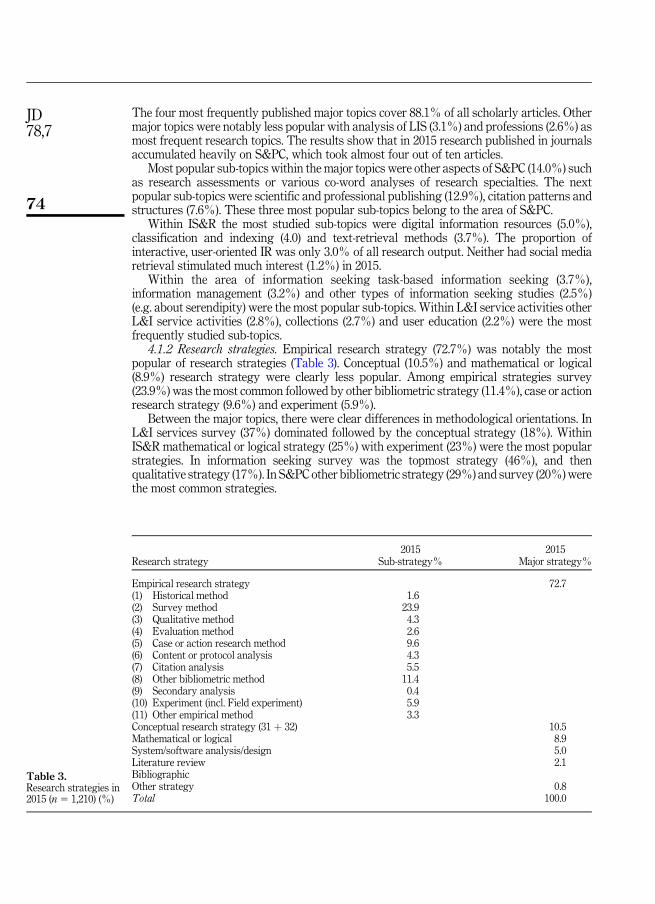
4.1.2 Research strategies. Empirical research strategy (72.7%) was notably the mostpopular of research strategies (Table 3). Conceptual (10.5%) and mathematical or logical(8.9%) research strategy were clearly less popular. Among empirical strategies survey(23.9%) was the most common followed by other bibliometric strategy (11.4%), case or actionresearch strategy (9.6%) and experiment (5.9%).
Between the major topics, there were clear differences in methodological orientations. InL&I services survey (37%) dominated followed by the conceptual strategy (18%). WithinIS&R mathematical or logical strategy (25%) with experiment (23%) were the most popularstrategies. In information seeking survey was the topmost strategy (46%), and thenqualitative strategy (17%). In S&PC other bibliometric strategy (29%) and survey (20%)werethe most common strategies.
Research strategy2015 2015
Sub-strategy% Major strategy%
Empirical research strategy 72.7(1) Historical method 1.6(2) Survey method 23.9(3) Qualitative method 4.3(4) Evaluation method 2.6(5) Case or action research method 9.6(6) Content or protocol analysis 4.3(7) Citation analysis 5.5(8) Other bibliometric method 11.4(9) Secondary analysis 0.4(10) Experiment (incl. Field experiment) 5.9(11) Other empirical method 3.3Conceptual research strategy (31 þ 32) 10.5Mathematical or logical 8.9System/software analysis/design 5.0Literature review 2.1BibliographicOther strategy 0.8Total 100.0
Table 3.Research strategies in2015 (n 5 1,210) (%)
JD78,7
74
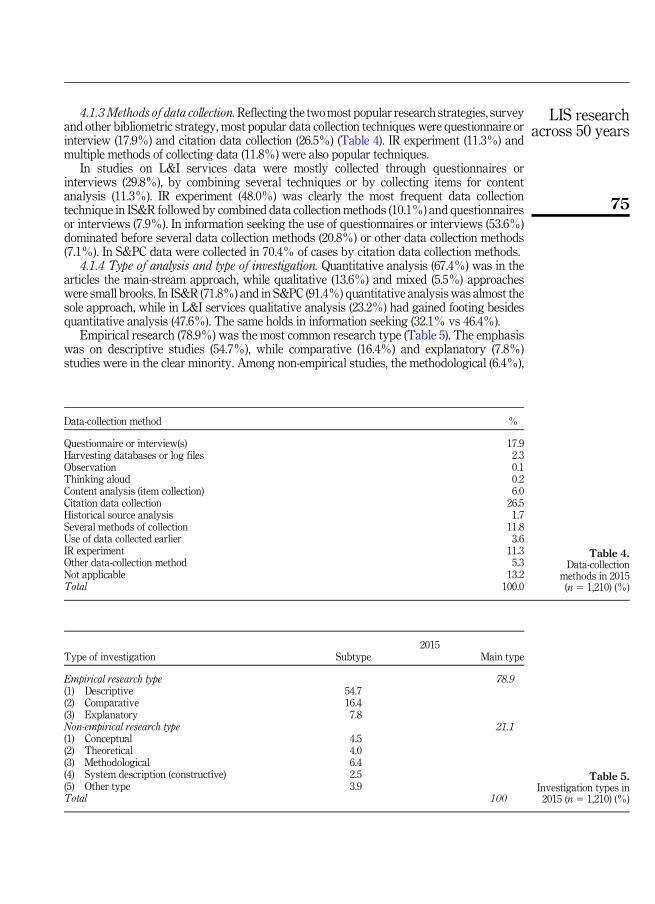
4.1.3Methods of data collection.Reflecting the twomost popular research strategies, surveyand other bibliometric strategy, most popular data collection techniques were questionnaire orinterview (17.9%) and citation data collection (26.5%) (Table 4). IR experiment (11.3%) andmultiple methods of collecting data (11.8%) were also popular techniques.
In studies on L&I services data were mostly collected through questionnaires orinterviews (29.8%), by combining several techniques or by collecting items for contentanalysis (11.3%). IR experiment (48.0%) was clearly the most frequent data collectiontechnique in IS&R followed by combined data collectionmethods (10.1%) and questionnairesor interviews (7.9%). In information seeking the use of questionnaires or interviews (53.6%)dominated before several data collection methods (20.8%) or other data collection methods(7.1%). In S&PC data were collected in 70.4% of cases by citation data collection methods.
4.1.4 Type of analysis and type of investigation. Quantitative analysis (67.4%) was in thearticles the main-stream approach, while qualitative (13.6%) and mixed (5.5%) approacheswere small brooks. In IS&R (71.8%) and in S&PC (91.4%) quantitative analysis was almost thesole approach, while in L&I services qualitative analysis (23.2%) had gained footing besidesquantitative analysis (47.6%). The same holds in information seeking (32.1% vs 46.4%).
Empirical research (78.9%) was the most common research type (Table 5). The emphasiswas on descriptive studies (54.7%), while comparative (16.4%) and explanatory (7.8%)studies were in the clear minority. Among non-empirical studies, the methodological (6.4%),
Data-collection method %
Questionnaire or interview(s) 17.9Harvesting databases or log files 2.3Observation 0.1Thinking aloud 0.2Content analysis (item collection) 6.0Citation data collection 26.5Historical source analysis 1.7Several methods of collection 11.8Use of data collected earlier 3.6IR experiment 11.3Other data-collection method 5.3Not applicable 13.2Total 100.0
Type of investigation2015
Subtype Main type
Empirical research type 78.9(1) Descriptive 54.7(2) Comparative 16.4(3) Explanatory 7.8Non-empirical research type 21.1(1) Conceptual 4.5(2) Theoretical 4.0(3) Methodological 6.4(4) System description (constructive) 2.5(5) Other type 3.9Total 100
Table 4.Data-collection
methods in 2015(n 5 1,210) (%)
Table 5.Investigation types in2015 (n 5 1,210) (%)
LIS researchacross 50 years
75

conceptual (4.5%) and theoretical (4.0%) ones were most popular, although their share in thewhole population was modest.
Descriptive studies were clearly most common in L&I services (59.5%), informationseeking (60.7%) and S&PC (63.7%), while comparative ones (37.9%) in IS&R followed bydescriptive studies (32.9%). Interestingly, in information seeking explanatory studies (22.0%)were relatively common, whereas methodological studies (11.3%) had gained some footingamong studies on S&PC.
4.2 Analysis of trends in LIS across 50 yearsThe proportion of research articles among all articles has grown linearly from 30% to 91%during the period studied (Table 6). The growth has been rapid especially during the last 10years compared to earlier 20-year periods. Tuomaala et al. (2014) is the source for the year1965, 1985 and 2005 data throughout the section.
This means that even if the roots of LIS may lie in the professions, LIS has matured as ascholarly discipline.While the number of articles in core LIS journals grows notably, even thenumber of professional articles diminishes significantly – from over 300 in 1965 to just over100 in 2015. Such articles may be submitted to professional journals reflecting the division oflabor between scholarly and professional journals, or the acceptance thresholds may havebecome more stringent.
In the following we focus on trends based on research articles in LIS.4.2.1 Topics.Themost striking development is the rise of S&PC research from about a 5%
share in 1965 to close to 40% in 2015 (Table 7). The proportion of S&PC increased strongly in2005, because the journal Scientometrics was included in the journals studied. Thus, in asense the rise is technical, although it clearly reflects the popularity of S&PC within LIS; in2015 it was the most popular broad topic. This is due to the active publication policy of“Scientometrics”. The number of scholarly articles in this journal in 2015 was 344. This wasthe highest among all journals in the data.
Article type 1965 (n 5 467) 1985 (n 5 833) 2005 (n 5 848) 2015 (n 5 1,322)
Scholarly 30 54 72 91Professional 70 46 28 9Total 100 100 100 100
LIS topic 1965 (n 5 142) 1985 (n 5 449) 2005 (n 5 718) 2015 (n 5 1,210)
Professions 4.9 5.6 1.4 2.6Library history 2.8 3.8 4.2 1.2Publishing 5.6 3.1 0.6 1.0Education in LIS 2.1 4.7 0.3 1.9Methodology 7.8 0.9 0.6 0.4Analysis of LIS 5.6 2.4 2.8 3.1L&I service activities 25.4 27.2 17.0 13.9IS&R 32.4 29.2 30.1 22.9Information-seeking 7.8 6.0 12.3 13.9S&PC 4.9 7.3 24.3 37.4Other LIS topics 1.0 10.2 6.4 1.7Total 100.3 100.0 100.0 100.0
Table 6.Article types in 1965–2015 (%)
Table 7.Main topics in1965–2015 (%)
JD78,7
76

IS&R and L&I service activities have been the largest areas of research from 1965 to 2005,while S&PC has overtaken L&I service activities in 2005 and conquered the largest positionin 2015. The share of IS&R – the earlier largest topic – has decreased from 32.4% to 22.9%during the time period observed. The share of L&I service activities has decreased alsonotably from 25.4% to 13.9%. By contrast, the proportion of studies on S&PC has increasedin particular during the last two observation periods. Although the shares of articles invarious topics have decreased during the years, their absolute numbers have increasednotably. Although, e.g. L&I service activities, is not relatively as popular a topic as it used tobe, there is more research on it than earlier. The general expansion of research activities isbehind these trends.
Information seeking has been relatively popular research topic during the years. Its sharehas stabilized around 12–14% in the last two periods. The share of articles in the remainingmajor topics is substantially smaller varying between 5% and 1%. Less frequent main topicshave lost their attraction as research objects within research community. This has happenedmostly in the twenty-first century. This diminishing trend has been associated with thegrowth of the fourmost studied research areas –L&I services, IS&R, information seeking andS&PC. Their proportion has increased from 73.4% to 88.1% between the years.
4.2.2 Most frequent topics. There is a clear change in the composition of the six mostpopular topics during the observed period (Table 8). The minor topics and sub-topics in L&Iservices have lost their popularity, while sub-topics in IS&R and S&PC have gained itespecially after 2005.
In 1965 there was a strong emphasis on classification and indexing (21.8%), but alsoautomation (7.8%), collections (6.3%), methodology (7.8%) and analysis of LIS (5.6%)attracted attention. In 1985 problems of IS&R gained diversified attention focusing on IR(12.7%) and classification and indexing (5.6%). L&I services were represented in top sixtopics by collections (7.1%) and administration (5.8%). In 2005 reflecting the popularity ofIS&R, interactive IR (7.7%), classification and indexing (7.1%) and web retrieval (4.6%) wereamong the top six topics. S&PC had gained also popularity so that other topics in S&PC(10.4%) and citation structures (6.5%) had penetrated among topmost topics. In 2015 thethree top positions were conquered by the sub-topics of S&PC – other S&PC (14.0%),scientific publishing (12.9%) and citation structures (7.6%). IS&R was represented also bythree topics, digital information resources (5.0%), classification and indexing (4.0%) and textretrieval (3.7%).
4.2.3 Viewpoint on information dissemination.During the years, it has been very typical toanalyze research objects regardless of the viewpoint on information dissemination (Figure 1),in studies on IS&R and S&PC in particular. This is likely due to active technologicaldevelopment foci in information interaction and process-neutrality of many scientometricstudies.
The change from intermediary’s viewpoint to end-user’s and developer’s viewpoint hasoccurred in the period observed. Intermediary’s angle was dominant in 1965 and 1985 (35%
1965 (n 5 142) 1985 (n 5 449) 2005 (n 5 718) 2015 (n 5 1,210)
Classif and index 21.8 Inf retrieval 12.7 Other sci comm 10.4 Other sci comm 14.0Automation 7.8 Collections 7.1 Interactive IR 7.7 Sci publishing 12.9Methodology 7.8 Administration 5.8 Classif and index 7.1 Citation struct 7.6Collections 6.3 Professions 5.6 Automation 6.4 Digit info res 5.0Analysis of LIS 5.6 Classif and index 5.6 Citation struct 6.5 Classif and index 4.0Publishing 5.6 Education LIS 4.7 Web retrieval 4.6 Text retrieval 3.7Total 54.9 Total 41.5 Total 42.7 Total 47.2
Table 8.The six most popular
topics in1965–2015 (%)
LIS researchacross 50 years
77
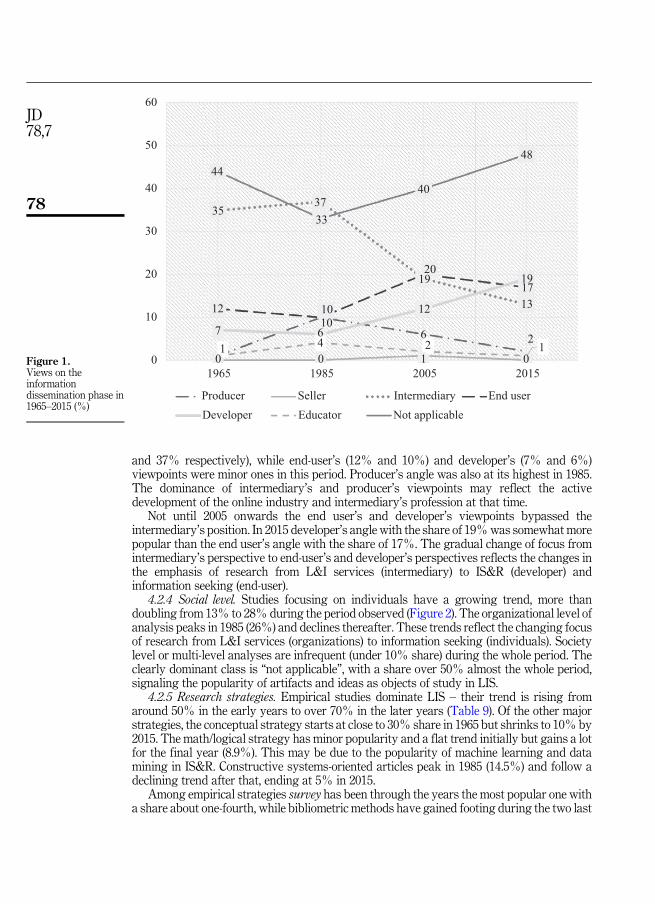
and 37% respectively), while end-user’s (12% and 10%) and developer’s (7% and 6%)viewpoints were minor ones in this period. Producer’s angle was also at its highest in 1985.The dominance of intermediary’s and producer’s viewpoints may reflect the activedevelopment of the online industry and intermediary’s profession at that time.
Not until 2005 onwards the end user’s and developer’s viewpoints bypassed theintermediary’s position. In 2015 developer’s angle with the share of 19%was somewhat morepopular than the end user’s angle with the share of 17%. The gradual change of focus fromintermediary’s perspective to end-user’s and developer’s perspectives reflects the changes inthe emphasis of research from L&I services (intermediary) to IS&R (developer) andinformation seeking (end-user).
4.2.4 Social level. Studies focusing on individuals have a growing trend, more thandoubling from 13% to 28% during the period observed (Figure 2). The organizational level ofanalysis peaks in 1985 (26%) and declines thereafter. These trends reflect the changing focusof research from L&I services (organizations) to information seeking (individuals). Societylevel or multi-level analyses are infrequent (under 10% share) during the whole period. Theclearly dominant class is “not applicable”, with a share over 50% almost the whole period,signaling the popularity of artifacts and ideas as objects of study in LIS.
4.2.5 Research strategies. Empirical studies dominate LIS – their trend is rising fromaround 50% in the early years to over 70% in the later years (Table 9). Of the other majorstrategies, the conceptual strategy starts at close to 30% share in 1965 but shrinks to 10% by2015. The math/logical strategy has minor popularity and a flat trend initially but gains a lotfor the final year (8.9%). This may be due to the popularity of machine learning and datamining in IS&R. Constructive systems-oriented articles peak in 1985 (14.5%) and follow adeclining trend after that, ending at 5% in 2015.
Among empirical strategies survey has been through the years the most popular one witha share about one-fourth, while bibliometric methods have gained footing during the two last
60
50
40
30
20
10
01965 1985 2005 2015
Producer
Developer
Seller
Educator
Intermediary End user
Not applicable
44
35
12
7
10 0 1 0
37
33
40
48
1917
2019
12
61010
64 2
21
13
Figure 1.Views on theinformationdissemination phase in1965–2015 (%)
JD78,7
78
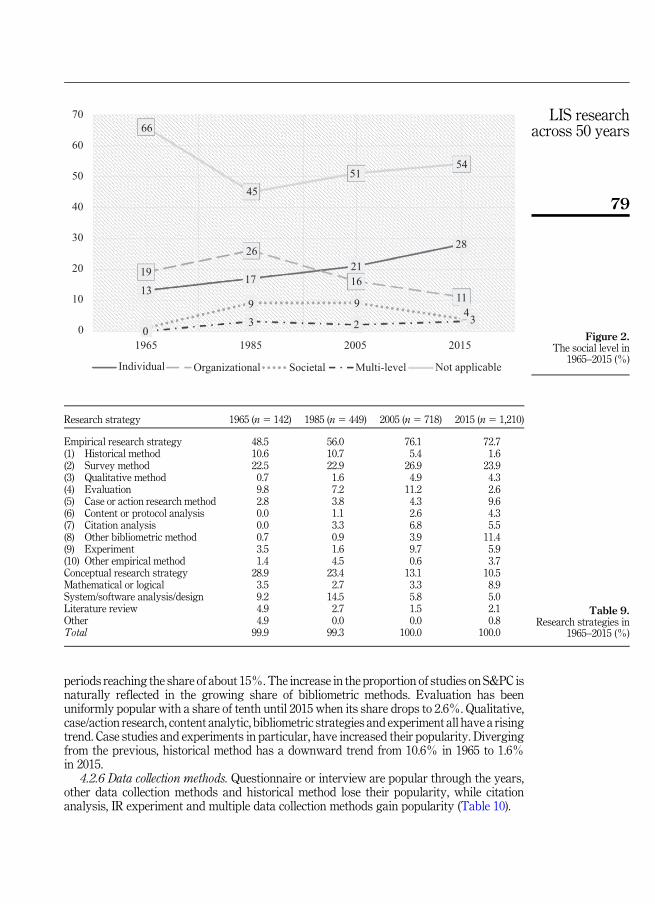
periods reaching the share of about 15%. The increase in the proportion of studies on S&PC isnaturally reflected in the growing share of bibliometric methods. Evaluation has beenuniformly popular with a share of tenth until 2015 when its share drops to 2.6%. Qualitative,case/action research, content analytic, bibliometric strategies and experiment all have a risingtrend. Case studies and experiments in particular, have increased their popularity. Divergingfrom the previous, historical method has a downward trend from 10.6% in 1965 to 1.6%in 2015.
4.2.6 Data collection methods. Questionnaire or interview are popular through the years,other data collection methods and historical method lose their popularity, while citationanalysis, IR experiment and multiple data collection methods gain popularity (Table 10).
50
60
70
40
30
20
10
0
1965 1985 2005 2015
Individual Organizational Societal Multi-level
66
19
13
0
45
26
5154
28
11
21
16
9
17
9
3 34
Not applicable
2
Research strategy 1965 (n 5 142) 1985 (n 5 449) 2005 (n 5 718) 2015 (n5 1,210)
Empirical research strategy 48.5 56.0 76.1 72.7(1) Historical method 10.6 10.7 5.4 1.6(2) Survey method 22.5 22.9 26.9 23.9(3) Qualitative method 0.7 1.6 4.9 4.3(4) Evaluation 9.8 7.2 11.2 2.6(5) Case or action research method 2.8 3.8 4.3 9.6(6) Content or protocol analysis 0.0 1.1 2.6 4.3(7) Citation analysis 0.0 3.3 6.8 5.5(8) Other bibliometric method 0.7 0.9 3.9 11.4(9) Experiment 3.5 1.6 9.7 5.9(10) Other empirical method 1.4 4.5 0.6 3.7Conceptual research strategy 28.9 23.4 13.1 10.5Mathematical or logical 3.5 2.7 3.3 8.9System/software analysis/design 9.2 14.5 5.8 5.0Literature review 4.9 2.7 1.5 2.1Other 4.9 0.0 0.0 0.8Total 99.9 99.3 100.0 100.0
Figure 2.The social level in
1965–2015 (%)
Table 9.Research strategies in
1965–2015 (%)
LIS researchacross 50 years
79
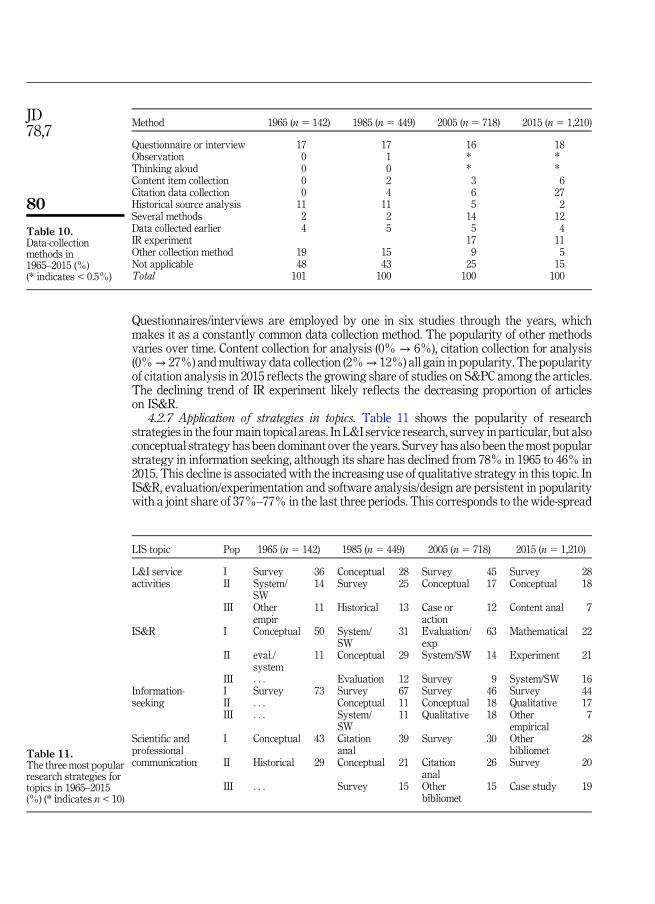
Questionnaires/interviews are employed by one in six studies through the years, whichmakes it as a constantly common data collection method. The popularity of other methodsvaries over time. Content collection for analysis (0% → 6%), citation collection for analysis(0%→ 27%) andmultiway data collection (2%→ 12%) all gain in popularity. The popularityof citation analysis in 2015 reflects the growing share of studies on S&PC among the articles.The declining trend of IR experiment likely reflects the decreasing proportion of articleson IS&R.
4.2.7 Application of strategies in topics. Table 11 shows the popularity of researchstrategies in the fourmain topical areas. In L&I service research, survey in particular, but alsoconceptual strategy has been dominant over the years. Survey has also been themost popularstrategy in information seeking, although its share has declined from 78% in 1965 to 46% in2015. This decline is associated with the increasing use of qualitative strategy in this topic. InIS&R, evaluation/experimentation and software analysis/design are persistent in popularitywith a joint share of 37%–77% in the last three periods. This corresponds to the wide-spread
Method 1965 (n 5 142) 1985 (n 5 449) 2005 (n 5 718) 2015 (n 5 1,210)
Questionnaire or interview 17 17 16 18Observation 0 1 * *Thinking aloud 0 0 * *Content item collection 0 2 3 6Citation data collection 0 4 6 27Historical source analysis 11 11 5 2Several methods 2 2 14 12Data collected earlier 4 5 5 4IR experiment 17 11Other collection method 19 15 9 5Not applicable 48 43 25 15Total 101 100 100 100
LIS topic Pop 1965 (n 5 142) 1985 (n 5 449) 2005 (n 5 718) 2015 (n 5 1,210)
L&I serviceactivities
I Survey 36 Conceptual 28 Survey 45 Survey 28II System/
SW14 Survey 25 Conceptual 17 Conceptual 18
III Otherempir
11 Historical 13 Case oraction
12 Content anal 7
IS&R I Conceptual 50 System/SW
31 Evaluation/exp
63 Mathematical 22
II eval./system
11 Conceptual 29 System/SW 14 Experiment 21
III . . . Evaluation 12 Survey 9 System/SW 16Information-seeking
I Survey 73 Survey 67 Survey 46 Survey 44II . . . Conceptual 11 Conceptual 18 Qualitative 17III . . . System/
SW11 Qualitative 18 Other
empirical7
Scientific andprofessionalcommunication
I Conceptual 43 Citationanal
39 Survey 30 Otherbibliomet
28
II Historical 29 Conceptual 21 Citationanal
26 Survey 20
III . . . Survey 15 Otherbibliomet
15 Case study 19
Table 10.Data-collectionmethods in1965–2015 (%)(* indicates < 0.5%)
Table 11.The threemost popularresearch strategies fortopics in 1965–2015(%) (* indicates n < 10)
JD78,7
80
view that “evaluation is the hallmark of IR”. Citation analysis/other bibliometric strategy andsurvey dominate the fourth main area, S&PC (47%–54% since 1985).
5. DiscussionIn the 50 years observed both the proportion and absolute number of research articles in corejournals of LIS have increased notably. When in 1965 30% of the articles were scholarly innature, the respective figure in 2015 was 91%. This hints to the maturation of LIS as a field ofresearch, whichmay also reflect possibly tightened acceptance requirements of journals. Thelarge growth in absolute number of research articles means that also the research activity inLIS in general has increased. Although the proportion of some research topics like L&Iservice activities decreases compared to other topics, still the research activity in that topicmay be greater than earlier.
5.1 Research question RQ1In 2015, S&PC took the lion’s share in the topical profile of LIS, 37.4% of all publications.IS&R came second (22.9%) followed by L&I services (13.9%) and information seeking(13.9%). Thus, there were clear differences in popularity between the major topics in LIS. Theother major topics in the classification like professions, library history or analysis of LISweremuch less frequent areas covering a few percentages each.
The popularity of S&PC reflects the growing interest in research community towardscientometric analyses. This has led to an increase in the number of articles, e.g. in the journalScientometrics. It covers 344 articles in our data, which is the largest share among journalsobserved. Removing Scientometrics from the analysis would change the rank of S&PC fromfirst (37.4%) to fourth (13.6%), and rank IR (31.2%), L&I service activities (19.4%) andinformation seeking (19.4%) one step higher. However, S&PC has been an essential part of LISat least from the time of Eugene Garfield and Institute for Scientific Information founded in1950s. Therefore, it is justified to include a journal representing this sub-field of LIS in the data.
In little over one-half of the studies it was neither possible to identify a viewpoint toinformation dissemination nor the social level. The former was in part due to the large shareof publications in S&PC without viewpoint. Typical in these articles was an emphasis onstructural relationships rather than problems faced by some actors. The latter was due to alarge proportion of articles in S&PC and IS&R without social level. This is likely due to thepopularity of research on technical solutions in the field, ignoring a social level of analysis.
The most frequent viewpoints were developer’s, end-user’s and intermediary’sviewpoints. Intermediary’s viewpoint (52.4%) was emphasized in studies on L&I services,whereas developer’s viewpoint (48.7%) was emphasized in studies on IS&R, and end-user’sviewpoint (57.7%) in studies on information seeking. Themost common social level in articleswas the individual’s (28.4%), followed by the organizational (11.4%). Individual level wasmost popular in studies on information seeking, while L&I services were, unsurprisingly,approached from the organizational perspective.
Empirical research strategy (72.7%) was the dominant one, while conceptual (10.5%) andmathematical/logical (8.9%) strategies were clearly less popular. Among empirical strategies,survey was the most common (23.9%) followed by other bibliometric strategy (11.4%). Therewere clear differences in methodological orientations between topics. Within IS&R,mathematical/logical strategy (25%) with experiment (23%) were the most popularstrategies, while in information seeking, survey (46%) and qualitative strategy (18%)flourished. Reflecting the twomost popular research strategies, survey and other bibliometricstrategy, the most popular data collection methods were questionnaire or interview (17.9%)and citation data collection (26.5%).
LIS researchacross 50 years
81
5.2 Research question RQ2The trends in LIS research observed in the model study (Tuomaala et al., 2014) have eitherstrengthened or stabilized. During the last period, S&PC has become the largest research areain LIS with a share of about 37%. The largest research topic until 2005 was IS&R. Its sharehas declined from about 30% until 2005 to 23% in 2015. L&I services have lost their strongposition especially in 2005 and 2015 to the level of 14%, while information seeking hasincreased and stabilized its share to around 14%. For 50 years, research in LIS hasincreasingly accumulated on these four major topics from about 75% to 90%. Among the sixmost popular sub-topics a similar 50-year accumulation can be observed. The most populartopics come increasingly from S&PC or IS&R.
The findings about the largest research areas in LIS are in line with earlier studies, whichconfirm the earlier findings. A more detailed comparison of sub-topics is not possible due tothe differences in categorizing topics and sub-topics. Several studies, however, indicate adecline in the share of studies on L&I services, while reporting a steady growth in studies onS&PC, or a declining stabilization in studies of IS&R. S&PC is the largest research areafollowed by IS&R (Chang et al., 2015; Figuerola et al., 2017; Han, 2020;Ma and Lund, 2020). Maand Lund (2020) also report findings corresponding to ours that the top research method inIS&R is experiment, in L&I services survey and in S&PC citation analysis.
The topical changes are reflected in other aspects of research too. Intermediaries’ and theirorganizations’ viewpoints have yielded to end users’ and their organizations’ viewpoints.During the last period, in particular the developer’s view has strengthened in research. Inaddition, studies on the individual level of analysis have gained footing, while organizationalor societal level in analyses has diminished. This reflects the increase in end-user searchingand in the use of tools designed for that purpose.
The role of empirical research strategy has strengthened in LIS. Although survey has aconstant major role, an increase in the use of bibliometric methods and case studies hasenhanced the position of empirical research strategies. Citation data collection has become themost popular data collectionmethod, reflecting the popularity of S&PC as a research topic. IRexperiment as data collection method has lost some of its standing due to the shrinking shareof IS&R research. A positive sign has been the growing use of multiple methods in datacollection. It seems that pluralism in the use of research strategies has strengthened. While in2005 in three major research topics one research strategy dominated, in 2015 this held only inone topic. Thus, the research strategies had distributed more evenly across major topics thanearlier. In all, our results suggest, that although research in LIS has accumulated in majorresearch areas, versatile use of research methods has increased in these areas. As aconsequence, the account of research objects may have become more comprehensive.
The findings in this study help planning teaching in LIS by indicating continuously activeand currently hot topics of research and ways of approaching them methodologically. – Forexample, experimental design and citation analysis seem useful skills. In addition, the findings,and our approach to content analysis help research development through identifying, whichtopics have (not) been studied and which approaches have (not) been employed. In fact, theclassification system for content analysis can be seen as a multi-dimensional study designgenerator: each cell is a junction of topical and methodological choices.
A field of research may institutionalize both cognitively and socially (Whitley, 1984). Theformermeans a shared and coherent understanding of principal research problems and goals,ways of conceptualizing the research objects and methodologies to study them. The latterrefers to, e.g. university departments, journals and conferences representing the field ofresearch.
It is questionable whether the 50 years have led to cognitive institutionalization in LIS as awhole. There hardly exists a shared understanding of principal research problems and goals.Among the major research topics, the professionally motivated core, L&I activity research,
JD78,7
82
shrinks and fosters an endemic viewpoint (of intermediaries). In the other three major topics,the end-user’s, developer’s and no viewpoint are more common. This may indicate that themajor thrust of R&D in dissemination of information is around dissemination-processreengineering, not on its historical (or contemporary) forms. The other three major areasrather work with strongly institutionalized external disciplines than develop shared researchproblems, goals and approaches – S&PC with Science Studies, IS&R with Computer Science(cf. Chang, 2018) and Information Seeking with application fields like Medicine or HealthSciences (Deng and Xia, 2020) or Communication Studies and social sciences more generally.These other disciplines do not necessarily share the research goals of LIS sub-fields. It may bethat the growing interest of other disciplines toward research problems relevant to LIScombined with the growing interest of some major journals in the field to publish papersbelonging to the adjacent fields disintegrates LIS. Interdisciplinarity is fruitful in developingnew knowledge, but isn’t here a risk for LIS being absorbed by the stronger partners – bothcognitively and socially? Further study is needed to analyse these questions.
5.3 LimitationsThe dataset and type of analysis of the present study bring some inherent limitations to thefindings, which are in part discussed in the section on data. It is debatable how representativethe (selected) core scholarly LIS journals are for LIS research. There are also conferences thatcould be sources of LIS papers and therefore change the relative shares of some topics. Thefrequencies of topics do not inform about the content and evolution of research labeled by thetopic names. Finally, the moderate reliability values of some variables hint to care required ininterpreting our results.
6. ConclusionResearch in LIS has experienced structural changes during 1965–2015. In the topical profile ofLIS, the earlier strong emphasis on L&I services has declined notably, while S&PC has becomethemost popular topic. IS&Rhas kept its essential position, although its relative popularity hasdecreased during the last ten years analysed. Individuals are increasingly, but organizationsdecreasingly, the units of observation in the studies. Moreover, intermediaries’ view oninformation dissemination process has yielded to end-user’s view and recently to developer’sview. These changes are due to reorientation in LIS from L&I service organizations toinformation seeking and searching by individuals and development of tools for this.
Methodological changes also reflect changes in LIS topics. The popularity of empiricalresearch strategies has grown, while conceptual strategies have lost interest. Survey,scientometric methods, experiment, case studies and qualitative studies have gained inpopularity, while historical method has lost. Survey is an all-round strategy popular ininformation seeking, S&PC and L&I services. Experiment is typical in IS&R, whilescientometric methods are typical in S&PC. Interestingly, although research in LIS istopically accumulating increasingly into four major research topics, methodologically it isscattering increasingly into many approaches. Consequently, it is likely that LIS research hascreated a more versatile and valid account of its research objects during the years analysed.
References
Abrizah, A., Noorhidawati, A. and Zainab, A.N. (2015), “LIS journals categorization in the journalcitation report: a stated preference study”, Scientometrics, Vol. 102 No. 2, pp. 1083-1099.
�Astr€om, F. (2007), “Changes in the LIS research front: time-sliced cocitation analyses of LIS journalarticles, 1990–2004”, Journal of the Association for Information Science and Technology, Vol. 58No. 7, pp. 947-957.
LIS researchacross 50 years
83
Chang, Y.-W. (2018), “Examining interdisciplinarity of library and information science (LIS) based onLIS articles contributed by non-LIS authors”, Scientometrics, Vol. 116 No. 3, pp. 1589-1613.
Chang, Y.-W., Huang, M.-H. and Lin, C.-W. (2015), “Evolution of research subjects in library andinformation science based on keywords, bibliographical coupling, and co-citation analyses”,Scientometrics, Vol. 105 No. 3, pp. 20171-2087.
Chu, H. (2015), “Research methods in library and information science: a content analysis”, Library andInformation Science Research, Vol. 37 No. 1, pp. 36-41.
Deng, S. and Xia, S. (2020), “Mapping the interdisciplinarity in information behavior research”,Scientometrics, Vol. 124 No. 1, pp. 489-513.
Figuerola, C., Marco, F. and Pinto, M. (2017), “Mapping the evolution of Library and informationscience using topic modeling on LISA”, Scientometrics, Vol. 112 No. 12, pp. 1507-1535.
Han, X. (2020), “Evolution of research topics in LIS between 1996 and 2019: an analysis based onDirichlet allocation topical model”, Scientometrics, Vol. 125, pp. 2561-2595.
Hider, P. and Pymm, B. (2008), “Empirical research methods reported in high-profile LIS journalliterature”, Library and Information Science Research, Vol. 30, pp. 108-114.
Hou, J., Yang, X. and Chen, C. (2018), “Emerging trends and new developments in information science:a document co-citation analysis (2009-2016)”, Scientometrics, Vol. 115 No. 1, pp. 869-892.
Hsiao, T.-M. and Chen, K.-H. (2020), “The dynamics of research subfields for library and informationscience: an investigation based on word bibliographic coupling”, Scientometrics, Vol. 125 No. 1,pp. 717-737.
Huang, M.-H., Shaw, W.-C. and Lin, C.-S. (2019), “One category, two communities: subfield differencesin “information science and library science” in journal citation reports”, Scientometrics, Vol. 119No. 2, pp. 1059-1079.
J€arvelin, K. and Vakkari, P. (1990), “Content analysis of research articles in library and informationscience”, Library and Information Science Research, Vol. 12, pp. 395-421.
J€arvelin, K. and Vakkari, P. (1993), “The evolution of library and information science 1965–85: a contentanalysis of journal articles”, Information Processing and Management, Vol. 29 No. 1, pp. 129-144.
Li, P., Yang, G. and Wang, C. (2019), “Visual topical analysis of library and information science”,Scientometrics, Vol. 121 No. 3, pp. 1753-1791.
Liu, P., Wu, Q., Mu, X., Yu, K. and Guo, Y. (2015), “Detecting the intellectual structure of library andinformation science based on formal concept analysis”, Scientometrics, Vol. 104 No. 3, pp. 737-762.
Ma, J. and Lund, B. (2020), “The evolution of LIS research topics and methods from 2006 to 2018: acontent analysis”, Proceeding 83rd Annual Meeting of ASIS&T 2020, Vol. 57, p. e241, doi: 10.1002/pra2.241.
Milojevic�, S., Sugimoto, C.R., Yan, E. and Ding, Y. (2011), “The cognitive structure of library andinformation science: analysis of article title words”, Journal of the Association for InformationScience and Technology, Vol. 62 No. 10, pp. 1933-1953.
Miyata, Y., Ishita, E., Yang, F., Yamamoto, M., Iwase, A. and Kurata, K. (2020), “Knowledge structuretransition in library and information science: topic modeling and visualization”, Scientometrics,Vol. 125 No. 1, pp. 665-687.
Onyancha, O. (2016), “Forty-five years of LIS research evolution 1971-2015: an informetrics study ofthe author-supplied keywords”, Publishing Research Quarterly, Vol. 34, pp. 456-470.
Peritz, B.C. (1980), “The methods of library science research: some results from a bibliometric survey”,Library Research, Vol. 2 No. 3, pp. 251-268.
Sugimoto, C. (2011), “Looking across communicative genres: a call for inclusive indicators ofinterdisciplinarity”, Scientometrics, Vol. 86, pp. 449-461.
Tuomaala, O., J€arvelin, K. and Vakkari, P. (2014), “Evolution of library and information science, 1965-2005: content analysis of journal articles”, Journal of the Association for Information Scienceand Technology, Vol. 65 No. 7, pp. 1446-1462.
JD78,7
84
Ullah, A. and Ameen, K. (2018), “Account of methodologies and methods applied in LIS research: asystematic review”, Library and Information Science Research, Vol. 40 No. 1, pp. 53-60.
Vakkari, P. (1994), “Library and information science: its content and scope”, in Godden, I.P. (Ed.),Advances in Librarianship, Academic Press, San Diego, CA, Vol. 18, pp. 1-55.
Whitley, R. (1984), The Intellectual and Social Organization of the Sciences, Clarendon Press, Oxford.
Appendix 1
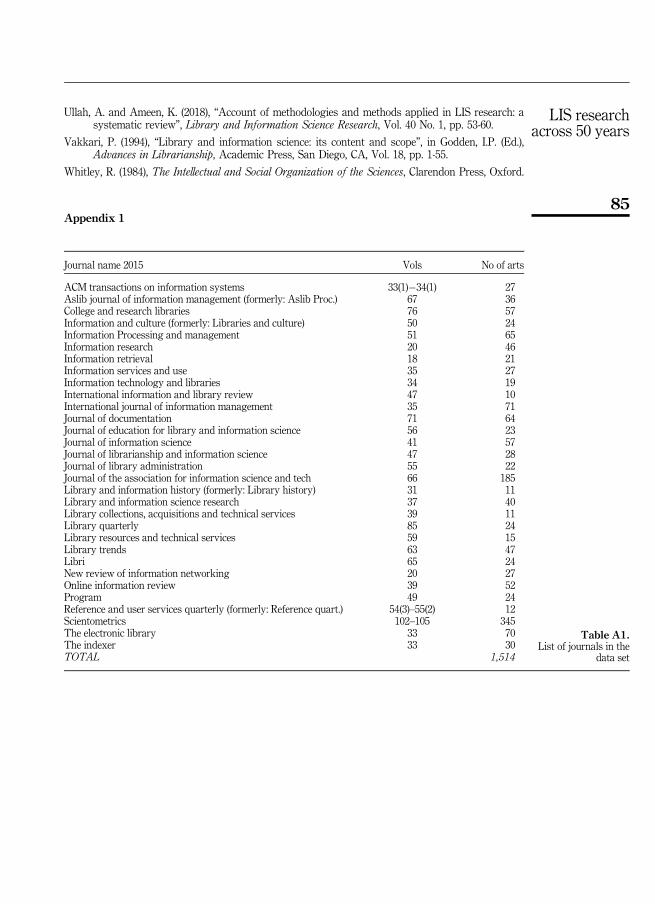
Journal name 2015 Vols No of arts
ACM transactions on information systems 33(1)�34(1) 27Aslib journal of information management (formerly: Aslib Proc.) 67 36College and research libraries 76 57Information and culture (formerly: Libraries and culture) 50 24Information Processing and management 51 65Information research 20 46Information retrieval 18 21Information services and use 35 27Information technology and libraries 34 19International information and library review 47 10International journal of information management 35 71Journal of documentation 71 64Journal of education for library and information science 56 23Journal of information science 41 57Journal of librarianship and information science 47 28Journal of library administration 55 22Journal of the association for information science and tech 66 185Library and information history (formerly: Library history) 31 11Library and information science research 37 40Library collections, acquisitions and technical services 39 11Library quarterly 85 24Library resources and technical services 59 15Library trends 63 47Libri 65 24New review of information networking 20 27Online information review 39 52Program 49 24Reference and user services quarterly (formerly: Reference quart.) 54(3)–55(2) 12Scientometrics 102–105 345The electronic library 33 70The indexer 33 30TOTAL 1,514
Table A1.List of journals in the
data set
LIS researchacross 50 years
85
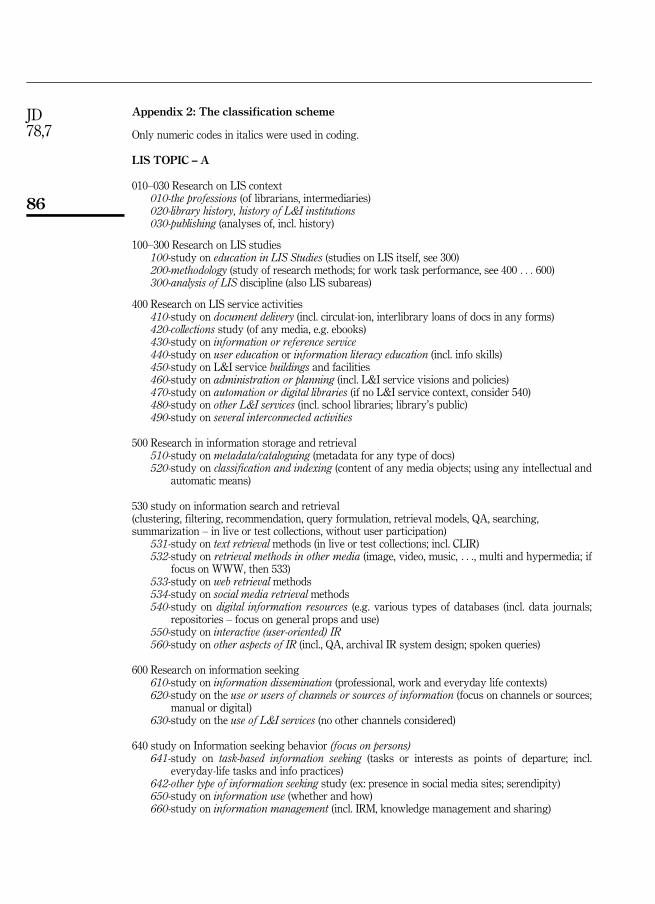
Appendix 2: The classification scheme
Only numeric codes in italics were used in coding.
LIS TOPIC – A
010–030 Research on LIS context010-the professions (of librarians, intermediaries)020-library history, history of L&I institutions030-publishing (analyses of, incl. history)
100–300 Research on LIS studies100-study on education in LIS Studies (studies on LIS itself, see 300)200-methodology (study of research methods; for work task performance, see 400 . . . 600)300-analysis of LIS discipline (also LIS subareas)
400 Research on LIS service activities410-study on document delivery (incl. circulat-ion, interlibrary loans of docs in any forms)420-collections study (of any media, e.g. ebooks)430-study on information or reference service440-study on user education or information literacy education (incl. info skills)450-study on L&I service buildings and facilities460-study on administration or planning (incl. L&I service visions and policies)470-study on automation or digital libraries (if no L&I service context, consider 540)480-study on other L&I services (incl. school libraries; library’s public)490-study on several interconnected activities
500 Research in information storage and retrieval510-study on metadata/cataloguing (metadata for any type of docs)520-study on classification and indexing (content of any media objects; using any intellectual and
automatic means)
530 study on information search and retrieval(clustering, filtering, recommendation, query formulation, retrieval models, QA, searching,summarization – in live or test collections, without user participation)
531-study on text retrieval methods (in live or test collections; incl. CLIR)532-study on retrieval methods in other media (image, video, music, . . ., multi and hypermedia; if
focus on WWW, then 533)533-study on web retrieval methods534-study on social media retrieval methods540-study on digital information resources (e.g. various types of databases (incl. data journals;
repositories – focus on general props and use)550-study on interactive (user-oriented) IR560-study on other aspects of IR (incl., QA, archival IR system design; spoken queries)
600 Research on information seeking610-study on information dissemination (professional, work and everyday life contexts)620-study on the use or users of channels or sources of information (focus on channels or sources;
manual or digital)630-study on the use of L&I services (no other channels considered)
640 study on Information seeking behavior (focus on persons)641-study on task-based information seeking (tasks or interests as points of departure; incl.
everyday-life tasks and info practices)642-other type of information seeking study (ex: presence in social media sites; serendipity)650-study on information use (whether and how)660-study on information management (incl. IRM, knowledge management and sharing)
JD78,7
86

700 Research on scientific and professional comm710-study on scientific/professional publishing (incl. reviewing)720-study on citation patterns and structures730-study on web-metrics (incl. alt-metrics)740-study on other aspects of scientific or professional communication
800-study on other aspects of LIS (e.g. task analysis, overview of library scene)900-study in another discipline on LIS forum (may be relevant but focus is outside LIS)
SCHOLARLINESS – R0-not research1-research
VIEWPOINT ON DISSEMINATION – P10-study on several interconnected phases of dissemination11-information producer’s viewpoint12-information seller’s (marketer’s) viewpoint13-intermediary’s viewpoint14-intermediary organization’s viewpoint15-end-user’s viewpoint16-end-user organization’s viewpoint17-viewpoint of the developer of the process or a service18-LIS educator’s viewpoint19-other viewpoint00-no viewpoint on information dissemination
SOCIAL LEVEL – S1-individual2-organizational3-societal4-multi-level0-not applicable
RESEARCH STRATEGY – M
10 empirical research strategy11-historical strategy12-survey strategy (typically quant analysis, but may include qual studies)13-qualitative strategy (prefer M 5 14–16)14-evaluation strategy15-case or action research strategy (incl. critical incident)16-content or protocol analysis (both qual and quant; incl. discourse analysis)17-citation analysis18-other bibliometric strategy (incl. co-authorship anal)21-secondary analysis22-experiment (incl. field experiment)29-other empirical method (catch-all for any other qual or quant strategy)
30 conceptual research strategy (non-empirical)31-verbal argumentation, criticism32-concept analysis (incl. terminology analysis)
40–90 strategies for other non-empirical studies40-mathematical or logical strategy (focus in formal definition)50-system and software analysis and design (constructive)60-literature review (research if analytical)
LIS researchacross 50 years
87
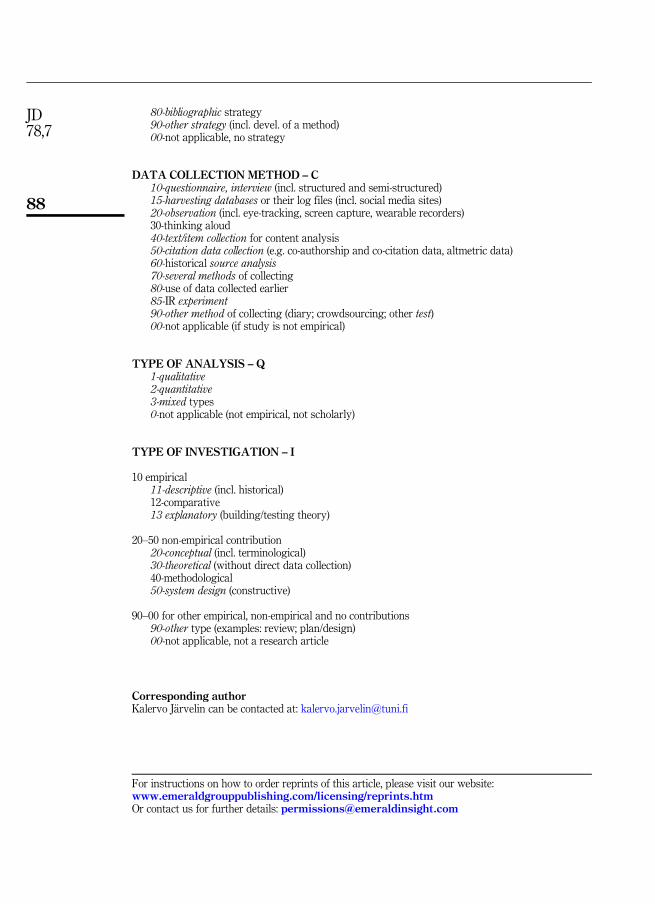
80-bibliographic strategy90-other strategy (incl. devel. of a method)00-not applicable, no strategy
DATA COLLECTION METHOD – C10-questionnaire, interview (incl. structured and semi-structured)15-harvesting databases or their log files (incl. social media sites)20-observation (incl. eye-tracking, screen capture, wearable recorders)30-thinking aloud40-text/item collection for content analysis50-citation data collection (e.g. co-authorship and co-citation data, altmetric data)60-historical source analysis70-several methods of collecting80-use of data collected earlier85-IR experiment90-other method of collecting (diary; crowdsourcing; other test)00-not applicable (if study is not empirical)
TYPE OF ANALYSIS – Q1-qualitative2-quantitative3-mixed types0-not applicable (not empirical, not scholarly)
TYPE OF INVESTIGATION – I
10 empirical11-descriptive (incl. historical)12-comparative13 explanatory (building/testing theory)
20–50 non-empirical contribution20-conceptual (incl. terminological)30-theoretical (without direct data collection)40-methodological50-system design (constructive)
90–00 for other empirical, non-empirical and no contributions90-other type (examples: review; plan/design)00-not applicable, not a research article
Corresponding authorKalervo J€arvelin can be contacted at: [email protected]
For instructions on how to order reprints of this article, please visit our website:www.emeraldgrouppublishing.com/licensing/reprints.htmOr contact us for further details: [email protected]
JD78,7
88