Embed Size (px)
Citation preview
7/28/2019 Liquid Penetration Modeling for Cloth Dyeing
http://slidepdf.com/reader/full/liquid-penetration-modeling-for-cloth-dyeing 1/8
Computational Aesthetics in Graphics, Visualization, and Imaging (2007)
D. W. Cunningham, G. Meyer, L. Neumann (Editors)
Liquid Penetration Modeling for Cloth Dyeing
Y. Morimoto†1 and R. Tsuruno2 and K. Tomimatsu2
1Guraduate School of Design, Kyushu University2Kyushu University
Abstract
This paper presents a model of cloth dyeing using the characteristics of the thread and weave pattern. The
proposed dyeing model is based on Fick’s second law that defines the molecular transfer under translational
diffusion [Fic85]. The algorithm in the proposed model calculates the dyeing distribution from parameters such
as the amount of dyeing, saturated amount, and pressure in each cell on a timeline. We improve the algorithm
based on Fick’s second law to consider a woven cloth structure and describe the proposed model of the structure
of woven cloth as a two-layer cellular model. We then visualize the cloth using a simple 2D shading method of
asperity by using the color distribution on a dyed image of real woven cloth. In addition, we provide a method for
producing dyeing patterns without dyeing diffusion. The proposed method produces images that capture several
of the characteristics of dyeing observed in real dyed cloth.
Categories and Subject Descriptors (according to ACM CCS): I.3.3 [Computer Graphics]: Picture/Image Generation
1. Introduction
Dyeing is a traditional method of imbuing a cloth with color.
It is a traditional art form that produces interesting patterns,not only according to the artist’s intent, but also unaccount-
able physical factors. However, liquid penetration into cloth
is a complicated phenomenon from a scientific and physi-
cal standpoint, and the pattern and color of dyed cloth is a
function of the physical properties of the dye and the fabric.
In other words, dyeing cannot be completely controlled by
the fabric-dyeing artist. Predicting the actual result of dyeing
using graphics would be useful for designing cloth with ac-
curacy, especially since the dyeing process is a troublesome
task in reality. More people would be interested in the dyeing
process if they could better predict the final product.
Most existing non-photorealistic rendering research has
examined fine arts such as painting and drawing. In thisarea, images are generated with paper and canvas textures.
Dyeing is an art equivalent to painting, with cloth as the
medium instead of canvas or paper. In order to characterize
dyeing, physical models of cloth dyeing and models repre-
senting the texture of cloth are essential. Furthermore, we
must construct a design system to represent the art form of
† Chairman Eurographics Publications Board
dyeing, such as creating patterns on cloth with dye. There-
fore, we propose a comprehensive model of these elements,
which are necessary for the visual simulation of dyeing. The
present paper is organized as follows: The following section
presents related work. Sections 3 and 4 describe dyeing and
the visual characteristics associated with the technique. Sec-
tion 5 describes dyeing simulation, and Section 6 presents
the results of the present study. Section 7 then describes pro-
gram usage, and Section 8 presents the conclusions of the
present study and describes areas for future study.
2. Related Work
The methods for simulating painting tools and drawing
strokes are progressing in the area of non-photorealistic ren-
dering (NPR). Some research in this area includes water-color painting and Chinese ink painting, both of which in-
volve the diffusion and pigment density color using pa-
per [GK91] [CAS∗97] [ZSyT∗99] [Lee01] [GK03] [CT05].
Curtis et al. [CAS∗97] presented a method for watercolor
effects such as dry-brushing, intentional backruns, and flow
patterns. Their model simulates three phenomena: the flow
of water on paper, the flow through paper fibers, and pigment
deposition. They successfully simulated watercolor paint on
paper. Chu et al. [CT05] developed a novel method for rep-
c The Eurographics Association 2007.
7/28/2019 Liquid Penetration Modeling for Cloth Dyeing
http://slidepdf.com/reader/full/liquid-penetration-modeling-for-cloth-dyeing 2/8
Y. Morimoto & R. Tsuruno & K. Tomimatsu / Liquid Penetration Modeling for Cloth Dyeing
resenting the real drawing of a fluid on absorbent paper with
the Lattice Boltzmann equation in real time.
There has been some research on methods, such as the
batik method, that can be employed for painting on cloth.
Wyvill et al. [WvOC04] presented an algorithm for simu-
lating the cracks found in batik. Their method can produceconvincing patterns that capture many of the characteristics
of the crack patterns found in real batik cloth. Also, Drago
et al. [DC04] performed simulations of the canvas used for
easel paintings. Their work represents real woven canvases
and considers weaving patterns and canvas aging. However,
the texture of the cloth is not included in Wyvill’s algorithm,
and the diffusion of paint in cloth is not considered in either
Drago’s or Wyvill’s research.
There has also been some research on the methods for the
visualization of cloth. These studies attempted to represent
interwoven threads and to model the interaction of light with
the threads of cloth in detail [WAT92] [XCL∗01] [SYO04].
However, this level of detail is not always necessary and wetherefore focused on the structure of the cloth for diffusion.
We therefore propose a very simple rendering method for
cloth that is suitable for representing dyeing.
To simulate dyeing, it is necessary to consider the weave
structure of the warp and weft. In this research, we represent
dyeing by the interaction of weave patterns and the diffusion
of dye.
3. Outline of Dyeing
The purpose of dyeing is to change the color of cloth, that
is, to bond dye tightly to fabrics. The key elements of dyeing
are cloth, dye, and dyeing techniques, each of which consists
of numerous finer aspects.
Cloth is a fabric structure woven from threads, which are
in turn composed of fibers. Since the dye diffuses along these
fibers in a cloth, the directional characteristics of the thread
have a marked affect on dye diffusion into the cloth. The
two-directional thread characteristics of woven cloth are re-
ferred to as the weft and warp and the type of cloth is classi-
fied according to its weave pattern. The most well known
weaving pattern is a plain-woven pattern. A plain weave
is the style of weave in which the weft alternates over and
under the warp. However, in addition to the weave pattern,
there are other elements that affect dyeing, such as the inter-
val between fabrics. Narrow intervals between fabrics pre-
vent dyeing [Oki94] [Kur96] [Sak99] [Yos02].
Since dyeing techniques are important for determining
how dyeing is applied as an art form, we describe the fol-
lowing common dyeing process using the example shown in
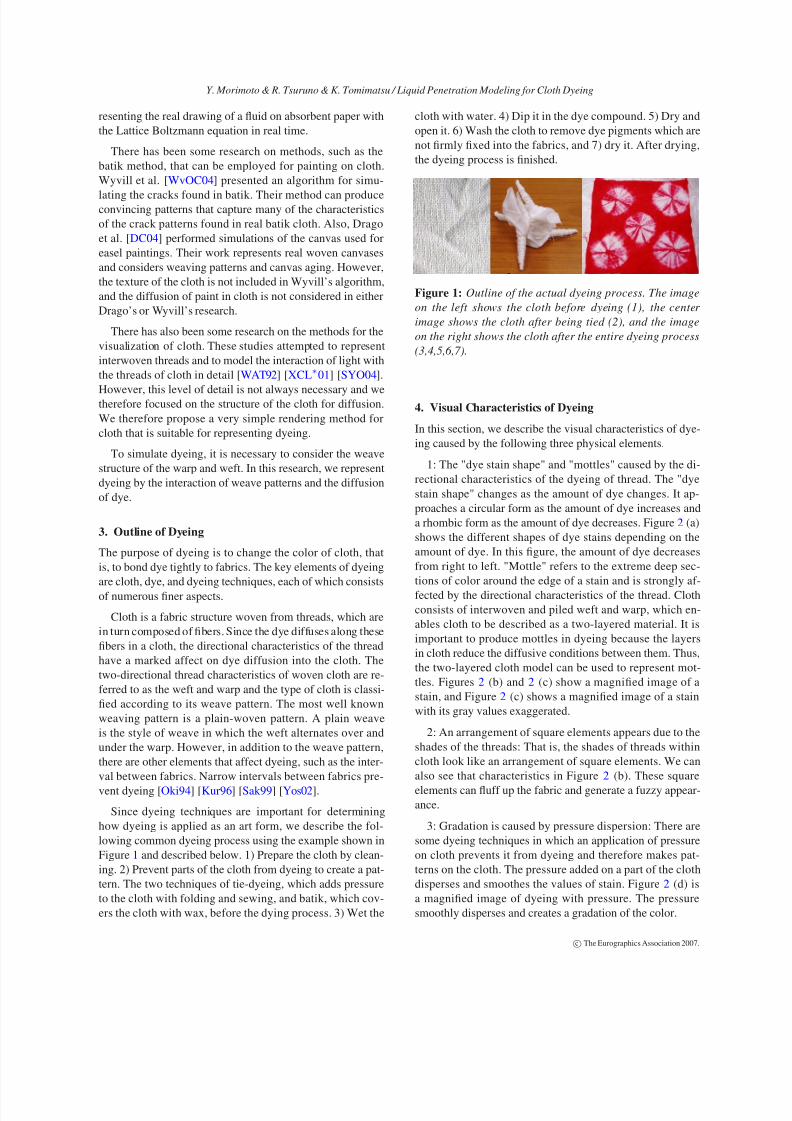
Figure 1 and described below. 1) Prepare the cloth by clean-
ing. 2) Prevent parts of the cloth from dyeing to create a pat-
tern. The two techniques of tie-dyeing, which adds pressure
to the cloth with folding and sewing, and batik, which cov-
ers the cloth with wax, before the dying process. 3) Wet the
cloth with water. 4) Dip it in the dye compound. 5) Dry and
open it. 6) Wash the cloth to remove dye pigments which are
not firmly fixed into the fabrics, and 7) dry it. After drying,
the dyeing process is finished.
Figure 1: Outline of the actual dyeing process. The image
on the left shows the cloth before dyeing (1), the center
image shows the cloth after being tied (2), and the image
on the right shows the cloth after the entire dyeing process
(3,4,5,6,7).
4. Visual Characteristics of Dyeing
In this section, we describe the visual characteristics of dye-
ing caused by the following three physical elements.
1: The "dye stain shape" and "mottles" caused by the di-
rectional characteristics of the dyeing of thread. The "dye
stain shape" changes as the amount of dye changes. It ap-
proaches a circular form as the amount of dye increases and
a rhombic form as the amount of dye decreases. Figure 2 (a)
shows the different shapes of dye stains depending on the
amount of dye. In this figure, the amount of dye decreases
from right to left. "Mottle" refers to the extreme deep sec-
tions of color around the edge of a stain and is strongly af-
fected by the directional characteristics of the thread. Cloth
consists of interwoven and piled weft and warp, which en-
ables cloth to be described as a two-layered material. It is
important to produce mottles in dyeing because the layers
in cloth reduce the diffusive conditions between them. Thus,
the two-layered cloth model can be used to represent mot-
tles. Figures 2 (b) and 2 (c) show a magnified image of a
stain, and Figure 2 (c) shows a magnified image of a stain
with its gray values exaggerated.
2: An arrangement of square elements appears due to the
shades of the threads: That is, the shades of threads within
cloth look like an arrangement of square elements. We can
also see that characteristics in Figure 2 (b). These square
elements can fluff up the fabric and generate a fuzzy appear-
ance.
3: Gradation is caused by pressure dispersion: There are
some dyeing techniques in which an application of pressure
on cloth prevents it from dyeing and therefore makes pat-
terns on the cloth. The pressure added on a part of the cloth
disperses and smoothes the values of stain. Figure 2 (d) is
a magnified image of dyeing with pressure. The pressure
smoothly disperses and creates a gradation of the color.
c The Eurographics Association 2007.

7/28/2019 Liquid Penetration Modeling for Cloth Dyeing
http://slidepdf.com/reader/full/liquid-penetration-modeling-for-cloth-dyeing 3/8
Y. Morimoto & R. Tsuruno & K. Tomimatsu / Liquid Penetration Modeling for Cloth Dyeing
Figure 2: Characteristics of cloth dyeing.
5. Dyeing Simulation
In this section we describe the proposed methods for mod-
eling cloth and dyeing diffusion and for the visualization of
the above characteristic phenomena.
5.1. Cloth Model
In a previous study on NPR, paper and cloth were rep-
resented using a two-dimensional model. There is an ad-
vantage to reducing the computational cost in the two-
dimensional paper model. In addition, since the model is ca-
pable of simulating painting it is thus suitable as an artistic
tool. However, as described in Section 4, a two-dimensional
model is not well suited to representing dyeing characteris-
tics. In the proposed model, we introduce a two-layered cloth
model in order to minimize z-axis factors.
We use a cellular model to represent the cloth. First, we
make a thread model by arranging the cells. Second, we con-
struct cloth with thread models corresponding to the weaving
pattern (Figure 3). The cells are then modeled as cloth, suchthat their size is equal to the width of each thread which has
a different diameter. We use a random distribution for the di-
ameter of wefts and warps for a more natural representation.
First, diameter w1 (for the weft) and w2 (for the warp) are
defined at the user’s discretion. Next, the proposed model
decides all values of the diameter of each weft and warp in a
random range that is based on w1 and w2. The weft and warp
are then constructed into a two-layer structure, as shown in
Figure 3. We set these two layers in the cloth model and both
of them appear according to the weaving pattern. Also, we
simulate a woven cloth based on this cellular cloth model for
dyeing and shading.
Figure 3: Cloth model. Blue color indicates weft. Yellow
color indicates warp. Cloth cells are used to model the
weave cloth pattern. Diffusion cells are used in the dyeing
model in section 5.2.
5.2. Dyeing Model
We assume that the dye diffuses into the plain-woven cloth.
Figure 3, cells that are dyed from pixel to pixel are defined as
diffusion cells. We assume that the cloth is wet in the model
according to an actual dyeing process, so its physical envi-
ronment involves dipping the cloth into the dye.
In the dyeing system, the proposed cellular model de-
cides whether each pixel belongs to the weft or the warp.
Then, diffusion dyeing occurs on each pixel depending on
its properties. We extend the diffusion equation to include
weaving patterns; this original equation is Fick’s second law,
which represents the molecular transfer under the conditionof translational diffusion. We show the process of dye diffu-
sion below.
1. We set the values of the parameters on all pixels.
<Parameters on a pixel>
• Concentration of physical quantity of dye:
(c in weft, s in warp)
• Position in the weft or warp:
(i, j)
• The number of time steps:
(t )
• Interval time for one step:
(Δt )• Interval between pixels:
(Δd for x and y-axis, Δ z for z-axis)
• Diffusion coefficient:
( Dc in weft, Ds in warp)
• Pressure:
(Pc in weft, Ps in warp)
• The minimum saturation a pixel must have before it can
diffuse to its neighbors when the cloth is dry to begin with:
(ε)
c The Eurographics Association 2007.
7/28/2019 Liquid Penetration Modeling for Cloth Dyeing
http://slidepdf.com/reader/full/liquid-penetration-modeling-for-cloth-dyeing 4/8
Y. Morimoto & R. Tsuruno & K. Tomimatsu / Liquid Penetration Modeling for Cloth Dyeing
• Adsorption rate:
(a)
Pressure affects the diffusion coefficient and capacity as we
describe below in this section. If ε is 0, we suppose that the
cloth is wet in advance. There is another parameter that is
adsorption rate a to stop the diffusion, which is a constant
rate in all cells. These parameters represent the difference
between wet to dry cloth.
2. The user indicates the dyeing areas by drawing or in-
putting an image. We define the dyeing areas in a dyeing
table. Also, the user can indicate areas where pressure is ap-
plied in a way that is similar to having pressure being applied
to the cloth. This pressure was defined using pressure tables,
which indicate where each function is being applied. In ad-
dition, these tables indicate the degree of pressure and the
amount of dye. However, in the case of generating a stain,
the user indicates a point on a screen. Then, the cells in a
certain range are saturated according to the amount of dye.
3. If the process includes pressure on the cloth as a dye-
ing technique, the pressure value is decided by the pressure
distribution as shown in Figure 4. First, RGB values are
smoothed by linear interpolation. Second, the values exceed-
ing a certain value are set as maximum pressure 0.0, where
minimum pressure is 1.0. The max is 0.0, which indicates
that no dye is bonded. The minimum RGB values are set
as the minimum pressure, 1.0. For simplicity, the RGB val-
ues between the maximum and minimum are converted to
pressure values in the 0.0 to 1.0 range to adjust the diffusion
coefficient such that a natural pressure dispersion is created.
This process does not occur without adding pressure to the
design.
4. Dye diffusion occurs in the threads. Dye compound is
applied where it is indicated in the dyeing table. The amount
of dye is user defined and is also defined by converting the
RGB values from the dyeing table. Next, dye diffusion be-
gins, with diffusion based on the formula of Fick’s second
law:
∂φ
∂t = D
∂2φ
∂d (1)
where D is diffusion coefficient, φ is a concentration of dif-
fuse matter such as dye. And discretized form of Formula
(1) is
φt +1i, j = φt
i, j +ΔtD(φt
i+1, j −φt i, j)+ (φt
i+1, j −φt i, j)
Δd 2(2)
Defines the one-dimensional molecular motion under the
condition of translational diffusion. Dye diffusion is based
on one-dimensional diffusion on the thread to be affected by
the dimensional characteristics of the thread. In addition, the
diffusion can be assumed to affect crossing threads. There-
fore, we improve formula 2 so as to consider the diffusion to
the crossing threads:
ct +1i, j = ct
i, j+
Δt
D1
(ct i+1, j−ct
i, j)+(ct i+1, j−ct
i, j)
Δd 2+ D2
(st i, j−ct
i, j)
Δ z2
(3)
where D1 is the diffusion coefficient in the same thread and
direction as the thread of interest, D2 is the diffusion coef-
ficient in the cross thread in the z direction. We can repre-
sent various weaving patterns using the above formula, as
illustrated in Figure 5. Furthermore, we define the diffusion
coefficient Dc, Ds randomly. This is different from the diffu-
sion coefficient D in the original diffusion equation, which
is a constant. However, Dc, Ds varies with position and the
properties of the cloth. Since the diffusion coefficient varies
with location in a real cloth, each pixel is assigned a different
value. Also, the diffusion coefficient is affected by the degree
of pressure because pressure prevents diffusion. Therefore,
we can compute Dc, Ds by setting:
D1 =
Dci+1, j+ Dci−1, j+ Dci, j
3
Pci+1, j+Pci−1, j+Pci, j
3
(4)
D2 =
Dsi, j+ Dci, j
2
Psi, j+Pci, j
2
(5)
Dc and Ds are set according to the diameter of each thread.
The capacity of dyeing of a cell depends on the pressure
value. Therefore, dye diffusion does not occur at all if the
pressure value is 0.0 in the proposed system. Also weave
patterns affect Dc and Ds by multiplication with arbitrary
decimal figure when position of the weft of warp in z-axis is
changing.
In the proposed dyeing model, we do not set the amountof water and dye; instead, we set the concentration of the
physical quantity of dye c and s. This means that water sat-
urates the space where the dye is nonexistent. In the case of
dyeing dry cloth, we estimate dyeing using the same model,
but assume that the water is air and add a rule for the surface
tension of the liquid that stops the diffusion where the cell
has insufficient dye. We represent the absorption of dye on
fabrics by fixing absorption on a timeline at a constant rate.
Also, the proposed model represents dyeing unevenness. A
different diffusion coefficient for the bias of the fabric den-
sity and molecular concentration is used for dyeing uneven-
ness. We use random numbers to determine the diffusion co-
efficients for each thread (Figure 2 (e)).
The following is an example of the properties we employ
when we use a drop of dye on dry cloth with this model. We
set double capacity of dye in cells inside the area of a circle
with a radius of 30 pixels. We then apply the proposed dye-
ing model with properties such as those shown in Table 1 (1)
to produce the result shown in Figure 10 (a). Conversely, the
stain produced by of a drop of dye on a wet cloth produced
using the properties shown in Table 1 (2) is shown in Figure
10 (c).
c The Eurographics Association 2007.
7/28/2019 Liquid Penetration Modeling for Cloth Dyeing
http://slidepdf.com/reader/full/liquid-penetration-modeling-for-cloth-dyeing 5/8
Y. Morimoto & R. Tsuruno & K. Tomimatsu / Liquid Penetration Modeling for Cloth Dyeing
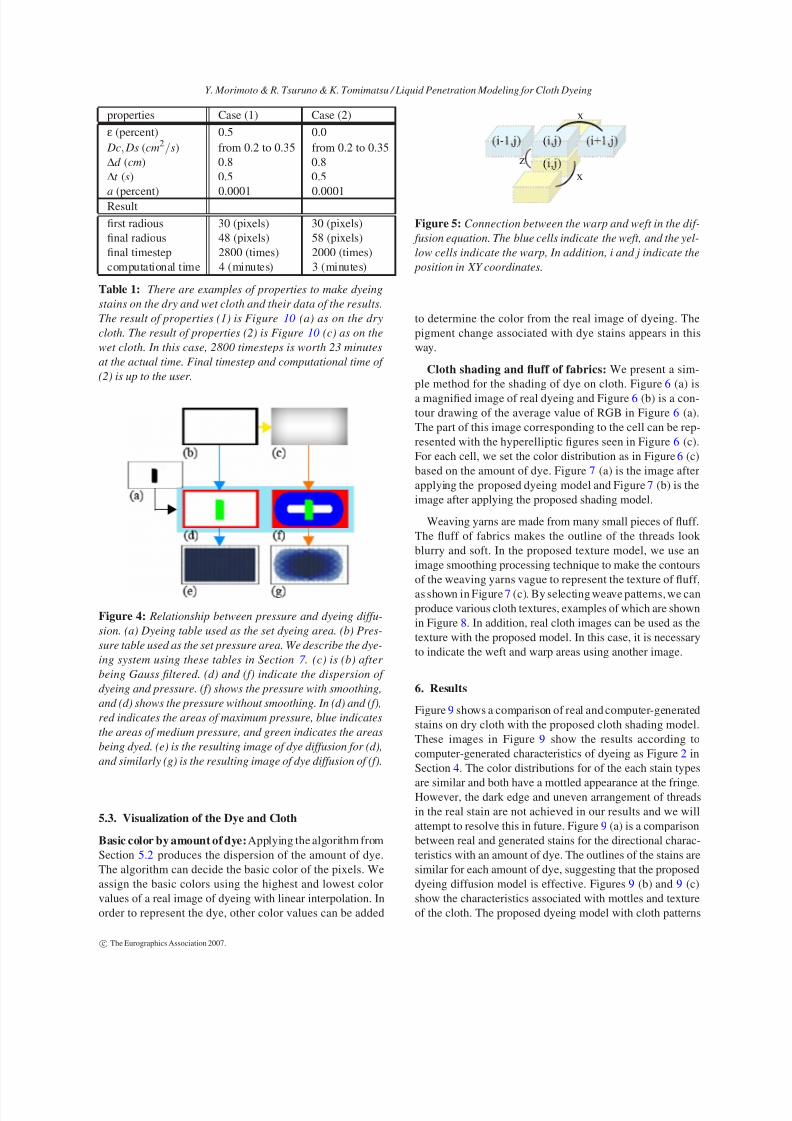
properties Case (1) Case (2)
ε (percent) 0.5 0.0
Dc, Ds (cm2/s) from 0.2 to 0.35 from 0.2 to 0.35
Δd (cm) 0.8 0.8
Δt (s) 0.5 0.5
a (percent) 0.0001 0.0001Result
first radious 30 (pixels) 30 (pixels)
final radious 48 (pixels) 58 (pixels)
final timestep 2800 (times) 2000 (times)
computational time 4 (minutes) 3 (minutes)
Table 1: There are examples of properties to make dyeing
stains on the dry and wet cloth and their data of the results.
The result of properties (1) is Figure 10 (a) as on the dry
cloth. The result of properties (2) is Figure 10 (c) as on the
wet cloth. In this case, 2800 timesteps is worth 23 minutes
at the actual time. Final timestep and computational time of
(2) is up to the user.
Figure 4: Relationship between pressure and dyeing diffu-
sion. (a) Dyeing table used as the set dyeing area. (b) Pres-
sure table used as the set pressure area. We describe the dye-
ing system using these tables in Section 7 . (c) is (b) after
being Gauss filtered. (d) and (f) indicate the dispersion of
dyeing and pressure. (f) shows the pressure with smoothing,
and (d) shows the pressure without smoothing. In (d) and (f),
red indicates the areas of maximum pressure, blue indicates
the areas of medium pressure, and green indicates the areas
being dyed. (e) is the resulting image of dye diffusion for (d),
and similarly (g) is the resulting image of dye diffusion of (f).
5.3. Visualization of the Dye and Cloth
Basic color by amount of dye: Applying the algorithm from
Section 5.2 produces the dispersion of the amount of dye.
The algorithm can decide the basic color of the pixels. We
assign the basic colors using the highest and lowest color
values of a real image of dyeing with linear interpolation. In
order to represent the dye, other color values can be added
x
z
x
Figure 5: Connection between the warp and weft in the dif-
fusion equation. The blue cells indicate the weft, and the yel-
low cells indicate the warp, In addition, i and j indicate the
position in XY coordinates.
to determine the color from the real image of dyeing. The
pigment change associated with dye stains appears in this
way.
Cloth shading and fluff of fabrics: We present a sim-
ple method for the shading of dye on cloth. Figure 6 (a) is
a magnified image of real dyeing and Figure 6 (b) is a con-
tour drawing of the average value of RGB in Figure 6 (a).
The part of this image corresponding to the cell can be rep-
resented with the hyperelliptic figures seen in Figure 6 (c).
For each cell, we set the color distribution as in Figure 6 (c)
based on the amount of dye. Figure 7 (a) is the image after
applying the proposed dyeing model and Figure 7 (b) is the
image after applying the proposed shading model.
Weaving yarns are made from many small pieces of fluff.
The fluff of fabrics makes the outline of the threads look
blurry and soft. In the proposed texture model, we use an
image smoothing processing technique to make the contours
of the weaving yarns vague to represent the texture of fluff,
as shown in Figure 7 (c). By selecting weave patterns, we can
produce various cloth textures, examples of which are shown
in Figure 8. In addition, real cloth images can be used as the
texture with the proposed model. In this case, it is necessary
to indicate the weft and warp areas using another image.
6. Results
Figure 9 shows a comparison of real and computer-generated
stains on dry cloth with the proposed cloth shading model.
These images in Figure 9 show the results according to
computer-generated characteristics of dyeing as Figure 2 in
Section 4. The color distributions for of the each stain types
are similar and both have a mottled appearance at the fringe.However, the dark edge and uneven arrangement of threads
in the real stain are not achieved in our results and we will
attempt to resolve this in future. Figure 9 (a) is a comparison
between real and generated stains for the directional charac-
teristics with an amount of dye. The outlines of the stains are
similar for each amount of dye, suggesting that the proposed
dyeing diffusion model is effective. Figures 9 (b) and 9 (c)
show the characteristics associated with mottles and texture
of the cloth. The proposed dyeing model with cloth patterns
c The Eurographics Association 2007.
7/28/2019 Liquid Penetration Modeling for Cloth Dyeing
http://slidepdf.com/reader/full/liquid-penetration-modeling-for-cloth-dyeing 6/8
Y. Morimoto & R. Tsuruno & K. Tomimatsu / Liquid Penetration Modeling for Cloth Dyeing
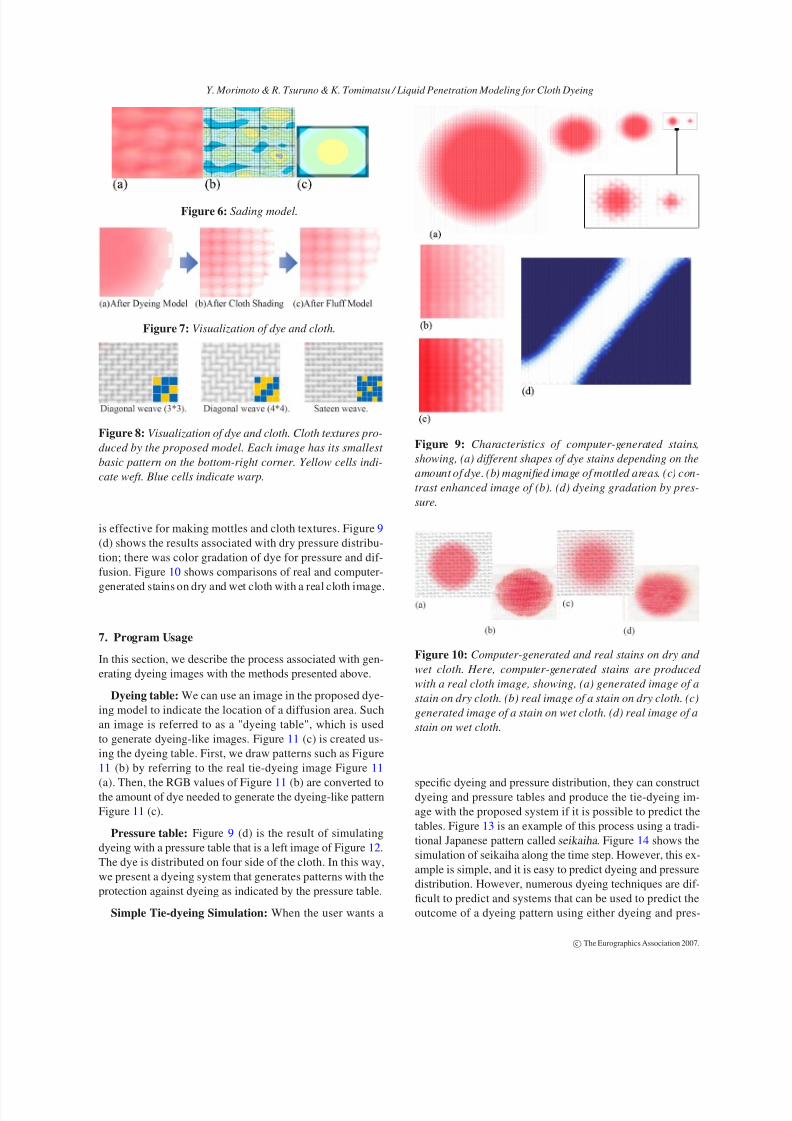
Figure 6: Sading model.
Figure 7: Visualization of dye and cloth.
Figure 8: Visualization of dye and cloth. Cloth textures pro-
duced by the proposed model. Each image has its smallest
basic pattern on the bottom-right corner. Yellow cells indi-
cate weft. Blue cells indicate warp.
is effective for making mottles and cloth textures. Figure 9
(d) shows the results associated with dry pressure distribu-
tion; there was color gradation of dye for pressure and dif-
fusion. Figure 10 shows comparisons of real and computer-
generated stains on dry and wet cloth with a real cloth image.
7. Program Usage
In this section, we describe the process associated with gen-
erating dyeing images with the methods presented above.
Dyeing table: We can use an image in the proposed dye-
ing model to indicate the location of a diffusion area. Such
an image is referred to as a "dyeing table", which is used
to generate dyeing-like images. Figure 11 (c) is created us-
ing the dyeing table. First, we draw patterns such as Figure
11 (b) by referring to the real tie-dyeing image Figure 11
(a). Then, the RGB values of Figure 11 (b) are converted tothe amount of dye needed to generate the dyeing-like pattern
Figure 11 (c).
Pressure table: Figure 9 (d) is the result of simulating
dyeing with a pressure table that is a left image of Figure 12.
The dye is distributed on four side of the cloth. In this way,
we present a dyeing system that generates patterns with the
protection against dyeing as indicated by the pressure table.
Simple Tie-dyeing Simulation: When the user wants a
Figure 9: Characteristics of computer-generated stains,
showing, (a) different shapes of dye stains depending on the
amount of dye. (b) magnified image of mottled areas. (c) con-
trast enhanced image of (b). (d) dyeing gradation by pres-
sure.
Figure 10: Computer-generated and real stains on dry and
wet cloth. Here, computer-generated stains are produced
with a real cloth image, showing, (a) generated image of a
stain on dry cloth. (b) real image of a stain on dry cloth. (c)
generated image of a stain on wet cloth. (d) real image of a
stain on wet cloth.
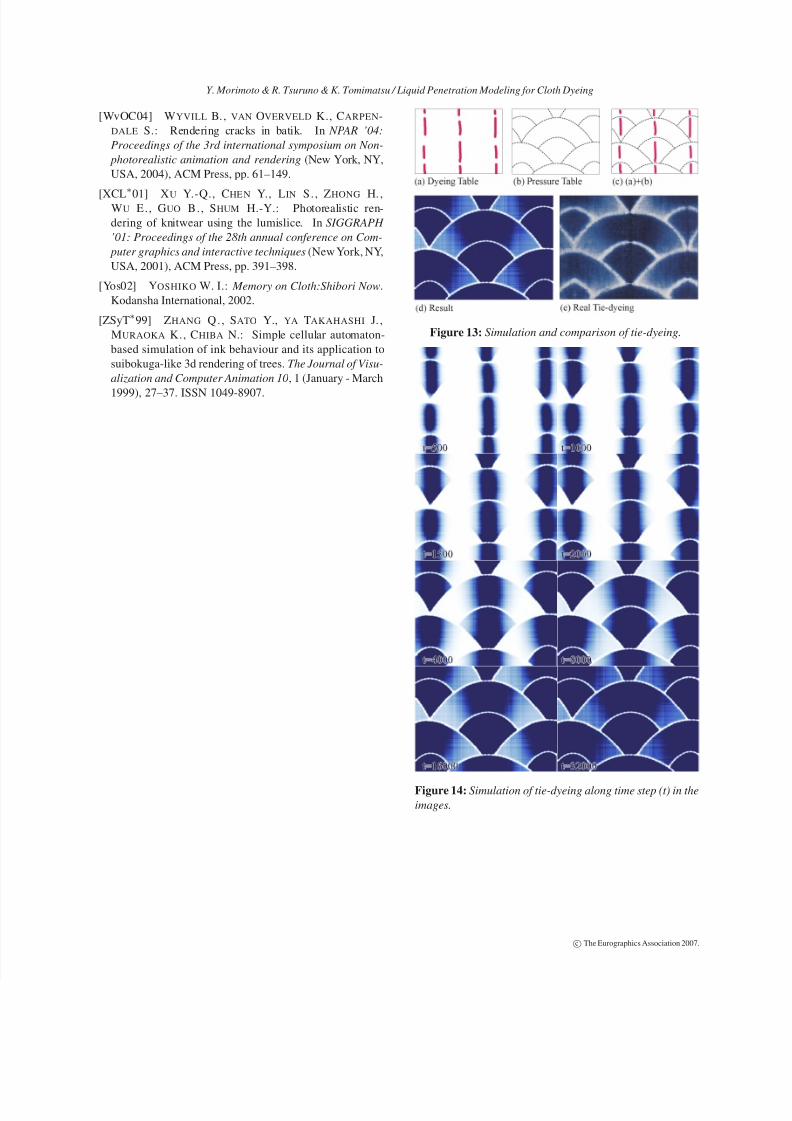
specific dyeing and pressure distribution, they can constructdyeing and pressure tables and produce the tie-dyeing im-
age with the proposed system if it is possible to predict the
tables. Figure 13 is an example of this process using a tradi-
tional Japanese pattern called seikaiha . Figure 14 shows the
simulation of seikaiha along the time step. However, this ex-
ample is simple, and it is easy to predict dyeing and pressure
distribution. However, numerous dyeing techniques are dif-
ficult to predict and systems that can be used to predict the
outcome of a dyeing pattern using either dyeing and pres-
c The Eurographics Association 2007.
7/28/2019 Liquid Penetration Modeling for Cloth Dyeing
http://slidepdf.com/reader/full/liquid-penetration-modeling-for-cloth-dyeing 7/8
Y. Morimoto & R. Tsuruno & K. Tomimatsu / Liquid Penetration Modeling for Cloth Dyeing
sure tables from the geometry of the cloth, or from the dye-
ing techniques that were employed during dying is our future
work.
8. Conclusion and Future Work
We have presented the dyeing model with an improved dif-
fusion equation that can be used to consider weaving pat-
terns, uneven diffusion coefficients, and different pressures
for a tie-dyeing simulation. In addition, the improved diffu-
sion equation presented herein cannot handle a wide range of
diffusion coefficients because it is not robust. Consequently,
the proposed model could be improved with more physi-
cal details such as gaps between the yarns. The extent of
coloring calculated from the dye amount could also be de-
fined physically with a suitable color coordinate system. It
is difficult to consider the appearances of gaps or the details
of cloth texture associated with dyeing in the present sys-
tem. These physical improvements would simplify the deci-
sions required by the user when using the proposed dyeingsystem. In addition, the proposed dyeing model should be
physically justified. Additional future improvements could
include increasing the speed of the proposed dyeing model
and assigning the resolution of the cells according to level of
detail of the cloth, adding mixed colors to the model, and so
on. The rendering of the cloth could be improved by mod-
eling the light interaction with the threads and 3D cloth ge-
ometry. Further research must be conducted to evolve the
proposed model so that it can interactively handle three-
dimensional configurations for the art of patterning cloth by
dyeing. Adding dyeing techniques such as batik and brush-
ing could also improve the completeness of the proposed
dyeing system.
References
[CAS∗97] CURTIS C. J., ANDERSON S. E., SEIMS J. E.,
FLEISCHER K. W., SALESIN D. H.: Computer-generated
watercolor. Computer Graphics 31, Annual Conference
Series (1997), 421–430.
[CT05] CHU N. S.-H., TAI C.-L.: Moxi: real-time ink
dispersion in absorbent paper. In SIGGRAPH ’05: ACM
SIGGRAPH 2005 Sketches (New York, NY, USA, 2005),
ACM Press, p. 62.
[DC04] DRAGO F., CHIBA N.: Painting canvas synthesis.
Vis. Comput. 20, 5 (2004), 314–328.[Fic85] FIC K A.: On liquid diffusion. Jour. Sci. 10 (1885),
31–39.
[GK91] GUO Q., KUNII T. L.: Modeling the diffuse
paintings of ’sumie’. Modeling in Computer Graphics
(1991).
[GK03] GUO Q., KUNII T. L.: "nijimi" rendering al-
gorithm for creating quality black ink paintings. cgi 00
(2003), 152.
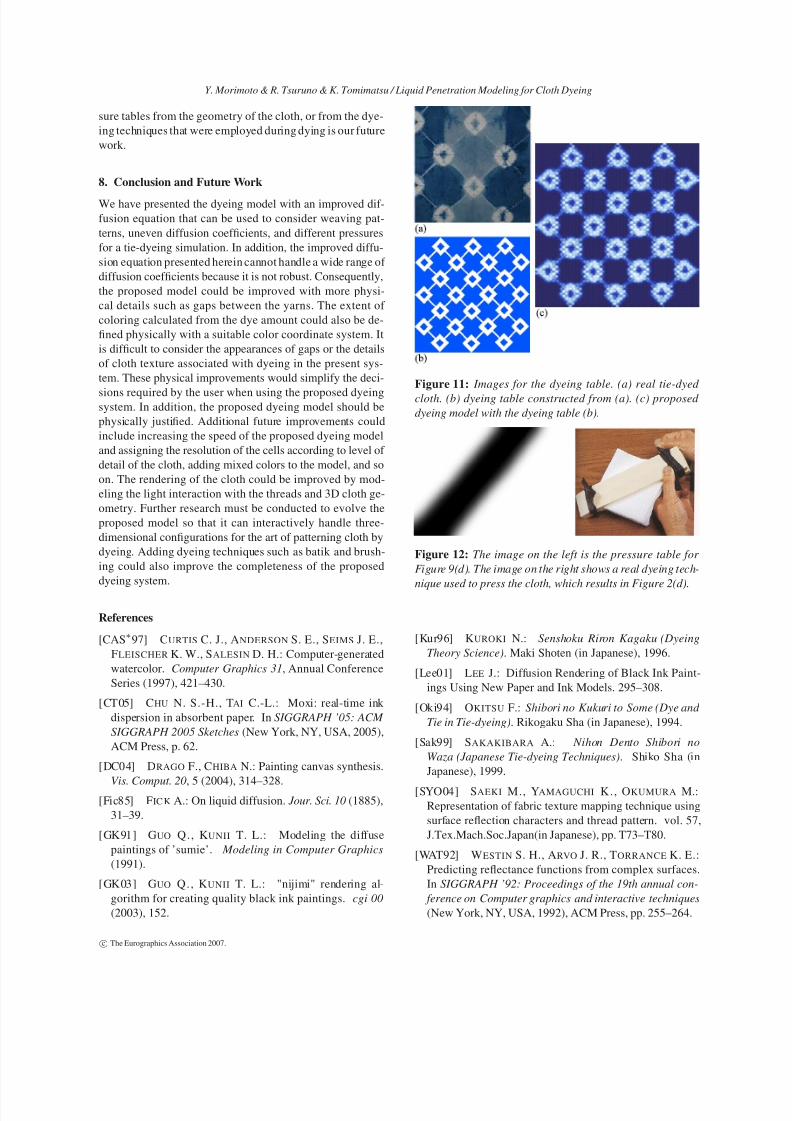
Figure 11: Images for the dyeing table. (a) real tie-dyed
cloth. (b) dyeing table constructed from (a). (c) proposed
dyeing model with the dyeing table (b).
Figure 12: The image on the left is the pressure table for
Figure 9(d). The image on the right shows a real dyeing tech-
nique used to press the cloth, which results in Figure 2(d).
[Kur96] KUROKI N.: Senshoku Riron Kagaku (Dyeing
Theory Science). Maki Shoten (in Japanese), 1996.
[Lee01] LEE J.: Diffusion Rendering of Black Ink Paint-
ings Using New Paper and Ink Models. 295–308.
[Oki94] OKITSU F.: Shibori no Kukuri to Some (Dye and
Tie in Tie-dyeing). Rikogaku Sha (in Japanese), 1994.
[Sak99] SAKAKIBARA A.: Nihon Dento Shibori no
Waza (Japanese Tie-dyeing Techniques). Shiko Sha (in
Japanese), 1999.
[SYO04] SAEKI M., YAMAGUCHI K., OKUMURA M.:
Representation of fabric texture mapping technique using
surface reflection characters and thread pattern. vol. 57,
J.Tex.Mach.Soc.Japan(in Japanese), pp. T73–T80.
[WAT92] WESTIN S. H., ARVO J. R., TORRANCE K. E.:
Predicting reflectance functions from complex surfaces.
In SIGGRAPH ’92: Proceedings of the 19th annual con-
ference on Computer graphics and interactive techniques
(New York, NY, USA, 1992), ACM Press, pp. 255–264.
c The Eurographics Association 2007.
7/28/2019 Liquid Penetration Modeling for Cloth Dyeing
http://slidepdf.com/reader/full/liquid-penetration-modeling-for-cloth-dyeing 8/8
Y. Morimoto & R. Tsuruno & K. Tomimatsu / Liquid Penetration Modeling for Cloth Dyeing
[WvOC04] WYVILL B., VAN OVERVELD K., CARPEN-
DALE S.: Rendering cracks in batik. In NPAR ’04:
Proceedings of the 3rd international symposium on Non-
photorealistic animation and rendering (New York, NY,
USA, 2004), ACM Press, pp. 61–149.
[XCL∗
01] XU Y.-Q., CHE N Y., LIN S., ZHONG H. ,WU E ., GUO B ., SHUM H.-Y.: Photorealistic ren-
dering of knitwear using the lumislice. In SIGGRAPH
’01: Proceedings of the 28th annual conference on Com-
puter graphics and interactive techniques (New York, NY,
USA, 2001), ACM Press, pp. 391–398.
[Yos02] YOSHIKO W. I.: Memory on Cloth:Shibori Now.
Kodansha International, 2002.
[ZSyT∗99] ZHANG Q . , SATO Y., YA TAKAHASHI J. ,
MURAOKA K., CHIBA N.: Simple cellular automaton-
based simulation of ink behaviour and its application to
suibokuga-like 3d rendering of trees. The Journal of Visu-
alization and Computer Animation 10, 1 (January - March
1999), 27–37. ISSN 1049-8907.
Figure 13: Simulation and comparison of tie-dyeing.
Figure 14: Simulation of tie-dyeing along time step (t) in the
images.
c The Eurographics Association 2007.