Embed Size (px)
Citation preview
\
AEDC-TR-91-1 ,
Liquid Film Cooling in Rocket Engines
William M. Grisson Physics Department Morehouse College
Atlanta, Georgia 30314
Match 1991
Final Report for Period June 1987 to December 1989
I Approved foe public release; distribution I$ unlimited. I
TECHNICAL REPORTS FILE C OP_Y.
.,~,,., . ,u~ ~,,~,. ' . , 'm~d
PROPERTY OF U.S. AIR FO~C~ TECHNICAL LIBRARY
ARNOLD ENGINEERING DEVELOPMENT CENTER ARNOLD AIR FORCE BASE, TENNESSEE
AIR FORCE SYSTEMS COMMAND UNITED STATES AIR FORCE
NOTICES
When U. S. Government drawings, specifications, or other data are used for any purpose other than a def'mitely related Government procurement operation, the Government thereby incurs no responsibility nor any obligation whatsoever, and the fact that the Government may have formulated, furnished, or in any way supplied the said drawings, specifications, or other data, is not to be refJh"ded by implication or otherwise, or in any manner licensing the holder or any other person or corporation, or conveying any rights or permission to manufacture, use, or sell any patented invention that may in any way be related thereto.
Qualified users may obtain copies of this report from the Defense Technical Information Center.
References to named commercial products in this report are not to be considered in any sense as an endorsement of the product by the United States Air Force or the Government.
This report has been reviewed by the Office of Public Affairs (PA) and is releasable to the National Technical Information Service (NTIS). At NTIS, it will be available to the general public, including foreign nations.
APPROVAL STATEMENT
report hu been reviewed and approved.
PAUL LACASSE, Capt, CF Facility Technology Division Directorate of Technology Deputy for Operations
Approved for publication:
FOR THE COMMANDER
KEITH L. KUSHMAN Technical Director Directorate of Technology Deputy for Operations
REPORT DOCUMENTATION PAGE Form Approved OMB No. 0704-0188
!
Pubh¢ reporting burden/or this collection of Information Is estlmlm.,d to average ! hour per response, Indndlng the time for reviewing instructions, mrchlng existln(j data sources, gilt hermg and maintaining the data needed, and completing and mv,ewlng t he c011e~lon of Information Send comments rega~llng this burden estimate or any othor aspect of this collection of Information. mdudln 9 suggestions for rnducln9 this burden, to Weshlngt(m Headquarters Sorvlces, Directorate for InfOrm,tim1 Operations and Reports, 121S Jefferson Davis Hlqhway r Sune 1204, Adlrviton. VA ;t2;10;R.4302, and to the Office of Management and Budget. Papemror, Reduction Project ~0704-01U). Washlnqton. DC 20503
I AGENCY USE ONLY (Leave blank) I 2. REPORT DATE [ 3 REPORTTYPE AND DATES COVERED March 1991 Final, June 1987- March 1989
4. TITLE AND SUBTITLE S. FUNDING NUMBERS
Liquid Film Cooling in Rocket Engines
6. AUTHOR(S)
Grissom, William M., Morehouse College
7 PERFORMING ORGANIZATION NAME(S) AND ADDRESS(ES)
William M. Grissom Physics Department Morehouse College Atlanta, GA 30314 9. SPONSORING/MONITORING AGENCY NAMES(S) AND ADDRESS(ES)
Arnold Engineering Development Center/DO Air Force Systems Command Arnold AFB, TN 37389-5000
F49620-85-C-0013
8. PERFORMING ORGANIZATION REPORT NUMBER
AEDC-TR-gl-1
10. S PONSORING/MONITORING AGENCY REPORT NUMBER
11 SUPPLE~IENTARY NOTES
Available in Defense Technical Information Center (DTIC).
12a DISTRIBUTION/AVAILABILITY STATEMENT
Approved for public release; distribution is unlimited. 12b. DISTRI6UTION CODE
13. ABSTRACT (Maximum 200 words)
A one-dimensional analytical model of I.iquid fi lm cooling in rocket engine, combustion chambers is developed and compared with existing data. Tile vapor generated at the li.quid interface greatly decreases the convective heat flux and is treatea as a "transp.iration m process. The radiant he.at i.s absorbed at the walls and transmitted to the liqui~l film by ooiling, which can.mad to burnout of the film. Downstream of the liquid film, the vapor provioes continued thermal protection to the wall and is treated as a gaseous film coofi.ng process. A standard correration is expressed in differential form to allow for t.he nonuniform free-stream f low in the nozzle. Liquid fi lm lengths are well predicted by t.he model. Downstream of the dry-out I)oint, wall temperatures are well predicted up to .t.he start of convergence. Downstream of the converging turn, a correction term, correlated by a "centrifugal paramgte.r," is required to accoun~ for increased mixing at the converging turn: Downstream of the throat, wall temReratures decrease very quickly because o7 acceleration of the boundary.layer gases, an effect not included in the model.
14. SUBJECT TERMS liquid-propellant rocket motors transpiration liquid film cooling heat bansfer gaseous film tooting 17 SECURITY CLASSIFICATION J 18 SECURITY CLASSIFICATION J 19 SECURITY CLASSIFICATION
OF REPORT I OF THIS PAGE I OF ABSTRACT UNCLASSIFIED U N C L A S S I F I E D UNCLASSIFIED
COMPUTER GE~,ERATED
15. NUMBEROF PAGES 74
16 PRICE CODE
20 LIMITATION OF ABSTRACT SAME AS REPORT
Standard Form 7.98 (Rev, 2-89) Prescrl~-sd by ANSI S~l Z)9.18 296-102
AEDC-TR-91-1
PREFACE
The research reported herein was sponsored by the Air Force Office of Scientific Research/AFSC under Contract F49620-85-C-0013/SB5851-0361 as a follow-on to work done in the summer of 1987 on the Universal Energy Systems Summer Faculty Research Program at Arnold Engineering Development Center, Arnold AFB, Tennessee. The author returned to AEDC during the summer of 1988 to continue work on the project. Apprecia- tion is extended to C. C. Limbaugh and W. K. McGregor for suggesting the topic, to M. A. Simmons for running the NASA equilibrium code, and to Mike Powell of the Air Force Astronautics Laboratory for providing numerous references to rocket test reports. M. K. Kingery supervised the Summer Faculty program at AEDC.
The reproducibles used in this report were supplied by the author.

AEDC-TR-91 - 1
CONTENTS
Pag_.__~e
1.0 INTRODUCTION .................................................. 5 2.0 LIQUID FILM EVAPORATION ...................................... 6
2.1 Convective Heat Transfer ....................................... 6 2.2 Radiative Heat Transfer ........................................ 11 2.3 Comparison With Other Analyses ................................ 16 2.4 Summary of Liquid Film Evaporation Analysis . . . . . . . . . . . . . . . . . . . . . 18
3.0 GASEOUS FILM COOLING ......................................... 21 3.1 Free Stream Turbulence ........................................ 23 3.2 Foreign Gas Injection .......................................... 24
3.3 Thermal Radiation ............................................. 25 3.4 Non-uniform Free Stream Flow .................................. 25 3.5 Turning Effects ................................................ 28
3.6 Chamber Contour ............................................. 29 3.7 Summary of Gaseous Film Cooling Analysis . . . . . . . . . . . . . . . . . . . . . . . . 30
4.0 COMPARISON WITH EXPERIMENTS ................................. 32
4.1 Liquid Film Evaporation ........................................ 32 4.2 Gaseous Film Cooling .......................................... 43
5.0 CONCLUSIONS ................................................... 49 REFERENCES .................................................... 50
ILLUSTRATIONS
Figure Pag___ee
1. Mechanics of Liquid Film Cooling ................................... 53
2. Transition to Fully-Developed Flow .................................. 54 3. Comparison of Transpiration Relations ............................... 55 4. Total Emittances of H20 and CO2 at I atm . . . . . . . . . . . . . . . . . . . . . . . . . . . 56
5. Gaseous Film Cooling Analysis ...................................... 57 6. Chamber Contour Parameters ...................................... 58 7. Comparison with Data of G. R. Kinney, et al . . . . . . . . . . . . . . . . . . . . . . . . . . 59 8. Comparison with Data of G. Morrell ................................. 60 9. Comparison with Data of R. C. Kesselring, et al . . . . . . . . . . . . . . . . . . . . . . . 61
I0. Comparison with Data of Ewen and Rousar . . . . . . . . . . . . . . . . . . . . . . . . . . . 62 I I . Correlation of Turn Turbulence with Centrifugal Parameter . . . . . . . . . . . . . 68 12. Comparison with Kinney's Figure 4 .................................. 69
NOMENCLATURE ................................................ 70
AEDC-TR-91-1
1.0 INTRODUCTION
Many liquid rocket engines employ a film of liquid fuel as thermal protection for the combustion chamber walls. This process was experimentally studied in the 1950's and 1960's, however no general analysis was developed. Since then a number of fundamental heat transfer studies have been performed which allow the liquid film cooling problem to be analyzed as a collection of several fundamental processes.
The mechanisms involved in liquid film cooling are depicted in Figure 1. Heat is transferred from the hot free stream gas to the liquid film by both radiation and convection. This energy is absorbed in vaporizing the liquid in the protective film on the wall. The vapor generated flows outward from the liquid film, decreas ing the normally expected convective heat flux by the well-known transpiration cooling process. Downstream of the liquid film the vapor mixes with the free stream gas entrained in the boundary layer, lowering the wall temperature through the well-known "gaseous film cooling" process. This provides thermal protection downstream of the dryout point.
The existing heat transfer correlations are for the flow of a low turbulence gas at constant velocity over a fiat plate. These were extended to the case of developing, accelerating, and turbulent free stream flows. Since the goal was to develop a simple model, suitable for design and test analysis, only a simple one-dimensional model was considered.

AEDC-TR-91-1
2.0 LIQUID FILM EVAPORATION
2.1 CONVECTIVE HEAT TRANSFER
The flow over the combust ion chamber walls is almost like that over a flat plate in a uni form free stream flow, the difference being that it arises f rom an effective stagnation point rather than an abrupt leading edge. However, for a turbulent boundary layer the exact starting conditions quickly become unimportant .
In the absence of the liquid film, the normal convective heat flux can be calculated using one of the many flat-plate data correlations (Reference 1). Most agree within 5%. One simple correlation with an analytical basis, t e rmed "Colburn's Equation", is based u p o n a 1 /7 th power law velocity profile (Reference 2). Expressed in terms of the friction factor, Cfi and the Reynold's number based upon the distance x from the leading edge:
Cfo = 0.0592 Rex'° .2 (Equation 2.1)
Using Reynold 's m o m e n t u m - h e a t analogy for tu rbu len t convect ion, a non-dimensional heat transfer coefficient, the Stanton number , is expressed:
St o = Z Cfo Pr "° .s (Equation 2.2)
Colburn 's Equation is applicable for Rex< 1.10 ~ . In most rocket engines this
condition is satisfied.
In a rocket engine there is a large tempera ture difference between the combus t ion gases and the l iquid film, so that the t empera tu re at which the propert ies are evaluated is important. It is c o m m o n practice in boundary layer correlations to evaluate properties at the free stream gas temperature. A correction factor for the free stream to wall temperature ratio is then multiplied, the exponent being 0.26, 0.4, o r 0.5 depend ing u p o n the au thor (References 3, 4, or 5, respectively). However, evaluating all of the propert ies at the mean temperature of the free stream and wall eliminates such correction factors, and is assumed here.
As the boundary layer grows, the cylindrical geometry becomes important. The most extensive measurements in fully-developed pipe flow at high temperatures were by Humble (Reference 6). He obtained a correlation which can be written
(using Nu = StRePr): "St o = 0.023 ReD "° .2 pr-0 .s (Equation 2.3)
6
AEDC-TR-91-1
where the Reynold's number is based on the pipe diameter. Humble found that if the property values were evaluated at the mean temperature, then no temperature correction factor was necessary.
Bartz (Reference 7) found that Equation 2.3 predicted the heat flux at the throat of an RFNA/N2 F4 rocket if the constant was 0 .026. In Bartz' tests the flow was not completely developed, which explains the slightly larger constant. This so-called "Bartz' Equation" has been commonly used to calculate convective heat fluxes in rocket engines. Not surprisingly, it usually underpredicts the convective heat flux upstream of the throat where the assumption of fully-developed flow is not justified.
For x>3.53 D the flat plate correlation (Equation 2.2) predicts a lower heat flux than that for fully-developed flow (Equation 2.3). Certainly the heat flux cannot fall below that for fully-developed flow. To patch these two limiting cases together, Equation 2.2 can be used, but with x replaced by an effective x e (Reference 8):
Xe = 3"53 D Ii + 13.53x ]-m ]-i/m
The exponent m = 1.£ gives the best comparison with the data of Barbin and Jones (Reference 9), as shown in Figure 2. Their data was taken at Re D = 388,000 which is in the range of the data analyzed in Section 4.1. The o p t i m u m exponen t is probably a function of the Re]mold's number .
The convective heat flux for the flow of free stream gas over the dry walls of the combust ion chamber is then calculated as:
Qconv = ho ~T
where h o = GmeanCpgSt o . Gmean is the gas mass flow per area, evaluated at the mean temperature between the gas and liquid film. It is scaled from the chamber
value (Gcl 0 as: Gmean = Gch(Tg/Tmean)[0Jg-Ul)/Ug ]
The second factor accounts for the velocity of the free stream relative to the liquid surface. The liquid surface velocity (UI) is given in Section 2.2.2.
7
A E D C - T R - 9 1 - 1
2.1.1 Free-stream Turbulence
The convective heat flux increases by a factor K t = 1 + 4.0 e t in the presence of an rms turbulence fraction, e t , in the free-stream flow (Reference I0).
Two studies measured the turbulence intensities in rocket engines. Hersch (Reference 11) found e t = 0 . I0 to 0.05 at distances o f 2 to 8 inches f rom the injector in a LOx/GH2 engine, while Talmor (Reference 12) found e t = 0.20 to 0.15 at distances of 6 to 23 inches from the injector in an N204/AzS0 engine.
2.1.2 Transpiration Corrections
The total heat flux due to both convection and radiation, Qtot, is absorbed in the liquid film, causing an initial temperature rise: dTl iq /dx=Qtot / (UCp) , where I" is the local liquid mass flow rate per circumference. After the liquid film reaches the saturation temperature, T v, the evaporation rate per area is:
;v : Qtot/A : (Qconv+Qrad)/A (Equation 2 . 4 )
This vapor flows away from the liquid film, similar to gaseous transpiration through a porous wall. Transpiration decreases the wall shear stress and convective heat flux by a factor dependant upon the '~lowing parameter ' : P , ~v /G .
The simplest transpiration analysis assumes that the transpiring vapor does not change the thickness of the viscous sublayer in the boundary layer. Normally the velocity profile in the viscous sublayer is linear. With b lowin~ it becomes an exponential function. The ratio of the wall shear stress in the blown (Tw) to unblown case (~wo) is:
Lw - z where: z = 2F ~wo e z - 1 Cfo
This analysis is t e rmed the "Couette flow model" (References 5 and 13) or alternatively "film theory" (Reference 14). Since StfCf/2, the convective heat flux is decreased by the same factor. It is convenient to rearrange the expression to a logarithmic form, where the argument contains the actual Stanton n u m b e r (St), rather than the unblown value (Sto). Substituting Qconv = St G Cpg AT, gives a simple result:
h__ = InCl+H) where: H = F = Cpgr~ T + Orad] h o H S t A L h J
AEOC-TR-91 - 1
Without radiation, the convective heat flux decrease depends only upon the non-dimensional factor Cpg~T/~, termed the "Spalding transfer number" in droplet evaporation research. With radiation, h must be determined implicitly.
Results of more sophisticated transpiration analyses are compared with the Couette flow model in Figure 3. Since the existing experimental data shows considerable scatter, there is no advantage in using the more complicated analyses.
To account for an injectant different than the free stream gas, the parameter H must be multiplied by a correction factor, K M, being either the vapor to gas specific heat ratio to the power 0.6 (References 5 and 15) or the gas to vapor molecular weight ratio to the same power (Reference 16), when Mc<Mg. These two forms are identical for ideal gases with the same 7. For M c >Mg, Rubesin (Reference 16) gives the exponent as 0.35. The data of References 5 and 15 was for M c < Mg only and thus does not contradict this second exponent. These corrections are confirmed by Landis' turbulent boundary layer model (Reference 3).
Since the specific heats were considered in the transpiration model, they should not require a separate accounting. However, a molecular weight difference would ~equire a correction term, because a lower density injectant would displace a greater volume in the boundary layer, decreasing the heat flux. The effect should be less p ronounced when the injectant has a greater density than the free stream gas, as given by Rubesin's second exponent. For this reason the correction term based upon the molecular weight ratio, as suggested by Rubesin, is used in the model as:
IM_S a where: a= 0.60 for M <M = c g KM Mc 0.35 for Mc>Mg
2.1.3 Liquid Film Disturbances
Two types of disturbance to the surface of the liquid film have been observed. These have been s tudied by Kinney (Reference 17), Knuth (Reference 18), and Gater (Reference 19).
The first type of disturbance is the appearance of random, small-scale structures, with a pebbled appearance. These disturbances are always present and cause an effective surface roughness which may increase the heat flux. Photographic studies show that the length scales of these disturbances decrease at
AEDC-TR-91-1
h i g h e r veloci t ies , a l t h o u g h no gene ra l c o r r e l a t i o n s w e r e d e t e r m i n e d (References 17, 18).
The other type of disturbance, realized at higher coolant flow rates, is the appearance of large waves traveling in the flow direction. These waves exist only at the upstream positions where the liquid film is thick enough to sustain them. The mass loss rate in the regions where these waves do exist is 2 to 4 times the normal evaporation rate, independent of the film thickness. Shearing of droplets from the crests of the waves, without evaporation, is considered the pr imary mechanism of increased mass loss.
The point of onset of the large waves is well defined. Knuth was able to correlate both his data and that of Kinney for the transition point. Assuming that the mixture above the liquid film is mostly vapor and that the vapor to liquid viscosity ratio is greater than 0.05, Knuth's correlation for the critical liquid mass flow per circumference is:
[~cr = 1.01 x 10 s ~v2//J£
Gater found quite different results. In photographic studies he noticed large waves only for water coolant. Mass was lost without evaporation for all of his test conditions. Fur thermore, the mass loss rate was dependant u p o n the local film thickness, proport ionate to the local flow rate.
These di f ferences might be expla ined by the different exper imenta l arrangements. Kinney and Knuth both measured the length of the liquid film for different liquid flow rates by determining the dryout point, using axially spaced thermocouples. Gater used a fixed film length and captured the excess liquid in a downstream slot. Obviously the potential existed for some of the liquid to flow past the capture slot. At high injection rates it is also difficult to insure that all of the liquid is placed on the wall. Knuth considered this p roblem in detail. Either of these problems might explain the different results of Oater. In favorably comparing his p roposed correlation with Kinney's data, Gater employed an adjustable constant and failed to properly account for quantities on a unit area basis.
Liquid film waves have also been s tudied with application to chemical processes. Hanrany and Hersham (Reference 20) give a correlation for the free stream velocity at the transition to large waves in terms of the gravitational constant. However, they were unable to explain the results of Kinney and Knuth in a horizontal tube. Apparently their correlation is useful only in vertical tubes at low gas velocities. Woodmansee and Hanratty (Reference 21) measured:
10

, AEDC-TR-91 - I
l 'cr = 0.0641 kg/m-s for water, which is about 3 times lower than predicted by Knuth's correlation. Of related interest, Tatterson and Dallman (Reference 22) give a correlation for the mean diameter of the droplets sheared off of the liquid film.
The present model is valid only when the liquid flow rate is below the critical value given by Knuth's correlation. The small-scale disturbances are not assumed to increase the convective heat flux.
2.2 RADIATIVE HEAT TRANSFER
In most rocket combust ion chambers the radiant heat flux is negligible in compar ison with the convective heat flux (References 23 and 24). However, the t ranspira t ion of vapor f rom the liquid film decreases the normal ly expected convective flux to the extent that the radiant flux may become d o m i n a n t in determining the liquid evaporation rate.
The radiation from combust ion products is difficult to calculate from first principles due to the complicated molecular spectra of the many species present. Molecular band models attempt to replace the actual spectral lines present with a statistical distribution of lines, having the same gross properties. Such model ing is a major research effort and was not warranted in the present study. However, with access to spectral codes, it is preferred to the simple approach described here.
Fortunately, in a high temperature, high pressure environment many of the gas spectral properties can be more simply treated. High temperature causes each spectral line to be "doppler broadened" due to kinetic mot ion. Even m o r e significant is "collision broadening", due to high pressure. This broadening tends to smear the spectrum lines together into cont inuous bands. With a large number of different species, there would be few gaps in the spectrum. Soot radiation aids in filling the gaps. In the limit, a very dense gas mixture in t he rmodynamic equilibrium radiates as a perfect blackbody.
2.2.1 Total Emittance of Gas
The total emittance of a gas is the ratio of the radiant intensity of the gas to that of a blackbody at the same temperature, averaged over the entire spectrum. This quantity is much easier to measure than the detailed spectral data and has been available for many years. Unfortunately data is available only for H 2 0 and CO2, however, this covers many cases of combustion interest since symmetric diatomic
11
A E D C - T R - 9 1 - 1
molecules, such as Ns, do not radiate significandy.
The most recent emittance data at I a~rn pressure is compiled by Siegel and Howell (Reference 25). This data is replotted in Figure 4 as a function of the optical density, Pop~ which is the gas partial pressure times the path length through the gas. Note that at very high optical densities the emittances reach limiting values, ~ i~ of 0.825 for HsO and 0.251 for COs. These curves may be analytically fit to a function:
, =, [1 + [ ~ f optl-n ] -1/n
with coefficients:
H20 T('K~ ctatm, m~ n i000 0.165 0.45 2000 0.90 0.65 3000 2.05 0.61
COs T ~°K) c(atm,m) n i000 0.05 0.6 1500 0.075 0.6 2000 0.15 0.6
A three point interpolation is used for temperatures between these.
A correction is required for pressures other than 1 arm by multiplying a correction factor, Kp, to each emittance. The curves for these pressure corrections are fit by the functions:
H20: Kp = 1 + C l { 1 - e x p [ ( 1 - P [ l + N w ] ) / C 2 ] )
where: CI = 0.26 + 0.74 exp(-2.5 PH20) Cs = 0.75 + 0.31 exp(-10 PH20) atm
COs: log10 Kp = 0.036 Pco2-°-4SS[l+(2 lOgl0P)-m]-l/m
where: m = 100 PCOs
An additional correct ion is necessary to account for overlaps in the two spectra. This correction (for T> 1200K) is fit by:
AE = 0.0551 K x [ 1 - e x p ( - 4 P o p t ) ] [ 1 - e x p ( - 1 2 . 5 P o p t ) ]
where: Kx = 1- I Nw+Nc2 N----X-w - 1 In
n = 5.5 [1+(1.09 Popt)-a'as]-I/8"a8
12
AEDC-TR-91-1
In the equations above:
PH20 , PCO= ' Popt <> atm•m P <> atm
N w = mole fraction of water in mixture
N c = mole fraction of CO2 in mixture
The total gas emittance is then:
~ g = e H 2 o + ~CO2"Ae
To evaluate these terms it is necessary to input the optical path length through the gas. Since this generally varies over the sight angle, the most direct method would be to calculate the emittance at a number of sight angles and to
average them, weighted by the projected area at each angle. However, a simpler approach is to use an overall effective length. A very simple expression is quite
accurate in determining the effective length (Reference 25): Leff=0.95(4V/A ) , where V is the chamber volume and A is the surrounding surface area.
In applying this formula, the downstream section of the chamber can be assumed to be an infinite cylinder, for which Le f t = 0.95 D. If the cloud of droplets coming out of the injector is assumed to be perfectly reflective, then the upstream
direction can also be considered an infinite cylinder. Since the droplets have numerous partially reflecting surfaces this is probably the best assumption.
Alternatively, if the droplets are assumed to be perfectly absorbing then the
effective upstream length is: L e f t = 0.95D[4x/(D+4x)]. The upstream and downstream emittances are then averaged to obtain the total emittance. With this assumption the radiant heat flux must be calculated at every axial position.
It is also necessary to consider the possibility of reflective walls. Reflective walls increase the effective sight paths. The simplest correction, due to Egleti
(Reference 26), is to multiply the effective length above by a factor A w to the power -0.85 ; where A w is the wall absorptivity.
With the gas emittance determined, the radiant heat flux is calculated as:
Qrad = o A w ~ g [Tg' - Tv 4 ]
where: o = 5.67 10 "s W/m 2 • • K'
13
AEDC-TR-91-1
A final concern is that the above relations are for the radiation from hot gases in chemical equil ibrium. However, there is evidence that the radiat ion from transient species can he important. Ziebland (Reference 26) measured an emittance of 0.22 in a small O2/H2 rocket operating at 10 arm. The radiation peak, which occurred at a posit ion 8 cm from the injector face, was almost three times the expected value. Some 20 cm downstream, the emittance settled to the expected value. This initially large radiation was attributed to radiation by transient OH. While the radiation from OH in aunospheric flames contributes only a faint blue glow o f no significant intensity, at high p re s su res it b ecomes significant (Reference 27). Since OH concentrations are difficult to calculate, radiation by OH was not considered in the present model.
2.2.2 Liquid Film Burnout
The radiant heat can penetrate the liquid film and be absorbed directly at the combust ion chamber walls. It is then conducted into the liquid film by boiling heat transfer. With a high enough heat flux the liquid film can "burnout", as in normal pool boiling.
The same geometry of a thin liquid film flowing across a heated surface has been studied by Monde and Katto (Reference 28), Katto and Ishii (Reference 29), and Mudawwar, et. al. (Reference 30). They all correlated the burnou t heat flux as:
Pv AU Pv 2
n 2
where Pv and p~ are the densities of the vapor and liquid, o is the surface tension, is the latent heat of vaporization, L is the length of the heated surface, and U is the
average velocity of the liquid film.
The constants fit to the data by each group and the parameter ranges are given below:
Group C nl n2 U(m/s~ L(cm~ 0.0591 0.725 0.333 3 to 26 0.56, 1 0.0164 0.867 0.333 1.5 to 15 1 - 2
0.0881 0.867 0.432 0.4 to 2 6.4, 12.7
Monde and Katto Katto and Ishii Mudawwar, et.al.
Monde and Katto s tudied a circular jet of water and Freon®113 impinging downward on a heated plate. Katto and Ishii s tudied a plane jet of water,
14
AEDC-TR-91-1
Freon®ll3 , and l , l , l - t r ichloroethane flowing across a heated plate. Mudawwar, et. al. s tudied a film of F luo r ine r# liquid (FC-72) flowing downward along a heated surface. Since they used a single liquid, they assumed the same density ratio exponent, n t , as Katto and Ishii. Since Katto and Ishii's test conditions appear to be closer to those for liquid film cooling in rocket engines, their correlation is used.
All of the researchers observed that when the critical heat flux was exceeded, the liquid film separated from the heated surface. Katto and Ishii observed that with water, the separation occurred upon first contact with the heated surface, whereas the organics main ta ined contact with the surface for s o m e distance before separating. Mudawwar, et. al. observed separat ion u p o n first contact with the surface for their Fluorinert o tests. They also observed that the film reattached to the surface when the surface temperature was decreased.
This total separation of the film from the surface in the experiments may have been due to the constant heat flux condition imposed. In a rocket engine the l iquid film wou ld be less susceptible to b u r n o u t than in these heat t ransfer experiments bemuse separation of the liquid film from the surface would generate a region of droplets and bubbles which would cause scattering, decreasing the radiative transmission through the film.
Use of these burnout correlations is questionable since they are expressed in terms of the overall heated length. Ideally, the burnou t point should be expressed in terms of local conditions, such as the local film thickness. They are mainly useful as an order of magnitude calculation. With this in mind, the burnout heat flux for several rocket fuels is calculated below for the case: L = 5 cm and U = 1.5 m/s , at a pressure of 100 psia (data Reference 31):
Fuel Tsat A P~ Pv o~ Qbo (°K) (10SJ/kg) (kg/m s) (kg/m s) (10-SN/m) (kW/m =)
MMH 433 663 720 9.79 20.2 419 AZ50 413 870 778 9.50 18. 548 H2 29 335 70 5.75 0.6 17.6
In most rocket engines the radiant flux slightly exceeds these critical values. However, some of the radiant heat is absorbed by the liquid film. Since hydrogen has such a low predicted burnout heat flux and does not absorb infrared radiation, it appears unsuitable for liquid film cooling.
Katto et. al. suggest a correct ion factor when the liquid is injected at a temperature below the saturation temperature, however it was not correlated over a
15
AEDC-TR-91-1
large range and is significandy larger than such correction factors for pool boiling. If the burnou t point is controlled only by local conditions, and the liquid is heated to the saturation temperature at the burnout point, then no sub-cooling correction should be necessary, therefore none is used in the present model.
The fraction of radiation transmitted through the liquid film is: exp(-~t) ; where a is the absorptivity of the liquid, averaged over the spec t rum of the radiation. The liquid film thickness, t, is calculated from the wall shear stress. Assuming laminar flow:
where I" is the local coolant mass flow per circumference. The surface shear stress, ~vo is calculated by Equation 2.1, with the transpiration correction of Section 2.1.2. For simplicity h / h o is used in place of ~w/~-wo.
The average liquid film velocity, needed for the correlation, is: U = I ' /(pt). The surface velocity of the liquid, needed in Section 2.1, is twice this average film velocity.
Using these values, the burnout heat flux is calculated with Katto and Ishii's correlation at each axial posit ion in the rocket chamber and compared with the radiant heat flux transmitted th rough the liquid film. A warning results when the radiant flux exceeds the burnou t heat flux. However, as discussed in Section 4.0, this bu rnou t warning was not found to give a reasonable compar ison with any of the data analyzed.
2.3 COMPARISON WITH OTHER ANALYSES
2.3.1 Purdue University Jet Propulsion Center (JPC):
A number of liquid film cooling analyses have been presented by researchers f rom the Jet Propuls ion Center at Purdue. In early studies Zucrow and Graham (Reference 32) attributed the increased mass loss rate after transition not to iargc surface waves, but to variations in the termination point of the liquid film a round the circumference. Zucrow and Sellers (Reference 33) attempted to model the mass transfer with no real success.
16
AEDC-TR-91-1
In a later analysis Warner and Emmons (Reference 34) gave a result which was restated by Ziebland (Reference 26). For the no blowing case it reduccs to an unusual result:
s t = (PrUg)'
It was not possible to r ep roduce their calculations with the suggested constants, even after correcting for an apparent sign error in their Equation 5, so their analysis was not considered further.
Gater, et. al. (Reference 35) a t tempted to relate all o f the p rev ious expressions f rom the .[PC. In a later report (Reference 19), Gater ment ions the transpiration analysis of Section 2.1.2, but discounts it due to the anomalies in his data ment ioned in Section 2.1.5.
2_~-2 Shembharkar and Pai (Reference 36)
These authors use a Prandfl mixing length turbulence model for the gas convect ion, coup l ed to a viscous flow mode l for the l iquid film. Landis (Reference 3) and Economis (Reference 37) repor ted similar turbulent boundary layer mode l s which gave no real improvemen t over the simple Couette flow transpiration model, so the need for this complexity is questionable.
In their da tum case, the starting boundary layer thickness is 12.5 ram, corresponding to a downstream starting position of x= 0.812 m, by the boundary layer growth relations of Section 3 .0 . Since the boundary layer is well developed u p o n contacting the relatively short liquid film, the evaporation rate should be a lmost constant. Instead, they calculate an initially high evapora t ion rate of 0.2 kg/s-m 2, d ropp ing exponentially to 0.124 kg/s-m 2 , possibly due to numerical problems. The simpler analysis of the present repor t predicts an almost constant evaporat ion rate o f 0.106 kg/s-m 2 . The difference between this and their final evaporation rate is exactly accounted for by the blowing correction factor (h/ho). It is not apparent that the m o m e n t u m of the transpiring vapor was properly included as a boundary condition in their model. This vapor m o m e n t u m is what causes the convective heat flux decrease in transpiration cooling.
17
AEDC TR 91 1
2.4 SUMMARY OF LIQUID FILM EVAPORATION ANALYSIS
This section summarizes the equations and calculation order used in the liquid film evaporation model. A simple algebraic formulation is given first, suitable when radiation is negligible and the flow is either fully-developed or purely boundary layer.
2.4.1 Simple Expression
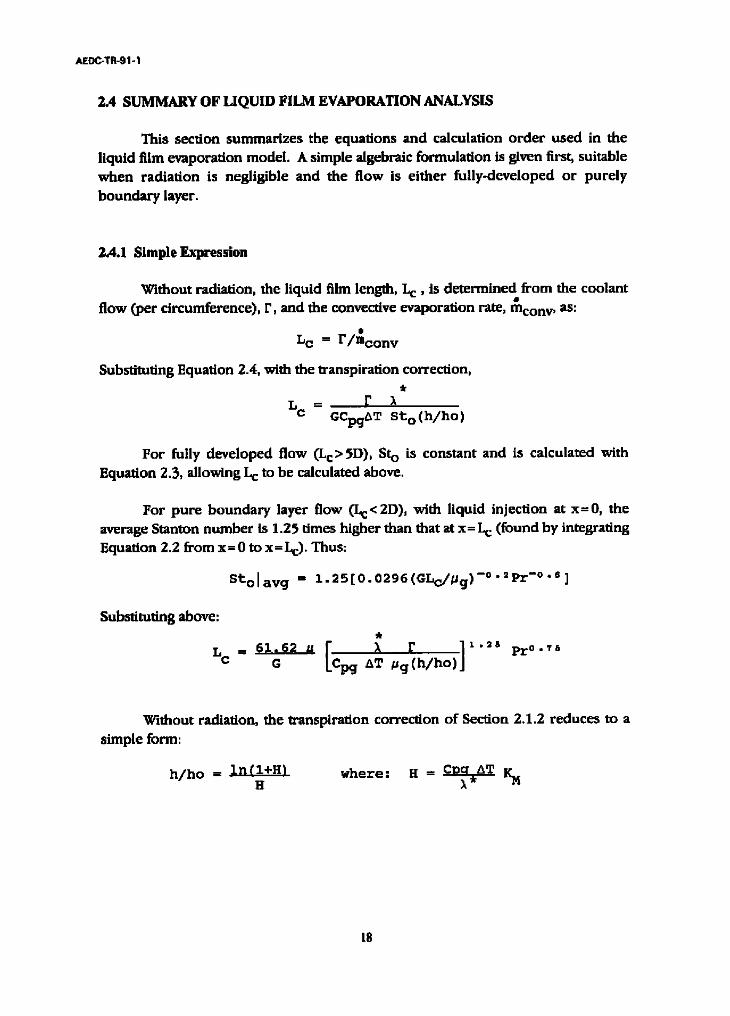
Without radiation, the liquid film length, L c , is determined from the coolant flow (per circumference), F, and the convective evaporation rate, mconw as:
L c = F/mconv
Substituting Equation 2.4, with the transpiration correction,
LC ffi g GCpgdT St o (h/ho)
For fully developed flow (Lc> 5D), St o is constant and is calculated with Equation 2.3, allowing L c to be calculated above.
For pure boundary layer flow (Lc<2D), with liquid injection at x=O, the average Stanton number is 1.25 times higher than that at x f L c (found by integrating Equation 2.2 from xffiO to x=Lc). Thus:
Stolavg : 1.25[0.0296(GLc/~g)-O-2Pr -°-6]
Substituting above:
LC = 61.62 u [ ), F ] 1 . 2 8 G Cpg AT ~g(h/ho)
p r O . 7 8
Without radiation, the transpiration correction of Section 2.1.2 reduces to a simple form:
Cpa AT h/ho ffi ln(l+HJ where: H = ~. K M H
18

AEDC-TR-91-1
2A.2 Complete Fomulation
The equa t ions used in the l iquid film evapora t ion FORTRAN p r o g r a m "liquid.for" are summar ized below.
The radiant emit tance of the hot combus t ion p roduc t s is calculated first in subrout ine "Emittance" as:
Eg = Emittance(T,Lefl~Tg,Nw, Nc)
where:
giving:
L e f t = 0.95 D Aw'° .a 8
Qrad ffi o A w ~ g [Tg' - Tv 4 ]
Subrout ine "Emittance" is a direct coding of the curve fits of Section 2.2.1. Parabolic interpolation is used between the three t empera tu re curves for CO 2
and H 2 0 in funct ion "Fit". Since a constant L e f t is a s sumed (i.e. reflective droplets), the radiative heat flux is constant, independent of axial position.
Axial steps:
Beginning at the liquid film injection point, the local convective coefficient wi thout transpiration is calculated as:
h o = KtG CpgSt o
where: K t = l+4e t "turbulence correction factor"
St ° = %CfPr-O.,
Cf = 0. 0592 Rex -° • 2
Re x = G Xe/#g
G = Gch(Tg/Tm) [ (Ug-UI)/Ug ]
x e = 3.53D(1 + [x/(3.53D)]-1"2} °'a88s
T m = ~(Tg+Tv)
The convective heat flux with transpiration is calculated implicitly as:
h ffi holn(l+H)/H
I where: H = Cpg KM mva p /h
= a ; < if
a=0.35 if Mv>Mg
19
AEDC-TR-91-1
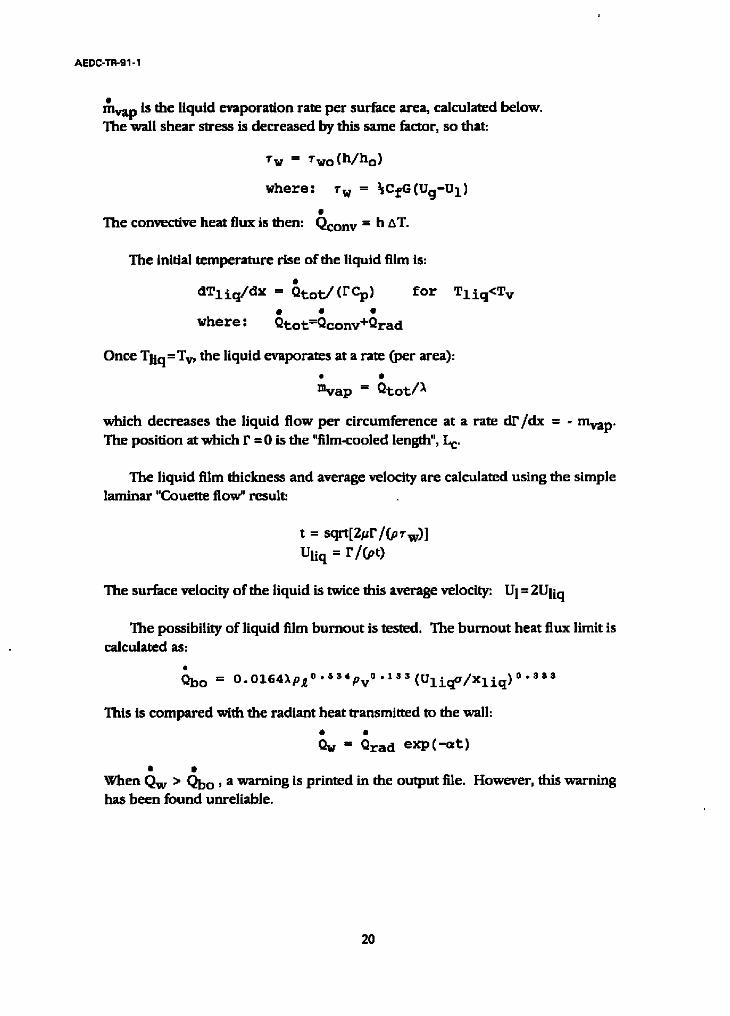
mva p is the liquid evaporation rate per surface area, calculated below. The wall shear stress is decreased by this same factor, so that:
~w ffi ~wo(h/ho)
where: ~w ffi %CfG(Ug-U1)
The convec~ve heat flux is then: Qconv = h AT.
The initial temperature rise of the liquid film is:
dTliq/dx = Qtot/(FCp) for
where: Qtot=Qconv+Qrad
Tliq<Tv
Once Tliq=Tv, the liquid evaporates at a rate (per area):
mva p = Qtot/~
which decreases the liquid flow per circumference at a rate dI"/dx = - mva p. The position at which F = 0 is the "film-cooled length", L c.
The liquid film thickness and average velocity are calculated using the simple laminar "Couer~ flow" result:
t = sqrt[ r/(pTw)]
Uli q ffi I ' / ( p 0
The surface velocity of the liquid is twice this average velocity: U I = 2Uli q
The possibility of liquid film burnout is tested. The burnou t heat flux limit is calculated as:
Qbo = 0 -0164~p~ ° * S s 4 p v ° ' I s s ( U l i q ° / x l i q ) ° ' s s s
This is compared with the radiant heat transmitted to the wall:
Qw = Qrad exp(-~t)
When Qw > Q b o , a warning is printed in the output file. However, this warning has been found unreliable.
20

AEDC-TR-91-1
3.0 GASEOUS FILM COOLING
After the liquid film has vaporized it continues to provide thermal protection to the wall by calorimetric mixing with the hot free stream gas entrained in the boundary layer. Numerous correlations have been presented for this process, termed "gaseous film cooling". They are normally expressed in terms of a "cooling effectiveness":
Ta - Taw m
Tg - Tc
where Tg is the free stream gas temperature, T c is the initial coolant temperature, and Taw is the "adiabatic wall" temperature in the boundary layer which results from calorimetric mixing of the two gas flows. The cooling effectiveness is a function of a non-dimensional distance CA') downstream of the injection point:
X=Kx
where: K - G pg°'2s Mc-1"2s
Mc = coolant mass flow per circumference G ~ pqUq = free stream mass flow x d6w~stream distance
Most authors arrange the constant K in terms of a coolant Reynolds number, giving the false impression that the injection velocity is important. As long as the coolant is injected with low relative velocity so that there are no jet effects, the exact geometry of the injection point is unimportant.
The most successful analysis is that of Kutateladze, et al (Reference 38) and StoUery, et al (Reference 39, Equation 27) for gaseous film cooling on a flat plate in turbulent flow, with coolant injection at the leading edge. To specify the conditions of the boundary layer downstream of the injection point, they conceptually replace the injected coolant with an equivalent mass of free stream gas. To provide the proper boundary layer growth rate, they identify an effective leading edge a distance x o upstream of the true leading edge (at x= 0). Their analysis can be extended to the case of injection at a point x i downstream of the true leading edge as follows, with the nomenclature defined in Figure 5.
Prom the solution to the boundary layer integral equations for a 1/7th power law velocity profile (Reference 2), the boundary layer thickness and mass flow (per width) a distance x' from the effective leading edge is:
21
AEDC-TR-91-1
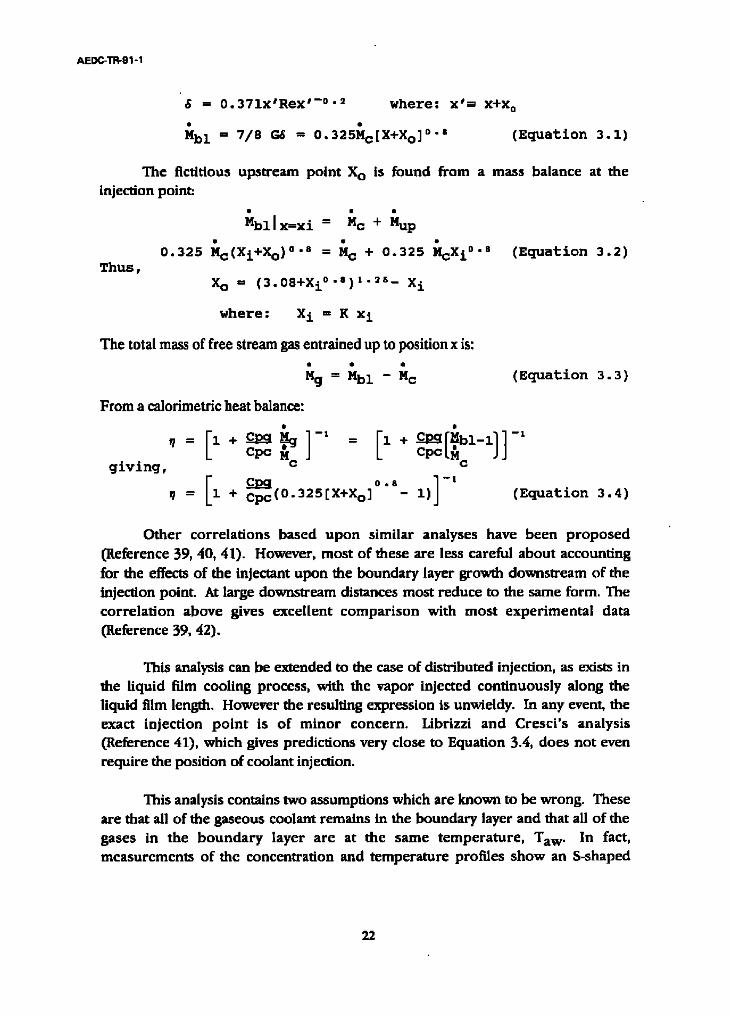
6 = 0.371x'Rex '-0-2 where: x'E x+x o
Mbl = 7 / 8 G~ = 0 . 3 2 5 M c [ X + X o ) ° ' ' ( E q u a t i o n 3 . 1 )
The fictitious upstream point X o is found from a mass balance at the injection point:
Thus,
Mbzl ~=~i = Mc + ~up o.3 ,s c(xi+Xo)O.. = + o .3 ,5 xio..
X o = (3.08+Xi0.8)*.~8- X i
(Equation 3.2)
where: X i = K x i
The total mass of free stream gas entrained up to position x is:
(Equation 3.3)
From a calorimetric heat balance:
cpc cpCt~c JJ g i v i n g , [ o., ]- ,
= i + Cpc(0.325[X+Xo] - 11 (Equation 3.4)
Other correlations based upon similar analyses have been proposed (Reference 39, 40, 41). However, most of these are less careful about accounting for the effects of the injectant upon the boundary layer growth downstream of the injection point. At large downstream distances most reduce to the same form. The correlat ion above gives excellent compar ison with most exper imental data (Reference 59, 42).
This analysis can be extended to the case of distributed injection, as exists in the liquid film cooling process, with the vapor injected continuously along the liquid film length. However the resulting expression is unwieldy. In any event, the exact injection point is of minor concern. Librizzi and Cresci 's analysis (Reference 41), which gives predictions very close to Equation 3.4, does not even require the position of coolant injection.
This analysis contains two assumptions which are known to be wrong. These are that all of the gaseous coolant remains in the boundary layer and that all of the gases in the bounda ry layer are at the same temperature , Taw. In fact, measurements of the concentration and temperature profiles show an S-shaped
22
A E D C - T R - 9 1 - I
profile for both (Reference 43). However, these profiles do maintain a similar shape, growing away from the wall at the same rate as the boundary layer thickness. This suggests that the above analysis can be reinterpreted.
The S-shaped temperature profile can be conceptually divided into a two domain region, an outer layer at the free stream temperature and an inner layer at Taw. Since this inner layer thickness is a constant fraction of the total boundary layer thickness, the same mass ratio of hot gases will be entrained as in the original analysis, giving the same cool ing effectiveness. However , in this case the interpretation is that Taw is the temperature on ly in the region very close to the wail.
Even with this re-interpretation a difficulty remains, in that the analysis predicts no free stream gas entrainment in fully-developed flow, which is certainly unrealistic for tu rbu len t flow. Indeed, Equation 3.4 is used in Section 4.2 for ful ly-developed flows, with satisfactory results. That the analysis leading to Equation 3.4 is apparently flawed should not detract from the fortuitous result that it correlates all existing data well.
A number of corrections to Equation 3.4 are necessary to account for effects not considered in the standard fiat-plate boundary layer analysis. Corrections for free stream turbulence, foreign gas injection, thermal radiation, and changing free stream conditions are considered below.
3.1 FREE STREAM TURBULENCE
The flat-plate boundary layer relations used in deriving Equation 3.4 assume no free stream turbulence. Two experimental studies measured the effects of tu rbu lence u p o n gaseous film cool ing (References 44 and 45). A possible correction to the above analysis is to multiply the non-dimensional distance X by a factor K t . 1+C t. This allows the increased mixing caused by the free strcam turbulence to be accounted for as an effectively, larger downstream distance. When applied to the data of Marek and Tacina (Reference 44), C t is found to be constant with X and varies with the free stream turbulence rms fraction, et~ as: Co t = 8.67 e t , for e t = 0.07, 0.14, and 0 .23 . For e t = 0 .35 , the data follows this relation for X< 1.5, thereafter C t increases as X ° .s
Unlike Marek and Tacina, Carlson and Taimor (Reference 45) did not directly measure the turbulence level, but inferred it based on screens placed in the flow. The length scales of their turbulence may also have differed considerably
23
A E D C - T R - 9 1 - 1
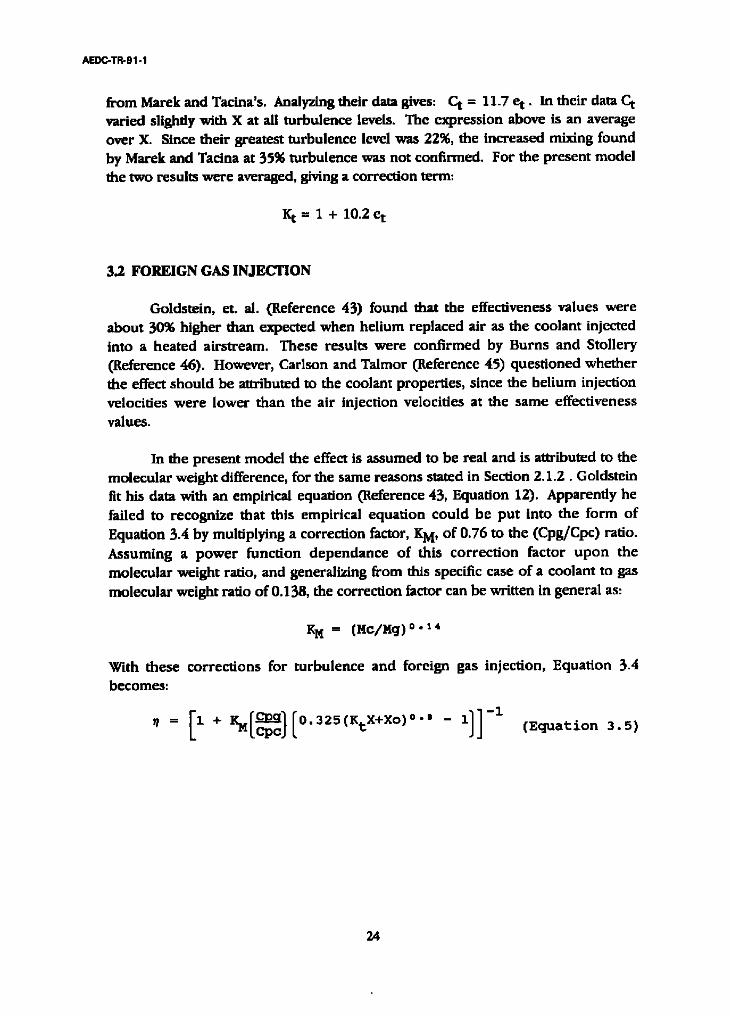
from Marek and Tacina's. Analyzing their data gives: Co t = 11.7 e t • In their data C t varied slightly with X at all turbulence levels. The expression above is an average over X. Since their greatest turbulence level was 22%, the increased mixing found by Marek and Tacina at 35% turbulence was not confirmed. For the present model the two results were averaged, giving a correction term:
K t ffi 1 + 10.2 e t
3.2 FOREIGN GAS INJECTION
Goldstein, et. al. (Reference 43) found that the effectiveness values were about 30% higher than expected when helium replaced air as the coolant injected into a heated airstream. These results were conf i rmed by Burns and Stollery (Reference 46). However, Carlson and Talmor (Reference 45) quest ioned whether the effect should be attributed to the coolant properties, since the hel ium injection velocities were lower than the air injection velocities at the same effectiveness values.
In the present model the effect is assumed to be real and is attributed to the molecular weight difference, for the same reasons stated in Section 2.1.2. Goldstein fit his data with an empirical equation (Reference 43, Equation 12). Apparently he failed to recognize that this empirical equat ion could be pu t into the form of Equation 3.4 by multiplying a correction factor, K M, of 0.76 to the (Cpg/Cpc) ratio. Assuming a power funct ion dependance of this correct ion factor u p o n the molecular weight ratio, and generalizing from this specific case of a coolant to gas molecular weight ratio of 0.138, the correction factor can be written in general as:
x M -- ( M c / M g ) o . x ,
With these correct ions for turbulence and foreign gas injection, Equation 3.4 becomes:
32 , tx xo,0 ' - i l l -1 ,E uation
24

A E D C - T R - 9 1 - 1
3.3 THERMAL RADIATION
The radiant heat flux is transmitted through the boundary layer and absorbed at the wall. This heat is then conducted back into the boundary layer gases, requi r ing a wall temperature , T w, in excess of the bounda ry layer
temperature, Taw:
T w = Taw + Qrad/h
This form is suggested for gaseous film cooling with a non-adiabatic wall (Reference 47). The heat transfer coefficient is calculated by Equation 2.2, evaluated at x '= x + x 0 .
The radiant heat also enters into the heat balance of the boundary layer gases. Assuming that it is spread evenly over the entire boundary layer mass, the rate of temperature increase with distance is:
/ ~aw ffi Orad ~x NblCpg
3.4 NON-UNIFORM FREE STREAM FLOW
Equation 3.5 was derived for a constant free stream gas flow rate and temperature. If these quantities change as the flow proceeds downstream, then Equation 3.5 cannot be directly applied. To demonstrate this, consider a sudden decrease in the flow rate per area, G. Applying Equation 3.5 locally would imply a sudden decrease in the non-dimensional distance, X, and a step increase in the effectiveness, ~. This would suggest that the gases spontaneously unmix, violating the second law of thermodynamics.
Due to the parabolic nature of the boundary layer equations, the local conditions determine only the rate of change, in the downstream direction, of the boundary layer properties. Equation 3.5 is an integral result for the special case of constant flow conditions. However, it can easily be rearranged in the form of a differential equation.
The rate of change of ~ with position x is determined by differentiating Equation 3.5 • All parameters are held constant in differentiating, since such was assumed in deriving the integral expression. Expressing the result in terms of the
local value o f , :
25

AEDC-TR-91-1
KMCpg L.
II is found by' numerically integrating this expression. The initial condition on ,1 at the injection point could be found from P.quation 5.5. However, this predicts rl < 1 at the injection point when injection is downstream of the leading edge, which is unsupported. A more realistic assumption that ,7 = 1 at the injection point is used as the initial condition in the present study. The above approach is t e rmed the "differential rl" formula t ion to dist inguish it f rom the "integral correlation" of Bquation 5.5 •
The free stream mass flow rate per area, G, varies inversely with the local cross-sectional area as:
G = Och(Ach/A)
Increases in G, as the nozzle converges, increases the rate o f free s tream gas entrainment through the coefficient K.
The other effect of free stream acceleration is a drop in the static temperature of the free stream gas. Upon entra inment into the boundary layer the original stagnation tempera ture is recovered as the kinetic energy is converted back into thermal energy. However, some of this heat is then lost by conduction back into the cooler free stream gas. The result is that the free stream gas attains a temperature in the boundary layer lower than the stagnation temperature. This is t e rmed the "recovery temperature", T r, and is normally a constant fraction of the difference between the static and stagnation temperatures:
T r = To-(1-r ) (To-T s)
where T O and T s are the static and stagnation temperatures of free stream gas and r is the "recovery factor".
This recovery temperature should replace Tg in the equations above. For a fiat-plate boundary layer without gaseous film cooling, r = Pr 1/a (Reference 48). It is assumed that this relation holds for the gaseous film cooling case, although this assumption is questionable.
From the isentropic relations for compressible flow:
T s = To/[1+
26

AEDC-TR-91-1
The local Mach number, M, is found implicitly from one of two forms:
or
M = 1 At [7-~ + M~r]Tr/2
M = [Tr(MAt)2/Tr - ~-~_i]%
for M<I
for M>I
where: A t m (A/Athroat)
7r_=~ +l 7-i
3.4.1 Differential Entrainment Formulation
When the recovery temperature changes, the "differential ~" formulation becomes invalid, for the subtle reason that the local value of ,1 no longer determines the local state of the boundary layer. This problem is remedied by recognizing that the true local state of the boundary layer is determined by the local mass flow rate in the boundary layer, Mbl. From Equation 3.1, the local entrainment rate is:
dl~bl]dx e - - 0 . 1 9 6 3 G [~bl] -°''s ( E q u a t i o n 3 .6 )
The calorimetric heat balance in differential form is:
dMblCpg (Tr-Taw) = (l~gCpg+l~cCpc) dTaw
The specific heat on the left side should be evaluated at the mean temperature of T r and Tav o while those on the right should be evaluated at Taw. Substituting Equation 3.3, and dividing both sides by dx:
d-'~aT w = d x d{Ibl ' e (Tr-Taw) [~4bl + d x , [Cpg[Cp--q _ l ] l~Ic] -1 ( E q u a t i o n 3 .7 )
To apply these relations, Equations 3.6 and 3.7 are integrated to determine Mbl and Taw at each x position. As stated, Taw is equated to T c (or ,7 = 1) at x = 0. The initial condition on Mbl is found from Equation 3.2:
Mbl[ xi ffi Mc[1+°-nsxi ° "' ]
In applying this to the curved walls of a rocket chamber, x is measured along the contour of the nozzle.
27
A E D C - T R - 9 1 - 1
This "differential entrainment!' formulation is the most general. Although the derivation is more involved, it requires no more computat ion than the previous "differential n" formulation. For the case of constant free stream gas temperature, where the local value o f r/ is directly related to Mbi, bo th formula t ions are equivalent. And, of course, for constant free stream conditions, both reduce to the integral correlation (Equation 3.5).
To include the effects of free s t r e a m turbulence and foreign gas injection, the coefficient in Equation 3.6 is multiplied by the factor I( t , and the (Cpc/Cpg) ratio in Equation 3.7 is mult ipl ied by 1/K M. Both correct ions are consis tent with the placement of these factors in the differential r/formulation.
3.4.2 Circumferential Change:
In a rocket engine the contraction of the nozzle decreases the circumference, causing an increase in the boundary layer mass flow per circumference:
Io ; - Since this increase is not due to free stream entrainment, it does not enter
into the energy balance. However, it is important in that it affects the total boundary layer flow rate, which is found by adding the changes due to free s tream entra inment and this circumferential change. This total boundary layer flow rate determines the local rate of free stream gas entrainment, as given by Equation 3.6 . In adding this term to the analysis, the coolant flow rate per circumference should also be calculated locally, by scaling the chamber value.
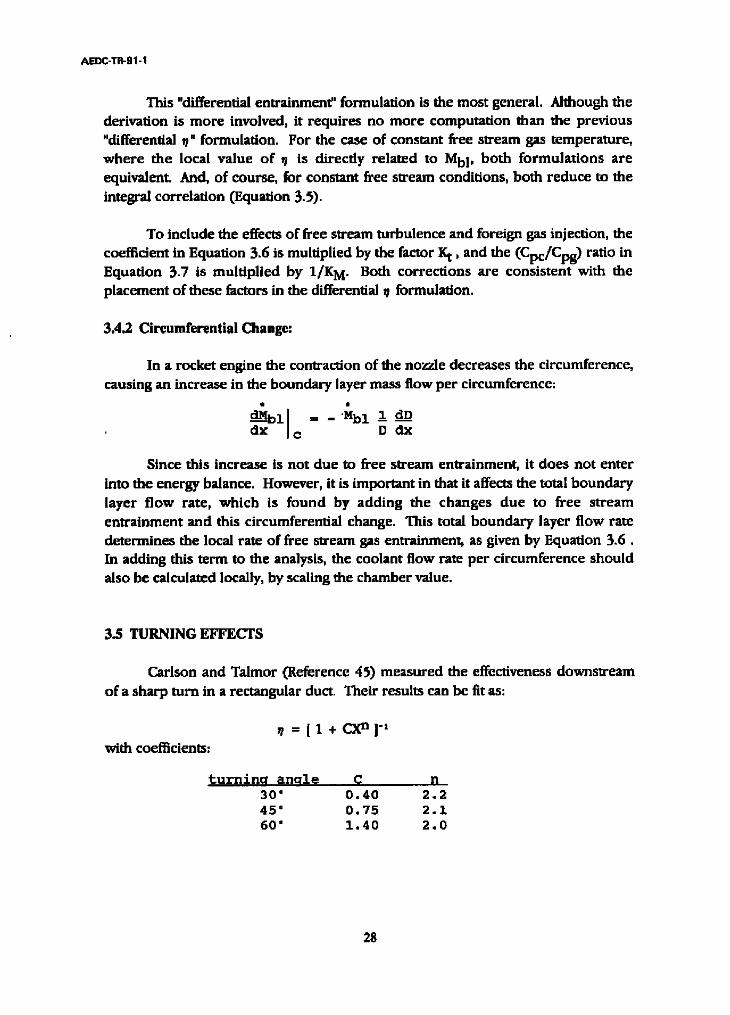
3.5 TURNING EFFECTS
Carlson and Talmor (Reference 45) measured the effectiveness downstream of a sharp turn in a rectangular duct. Their results can be fit as:
. = [ l + c x n ] ' '
with coefficients:
turnina anule C n 30" 0.40 2.2 45" 0.75 2.1 60" 1.40 2.0
28
A E D C - T R - 9 1 - 1
To reduce approximately to Equation 3.4 the exponent, n, should approach 0.8 as the turning angle approaches 0". Since the exponent is increasing in the opposite direction their results are somewhat anomalous. For un turned flov~ in a circular duct their results followed Equation 3.4. Possibly these results were due to disturbance of the boundary layer by the sharp turn in their wind tunnel.
Ewen and Rousar (References 49-51) s tudied gaseous film cool ing in converging nozzles. Their data is analyzed in Section 4.0 and leads to a correlation for an increased entrainment in terms of a "centrifugal parameter".
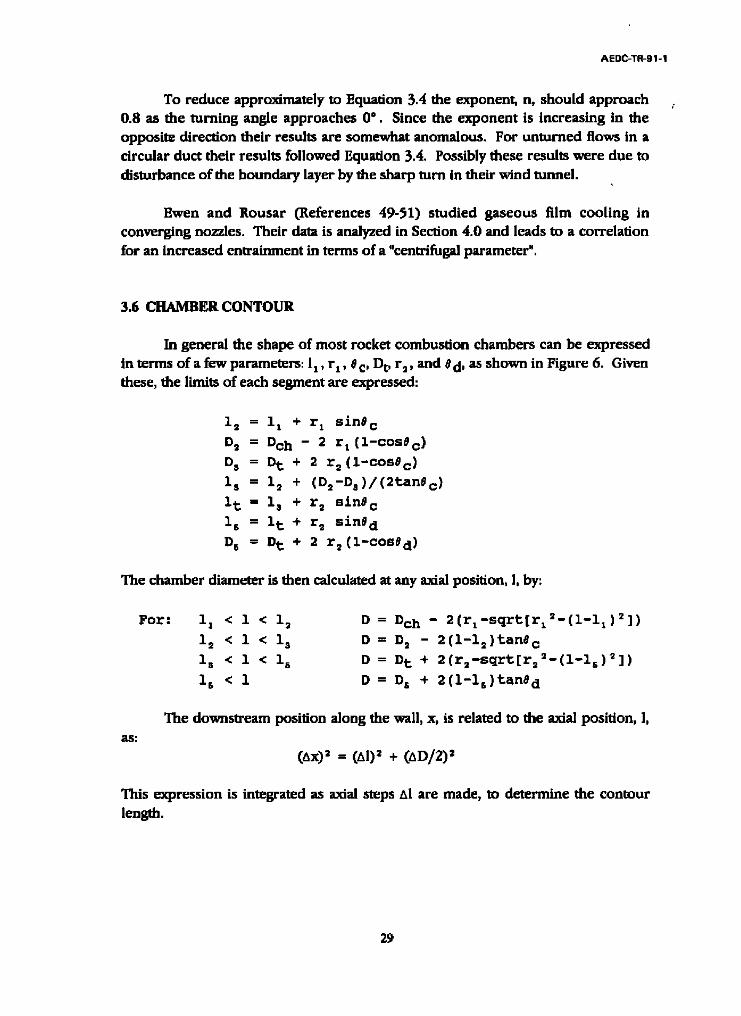
3 .6CHAMBERCONTOUR
In general the shape of most rocket combust ion chambers can be expressed in terms of a few parameters: 11 , r : , 0 c, D t, r 2 , and 0 d, as shown in Figure 6. Given these, the limits o f each segment are expressed:
12 = I, + r, sin0 C
D 2 = Dch - 2 r, (1-cOS0c)
D s = D t + 2 r 2(1-Cos8C)
I s = i~ + (D2-Ds)/(2tanSc)
I t = i s + r 2 sin8 c
i s = I t + r 2 sin8 d
D s = D t + 2 r 2(1-cos0d)
The chamber diameter is then calculated at any axial position, I, by:
For: i, < 1 < 12 D = Dch - 2(r,-sqrt[rl~-(l-l,)2])
12 < 1 < i s D = D 2 - 2(l-12)tan0 c
ls < 1 < 15 D -- D t + 2(r2-sqrt[r22-(l-15)2])
16 < 1 D = D 6 + 2 (i-is)tan0 d
a s :
The downstream position along the wall, x, is related to the axial position, I,
(~x ) 2 = C~l) 2 + ( ~ D / 2 ) 2
This expression is integrated as axial steps •I are made, to determine the contour length.
29
AEDC-TR-91-1
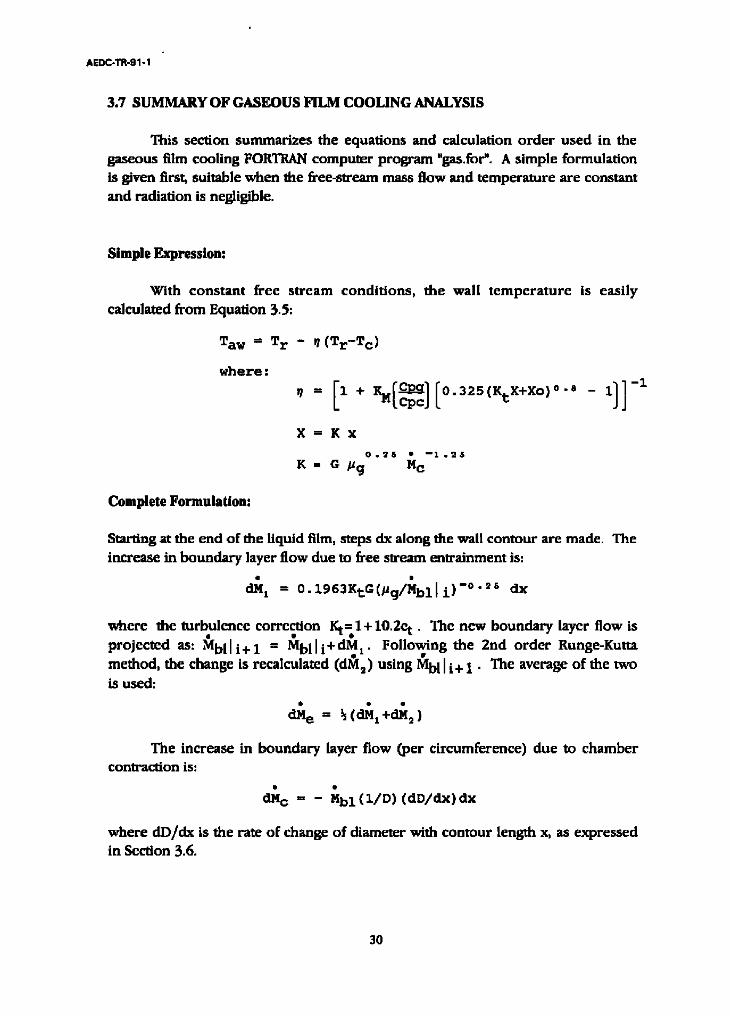
3.7 SUMMARY OF GASEOUS FILM COOLING ANALYSIS
This section summarizes the equations and calculation order used in the gaseous film cooling FORTRAN computer program "gas.for". A simple formulation is given first, suitable when the free-stream mass flow and temperature are constant and radiation is negligible.
Simple Expression:
With constant free stream calculated from Equation 3.5:
Taw = T r
where:
Complete Formulation:
conditions, the wall t empera ture is easily
- . (Tr-T c)
X=Kx
K = G pgo.~s Mc-*'26
i]]-i
Starting at the end of the liquid film, steps dx along the wall contour are made. The increase in boundary layer flow due to free stream entrainment is:
* = 0.1963KtG(.g/Mbl [ i)-o. a, dx
where the turbulence correction I ~ l + 10.2e t . The new boundary layer flow is projected as: Mbl[ i+ 1 = l~IblJ i+dMt" Following the 2nd order Runge-Kutta method, the change is recalculated (dM2) using l~Ibl[ i + 1 • The average of the two is used:
The increase in boundary layer flow (per circumference) due to chamber contraction is:
dM c -- - ~4bl ( l / D ) (dD/dx) dx
where dD/dx is the rate of change of diameter with contour length x, as expressed in Section 3.6.
30
AEDC-TR-9.1-1
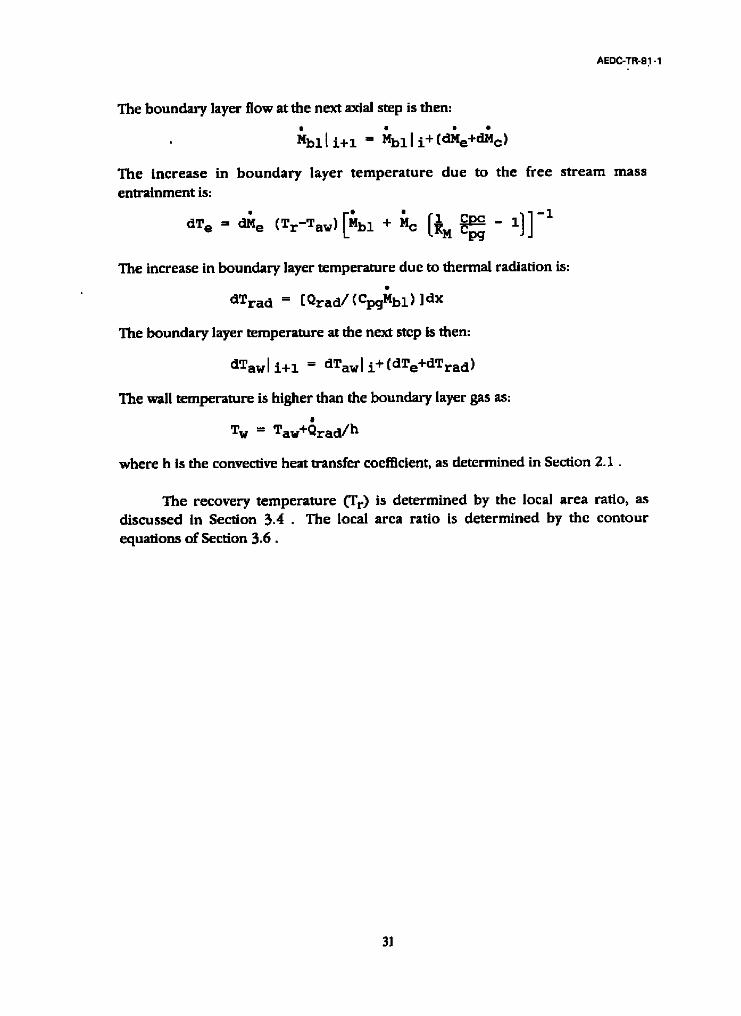
The boundary layer flow at the next axial step is then:
The increase in boundary layer t empera ture due to the free s tream mass
entrainment is:
The increase in boundary layer temperature due to thermal radiation is:
dTrad = [Qrad/(CpgMbl) ]dx
The boundary layer temperature at the next step is then:
dTaw[ i+l = dTaw[ i + (dTe+dTrad)
The wall temperature is higher than the boundary layer gas as:
T w = Taw+Qrad/h
where h is the convective heat transfer coefficient, as determined in Section 2.1.
The recovery temperature (Tr) is determined by the local area ratio, as discussed in Section 3.4 • The local area ratio is determined by the contour
equations of Section 3.6.
31

AEDC-TR-91-1
4.0 COMPARISON WITH EXPERIMENTS
4.1 LIQUID FILM EVAPORATION
4.1.1 G.R. Kinney et al air-water experiment (Reference 17)
These heat transfer measurements were performed at fairly low temperatures in a tube with almost fully-developed flow. This made radiation negligible and the evaporation rates almost constant over the liquid film length. For these reasons the evaporation rate could be calculated by hand using the formulation of Section 2.4.1. For completeness the computer program was used to include the slight effects of radiation, interface motion, and boundary layer development.
The static pressure varied from 1.4 to 2.47 arm over the runs. An average saturation temperature of 240 F is stated by Kinney, corresponding to a saturation
pressure of 1.7 arm. However, a liquid interface temperature of 200 F is given in Kinney's Figure 4. This difference might be attributed to mass transfer to the
unsaturated gas. A pressure of 1.7 arm and an interface temperature of 200 F was assumed in all of the calculations, since no itemization was given for each run.
The free stream gas consisted of the products of gasoline/air combustion.
For property values, pure air was assumed. For radiation calculations 10% CO 2 and 1096 H 20 were assumed for all runs. In any event, radiation was insignificant
at the low temperatures of the tests. Since the free stream turbulence was unknown, a value of 0% was used. The property values common to all runs were:
Gas: air M= 29. P= 1.7 atm
Coolant: water M= 18. p= 3.03 10 -4kg/m-s Tv= 366 K pl = 962 kg/m3 To= 300 K pv = 1.01 kg/m3 Cpl= 4210 J/kg-K o= 60.3 10-SN/m A= 2.27 10eJ/kg ~= 0.
32
A E D C - T R - 9 1 - 1
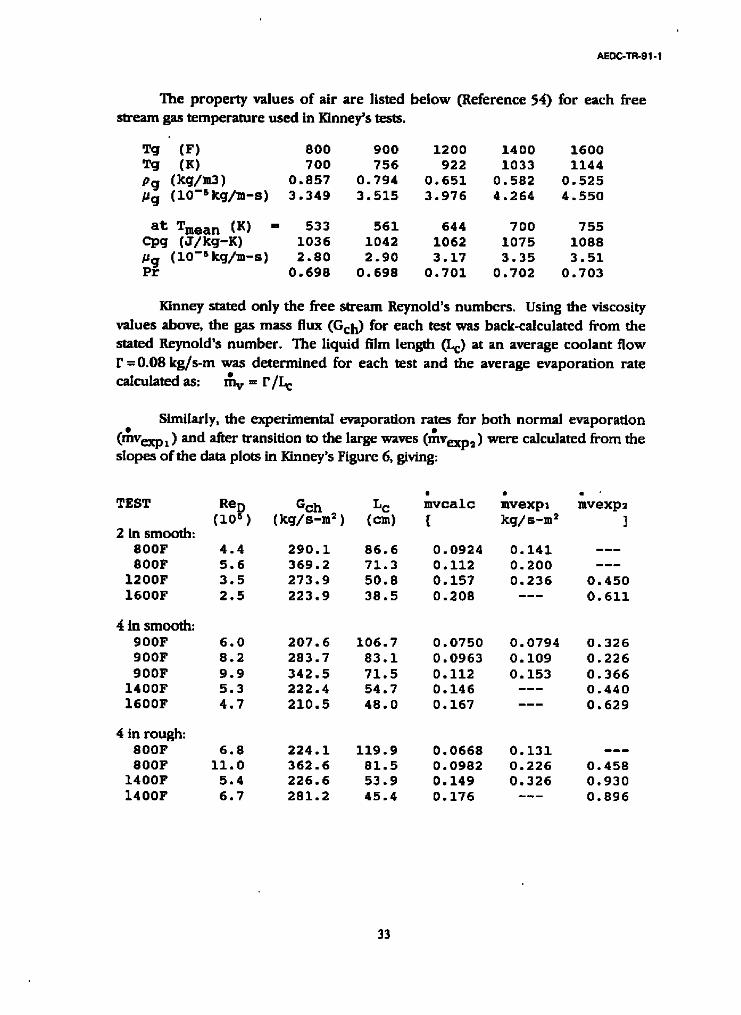
The property values o f air are listed be low (Reference 54) for each free stream gas temperature used in Kinney's tests.
Tg (F) 800 900 1200 1400 1600 Tg (K) 700 756 922 1033 1144 pg (kg/m3) 0.857 0.794 0.651 0.582 0.525 pg (10-Skg/N-s) 3.349 3.515 3.976 4.264 4.550
at Tmean (K) ffi 533 561 644 700 755 Cpg (J/kg-K) 1036 1042 1062 1075 1088 /Ja ( 1 0 - S k g / m - s ) 2 . 8 0 2 . 9 0 3 . 1 7 3 . 3 5 3 . 5 1 P~ 0 . 6 9 8 0 . 6 9 8 0 . 7 0 1 0 . 7 0 2 0 . 7 0 3
Kinney stated only the free stream Reynold's numbers . Using the viscosity values above, the gas mass flux (Gel 0 for each test was back-calculated from the stated Re)mold's number . The liquid film length (Lc) at an average coolant flow [" =0.08 kg/s -m was de te rmined for each test and the average evaporat ion rate calculated as: m v = I ' /L c
Similarly, the experimental evaporation rates for both normal evaporat ion (~Vexpl) and after transition to the large waves (~Vexp2) were calculated from the slopes o f the data plots in Kinney's Figure 6, giving:
TEST Re D Gch L c mvcalc mvexpl mvexp2 ( lO 5 ) ( k g / s - m 2) (om) [ k g / s - m 2 ]
2 i n s m o o t h : 800F 4 . 4 2 9 0 . 1 8 6 . 6 0 . 0 9 2 4 0 . 1 4 1 - - - 800F 5.6 369.2 71.3 0.112 0.200 ---
1200F 3.5 273.9 50.8 0.157 0.236 0.450 1600F 2.5 223.9 38.5 0.208 --- 0.611
4 in s m o o ~ : 900F 6.0 207.6 106.7 0.0750 0.0794 0.326 900F 8.2 283.7 83.1 0.0963 0.109 0.226 900F 9.9 342.5 71.5 0.112 0.153 0.366
1400F 5.3 222.4 54.7 0.146 --- 0.440 1600F 4.7 210.5 48.0 0.167 --- 0.629
4 in rough: 800F 6 . 8 2 2 4 . 1 1 1 9 . 9 0 . 0 6 6 8 0 . 1 3 1 - - - 800F 1 1 . 0 3 6 2 . 6 8 1 . 5 0 . 0 9 8 2 0 . 2 2 6 0 . 4 5 8
1400F 5 . 4 2 2 6 . 6 5 3 . 9 0 . 1 4 9 0 . 3 2 6 0 . 9 3 0 1400F 6 . 7 2 8 1 . 2 4 5 . 4 0 . 1 7 6 - - - 0 . 8 9 6
33
A E D C - T R - 9 1 - 1
Compar ison between the calculated and experimental (mVexpl) values is given in Figure 7. While the calculations do not compare favorably with all of the measurements in an absolute sense, they do correlate the data well. The calculated evaporation rates are a factor 3596 lower than the data for the t w o "smooth" tubes. Assuming a free stream turbulence intensity of 8.7596 wou ld account for this discrepancy, as discussed in Section 2.1.1.
Several other factors could contribute to the discrepancy. Most significant is that the actual propellant flow rates were not stated, so that the gas mass flux (Gch) had to be back-calculated without knowing the value of gas viscosity Kinney used in calculating the stated Reynold's numbers . Also, the specific heat of the actual combust ion products is slightly higher than that for the pure air assumed. Finally, the "pebbling" of the liquid surface observed by Kinney would give an effect similar to pipe roughness, increasing the convective heat flux.
The model is not able to predict the evaporation rates when large waves are present, given by the mVexp2 values. When the large waves are present, the rates of mass loss are increased by a factor of 2.56, on average.
34
A E D C - T R - 9 1 - 1
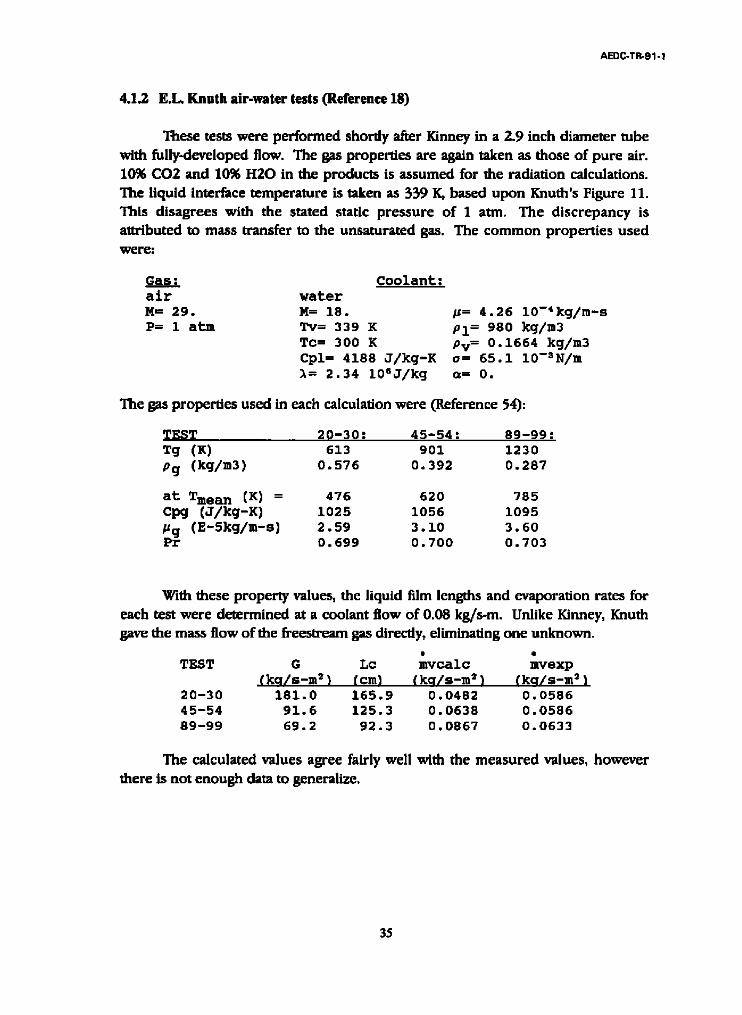
4.1.2 E.L. Knuth air-water tests (Reference 18)
These tests were performed shortly after Kinney in a 2.9 inch diameter tube with fully-developed flow. The gas properties are again taken as those of pure air. 10% CO2 and 10% H20 in the products is assumed for the radiation calculations. The liquid interface temperature is taken as 559 K, based upon Knuth's Figure I I . This disagrees with the stated static p ressure of 1 arm. The d iscrepancy is attributed to mass transfer to the unsaturated gas. The c o m m o n propert ies used were:
Gas:
air M = 29. P= 1 atm
Coolant: water M= 18. g= 4.26 10-4kg/m-s Tv= 339 K pl = 980 kg/m3 Tc= 300 K pv = 0.1664 kg/m3 Cpl= 4188 J/kg-K o= 65.1 10-SN/m A= 2.34 10Sj/kg a= 0.
The gas properties used in each calculation were (Reference 54):
TEST 20-30: 45-54: 89-99: Tg (K) 613 901 1230 pg (kg/m3) 0.576 0.392 0.287
at Tmean (K) = 476 620 785 Cpg (J/kg-K) 1025 1056 1095 ~g (E-5kg/M-s) 2.59 3.10 3.60 Pr 0.699 0.700 0.703
With these property values, the liquid film lengths and evaporation rates for each test were determined at a coolant flow of 0.08 kg/s-m. Unlike Kinney, I(nuth gave the mass flow of the freestream gas directly, eliminating one unknown.
o
TEST G Lc mvcalc mvexp (ka/s-m 2 ) (cm~ (ka/s-m 2 ) (ka/s-m2)
20-30 181.0 165.9 0.0482 0.0586 45-54 91.6 125.3 0.0638 0.0586 89-99 69.2 92.3 0.0867 0.0633
The calculated values agree fairly well with the measured values, however there is not enough data to generalize.
35
AEOC-TR-91-1
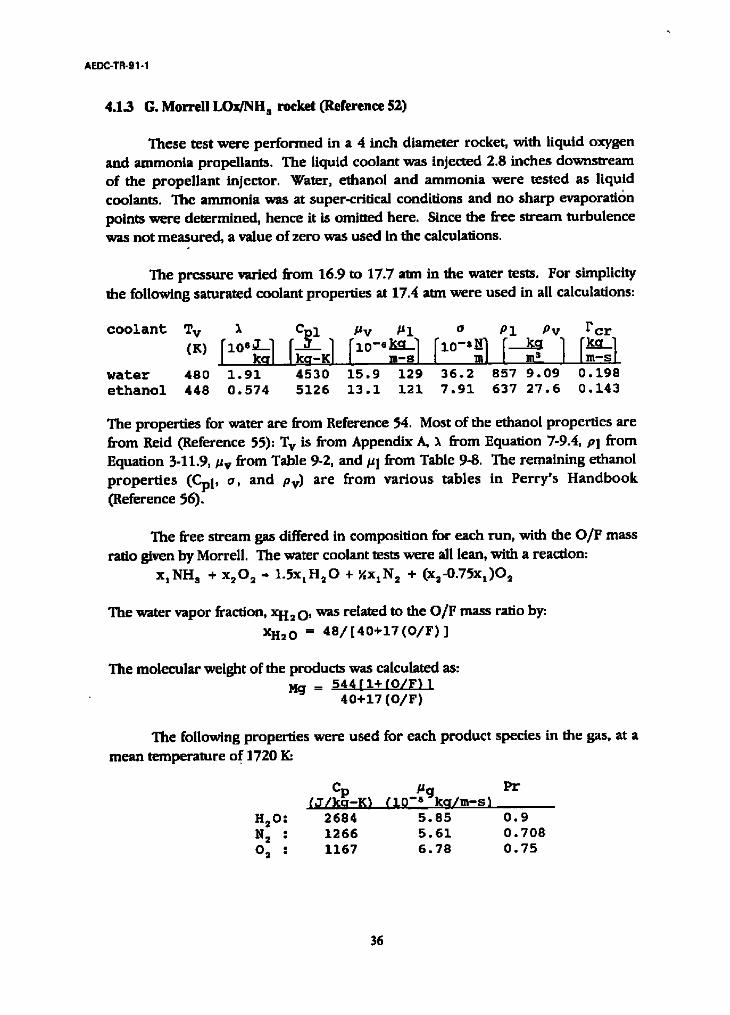
4.1.3 G. Morrell LOx/NH s rocket (Reference 52)
These test were per formed in a 4 inch diameter rocket, with liquid oxygen and ammonia propellants. The liquid coolant was injected 2.8 inches downstream of the propel lant injector. Water, ethanol and ammonia were tested as liquid coolants. The ammonia was at super-critical conditions and no sharp evaporation points were determined, hence it is omitted here. Since the free stream turbulence was not measured, a value of zero was used in the calculations.
The pressure varied from 16.9 to 17.7 arm in the water tests. For simplicity the following saturated coolant properties at 17.4 arm were used in all calculations:
coolant TV(K) I1 AsJO ~-~] [Col I~ ~V ~I a 91 9V Fcr
I ~., lkq-Kl - water 480 1.91 4530 15.9 129 36.2 857 9.09 0.198 ethanol 448 0.574 5126 13.1 121 7.91 637 27.6 0.143
The properties for water are from Reference 54. Most of the ethanol propert ies are from Reid (Reference 55): T v is from Appendix A, ~ from Equation 7-9.4, Pl from Equation 3-11.9,/Jv from Table 9-2, and tJI from Table 9-8. The remaining ethanol p rope r t i e s (Cpl, o, and Pv) are f rom var ious tables in Perry 's H a n d b o o k
(Reference 56).
The free stream gas differed in composit ion for each run, with the O/F mass ratio given by Morrell. The water coolant tests were all lean, with a reaction:
x INH s + x~O 2 -, 1.SxxH20 + ~xxN 2 + (x2-0.75xl)O 2
The water vapor fraction, XH2 O, was related to the O/F mass ratio by: XH20 ffi 4 8 / [ 4 0 + 1 7 ( O / F ) ]
The molecular weight of the products was calculated as: Mg = 544 r 1+(O/F) 1
40+17 (O/F)
The following properties were used for each product species in the gas, at a
mean temperature of 1720 I~
C ~g Pr (J/k~-K~ (10 -6 ka/m-s)
H20: 2684 5.85 0.9 N s : 1266 5.61 0.708 02 : 1167 6.78 0.75
36
AEOC-TR-91-1
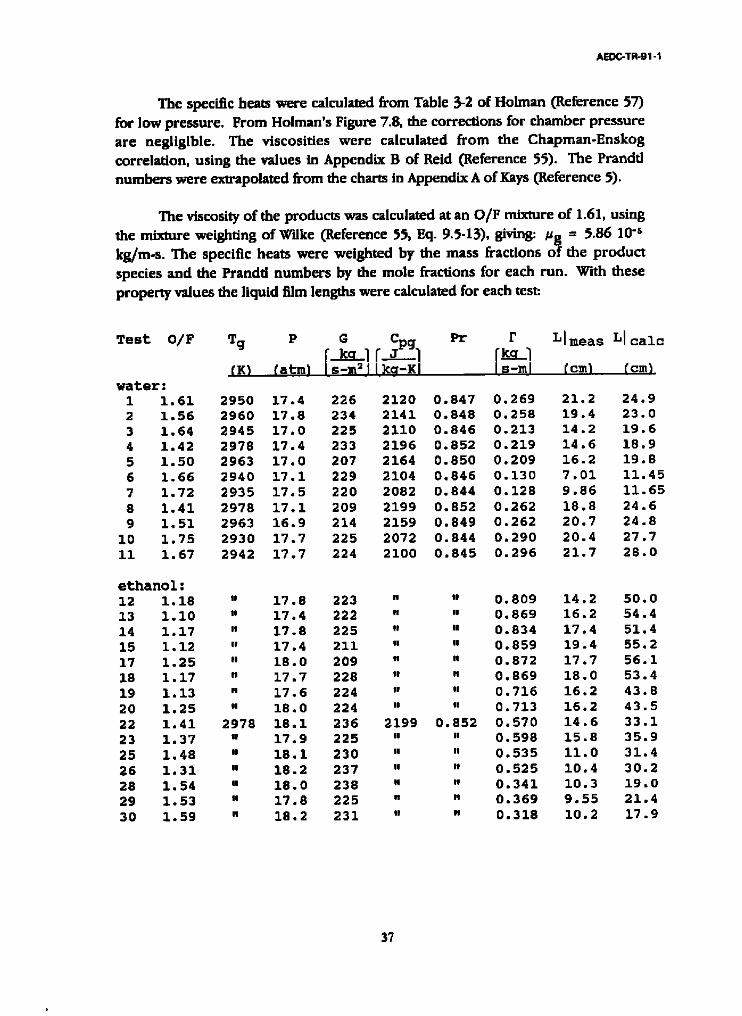
The specific heats were calculated from Table 3-2 of Holman (Reference 57) for low pressure. From Holman's Figure 7.8, the corrections for chamber pressure are negligible. The viscosities were calculated from the Chapman-Enskog correlation, using the values in Appendix B of Reid (Reference 55). The Prandfl numbers were extrapolated from the charts in Appendix A of Kays (Reference 5).
The viscosity of the products was calculated at an O/F mixture of 1.61, using the mixture weighting of Wilke (Reference 55, Eq. 9.5-13), giving: #g = 5.86 l0 "s kg/m-s. The specific heats were weighted by the mass fractions of the product species and the Prandti numbers by the mole fractions for each run. With these property values the liquid film lengths were calculated for each test:
Test O/F Tg P G C Pr F Llmea s Llcal c jPg [ k_k_q_l [ a--I Fk-g-I
(K) (atm} Is-m21Ika-KI Is-ml (om~ (om) water: 1 1.61 2950 17.4 226 2120 0.847 0.269 21.2 24.9 2 1.56 2960 17.8 234 2141 0.848 0.258 19.4 23.0
3 1.64 2945 17.0 225 2110 0.846 0.213 14.2 19.6
4 1.42 2978 17.4 233 2196 0.852 0.219 14.6 18.9
5 1.50 2963 17.0 207 2164 0.850 0.209 16.2 19.8
6 1.66 2940 17.1 229 2104 0.846 0.130 7.01 11.45
7 1.72 2935 17.5 220 2082 0.844 0.128 9.86 11.65
8 1.41 2978 17.1 209 2199 0.852 0.262 18.8 24.6
9 1.51 2963 16.9 214 2159 0.849 0.262 20.7 24.8
i0 1.75 2930 17.7 225 2072 0.844 0.290 20.4 27.7
II 1.67 2942 17.7 224 2100 0.845 0.296 21.7 28.0
ethanol: 12 I. 18 " 17.8 223 " " 0.809 14.2 50.0 13 I. i0 " 17.4 222 " " 0.869 16.2 54.4
14 i. 17 ,i 17.8 225 " , O. 834 17.4 51.4
15 1.12 " 17.4 211 " , 0.859 19.4 55.2
17 1.25 " 18.0 209 n , 0.872 17.7 56.1
18 1.17 " 17.7 228 " , 0.869 18.0 53.4
19 1.13 i. 17.6 224 " , 0.716 16.2 43.8
20 1.25 P 18.0 224 " - 0.713 16.2 43.5
22 1.41 2978 18.1 236 2199 0.852 0.570 14.6 33.1 23 1.37 " 17.9 225 " " 0.598 15.8 35.9
25 1.48 " 18.1 230 " , 0.535 ii.0 31.4
26 1.31 w. 18.2 237 " - 0.525 10.4 30.2
28 1.54 " 18.0 238 . - 0.341 10.3 19.0
29 1.53 " 17.8 225 " , 0.369 9.55 21.4
30 1.59 " 18.2 231 " , 0.318 10.2 17.9
37

AEDC-TR-91-1
A compar i son of the calculations with the experimental data for water coolant is given in Figure 8. The calculated liquid film lengths are an average of 25% longer than measured . Since convection accounted for 62% of the total evaporation rate, multiplying the convective heat flux by a factor of 1.4 would bring the calculations into best agreement with the measurements. This corresponds to a free stream turbulence of 9%, which is a reasonable assumption.
In all of the ethanol tests the liquid coolant flow rate i f ) greatly exceeded Knuth's critical value for the formation of large waves ffcr) , given in the coolant table above. Such large waves would explain why the measured liquid film lengths were an average of 2.75 times shorter than calculated, which compares favorably with Kinney's results for the mass loss rate with large waves present. For simplicity, the gas p r o p e ~ e s at an O/F of 1.41 were used in all of the ethanol calculations.
Katto's correlation for radiant burnout is tested in the program and predicted liquid film lengths 10% shorter than listed above with water coolant. However, with ethanol coolant the bu rnou t condition predicted liquid film lengths of less than I cm, which is unreasonable. Therefore the bu rnou t predict ion was not deemed trustworthy.
38
AEDC-TR-91-1
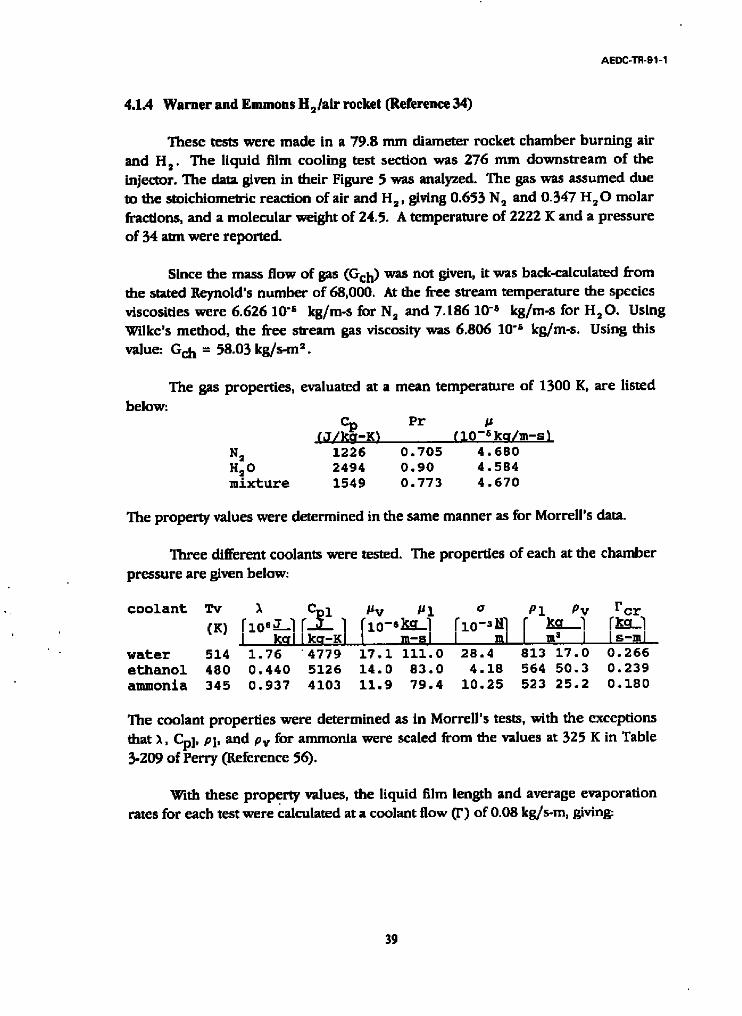
4.1A Warner and Emmons H21air rocket (Reference 34)
These tests were made in a 79.8 m m diameter rocket chamber bu rn ing air and H~. The liquid film cooling test section was 276 m m dow ns t r eam of the
injector. The data given in their Figure 5 was analyzed. The gas was assumed due to the stoichiometric reaction of air and H 2 , giving 0.653 N 2 and 0.347 H~ O molar fractions, and a molecular weight of 24.5. A tempera ture of 2222 K and a pressure
of 34 arm were reported.
Since the mass flow of gas (Och) was not given, it was back-calculated f rom the stated Reynold's n u m b e r of 68,000. At the free stream tempera ture the species viscosities were 6.626 10 "s kg/m-s for N 2 and 7.186 10 "s kg/m-s for H 2 0 . Using WUke's method , the free s tream gas viscosity was 6.806 10 "s kg/m-s. Using this
value: Och = 58.03 kg/s-m 2 .
The gas propert ies , evaluated at a mean t empera tu re of 1300 K, are listed
C Pr {J/k~-K) (10-ska/m-s]
N= 1226 0.705 4.680 H20 2494 0.90 4.584 mixture 1549 0.773 4.670
below:
The proper ty values were de termined in the same manner as for Morrell 's data.
Three different coolants were tested. The propert ies o f each at the chamber
pressure are given below:
coolant Tv A CDI ~v ~I o Pl Pv Fcr (K) rio.L1 f I flO-6k _1 flo-s 1 r rkal
[ kql I ka-KI I m - s l I ml I m a I I s -m] water 514 1.76 4779 17.1 Iii.0 28.4 813 17.0 0.266 ethanol 480 0.440 5126 14.0 83.0 4.18 564 50.3 0.239 ammonia 345 0.937 4103 11.9 79.4 10.25 523 25.2 0.180
The coolant proper t ies were de te rmined as in Morrell 's tests, with the exceptions
that ~, Cpl, Pl, and Pv for ammonia were scaled from the values at 525 K in Table
3-209 of Perry (Reference 56).
With these p roper ty values, the liquid film length and average evaporat ion rates for each test were calculated at a coolant flow 0") of 0.08 kg/s-m, giving:
39
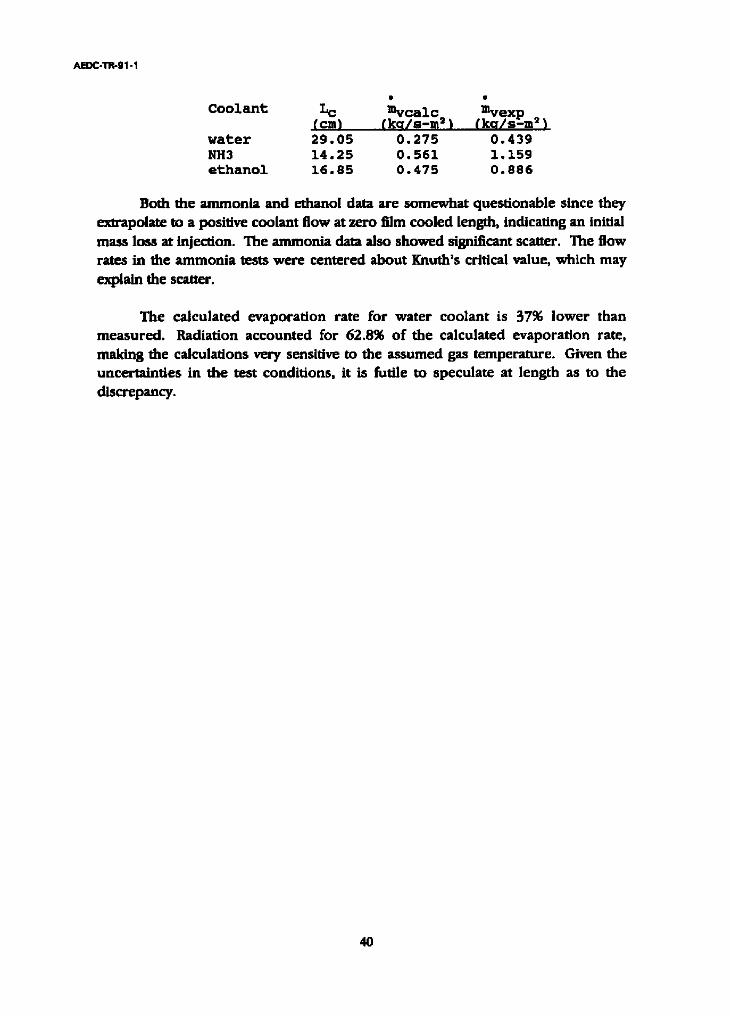
A E D C - T R - 9 1 - 1
Coolant L o mvcal c mvexp (cm) (ka/s-m 2 ) (ka/s-m 2 )
water 29.05 0.275 0.439 NH3 14.25 0.561 1.159 ethanol 16.85 0.475 0.886
Both the ammonia and ethanol data are somewhat questionable since they extrapolate to a positive coolant flow at zero film cooled length, indicating an initial
mass loss at injection. The ammonia data also showed significant scatter. The flow rates in the ammonia tests were centered about Knuth's critical value, which may
explain the scatter.
The calculated evaporation rate for water coolant is 5796 lower than measured. Radiation accounted for 62.8% of the calculated evaporation rate, making the calculations very sensitive to the assumed gas temperature. Given the uncertainties in the test conditions, it is futile to speculate at length as to the
discrepancy.
40
A E D C - T R - 9 1 - 1
4.1.5 R.C. Kesselring, et ai OFa/BaHe rocket test 0reference 53)
These tests were performed in a rocket engine using diborane fuel, which is uncommon and very expensive. The combustion chamber was a thin n iche shell of 9.45 cm diameter, used for short duration tests. The free stream gas conditions were falrlF constant for all runs, so that the average properties below were used in
analyzing all runs: Tg= 3900 K, P=6.8 arm, Gch = 150.7 kg]s .m a .
The NASA/Lewis Chemical Equilibrium code gave the following flee stream mole
fractions and properties: 0.537 HF, 0.225 BOF, 0.063 Ha O, 0.036 Ha, 0.031 OH, Mg=25.6
and a~ Tmean = 2200 K: Cpg=3665J/kg-K, ~g=8.37 10 "s kg/m-s, Pr=0.80
The properties of saturated BaHe coolant at 6.94 atm from Kit and Evered
(Reference 58) are:
Tv= 243.8 K, M c = 27.69, X = 3.72 106 J/kg, Cpl = 3235 J/kg-K #1 = 3.6 10"8 kg]m.s , al = 341 kg]m 8, pv = 29.4 kg]mS, o = 7.16 lO'SN/m
Kit and Evered give X = 5.173 106 J/kg at Tb= 180.04 K at 1 arm, which compares well with Perry's handbook (Reference 56). Scaling X as suggested in Reid (Reference 55) to 243.8 K, using Tcrit = 289.7 K, gives the value above. The vapor viscosity was not found. However, due to the very low liquid viscosity, the critical flow rate for forming large waves, Fcr, is estimated to exceed 100 kg]m. s, making such waves unlikely.
Thermocouples were located on the outside of the thin chamber. A steady temperature rise during a run was indicative of the absence of liquid film on the wall at that axial position. Where the liquid film did exist the wall temperature actually decreased during a firing, due to the low saturation temperature of diborane. Unfortunately, the thermocouples were spaced 2 inches apart, making it difficult to determine the liquid film lengths accurately. The best approximations
are given b e l o ~
41

A E D C - T R - 9 1 - 1
TEST I" (ku/m-s~ Lc finl
1 0.583 3< Ix: <5 3 0.445 I< I,o <3 4 0.451 I< I~ <3 6 0.191 i< Ix: <3 9 0.306 i< Lc <3
I0 0.532 = 3 II 0.435 I< Lc <3
Surprisingly, the authors assume that the liquid is immediately evaporated, based u p o n calculations of the normally expected heat flux without transpiration. They interpret the thc rmocouple data as meaning that this vapor refrains f rom mixing with the hot gases until some arbitrary distance downstream.
No information on the emittance of the combust ion products was available, so the emittance was treated as an adjustable parameter. Assuming 8% free stream turbulence, the best comparison between the data and calculations was obtaincd with an assumed emittance of 17%, as shown in Figure 9. Radiation accounted for 90% of the heat flux in this case. The calculated liquid film length is somewhat insensitive to the assumed emittance. For example, halving the emittance to 8.5% increases the calculated liquid film length by 58%, whereas an 82% increase might be expected. The reason is that the vapor liberated by radiation greatly decreases the convective heat flux through transpiration. If the radiative flux decreases, convection increases, keeping the evaporation rate somewhat constant.
Given the n u m e r o u s species in the products , one might expect a larger emittance, however the optical density of 64 atm-cm was fairly low. To critically judge the analysis for this test requires an independent determinat ion of the gas emittance.
42

AEDC-TR-91-1
4.2 GASEOUS FILM COOLING
4.2.1 Ewen and Rousar (References 49-51)
The goal in all three test programs was to study gaseous film cooling in a converging-diverging nozzle, for application to rocket engines. The au thors analyzed their data in terms of an empirical model. Although their model is similar to the differential entra inment formulation of Section 3.4.1, it is not based u p o n standard correlations. For this reason only their raw data was used.
In the first two reports (1972 and 1973) testing was done on a flow bench in a laboratory, using heated nitrogen for the free stream flow and either hydrogen or nitrogen coolant. The free stream turbulence was measured to be 4.1% for all tests. The free stream flow was fully-developed u p o n contacting the coolant injector, leading to a difficulty in specifying the injection position from the "leading edge", a problem discussed later. Only those tests with a coolant injection velocity less than the free stream velocity were analyzed (to avoid jet effects), although all of the data was qualitatively similar. The test conditions are given below:
Test chamber Gch T coolant M c T c Aet (kq/s.m2~ (3) ~kq/som~ (K) ~%)
1972: 3 30°-IR 630 763 H 2 0.189 294 38 5A " " 629 764 H 2 0.185 285 28 8 " " 636 756 H 2 0.122 Iii 6
IIA conical 631 761 H 2 0.185 292 0
1973: 101L 30°-IR 581 820 Ns 0.355 341 0
101H " " 577 822 N 2 0.528 320 0 102 30°-2R 528 880 Hs 0.170 270 16
103A 15°-2R 591 816 H 2 0.173 275 18 104AL ,, i, 599 815 N 2 0.360 345 0
104AH " " 596 817 N 2 0.677 327 0 105A con. mod 597 817 H 2 0.157 270 0
For test 104AL, the free stream temperature was stated as 915°K in Rousar and Ewen's report, apparently as a misprint. Also, for tests 102, I03A, and 105A, the stated coolant injection temperatures, T c, were adjusted to be consistent with
the axial thermocouple readings.
In the last repor t (1977), measurements were made in an 0 2 (g)/H2 rocket engine using hydrogen, nitrogen, and hel ium coolants. All tests used the same chamber (P/N 1182134). The coolant injector was 178 mm downst ream of the
43
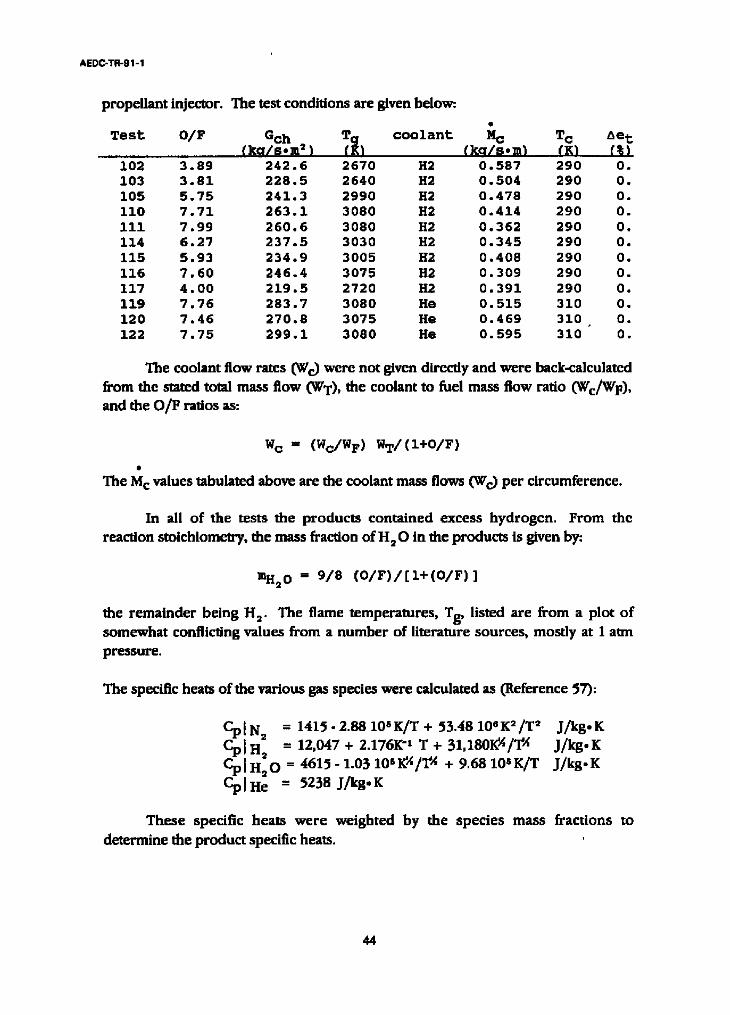
A E D C - T R - 9 1 - 1
propellant injector. The test conditions are given below:
Test O/F Gch Ta coolant M c T c Ae t (ka/som 2 ) fg) (ko/s.m) (K) (%)
102 3.89 242.6 2670 H2 0.587 290 0. 103 3.81 228.5 2640 H2 0.504 290 0. 105 5.75 241.3 2990 H2 0.478 290 0. II0 7.71 263.1 3080 H2 0.414 290 0. IIi 7.99 260.6 3080 H2 0.362 290 0. 114 6.27 237.5 3030 H2 0.345 290 0. 115 5.93 234.9 3005 H2 0.408 290 0. 116 7.60 246.4 3075 H2 0.309 290 0. 117 4.00 219.5 2720 H2 0.391 290 0. 119 7.76 283.7 3080 He 0.515 310 0. 120 7.46 270.8 3075 He 0.469 310 0. 122 7.75 299.1 3080 He 0.595 310 0.
The coolant flow rates (Wc) were not given from the stated total mass flow (WT), the coolant and the O/F ratios as:
directly and were back-calculated to fuel mass flow ratio (Wc/WF),
w c = (Wo/WF) WT/(I+O/F)
The M c values tabulated above are the coolant mass flows (Wc) per circumference.
In all of the tests the products contained excess hydrogen. From the reaction stoichiometry, the mass fraction of H 20 in the products is given by:
mH2 0 = 9 /8 ( O / F ) / [ I + ( O / F ) ]
the remainder being H 2. The flame temperatures, Tg, listed are from a plot of somewhat conflicting values from a number of literature sources, mostly at 1 aim pressure.
The specific heats of the various gas species were calculated as (Reference 57):
Cp[ N2 = 1 4 1 5 - 2.88 10SK/T + 55.48 IOeK2/T 2 Cp[ H2 = 12,047 + 2.176K -x T + 31,180I~/, / 'I '~ C p [ H 2 0 = 4615- 1.03 10sI~A/T ~ + 9.68 10SK/T
Cp[ He = 5238 J/kg. K
These specific heats were weighted by the species mass determine the product specific heats.
J / k g . K J /kg . K J / k g , K
fractions to
44
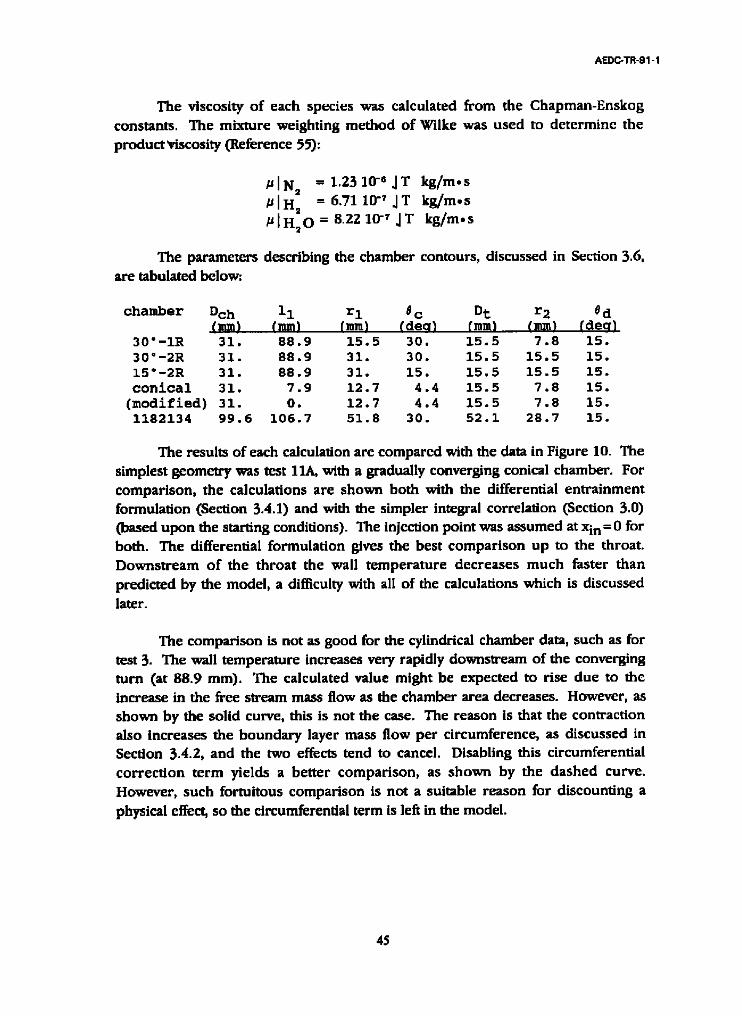
A E D C - T R - 9 1 - !
The viscosity o f each species was calculated from the Chapman-Enskog constants. The mixture weighting me thod of Wilke was used to de te rmine the productMscosity (Reference 55):
t~l N 2 = 1.23 10 "e J T k g / m . s # ]Ha = 6 . 7 1 1 0 " J T k g ] m . s # [ H 2 0 = 8.22 10-" J T k g / m . s
The parameters describing the chamber contours, discussed in Section 3.6, are tabulated below:
chamber Dch 11 r I 0 c D t r 2 0 d ~mm~ (mm~ (mm~ (deo) (mm) (mm~ (deo)
30°-IR 31. 88.9 15.5 30. 15.5 7.8 15. 30°-2R 31. 88.9 31. 30. 15.5 15.5 15. 150-2R 31. 88.9 31. 15. 15.5 15.5 15.
conical 31. 7.9 12.7 4.4 15.5 7.8 15. (modified) 31. 0. 12.7 4.4 15.5 7.8 15. 1182134 99.6 106.7 51.8 30. 52.1 28.7 15.
The results of each calculation are compared with the data in Figure 10. The simplest geometry was test 11A, with a gradually converging conical chamber. For compar ison, the calculations are shown both with the differential en t ra inment formulation (Section 3.4.1) and with the simpler integral correlation (Section 3.0) (based u p o n the starting conditions). The injection point was assumed at Xin = 0 for both. The differential formulat ion gives the best compar i son up to the throat. Downs t ream o f the th roa t the wall t empera tu re decreases m u c h faster than predicted by the model, a difficulty with all of the calculations which is discussed
later.
The comparison is not as good for the cylindrical chamber data, such as for test 3. The wall temperature increases very rapidly downstream of the converging turn (at 88.9 mm). The calculated value might be expected to rise due to the increase in the free stream mass flow as the chamber area decreases. However, as shown by the solid curve, this is not the case. The reason is that the contraction also increases the boundary layer mass flow per circumference, as discussed in Section 3.4.2, and the two effects tend to cancel. Disabling this circumferential correc t ion te rm yields a better compar ison , as shown by the dashed curve. However, such fortuitous comparison is not a suitable reason for discounting a physical effect, so the circumferential term is left in the model.
45

AEDC-TR-91-1
As in mos t model ing efforts the comparison can be improved by judicious selection of input parameters, as shown in the second figure. To force comparison in the straight chamber section, a downstream injection point (Xin) of 20 m m was used. While arbitrary, this could be defended by arguing that in fully-developed flow the injection point is considered an infinite distance from the "leading edge". However, with the exception of tests 3 and 5A, Xin=0 was always the op t imum choice. This is suppor ted by heat transfer data taken by Ewen and Rousar which show the initially high convective heat transfer rates o f a leading edge at the injection point. Apparently the coolant injection disrupts the flow such that a new boundary layer grows from the injection point.
To force comparison downstream of the converging turn it was necessary to assume an increase in the free stream turbulence due to the turn, Ae~ of 38% for test 3. Similar correc t ion factors are necessary with all t u rbu lence mode l s (Reference 59). The values required for each test are tabulated above.
Such a correction is defensible only if it is not arbitrary. This extra "turning turbulence" can be correlated by a "centrifugal parameter":
Fc= (p g-Pc) v--~2rt = rtpg tG2 11-p~gg]
where r I is the radius of the converging turn, Pc and pg are the coolant and gas densities at the turn. Note that F c has dimensions. For all of the 1977 tests in the rocket engine, the correction was negligible. Given the low densities in most rocket chambers, this is generally true.
As shown in Figure 11, the correlation between Ae t and F c can be fit by a
function:
~ e t = 5 . 2 6 { [ 1 + ( 0 . 0 2 9 F c ) S ] t / s - 1} f o r Pg > Pc = O. f o r Pg < Pc where: F O <> kN/mS
The aberrant point is due to test 8 of 1972, for which it was impossible to obtain any satisfactory comparisons.
It was not possible to obtain a reasonable comparison with the data of rests 119-122 which used helium coolant. The rate of temperature rise with non-reactive
he l ium coolant was overpredic ted by a factor of 1.7, raising the quest ion that combust ion effects are important and that the favorable comparisons with hydrogen
coolant in the rocket were merely fortuitous.
46
AEDC-TR-91-1
For instance, the free stream temperature close to the wall might have been considerably less than that used in the calculations above. Since many injectors provide a fuel rich zone near the wall, this is plausible. Such an assumption would make the He coolant calculations compare more favorably with the data. Normally this assumption would also lead to a significant under-prediction of the wail temperatures with H2 coolant. However, considering combustion of the H2 coolant in the boundary layer could restore the wail temperatures to the measured values. Data with other coolants is needed to ascer- tain whether combustion effects could explain the discrepancy.
In all of the calculations it was not possible to account for the rapid decrease of wall t empera tu re downs t ream of the throat. Since the wall t empera tu re decreased even faster than the free stream gas static temperature, increased mixing with the free stream gases could not account for this rapid decrease. Instead, it might be attributed to the static temperature change of the boundary layer gases as they accelerate. Since the present formulation lumps together all of the boundary layer gases, it would be difficult to incorporate such an effect into the model. A turbulent boundary layer model, which considers the velocity profile across the boundary layer, would be better suited to this task.
All of the calculated results assumed a recovery factor of zero, meaning that the enU'ained free stream gas is at the static temperature. However, upstream of the nozzle th roa t the re is little difference be tween the static and s tagnat ion temperatures, so that the choice of recovery factor is not significant. Downstream of the throat the present model is unable to accurately predict the wall temperature,
regardless of the choice of recovery factor.
47
A E O C - T R - 9 1 - 1
4.2.2 G.IL Kinney, et al (Reference 17)
The data in this report was reviewed in Section 4.1.1 pertaining to calculation of liquid film lengths, which was the focus of their study. The authors do, however, give one plot of temperatures downstream of the dryout point in their Figure 4. This data is useful in determining how to apply the gaseous film cooling analysis to the special case of liquid film cooling. The property values are from Section 4.1.1.
The start of the liquid film was 40 inches from the tube entrance, and the liquid film was 20 inches long. As argued in the previous analysis of Ewen and Rousar's data, the gaseous coolant injection tends to disturb the boundary layer such that the injection point acts effectively as a "leading edge". The simplest assumption is that all of the vapor is injected at the termination of the liquid film (Xin=O). The calculated wall temperatures compare favorably with the data, as shown in Figure 12. This is compared with an alternate assumption that the effective leading edge is in the center of the liquid film (Xin= 254 mm), which gives very poor comparison with the data. Therefore, as was found with Ewen and Rousar's data, taking Xin = 0 generally gives the best comparisons with existing data for all cases.
48
A E D C - T R - S 1 - I
5.0 CONCLUSIONS
A" simple one-dimensional model gives satisfactory comparison with existing data for liquid film lengths in rocket engines. Convective and radiant heat transfer mus t both be considered. At high coolant flow rates large waves on the film can decrease the coolant efficiency. Knuth's correlation is useful in predict ing this transition. Radiant b u r n o u t of the liquid film is possible, however the use of existing burnou t correlations is questionable.
Downstream of the liquid film a standard gaseous film cooling correlation, modi f ied to a differential form, satisfactorily predicts the wall t empera tu re s upst ream of the throat as the vapor mixes with the free stream gas. A correct ion factor, correlated in terms of a "centrifugal parameter", is needed to account for increased mixing due to the converging turn. However, in most rocket engines it is not significant. Downstream of the throat the wall temperature drops very rapidly due to acceleration of the boundary layer gases, which is not predicted by the present model.
49
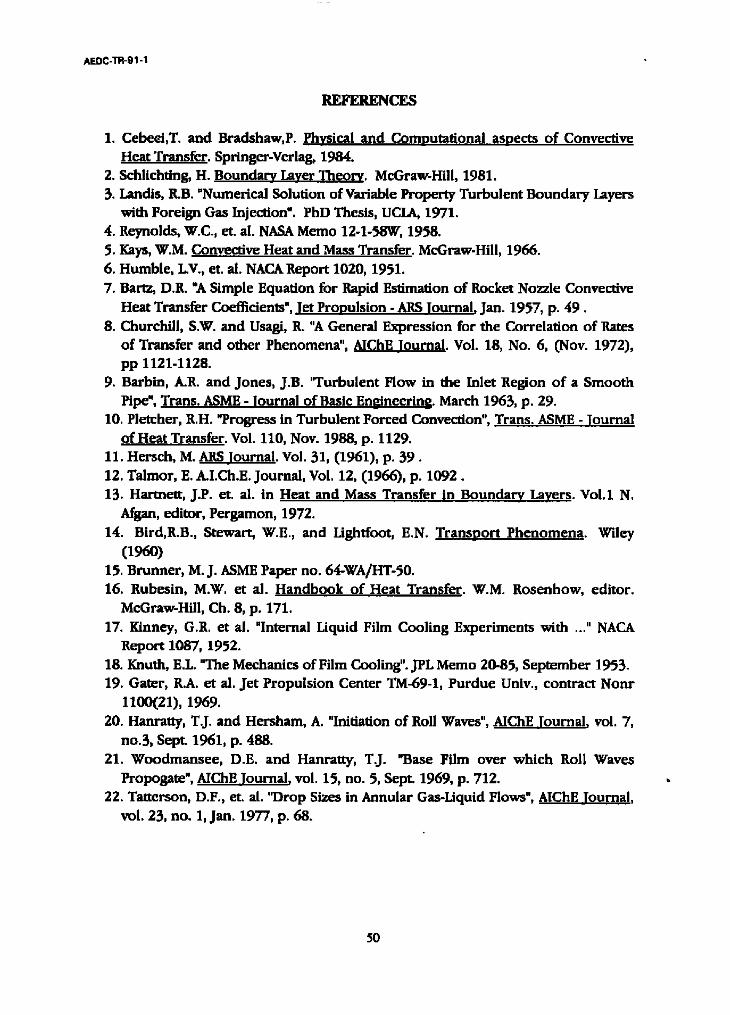
A E D C - T R - 9 1 - 1
REFERENCES
I. Cebeei,T. and Bradshaw, P. Physical and Computational aspects of Convective Heat Transfer. Springer-Verlag, 1984.
2. Schlichting, H. Boundary Laver Theory. McGraw-Hill, 1981. 3. Landis, R.B. "Numerical Solution of Variable Property Turbulent Boundary Layers
with Foreign Gas Injection". FhD Thesis, UCIA, 1971. 4. Reynolds, W.C., et. al. NASA Memo 12-I-58W, 1958. 5. Kays, W.M. Convective Heat and Mass Transfer. McGraw-Hill, 1966. 6. Humble, L.V., et. al. NACA Report 1020, 1951. 7. Bartz, D.R. "A Simple Equation for Rapid Estimation of Rocket No~le Convective
Heat Transfer Coefficients', Jet Propulsion - ARS Journal, Jan. 1957, p. 49. 8. Churchill, S.W. and Usagi, R. "A General Expression for the Correlation of Rates
of Transfer and other Phenomena", AIChE Journal. Vol. 18, No. 6, (Nov. 1972), pp 1121-1128.
9. Barbin, A~R. and Jones, J.B. "Turbulent Flow in the Inlet Region of a Smooth Pipe', Trans. ASME - |ournal of Basic Engineering. March 1963, p. 29.
I0. Pletcher, R.H. "Progress in Turbulent Forced Convection", Trans. ASME - Journal of Heat Transfer. Vol. 110, Nov. 1988, p. 1129.
11. Hersch, M. ARS Journal. Vol. 31, (1961), p. 39 • 12. Talmor, E. A.I.Ch.E. Journal, Vol. 12, (1966), p. 1092. 13. Hartnett, J.P. et. al. in Heat and Mass Transfer in Boundary Layers. Vol.l N.
Afgan, editor, Pergamon, 1972. 14. Bird, R.B., Stewart, W.E., and Hghtfoot, E.N. Transport Phenomena. Wiley
(i 0) 15. Brunner, M. J. ASME Paper no. 64-WA]HT-50. 16. Rubesin, M.W. et al. Handbook of Heat Transfer. W.M. Rosenhow, editor.
McGraw-Hill, Ch. 8, p. 171.
17. Kinney, G.R. et al. "Internal Liquid Film Cooling Experiments with ..." NACA Report 1087, 1952.
18. Knuth, E.L. "The Mechanics of Film Cooling". JPL Memo 20-85, September 1953. 19. Gater, R.A. et al. Jet Propulsion Center TM-69-1, Purdue Univ., contract Nonr
1100(21), 1969. 20. Hanratty, T.J. and Hersham, A. "Initiation of Roll Waves", AIChE Journal, vol. 7,
no.3, Sept. 1961, p. 488. 21. Woodmansee, D.E. and Hanratty, T.J. "Base Film over which Roll Waves
Propogate", AIChEJournal, vol. 15, no. 5, Sept. 1969, p. 712. 22. Tatterson, D.F., et. al. "Drop Sizes in Annular Gas-Liquid Flows", AIChE Journal,
vol. 23, no. 1, Jan. 1977, p. 68.
50

AEDC-TR-91-1
23. Research Summary No. 36-4, Volume II. Jet Propulsion Laboratory, Pasadena, California, September 1, 1960. pp 82.84.
24. Sutton, G.P. et al. "Advanced Cooling Techniques for Rocket Engines", Astronautics and Aeronautics, January 1966, pp 60-71.
25. Siegel, R. and Howell, J.R. Thermal Radiation Heat Transfer, second edition, Hemisphere, (1981), Section 17.5 - 17.6.
26. Ziebland, H. and Parkinson, R.C. "Heat Transfer in Rocket Engines", AGARD-AG-148-71, Sept 1971, Ch.6.
27. Burrows, M.C. NASA TND - 2541, 1964. 28. Monde, M. and Katto, Y. "Burnout in a High Heat Flux Boiling System with an
Impinging Je¢', Int. |ournal of Heat and Mass Transfer, Vol.21, 1978, p.295. 29. Katto, Y. and Ishii, K. "Burnout in a High Heat Flux Boiling System with a forced
supply of liquid through a Plane Jet", 7th Int. Heat Transfer Conf., Vol.4, Toronto, 1978, p.435.
30. Mudawwar, I.A., Incropera, TA. and F.P. "Critical Heat Flux in Falling Liquid Films". Particulate Phenomena and Multiphase Transport, T.N. Veziroglu, ed., Volume 2, Hemisphere, 1988.
31. CPIA Liquid Propellants Manual, Chemical Propulsion Information Agency, Laurel, Md.
32. Zucrow, M.J. and Graham, A.R. "Some Considerations of Film Cooling for Rocket Motors", Jet Propulsion - ARS Journal, June 1957, p. 650.
33. Zucrow, M.J. and Sellers, J.p. "Experimental Investigation of Rocket Motor Film Cooling", ARS Journal, May 1961, p. 668.
34. Warner, C.F. and Emmons, D.L. "Effects of Selected Gas Stream Parameters and Coolant Properties on Liquid Film Cooling", Trans. ASME |ournal of Heat Transfer, May 1964, p. 271.
35. Gater, RA. et al. Jet Propulsion Center TM-65-6, Purdue Univ., Contract Nonr 1100(21), October 1965.
36. Shembharkar, T. R. and Pal, B.R. "Prediction of Film Cooling with a Liquid Coolanf', Int. Journal of Heat and Mass Transfer, Voi. 29, No. 6, 1986, p. 899.
37. Economos, C. "The Compressible Turbulent Boundary Layer with Mass Transfer". Phd thesis, Polytechhnic Inst. of Brooklyn, 1968.
38. Kutateladze,S.S. et al. High Temperature (Soviet),Vol.1, Sept-Oct 1963. 39. Stollery, J.L. and EI-Ehwany, A.&M. "A note on the use of a Boundary Layer
Model for correlating Film Cooling Data", Int. Journal of Heat and Mass Transfer, Vol.8, 1965, p.55.
40. Hatch, J.E. and Papell, S.S, NASA TND-150, 1959. 41. Librizzi, J. and Cresci, R.J. "Transpiration Cooling of a Turbulent Boundary
Layer in an Axisymmetric Nozzle", AIAA [ournal, Vol.2, No.4, April 1964.
51
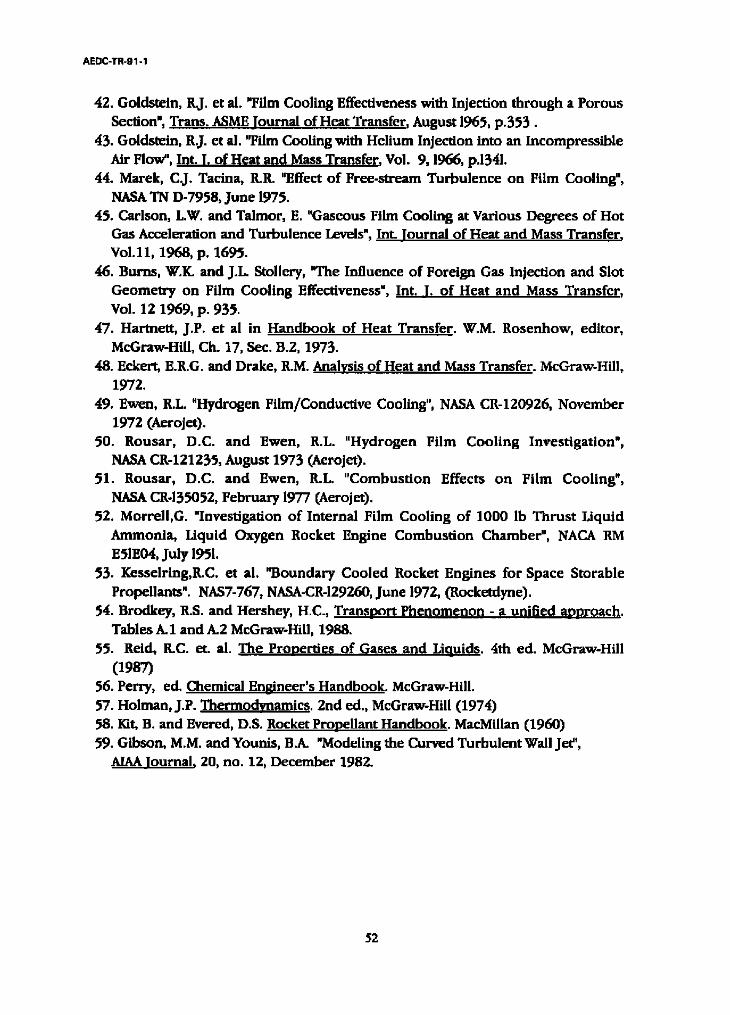
AEDC-TR-91-1
42. Goldstein, R.J. et al. "Film Cooling Effectiveness with Injection through a Porous Section', Trans. ASME Iournal of Heat Transfer, August 1965, p.353 •
43. Goldstein, R.J. et al. "Film Cooling with Helium Injection into an Incompressible Air Flow', Int. I. of Heat and Mass Transfer, Vol. 9, 1966, p.1341.
44. Marek, C.J. Taeina" R.R. "Effect of Free-stream Turbulence on Film Cooling", NASA TN D-7958, June 1975.
45. Carlson, L.W. and Talmor, E. "Gaseous Film Cooling at Various Degrees of Hot Gas Acceleration and Turbulence Levels', Int. Iournal of Heat and Mass Transfer, Vol.ll, 1968, p. 1695.
46. Burns, W.IC and J.L. Stollery, "The Influence of Foreign Gas Injection and Slot Geometry on Film Cooling Effectiveness', Int. [. of Heat and Mass Transfer, Vol. 12 1969, p. 935.
47. Hartnett, J.P. et al in Handbook of Heat Transfer. W.M. Rosenhow, editor, McGraw-Hill, Ch. 17, Sec. B.2, 1973.
48. Eckert, E.R.G. and Drake, R.M. Analysis of Heat and Mass Transfer. McGraw-Hill, 1972.
49. Ewen, R.L. "Hydrogen Film/Conductive Cooling", NASA CR-120926, November 1972 (Aeroje0.
50. Rousar, D.C. and Ewen, R.L. "Hydrogen Film Cooling Investigation", NASA CR-121235, August 1973 (Aerojet).
51. Rousar, D.C. and Ewen, R.L. "Combustion Effects on Film Cooling", NASA CR-135052, February 1977 (Aerojet).
52. Morrell,G. "Investigation of Internal Film Cooling of 1000 Ib Thrust Liquid Ammonia, Liquid Oxygen Rocket Engine Combustion Chamber'', NACA RM E51E04, July 1951.
53. Kesselring, R.C. et al. "Boundary Cooled Rocket Engines for Space Storable Propellants". NAS7-767, NASA-CR-129260, June 1972, (Rocketdyne).
54. Brodkey, R.S. and Hershey, H.C., Transport Phenomenon - a unified approach. Tables A.1 and A.2 McGraw-Hill, 1988.
55. Reid, R.C. et. al. The Properties of Gases and Liquids. 4th ed. McGraw-Hill (1987)
56. Perry, ed. Chemical Engineer's Handbook. McGraw-Hill. 57. Holman, J.P. Thermodynamics. 2nd ed., McGraw-Hill (1974) 58. Kit, B. and Evered, D.S. Rocket Propellant Handbook. MacMillan (1960) 59. Gibson, M.M. and Younis, B.A. "Modeling the Curved Turbulent Wall Jef',
AIAA lournal, 20, no. 12, December 1982.
52
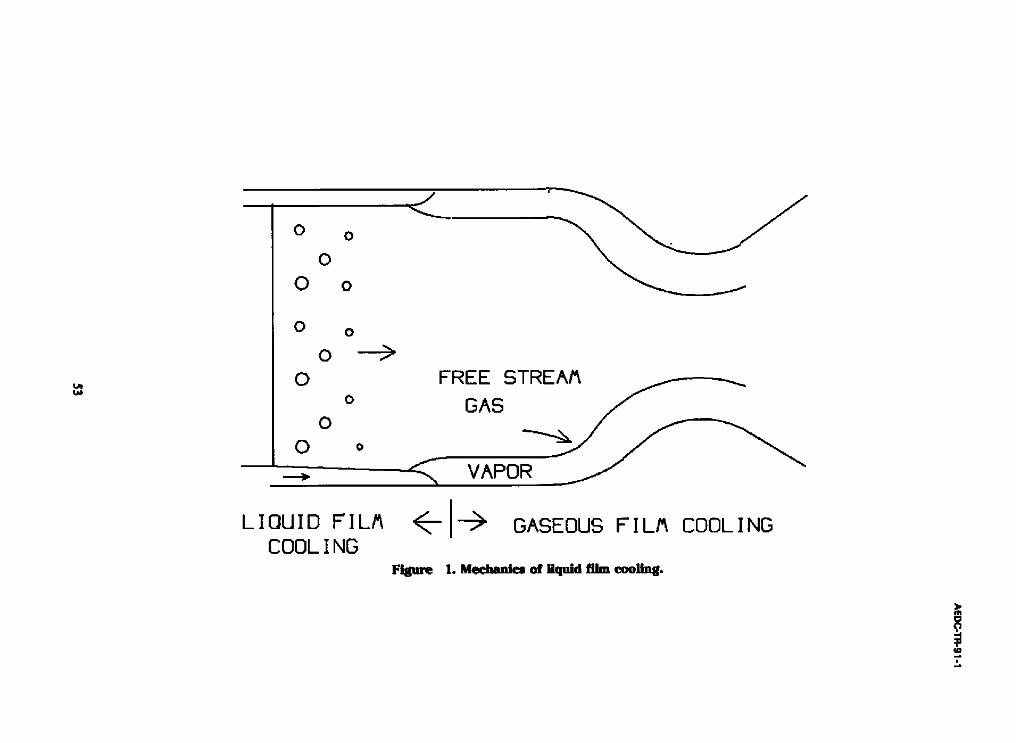
O O
O
O o
O o
o o
O
O O o
L I Q U I D F]L/~ COOL ! NG
_ J
FREE STREAA
GAS
vAPoR
~-- I - ' ~ GASEOUS F I L/~ COOL I NG
Figure 1. Mechanics of Hquid film cooling.
31, I11 O 0 ,,4 ,3 I 0

1.3
1.2
1.1 " ~
m =[ .2 •
1.0 O
boundary layer 0.9
0 2 4 6 8 10 12 14 16 x/D
1-1
Dafa of Ref. 9
m O
:p ¢o . . s
F'~quure 2. T rans i t i on to ful ly-developed flow.
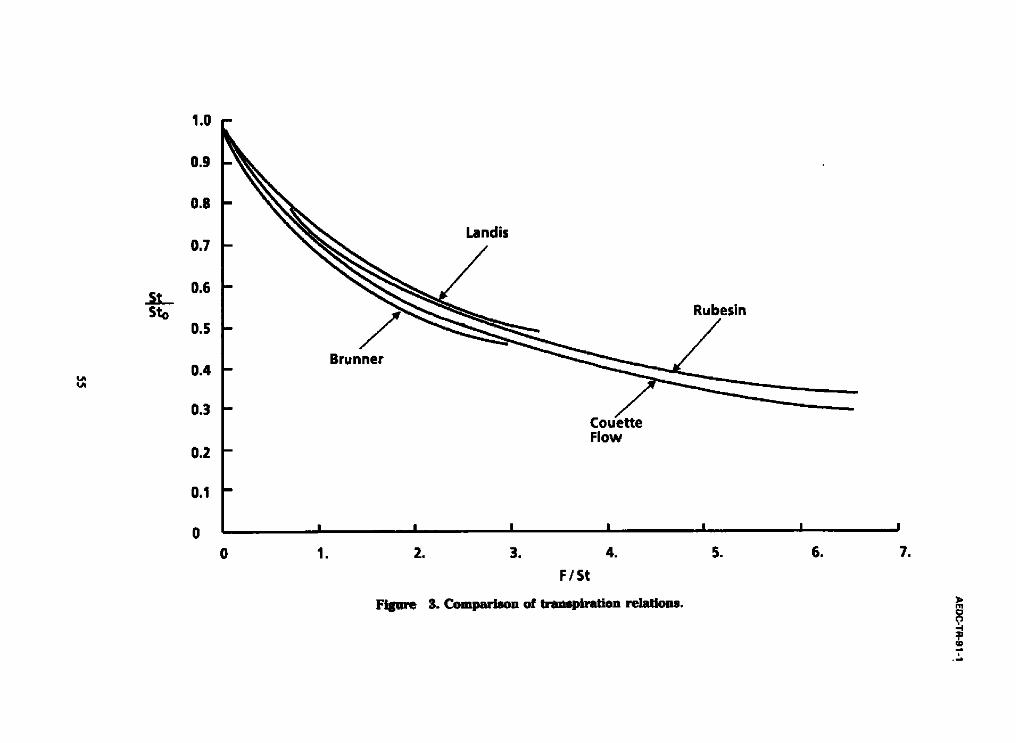
1.0
St Sto
0.9
0.8
0.7
0.6
0.5
0.4
0.3
0.2
0.1
0
0
Brunner
I
1.
Landis
Flow
I I I
2. 3. 4.
F/St
Figure 3. Comparison of transpiration relaUons.
Rubesin
,J
S.
I
6.
!
7.
m
co d
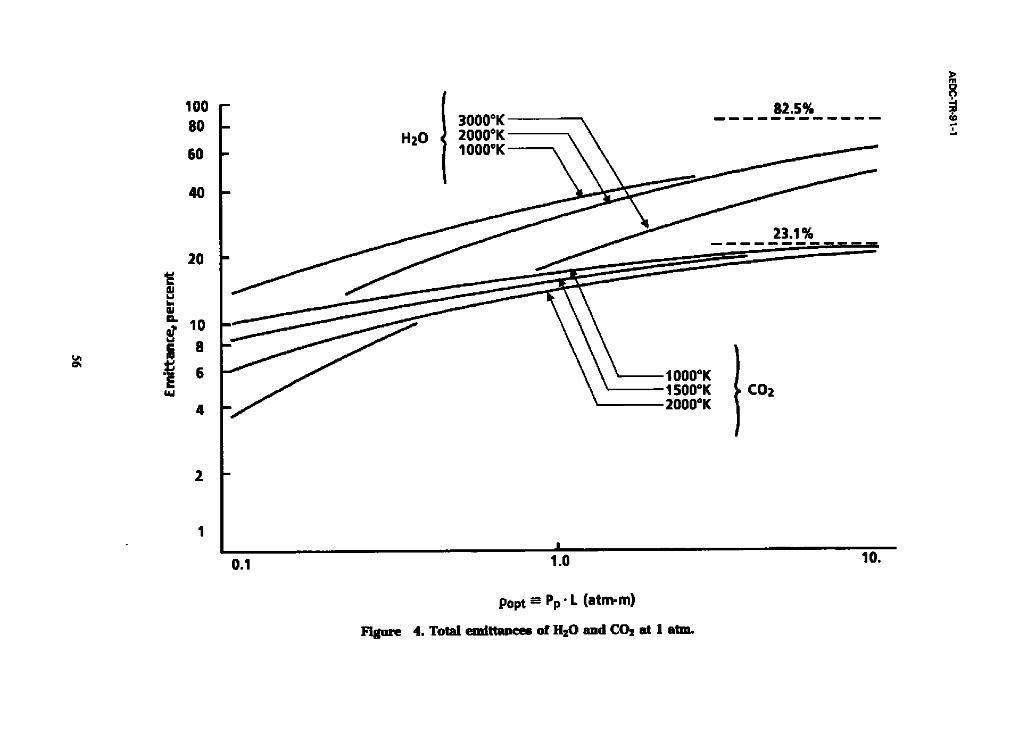
100 80
60
4 0
2O t~ 4J 4J b ,
¢I. d 10 W = 8
• ~ 8 E
h . i
4
2
l
l
0.1
H20
Fil~'e
t 3000°K 2000°K 1000°K
82.5% m m m m m m m m m m ~ q m m
23 1%
1000°K t 1500°K COz 2000°K
I 1.0 10.
Popt -- Pp" L (atm-m)
4. Total emittances of H=O and (:O2 at 1 am .
> m 0 ( 3
q~ , . t
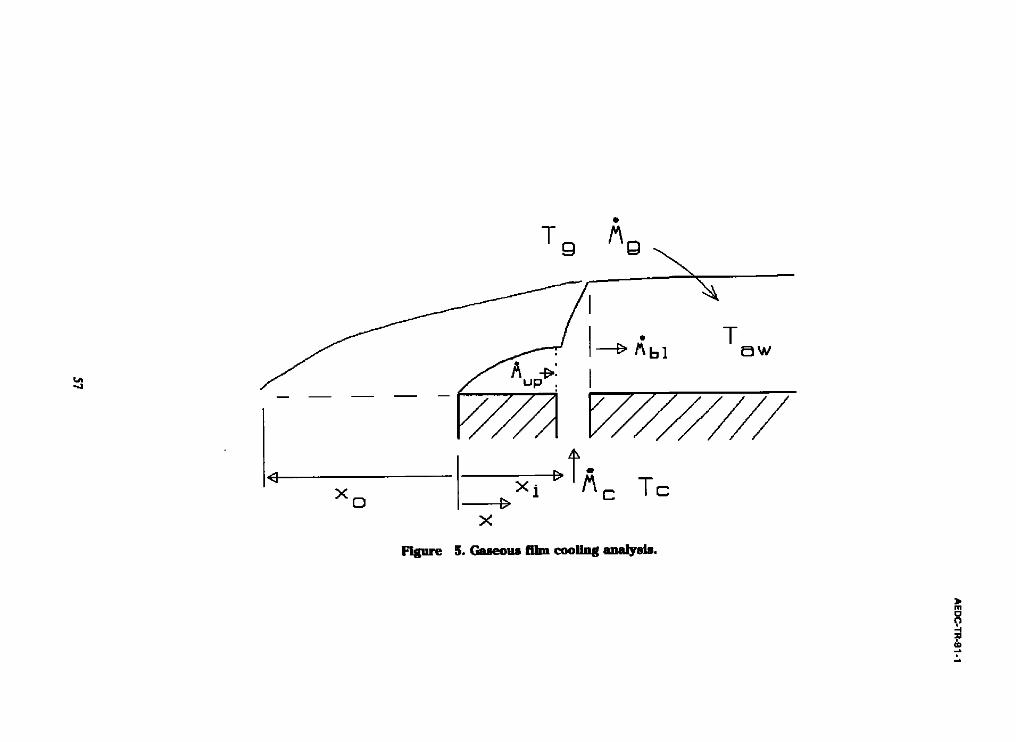
,MI
@
Tg Am
i " N
/ / / ~ 1 ----~ ~s] Tow
'~ x i P "'/~c x mc o b
X
S. Caseous film cooling ~ s i s .
m
- I

] I 2
D c h _ ,DL
e (:::::
I
m
W
Figure 6. Clamber c o n t o u r parameter.
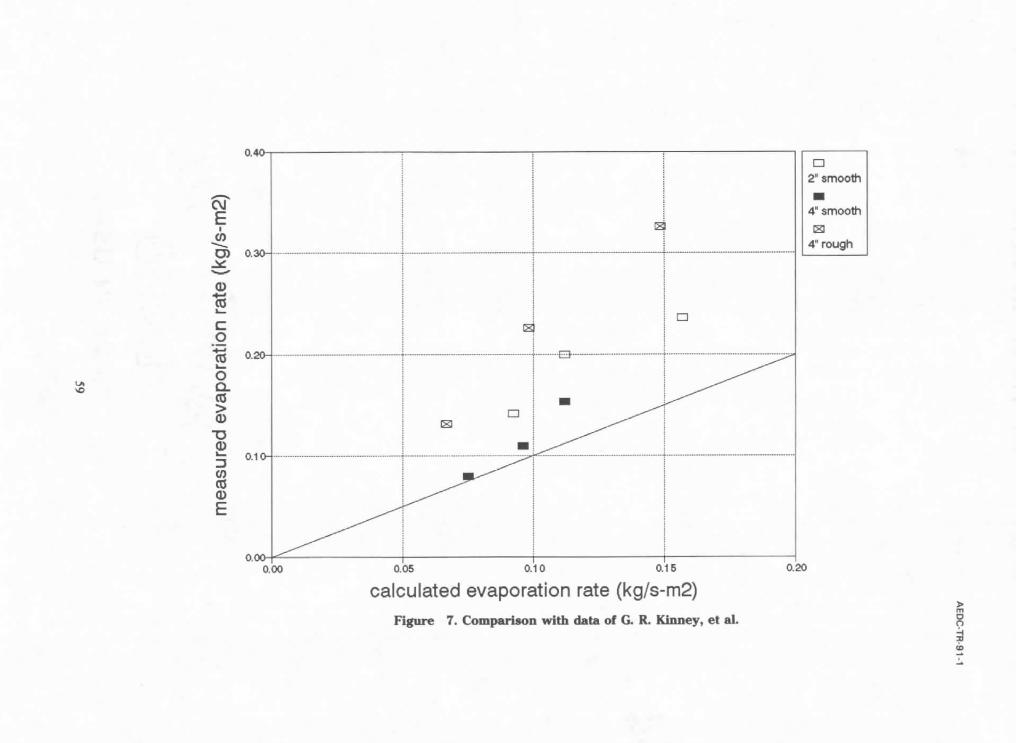
E
C~ "4
v
0
t - O
0 O . (0 > (])
"(3
:3 (/)
(I)
E
0.40
~a
0.30- ..........................................................................................................................................................................................................................
0.20-
0.10-
0.0¢ 0.00
[--I
i - .
I 0.05 0.10 0.15 0.20
calculated evaporation rate (kg/s-m2) Figure 7. Comparison with data of 6. R. Kinney, et al.
D
2" smoolh
I I
4" smoolh
4" rough
0 "4
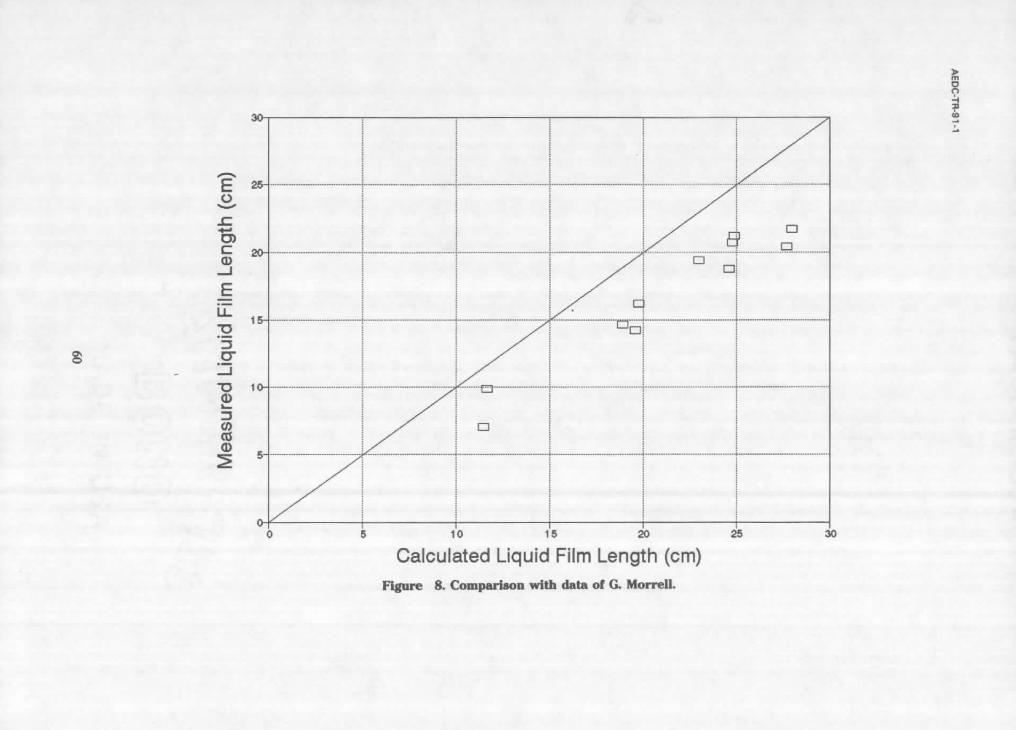
30"'" I i ' i
E
o 1 I I 0 5 10 15 2O 25 30
Calculated Liquid Film Length (cm) Figure 8. C o m p a r i s o n w i t h data o f G. Morrei l .
0
(D
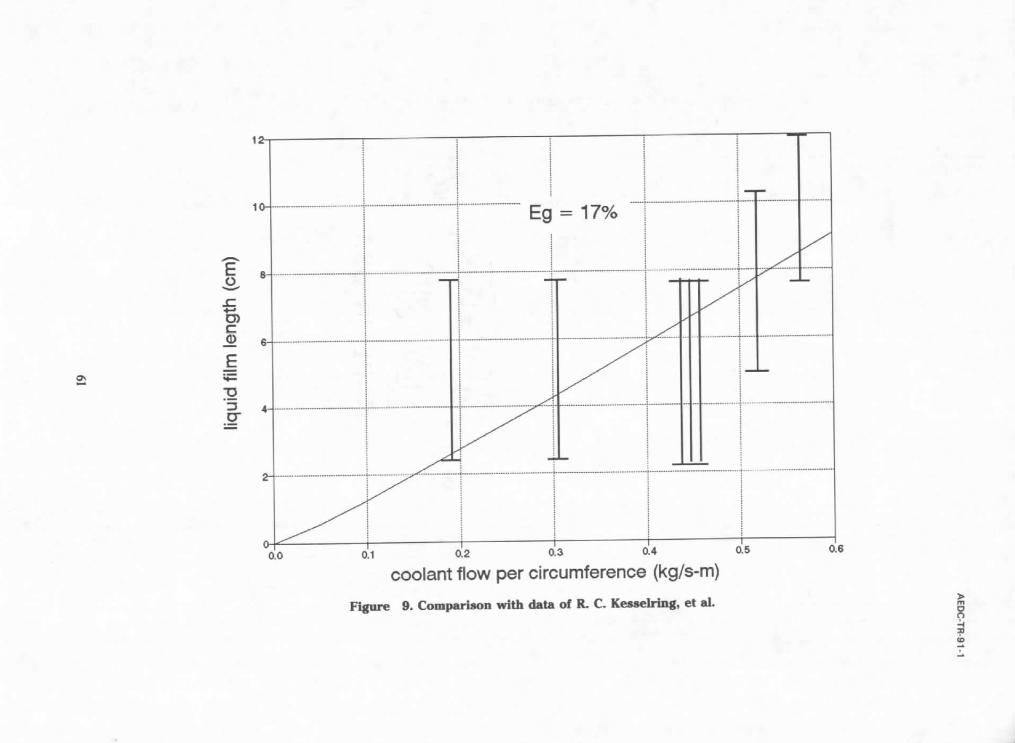
E 0
v
E)') r -
E o ~ N.,..,,
"10
ET
1= 1
Eg = 17%
0.0 0.1 0.2 0.3 0.4
coolant flow per circumference (kg/s-m)
Figure 9. Comparison with data of R. C. Kesselring, et al.
0.5 0.6
0
- I ,= ¢D
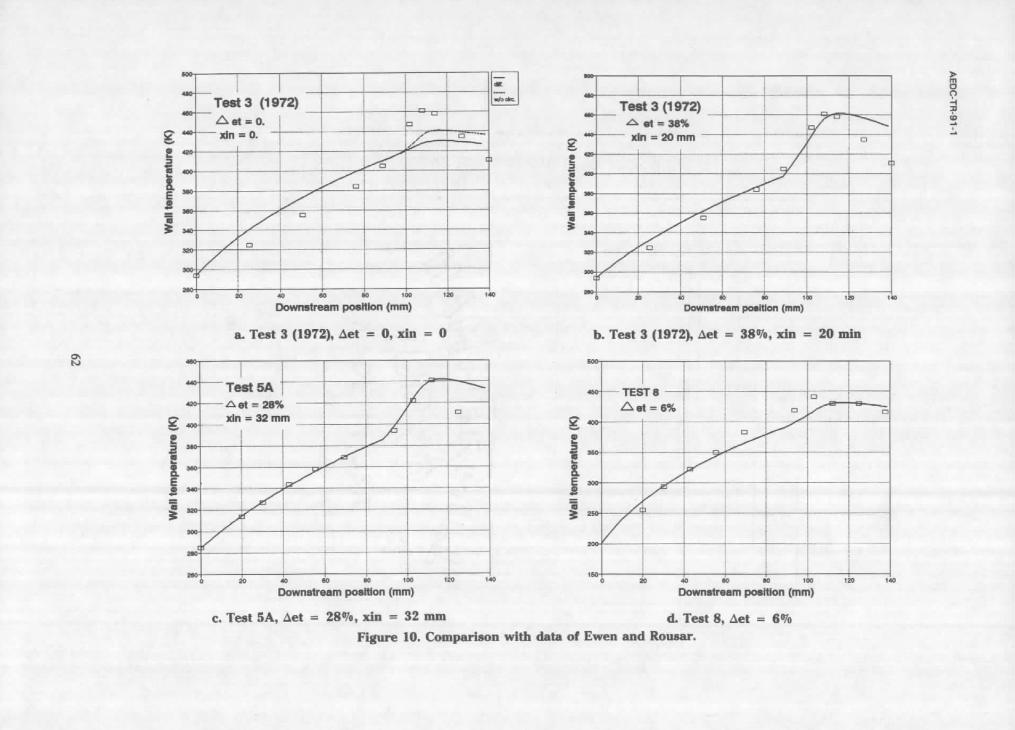
- - T e s t 3 (1972) - - D "~ ' ' T e s t 3 (1972)
- - xln = 0. - i ~ ':~- - i ~ "~ - - xln ~- 20 mm - -
e I j~..~-~t _e"
D o w m , ~ u m por t ion (mini D o m m poemon (mini
a. T e s t 3 (1972) , ~ e t = O, x i . = O b. T e s t 3 (1972) , A e t = 3 8 % , x t n = 20 , . i n
" i i I ~ " i 1 l 1 t ! , I i 1
- - - - T e s t 5 A i , ~ - - TEST8 ........ ! ~ .... I
I i i ~ - r "
Ii l E ~
f i i / ' * .... * ! I
Downetream poeitlon (mm) Downmnmm posmon (mini
c . T e s t S A , A e t ~- 2 8 % , ] d n = 32 mum d. T e s t 8, Ae t = 6 %
F i g u r e lO. C o m p a r i s o n w i t h d a t a o f E w e n a n d R o u s a r .
r n O
-4 ,=
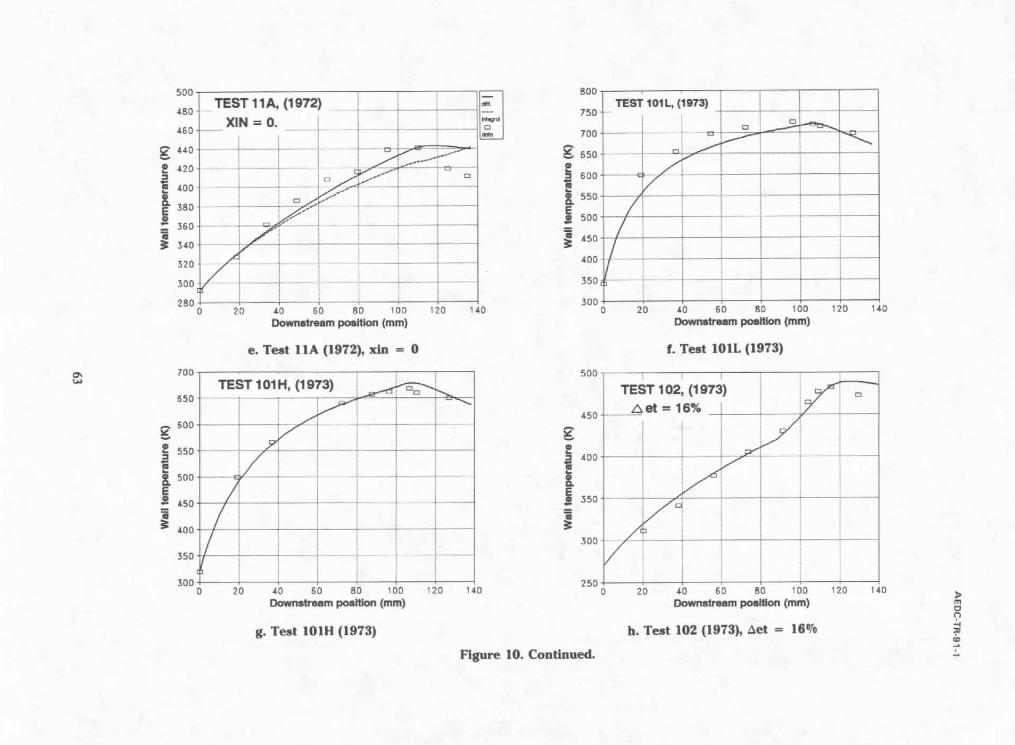
5 0 0
480
4 6 0 '
• , 4 4 0 '
420
4 0 0
3 8 0
36O
3 4 0
3 2 0
3 0 0
2 8 0
T E S T 1 1 A , ( 1 9 7 2 ) i i t~ 800 TES'r 1OIL, (1973) - - i i L t . . 7 5 0 -
x ' ' - ° - - - - ! - - j i , i - - • 700 I ! <' I I ~ ! - - - - t - - - - - ~ ........... ~ - ~ i - . - ~ ~ l l , - , i l
I I ' " - -
,1- ~ t - - - ] i i = i ' ,= , : ' - - . ~ J ~ . - , , ~ ~ i
i : i i i 1 I 3000 2 | 0 20 40 60 80 100 120 140 D o w l ~ m a m p o e i t l o n ( m m )
t 6O0
i ~ I l , 5 5 0 / l
/i i I i I 500 !
. . . . . . + . __ . . ~ ~ . . . . . . . . . . . . . . . . . . . . . 3 . . . . . + . . . . . . . . . . . . . . + . . . . . . . . . . . . . @ . . . . . . . . . . . . . I i I ! m .
, / , ~ , _ .......... T - - , ~ ~_' . . . . ~ - - - ~ t ........... - - 1 i ,~o ! I
I ! I ! I 4.00
I i i i i ! . . ~ _ ~ _ _ _ ~ , . . . . . _~ l ~ - - . . . . . . . . l 3 5 0
" i ! i z
! t / t i
i /
!
i J i
40
[ ]
i L I
, , i I 60 80 100 120
Downi t r immp~i l l~ (mm) 140
e. Test 11A (1972), x in = 0 f. Test 101L (1973)
700 r "I ~ 500 7" I' r T r .l
/ T E S T 101H, (1973) ~ I / T E S T 1021 (1973) = _ ~
8So-~[ ~ - - - T - - - - - r - - i I 1 / ' ~ - ]' -i! - ]" - I ,150-I A c t = 1 6 % - - i
6oo ....... ~ / , I J " ! I
i I , ~ i i i
J, o/ ---7 i -:. i,oo/ i ' ~ ' ' ' i i ' ~ °~ -~~- i i i i ! I i I I , , . , 3 0 0 ! ,. • I ~ , ~ 2 5 0 --I i I l ~ I
0 20 40 60 80 100 120 14.0 0 20 40 60 80 100 120 140
D o w n s t r e a m po l l i t l o l r l ( m m ) D o w n s t r e a m p m d t i o n ( m m )
g. Test 101H (1973) h. Test 102 (1973), ~e t = 1 6 %
Fisure 10. Cont inued.
> m c~
9 - " . 1
.3
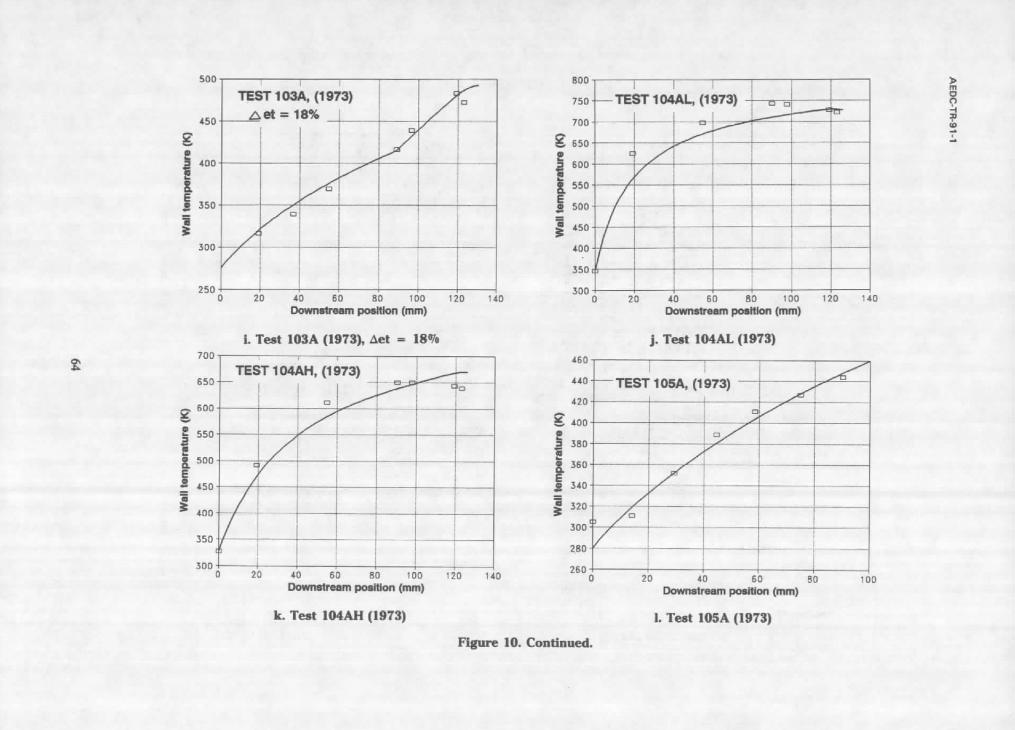
500
450.
E l 4 0 0
Z. E .~ 350
m
i 500
250 0
! i i 1 T E S T 1 0 3 A , ( 1 9 7 3 ) !
_ _ _ _ ~ e t = l S % _ 4 1 _ /
' | i / " , t i J r ,
J / 4 i i I 1 , / - ! i i I / , t ,,i, !
' I I I
i i ~ I , 20 40 60 80 100
Oowniirellm poeliion (mm)
f r -1
1 I I i
120 140
800
750'
700'
~ 6 5 0
800
550
500 m
i 450
400
350,
300 0
I I I - - T E S T 104A1. , ( 1 9 7 3 ) -
I
/ ' i i .
' ! 1 i
! I J 20 40 60
t ! "
t I , I . I ]
! ! I
80 100 120 140 Downstream position (mm)
m
.-I ,:p =1,
1. Test 1O3A (1973), ~ e t = 18°7o
7 ° ° 1 ' ' ' J , J ~ " I .60 T E S T 1 0 4 A H , ( 1 9 7 3 )
400
e 5~o I i /~| i ! i i e | i r / i ~ i I i , , , , , |,,o 5oo ~ - ~ , - - - 1 - - - ~ ; ; ', '
I " / ! ! ! I t I 35o
i r -'"° ' ~ ~ ~ ' 320 400 / r .I I I I
] ~ ~ 300 ! I t I I I 350 .---~-.--,---=-~
I ! E
~ . ,i i = i i 1 i I ! ~ ! i
500 260 0 20 40 60 80 100 120 140
Downstream po/t ion (ram)
J. Test 104AL (1973)
- - T E S T 1 0 5 A , ( 1 9 7 3 )
, / 4 t / [
0 20 40 60 Downstream pmelUon (mm)
i I J i I J J i
i I I ! J i
i
i 80 00
k. Test 104AH (1973) L Tes t 105A (1973)
F igure 10. Cont inued.
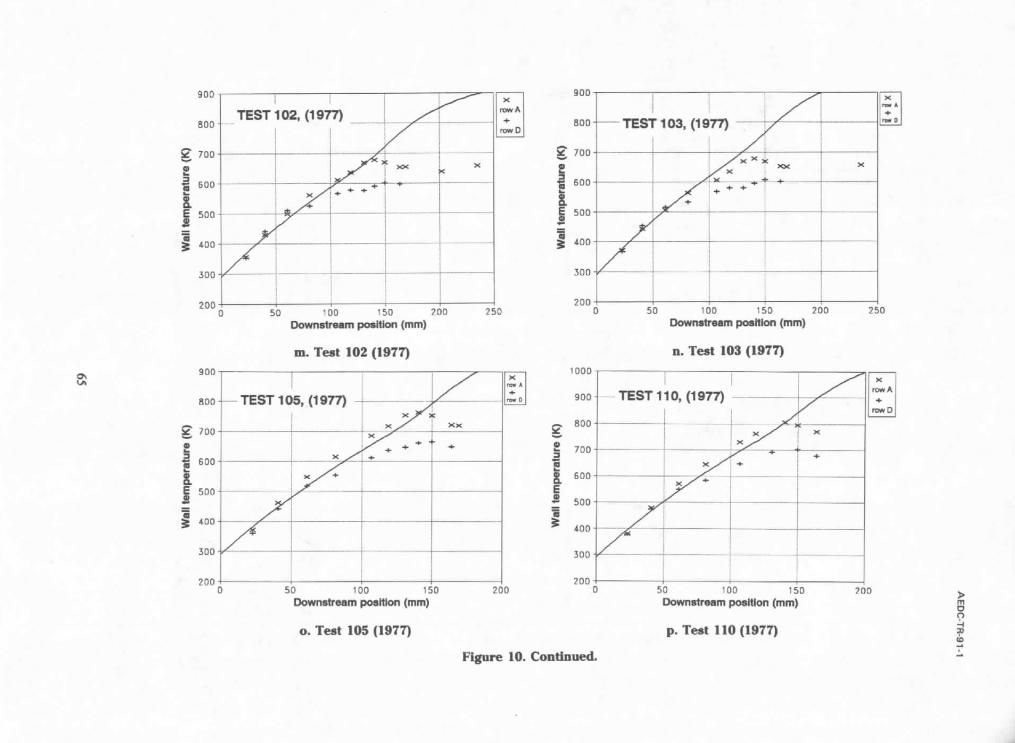
O~
90O
800
2" 700
i 600
I 500
400
300 -
200 0
900
800"
• , 700-
S 600-
500- =.
400
300
200
' ' S ' . . . . . TEST 102, (1977) i ! . . . . . .
; i 1 I _ _ ~ _ _ _ ~ . . . . . ~ _ _ ~ _ _ _
. . . . . . 2 - - ~ - + - + - . - * - - . - - 4 . . . . . . i i ÷ ÷ ÷ I i
. . . . . . . . . . . .
i 5 0
x
T ^
100 150 200 Downstream poMtion (ram)
250
900
800-
700
i 600
500 m
400
300-
200
, Sxxt: ' i÷ ÷ ÷~ 'T
I I z i i
X
i
50 100 150 200 DownMrum poMtlon (mm)
250
m . T e s t 1 0 2 ( 1 9 7 7 )
-- TEST 105, (1977)
T ! x 1 xx
i j/"÷ ÷ " I" ÷ i ..... ~ ~ ÷ _ I
~h"" i . . . . . . . . . . . . i
. . . . . . . . . . . . . . . . . . . . . . i ! ,
50 100 Downstream IXmHIon (mm)
150
1000
900
~. 800'
700" 3
600- E $ 500-
400
30O
200 200
n. T e s t 103 ( 1 9 7 7 )
' I - - T E S T 1,1 O, (1977) - - .
i , 4- i ÷
- - - - i . . . . . i . . . .
i I
i
5O 100 150 D o w n s t r e a m pooit lon (ram)
+r~vX A
200
o . T e s t 1 0 5 ( 1 9 7 7 ) p. T e s t I I 0 ( 1 9 7 7 )
F i g u r e 10. C o n U n u e d .
]> m o -.4 ~u ¢o

1100
1000
900
G 800
I 700
J 600 ~¢ 500
400
300
200
i j ) - - TEST 111, (1977) i
. . . . . . I ~ i I
i ÷ . . . . . . . . . . .
50 100 150 200 Downstream posnlon (ram)
~ A
lO0O
900-
~. 800
700
I 6o6
J 500
400
300
2OO 0
m T E S T I ]
114, (1977) J
l
/ / " 1
/
/ ,< ~ ^
i I
50 100 150 Downstream IXmWon (mm)
200
> m
'-4 ,:p (¢1 . A
O's 1000
900'
800
i 700 '
600
500
400
500
200
q. Tes t 1 ! ! 0 9 7 7 )
i I , - - TEST 115 , ( 1 9 7 7 ) ooo-
', I ] - - - s o o
] ~ 4- T ¥ 700
i . . .-~ i ] i 6o0 I , l E i J ~ f i
/ ~ r ................. ............... - 500
.... ~ 400
/ " J 300
; 200 50 100 150 200
Dowrmtream po~ l i on (ram)
r. Test 114 (1977}
i - - TEST 11'6, (1977) / x ~
f
j / , / ,
. I
50 100 150 Downstream p o t i o n (ram)
200
s. Tes t 115 0 9 7 7 ) t. Test 116 (1977)
F igure 10. Cont inued .

IOOOi i ~ "x ' Iooo /
900 TEST117,(1977) .......... ~ t ~ o , ~ x 9oo l / , • J x x I x
l '~ i ~ x,~ x l ~ 8ooi ~ t-~ .... I ~
' I _, .............. ÷ ............... -) s00 . . . . . . . . . . . . . . . . h ............ ~ . . . . . . - / / . . . _ j ~ , , ' __ ~ TEST 1191 (1977)
I / i i . e Coo,..*
200 1 [ ] ] / , o o , , , , ,i , * , 0 50 100 150 200 0 50 100 150 200
Downstrmmm IXmition (mm) Downstream po~ l lon (mm)
u. Test 117 (1977) v. Test 119 (1977)
1100] i / i ~ i lxl 1°°° 1 ' / : i l OOO~ ........................... ~ - - - / ~ ..................... ~ . . . . ~ - ~ . . . . . . . . 9 o o ~ - - - - ' . / - . - ~ .............
9 O O l - - ................ / - - ........... ~ - ~ - + ~ - - ~ ~ , o o . . . . . ~ ~ ~ - - - . : - - - - - ~ -
; ~ ÷ = ÷ I - - / i - ~ * ~ ÷ x , i -= 700 .... -~ T ........................... ~ . . . .
i ' J ~ " ' ' " o o k - / - - i , i ..... soo J [ ~ .................... ~ TEST 1 2 0 , ( 1 9 7 7 ) J - soo I ~ - - i i TEST 122, (1977)
soo ............... ~..._.i ................... i- He Coolant ~ I / " ! He Coolant
400 • ! i j
3oo V ~ '= J 30O 0 50 100 1 S0 200 0 S0 100 150 200
Downstream posit ion (ram) Downmream posit ion (mm)
w. Test 120 (1977) x . Test 122 (1977)
Figure 10. Concluded.
m
- I

O0
A
V
r -
(n
(1,1 ; t.
O t--
E} O
Q
,,,Q 1
-100
t i i O
i r- i
i n i
i i
0 50 100 150 200
Fc (kN/m3} Figure 11. Correlation of turn turbulence with centrifugal parameter.
250
0
I--1
3OO
m
n -4 ,= CD
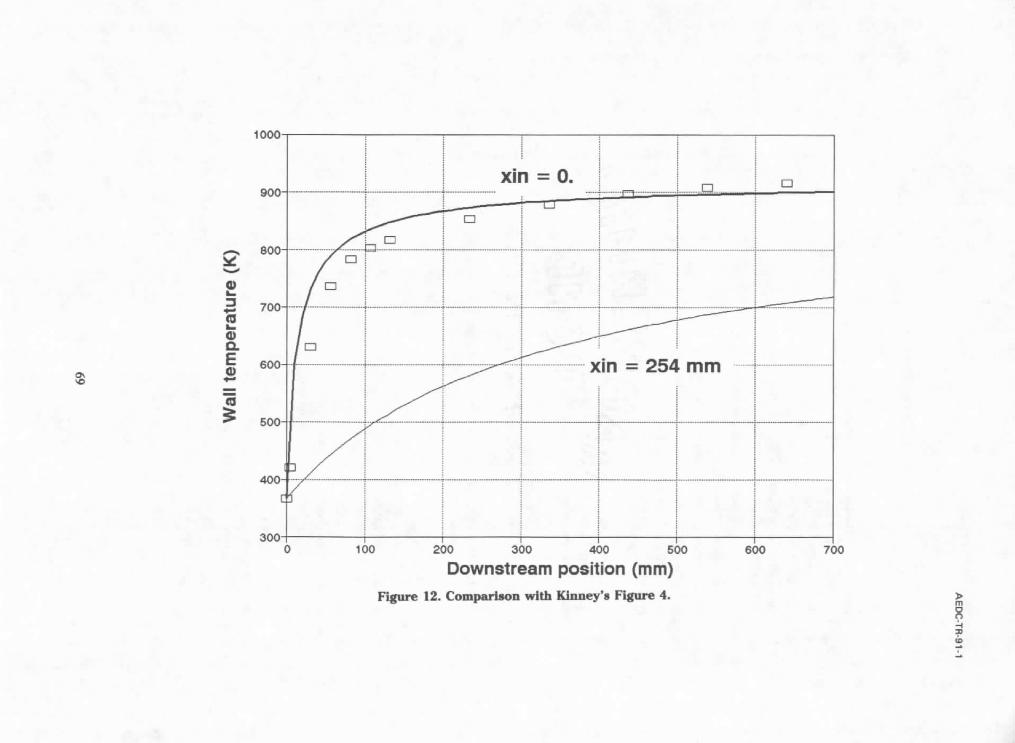
300
/ D
r-I
x i n = 0.
f O
r-I
xin = 2 5 4 m m
D
Downstream position (ram)
Figure 12. Comparison with Kinney's Figure 4.
0 100 200 300 400 500 600 700
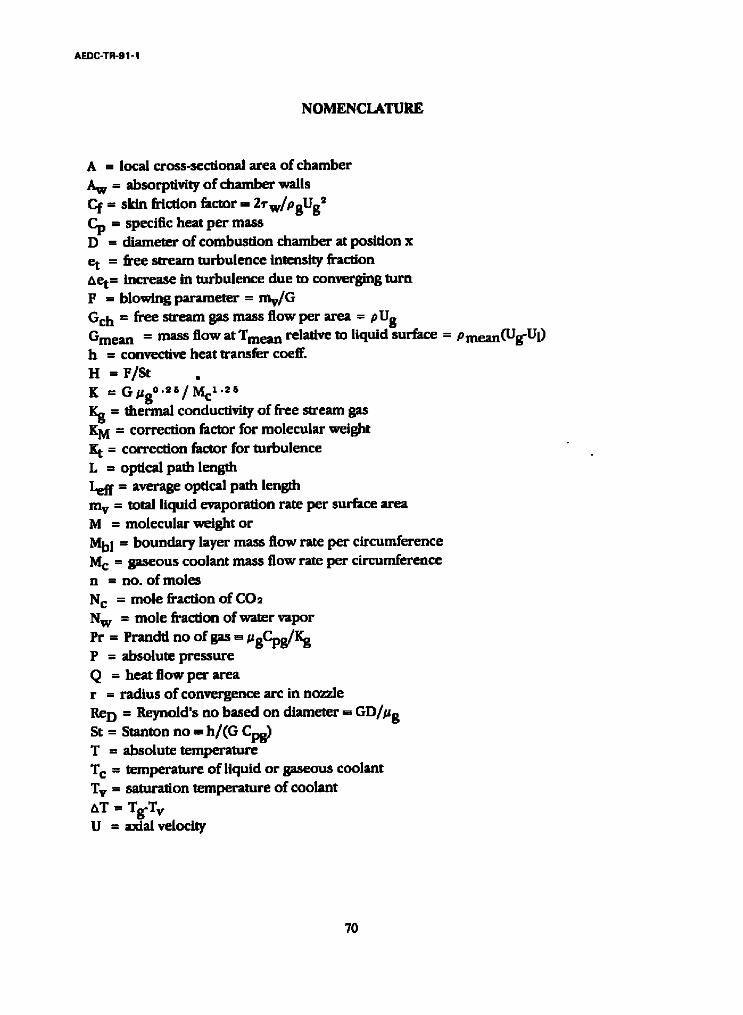
A E D C - T R - 9 1 - !
NOMENCLATURE
A = local cross-sec'donal area o f chamber
A w = absorp~vity o f chamber walls
Cf = skin friction factor -- 2~w/ogUg ~
Cp -- specific heat per mass
D = diameter of combustion chamber at position x
e t = free stream turbulence intensity fraction
aet= increase in turbulence due to converging turn
F = blowing parameter = mv/G
Gch = free stream gas mass flow per area = pUg
Gmean = mass flow at Tmean relative to liquid surface = pmeanCUg-U l)
h = convective heat transfer coeff.
rI = F / S t . K = G p g ° ' 2 S / i c t ' 2 s Kg = thermal conductivity o f free stream gas
K M = cor rec t ion factor for molecular weight
K t = cor rec t ion factor for tu rbu lence
L = optical path length
L e f t = average optical path length
m v = total l iquid evaporat ion rate pe r surface area
M = molecu la r weight o r
Mbl = b o u n d a r y layer mass flow rate pe r c i rcumference
M c = gaseous coolant mass flow rate pe r c i rcumference
n = no. o f m o l e s
N c = mole fraction o f CO2
N w = mole fraction o f water vapor
Pr = Prandfl no o f gas =/JgCpg/Kg
P = absolute p ressure
Q = heat f low pe r area
r = radius o f convergence arc in nozzle
Re D = Reynold 's no based on diameter = GD//~g
St = 5tanton no - h / ( G Cpg)
T = absolute t empera tu re
T c = t empera tu re o f liquid o r gaseous coolant
T v = saturation t empera tu re o f coolant
AT = T Tv
U = axial velocity
"t0

AEDC-TR-91-1
x = d is tance f r o m inject ion po in t (a long c o n t o u r )
x e = x c o r r e c t e d for deve lop ing p ipe f low
X ffi d imens ion l e s s dis tance = K x
y ffi d i s tance f r o m wall
Greek Symbo l s -
-t = C p / C v = specific hea t rat io
6 = b o u n d a r y layer th ickness
e = gas emissivity
= film coo l i ng effect iveness
F = l iquid c o o l a n t mass f low rate p e r c i r c u m f e r e n c e
X = latent hea t o f vapor iza t ion o f coo lan t
* = X + CplCrv-Tc)
# = d y n a m i c viscosi ty
p = mass dens i ty
P o p t = optical dens i ty -- P L
o = sur face t ens ion o f coo lan t o r S tephan ' s const .
s u b s c r i p t s :
aw - adiabatic wall
bl - b o u n d a r y layer
bo - b u r n o u t p o i n t
c - coolant , Olquid o r gaseous )
ch - va lues in cyl indrical c h a m b e r sect ion
c o n y - convect ive
c r - at t rans i t ion to "large waves"
g - f ree su ' eam gas
I - l iquid coo lan t
m e a n - m e a n t e m p e r a t u r e be tween free s t ream gas and l iquid
o - fo r "dry-wall" condi t ions , w i thou t t ransp i ra t ion
t a d - d u e m rad ia t ion
u p - u p s t r e a m
v - v a p o r
w - eva lua ted at wall
71