Embed Size (px)
Citation preview
HAL Id: hal-01223545https://hal.archives-ouvertes.fr/hal-01223545
Submitted on 11 Jan 2017
HAL is a multi-disciplinary open accessarchive for the deposit and dissemination of sci-entific research documents, whether they are pub-lished or not. The documents may come fromteaching and research institutions in France orabroad, or from public or private research centers.
L’archive ouverte pluridisciplinaire HAL, estdestinée au dépôt et à la diffusion de documentsscientifiques de niveau recherche, publiés ou non,émanant des établissements d’enseignement et derecherche français ou étrangers, des laboratoirespublics ou privés.
Liquid clustering and capillary pressure in granularmedia
Jean-Yves Delenne, Vincent Richefeu, Farhang Radjai
To cite this version:Jean-Yves Delenne, Vincent Richefeu, Farhang Radjai. Liquid clustering and capillary pressure ingranular media. Journal of Fluid Mechanics, Cambridge University Press (CUP), 2015, 762, 10 p.�10.1017/jfm.2014.676�. �hal-01223545�
Liquid clustering and capillary pressure ingranular media
Jean-Yves Delenne1,†, Vincent Richefeu2 and Farhang Radjai3,4
1Ingénierie des Agropolymères et Technologies Emergentes IATE, UMR 1208 INRA – CIRAD –Montpellier Supagro – Université Montpellier 2, 2 place Pierre Viala, 34060 CEDEX, Montpellier, France2Laboratoire Sols, Solides, Structures, Risques 3SR, UMR 5521 CNRS – UJF Grenoble 1 –Grenoble
INP, 38041 CEDEX 9, Grenoble, France3Laboratoire de Mécanique et Génie Civil LMGC, UMR 5508 Université Montpellier 2 – CNRS, 34095 Montpellier, France4MultiScale Material Science for Energy and Environment, UMI 3466 CNRS-MIT, DCEE, Massachusetts Institute of Technology, 77 Massachusetts Avenue, Cambridge, CA 02139, USA
By means of extensive lattice Boltzmann simulations, we investigate the processof growth and coalescence of liquid clusters in a granular material as the amountof liquid increases. A homogeneous grain–liquid mixture is obtained by means ofcapillary condensation, thus providing meaningful statistics on the liquid distributioninside the granular material. The tensile stress carried by the grains as a functionof the amount of condensed liquid reveals four distinct states, with a peak stressoccurring at the transition from a primary coalescence process, where the cohesivestrength is carried mostly by the grains, to a secondary process governed by theincrease of the liquid cluster volumes. We show that the evolution of capillary statesis correctly captured by a simple model accounting for the competing effects of theLaplace pressure and grain–liquid interface.
Key words: complex fluids, granular media
1. Introduction
Water and granular solids are the most common forms of matter on Earth and yetwe have hardly begun to understand how they mix and behave together (Fraysse,Thomé & Petit 1999; Iverson et al. 2000; Mitarai & Nori 2006; Pailha, Nicolas &Pouliquen 2008; Lu, Godt & Wu 2010; Topin et al. 2012). In particular, partiallywetted granular materials have remained largely unexplored due to the intricatetexturing of water in the pore space (Scheel et al. 2008) in spite of its crucial
† Email address for correspondence: [email protected]
cohesive effect in many natural and industrial processes such as slope stability by vegetation due to the hydro-mechanical properties of the root–soil matrix (Ghestem, Sidle & Stokes 2011), pollution transport above the phreatic zone where water is retained by capillary forces, wet mixing and agglomeration of ores and powders (Bocquet et al. 1998; Forrest et al. 2002; Litster & Ennis 2004; Ruiz et al. 2011).
Wet granular materials are classically characterized by the relation between the amount of water S, defined a s t he r atio o f l iquid v olume t o t he p ore s pace volume,and the difference δp = pa − p` between air pressure pa and the negative Laplace pressure p` of the liquid, which controls the cohesive strength of the material (Mitchell & Soga 2005; Pakpour et al. 2012). However, nearly all work accomplished in this field i s b ased o n m easurements a nd p henomenological m odels i nvolving t he c hoice of an ‘effective stress’ accounting for capillary stresses. A particle-based approach was recently pioneered in tomographic studies of the morphology of liquid clusters in the pore space for granular samples mixed with a certain amount of liquid (Scheel et al. 2008). The authors evidenced the ramified s tructure o f t he l iquid a nd t he coalescence of liquid clusters as S was increased from the pendular regime, where the liquid is in the form of capillary bridges joining pairs of grains, into the funicular regime, where liquid clusters joining several grains and/or filling t he p ores prevail.
In this paper, we are interested in the distribution of liquid in a granular material and its relationship with capillary stresses as the liquid fills t he p ore s pace gradually and homogeneously. Due to thermodynamic quasi-equilibrium, capillary condensation with periodic boundary conditions provides ideally homogeneous conditions for the distribution of liquid at the sample scale, yielding thus meaningful statistics on the connectivity of liquid clusters and local grain environments for an arbitrary amount of liquid. We used a multiphase lattice Boltzmann model (LBM) to simulate the condensation of liquid inside a packing of disks from a vapour phase and thusgradual filling o f t he p ore s pace f rom a d ry s tate (S = 0 ) t owards a f ully saturated state (S = 1) (Shan & Chen 1993; Nicos & Hudong 1996; He & Doolen 2002; Sukop & Or 2004). After a brief description of the simulated system, we analyse below the connectivity of the liquid phase, Laplace pressure and grain stresses as a function of the amount of condensed liquid.
2. System description
The granular samples are prepared by isotropic compaction of 1000 disks with afriction coefficient o f µ = 0 .1 s imulated b y t he m olecular d ynamics m ethod i nside a biperiodic cell (Radjai & Dubois 2011). The particles have a uniform size distributionby volume fraction with a ratio of 3 between the largest and smallest diameters. Thisdistribution is broad enough to prevent local crystallization (Voivret et al. 2007). Theresulting static configurations h ave a p acking f raction o f 0.82.
The capillary condensation is initiated by setting the temperature to T = 0.7Tc, where Tc is the triple point temperature, and a uniform fluid d ensity ( see Appendix).After a transient in the range S < 0.02, a quasi-equilibrium state is reached with a uniform injection of fluid a t a c onstant r ate i n t he p ore s pace, l eading t o continuouscondensation of liquid between the particles. The relative vapour pressure pv/psat,
inwhere
our psat issimulations
the sa wasturation
δS 2pressure,
10−is
6 'per0.45
timeduring
step.this
Thisprocess.
rate isThe
lowinjection
enough ratefor' ×
chemical equilibrium to be satisfied w ith a g ood p recision e verywhere i nside t he porespace. In all simulations reported in this paper, the surface tension (line tension in 2D with the unit of a force) of the solid–vapour interface is equal to that of the

(a) (b)
(c) (d )
FIGURE 1. Four snapshots of liquid clusters with increasing amounts of liquid.
liquid–vapour interface, γ , and the solid–liquid surface tension is zero, so that thecontact angle between the liquid and the grains is zero. It should be noted that thecalculations were conducted by assuming that the grains are immobile. In practice,this implies that the confining pressure is high compared with the capillary stressso that the condition of force balance on each grain remains satisfied as normaland tangential forces evolve. The condensation dynamics is a complex process. Thevapour does not condense directly into the contact zones. Instead, liquid clustersappear first on the grains or in the pores between grains, and then are drained intothe contact zones. Video samples of the simulations analysed below can be found atwww.cgp-gateway.org/ref023.
Figure 1 displays four snapshots of liquid clusters with increasing S. At low S,the liquid is distributed in the form of bridges holding the particles together at theircontact points. In this ‘pendular’ state, each bridge connects only two particles andhence its effect is fully captured by an attraction force depending on the distancebetween two particles (Israelachvili 1993; Willett et al. 2000; Fournier et al. 2005;Richefeu, El Youssoufi & Radjai 2006; Gilabert, Roux & Castellanos 2008; Radjaï& Richefeu 2009; Richefeu et al. 2009). As S increases, the liquid bridges grow andevolve into clusters connected to several particles. This process may be statisticallycharacterized by the number Cm of liquid clusters connected to m particles. In thesame way, the grain environments can be described by the number Pn of grains

0.5
0
1.0
1.5
2.0
0.2
0
0.4
0.6
0.8
1.0
0.2
0
0.4
0.6
0.8
1.0
0 0.2 0.4 0.6 0.8 1.0 0 0.2 0.4 0.6 0.8 1.0 0 0.2 0.4 0.6 0.8 1.0
0 0.4
0.01
0.1
1
0.84
5
(a) (b) (c)
FIGURE 2. (a) The number Cm of liquid clusters of order m and the total number Cof clusters normalized by the number Np of particles. The inset shows the same data inlinear-log representation with the same axis labels. (b) The number Pn of grains connectedto n liquid clusters normalized by Np. (c) The volume Vmax
` of the largest liquid clusternormalized by the total volume Vpores of the pore space, as a function of the amount ofliquid S. The error bars represent the standard deviation over 10 independent simulationruns.
connected to n distinct liquid clusters. We refer below to m as the order of a clusterand to n as the wet connectivity of a grain.
3. Cluster statistics
Figure 2(a) shows Cm normalized by the total number Np of particles for differentvalues of m. Initially, in the pendular state, the wet coordination number is givenby z = 2C2/Np. As capillary condensation proceeds, C2 increases slightly due tothe creation of new liquid bridges, whereas the existing bridges grow. A transitionoccurs to the funicular state at S' 0.15, where clusters of order 3 are born from thecoalescence of adjacent binary bridges. As a result, C2 begins to decline only whenC3 sets out to increase. The inset of figure 2(a) in linear-log scale reveals a cascadingbirth process of clusters of higher order from the lower-order clusters.
It is remarkable that the volume Vmax` of the largest cluster during this primary
coalescence process remains quite small, as we can see in figure 2(c). This indicatesthat the interconnection of binary bridges occurs in different parts of the sample,where the local porosity is lower, and nearly all clusters have hollow cores filled bythe vapour, as observed in figure 1(b). It should be noted that for all values of S,as shown in figure 1, the radii of curvature are nearly the same in different parts ofthe system, indicating that the system is very close to equilibrium. Nevertheless, aswe shall see below, small variations of curvature exist and they are reflected in thedistribution of liquid pressures.
The volume of the largest cluster sets out to increase considerably only at S' 0.4,when a secondary coalescence process begins in which the existing clusters mergewith each other by a fast reduction of hollow cores. This process leads to thepercolation of the liquid phase at S ' 0.6, with a sharp increase of Vmax
` . Thistransition shows the highly nonlinear character of the pore-wetting process due togeneric granular disorder despite homogeneous condensation. At this point, largeclusters embed many particles and they are mainly separated by strings of vapourbubbles, as shown in figure 3. After the transition, the liquid phase belongs mostlyto the largest liquid cluster and we have Vmax
` /Vpores ' S.
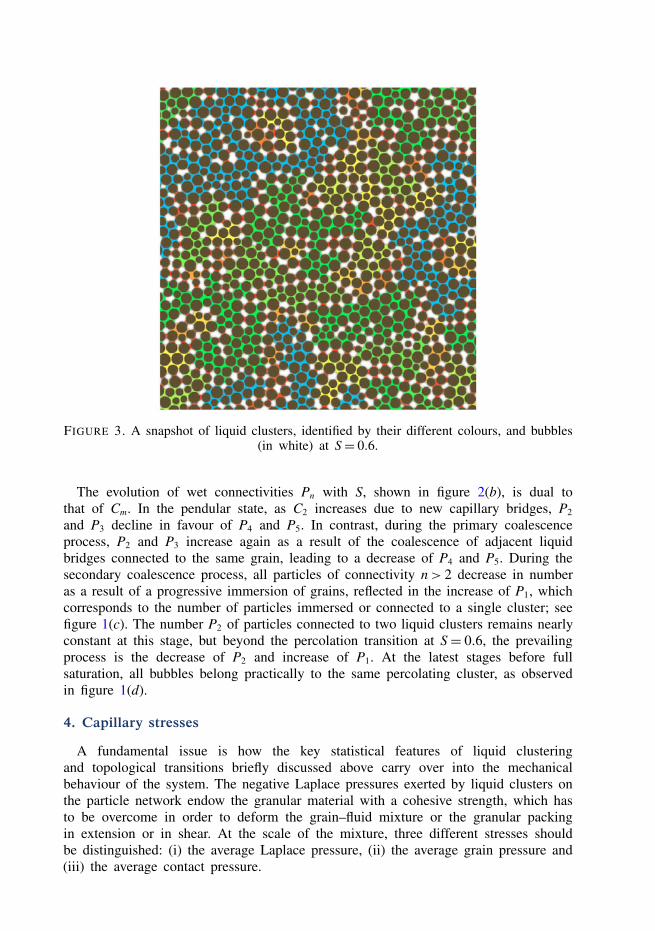
FIGURE 3. A snapshot of liquid clusters, identified by their different colours, and bubbles(in white) at S= 0.6.
The evolution of wet connectivities Pn with S, shown in figure 2(b), is dual tothat of Cm. In the pendular state, as C2 increases due to new capillary bridges, P2
and P3 decline in favour of P4 and P5. In contrast, during the primary coalescenceprocess, P2 and P3 increase again as a result of the coalescence of adjacent liquidbridges connected to the same grain, leading to a decrease of P4 and P5. During thesecondary coalescence process, all particles of connectivity n> 2 decrease in numberas a result of a progressive immersion of grains, reflected in the increase of P1, whichcorresponds to the number of particles immersed or connected to a single cluster; seefigure 1(c). The number P2 of particles connected to two liquid clusters remains nearlyconstant at this stage, but beyond the percolation transition at S= 0.6, the prevailingprocess is the decrease of P2 and increase of P1. At the latest stages before fullsaturation, all bubbles belong practically to the same percolating cluster, as observedin figure 1(d).
4. Capillary stresses
A fundamental issue is how the key statistical features of liquid clusteringand topological transitions briefly discussed above carry over into the mechanicalbehaviour of the system. The negative Laplace pressures exerted by liquid clusters onthe particle network endow the granular material with a cohesive strength, which hasto be overcome in order to deform the grain–fluid mixture or the granular packingin extension or in shear. At the scale of the mixture, three different stresses shouldbe distinguished: (i) the average Laplace pressure, (ii) the average grain pressure and(iii) the average contact pressure.
0.2
0
0.4
0.6
0.8
1.0
0 0.2 0.4 0.6 0.8 1.00 0.2 0.4 0.6 0.8 1.0 0 0.2 0.4 0.6 0.8 1.0
1
0
2
3
4
5
6
5
0
10
15
20
25
30
35
0.1
0
0.2
0.3
0 5 10 15 20
(a) (b) (c)
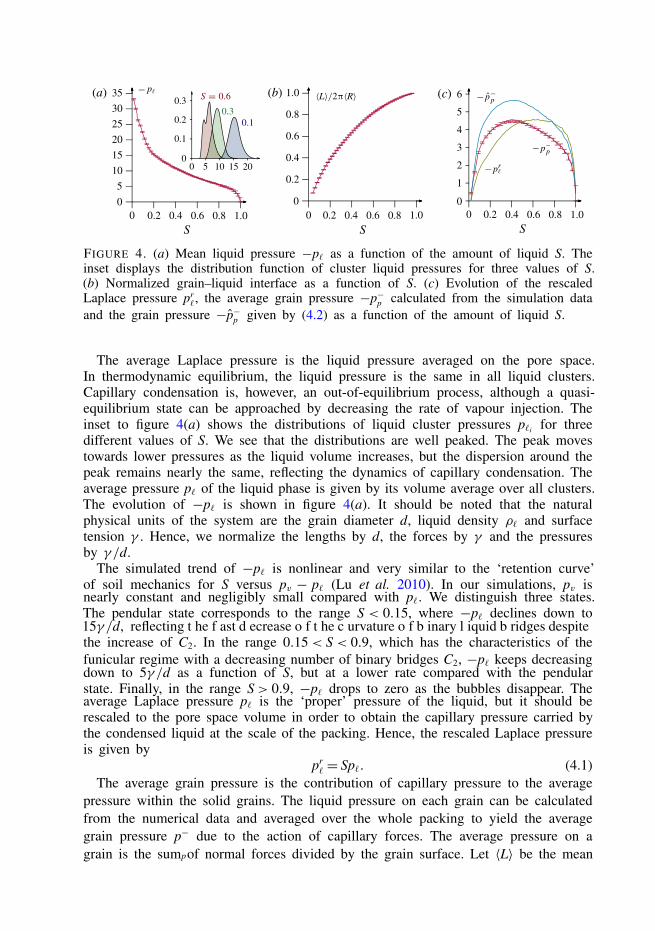
FIGURE 4. (a) Mean liquid pressure −p` as a function of the amount of liquid S. Theinset displays the distribution function of cluster liquid pressures for three values of S.(b) Normalized grain–liquid interface as a function of S. (c) Evolution of the rescaledLaplace pressure pr
`, the average grain pressure −p−p calculated from the simulation dataand the grain pressure −p̂−p given by (4.2) as a function of the amount of liquid S.
The average Laplace pressure is the liquid pressure averaged on the pore space.In thermodynamic equilibrium, the liquid pressure is the same in all liquid clusters.Capillary condensation is, however, an out-of-equilibrium process, although a quasi-equilibrium state can be approached by decreasing the rate of vapour injection. Theinset to figure 4(a) shows the distributions of liquid cluster pressures p`i for threedifferent values of S. We see that the distributions are well peaked. The peak movestowards lower pressures as the liquid volume increases, but the dispersion around thepeak remains nearly the same, reflecting the dynamics of capillary condensation. Theaverage pressure p` of the liquid phase is given by its volume average over all clusters.The evolution of −p` is shown in figure 4(a). It should be noted that the naturalphysical units of the system are the grain diameter d, liquid density ρ` and surfacetension γ . Hence, we normalize the lengths by d, the forces by γ and the pressuresby γ /d.
The simulated trend of −p` is nonlinear and very similar to the ‘retention curve’soil mechanics for S versus p p (Lu et al. 2010). In our simulations, p is
p
of v − ` v nearly constant and negligibly small compared with p`. We distinguish three states.The pendular state corresponds to the range S < 0.15, where −p` declines down to 15γ /d, reflecting t he f ast d ecrease o f t he c urvature o f b inary l iquid b ridges despitethe increase of C2. In the range 0.15 < S < 0.9, which has the characteristics of thefunicular regime with a decreasing number of binary bridges C2, −p` keeps decreasing down to 5γ /d as a function of S, but at a lower rate compared with the pendularstate. Finally, in the range S > 0.9, −p` drops to zero as the bubbles disappear. The average Laplace pressure p` is the ‘proper’ pressure of the liquid, but it should berescaled to the pore space volume in order to obtain the capillary pressure carried bythe condensed liquid at the scale of the packing. Hence, the rescaled Laplace pressure is given by
pr` = Sp`. (4.1)
The average grain pressure is the contribution of capillary pressure to the average pressure within the solid grains. The liquid pressure on each grain can be calculated from the numerical data and averaged over the whole packing to yield the average grain pressure p− due to the action of capillary forces. The average pressure on agrain is the sum of normal forces divided by the grain surface. Let 〈L〉 be the mean
grain–liquid interface per grain. Then, the average normal force of the liquid on agrain of mean radius 〈R〉 is p`〈L〉 and the average pressure is given by p`〈L〉/(2π〈R〉). This is a mean over the total volume of the grains and thus should be multiplied bythe packing fraction φp to obtain the average grain pressure at the scale of the packing:
p̂−p =〈L〉
2π〈R〉φp p`. (4.2)
The average contact pressure is a fraction of the average grain stress supportedby the contact network. For example, if all grains are fully immersed in the liquidphase, we have 〈L〉 = 2π〈R〉 and according to (4.2) the grain stress is simply equalto p`φp. This is the stress transmitted through the grains although, since all grainsare fully immersed, the contact forces and hence the stress transmitted through thecontact network are not affected. The grain pressure is therefore an upper boundon the average contact pressure induced by capillary forces and which defines thecapillary cohesion of the packing. In our simulations, the grains are assumed to beimmobile and hence we do not have direct access to the tensile strength.
Figure 4(c) displays the rescaled Laplace pressure pr`, the average grain pressure
−p−p calculated from the simulation data at the grain–liquid interface and theexpression −p̂−p given by (4.2) as a function of S. It is remarkable that, up to afactor 0.8 which may be attributed to size polydispersity, the evolution of −p−p issimilar to that of −p̂−p . Four different states can clearly be distinguished. The pendularstate is marked here by an increase of −p−p from zero to '3γ /d in the range S= 0.02to S' 0.15. In the second state, the pressure keeps increasing at a lower rate in therange S ' 0.15 to S ' 0.4 where the peak value '4γ /d of −p− is reached. Thisrange coincides with the primary coalescence process. Beyond the stress peak fromS' 0.4 to S' 0.9, the stress declines down to a value slightly below that of the endof the pendular state. Finally, in the bubble state, the grain pressure vanishes due tothe fast decrease of the liquid pressure.
The success of the expression (4.2) in predicting correctly (up to a factor closeto one) the evolution of tensile strength indicates that the above states reflect thecompeting effects of the falloff of Laplace pressure −p` shown in figure 4(a) and theincrease of the grain–liquid interface 〈L〉 shown in figure 4(b). For example, in thependular state the strength increases due to the fast increase of 〈L〉 despite decreasingLaplace pressure −p`. The modest increase of strength in the primary coalescenceprocess, which may also be described as the ‘early’ funicular state, may be understoodas a consequence of a lower rate of decrease of the Laplace pressure in this range.Beyond the peak, i.e. in the ‘late’ funicular state, the falloff of −p` prevails comparedwith the increase of 〈L〉, and hence the tensile strength declines.
It is also remarkable that the rescaled liquid pressure −pr` reflects the four regimes
of capillary strength, with the same peak value reached at S= 0.4 both in the liquidphase and in the grains. However, in contrast to −p−p , which declines after the peak,−pr
` remains at the same value until S = 0.9, where it drops to zero. Hence, belowS' 0.4, the capillary stress is mainly transmitted by the grain phase. At S' 0.4, partof the capillary pressure is transferred from the grains to the liquid, which carriesthereafter a larger stress.
In practice, the cohesive strength of unsaturated granular media is difficult tomeasure since it requires the stress to be applied only on the granular phase. Thereare, however, few studies of capillary strength in granular materials. Our results arequite close to the soil mechanics picture of the evolution of capillary strength under
wetting or drying conditions (Lu et al. 2010), but they contrast with those of Scheel et al. (2008), who found a constant value of the strength beyond the pendular state, explained by a constant value of the Laplace pressure and wetted surface as the amount of liquid increased beyond the pendular state. This discrepancy may be a consequence of the distribution of water, which was obtained by mixing the particles with water in the experiments and by capillary condensation in our simulations.
5. Conclusion
Perhaps the most important finding o f t his w ork i s t hat a p eak g rain pressure induced by capillary forces in a granular packing occurs inside the funicular state and it represents the transition from a primary coalescence process, where the volume of the largest cluster remains small, to a secondary coalescence process governed by the increase of liquid cluster volumes carrying a larger capillary stress. The evolution of this stress with the amount of liquid suggests that, besides the Laplace pressure, at least one internal variable pertaining to the connectivity of the liquid phase or its interface with the particle phase is required to describe the mechanical state of a wet granular material.
Let us point out here that the simulations and data processing were made possible due to the 2D geometry of the system and periodic boundary conditions. Despite demanding computational resources, similar simulations are necessary in 3D in order to investigate the effect of the geometry of the pore space. However, we do not expect a qualitative change of the physical picture. In this respect, the expression (4.2) is straightforward to extend to three dimensions by replacing the solid–liquid interfacelength 〈L〉 by the solid–liquid average area and the grain perimeter 2π〈R〉 by the grain surface. Another important step for simulations is the evaluation of capillary cohesion from the contact forces, which requires the grains to be free to move.
We would also like to emphasize again that capillary condensation was used in this work as a means to obtain homogeneous mixing of a liquid with grains for meaningful statistics of liquid distribution and to reach arbitrary states of saturation. Under normal conditions, our results may be applied to a packing of nanoparticles, in which capillary condensation can lead to gradual filling o f t he w hole p ore s pace b y l iquid. However, the findings of t his paper apply more generally t o a rbitrary grain–liquid mixtures, with the advantage of highlighting a homogeneous distribution, which can be considered as a reference system for comparison with less homogeneous mixtures obtained by direct mixing of a liquid with grains.
Appendix
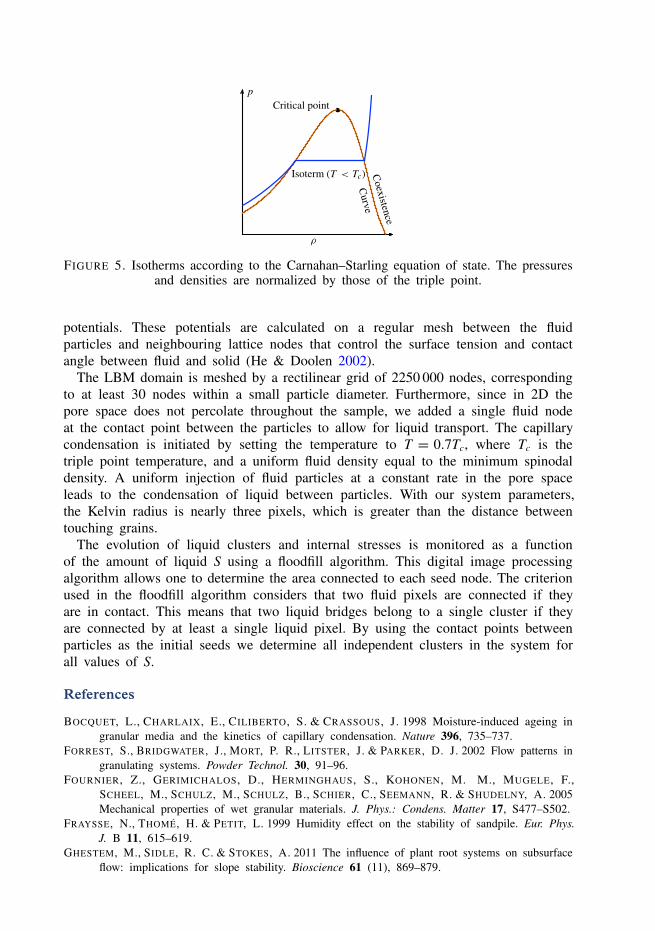
Partially saturated states in a granular material involve three phases: solid particles, liquid and gas. Hence, a numerical or theoretical model requires three ingredients:(i) granular dynamics, (ii) Navier–Stokes equations for the liquid and (iii) thermo-dynamics of gas–liquid phase transition (including surface tension). The fluid is simulated by means of the LBM, which consists in discretizing the Boltzmann equation (Succi 2001) in the phase space and time using a finite d ifference scheme. The collision operator in our simulations is based on a single relaxation time, which can be shown to be equivalent to the Navier–Stokes equations in the limit of small Mach numbers. The thermodynamics of phase change (Swift et al. 1996; He & Doolen 2002; Yuan & Schaefer 2006) is based on the Carnahan–Starling equation of state (Kupershtokh, Medvedev & Karpov 2009) shown in figure 5. The interactions between liquid, gas and solid (grains) are derived using non-local
pCritical point
Coexistence
Curve
Isoterm
FIGURE 5. Isotherms according to the Carnahan–Starling equation of state. The pressuresand densities are normalized by those of the triple point.
potentials. These potentials are calculated on a regular mesh between the fluidparticles and neighbouring lattice nodes that control the surface tension and contactangle between fluid and solid (He & Doolen 2002).
The LBM domain is meshed by a rectilinear grid of 2250 000 nodes, correspondingto at least 30 nodes within a small particle diameter. Furthermore, since in 2D thepore space does not percolate throughout the sample, we added a single fluid nodeat the contact point between the particles to allow for liquid transport. The capillarycondensation is initiated by setting the temperature to T = 0.7Tc, where Tc is thetriple point temperature, and a uniform fluid density equal to the minimum spinodaldensity. A uniform injection of fluid particles at a constant rate in the pore spaceleads to the condensation of liquid between particles. With our system parameters,the Kelvin radius is nearly three pixels, which is greater than the distance betweentouching grains.
The evolution of liquid clusters and internal stresses is monitored as a functionof the amount of liquid S using a floodfill algorithm. This digital image processingalgorithm allows one to determine the area connected to each seed node. The criterionused in the floodfill algorithm considers that two fluid pixels are connected if theyare in contact. This means that two liquid bridges belong to a single cluster if theyare connected by at least a single liquid pixel. By using the contact points betweenparticles as the initial seeds we determine all independent clusters in the system forall values of S.
References
BOCQUET, L., CHARLAIX, E., CILIBERTO, S. & CRASSOUS, J. 1998 Moisture-induced ageing ingranular media and the kinetics of capillary condensation. Nature 396, 735–737.
FORREST, S., BRIDGWATER, J., MORT, P. R., LITSTER, J. & PARKER, D. J. 2002 Flow patterns ingranulating systems. Powder Technol. 30, 91–96.
FOURNIER, Z., GERIMICHALOS, D., HERMINGHAUS, S., KOHONEN, M. M., MUGELE, F.,SCHEEL, M., SCHULZ, M., SCHULZ, B., SCHIER, C., SEEMANN, R. & SHUDELNY, A. 2005Mechanical properties of wet granular materials. J. Phys.: Condens. Matter 17, S477–S502.
FRAYSSE, N., THOMÉ, H. & PETIT, L. 1999 Humidity effect on the stability of sandpile. Eur. Phys.J. B 11, 615–619.
GHESTEM, M., SIDLE, R. C. & STOKES, A. 2011 The influence of plant root systems on subsurfaceflow: implications for slope stability. Bioscience 61 (11), 869–879.

GILABERT, F. A., ROUX, J.-N. & CASTELLANOS, A. 2008 Computer simulation of model cohesivepowders: plastic consolidation, structural changes and elasticity under isotropic loads. Phys. Rev. E 78, 031305.
HE, X. & DOOLEN, G. D. 2002 Thermodynamic foundations of kinetic theory and lattice Boltzmannmodels for multiphase flows. J . S tat. P hys. 1 07, 309–328.
ISRAELACHVILI, J. N. 1993 Intermolecular and Surface Forces. Academic.IVERSON, R. M., REID, M. E., IVERSON, N. R., LAHUSEN, R. G., LOGAN, M., MANN, J. E. &
BRIEN, D. L. 2000 Acute sensitivity of landslide rates to initial soil porosity. Science 290 (5491), 513–516.
KUPERSHTOKH, A. L., MEDVEDEV, D. A. & KARPOV, D. I. 2009 On equations of state in a latticeBoltzmann method. Comput. Maths Applics. 58 (5), 965–974.
LITSTER, J. & ENNIS, B. 2004 The Science and Engineering of Granulation Process. KluwerAcademic.
LU, N., GODT, J. W. & WU, D. T. 2010 A closed form equation for effective stress in unsaturatedsoil. Water Resour. Res. 46, W05515.
MITARAI, N. & NORI, F. 2006 Wet granular materials. Adv. Phys. 55 (1–2), 1–45.MITCHELL, J. K. & SOGA, K. 2005 Fundamentals of Soil Behavior. Wiley.NICOS, M. & HUDONG, CHEN 1996 Simulation of multicomponent fluids i n c omplex three-dimensional
geometries by the lattice Boltzmann method. Phys. Rev. E 53 (1), 743–750.PAILHA, M., NICOLAS, M. & POULIQUEN, O. 2008 Initiation of underwater granular avalanches:
influence o f t he i nitial v olume f raction. P hys. F luids 2 0, 111701.PAKPOUR, M., HABIBI, M, MØLLER, P. & BONN, D. 2012 How to construct the perfect sandcastle.
Sci. Rep. 2, 549.RADJAI, F. & DUBOIS, F. 2011 Discrete-Element Modeling of Granular Materials. Wiley. RADJAÏ, F. & RICHEFEU, V. 2009 Bond anisotropy and cohesion of wet granular materials. Phil.
Trans. R. Soc. A 367, 5123–5138.RICHEFEU, V., EL YOUSSOUFI, M. S. & RADJAI, F. 2006 Shear strength properties of wet granular
materials. Phys. Rev. E 73 (5), 051304.RICHEFEU, V., EL YOUSSOUFI, S., AZÉMA, E. & RADJAI, F. 2009 Force distribution in cohesive
and non cohesive granular media. Powder Technol. 190, 258263.RUIZ, T., RONDET, E., DELALONDE, M. & DESFOURS, J. P. 2011 Hydro-textural and consistency
surface states of humid granular media. Powder Technol. 208 (2), 409–416.SCHEEL, M., SEEMANN, R., BRINKMANN, M., DI MICHIEL, M., SHEPPARD, A., BREIDENBACH,
B. & HERMINGHAUS, S. 2008 Morphological clues to wet granular pile stability. Nat. Mater.7 (3), 189–193.
SHAN, X. & CHEN, H. 1993 Lattice Boltzmann model for simulating flows with multiple phasesand components. Phys. Rev. E 47, 1815–1819.
SUCCI, S. 2001 The Lattice Boltzmann Equation for Fluid Dynamics and Beyond. Clarendon.SUKOP, M. C. & OR, D. 2004 Lattice Boltzmann method for modeling liquid–vapor interface
configurations in porous media. Water Resour. Res. 40, W01509.SWIFT, M. R., ORLANDINI, E., OSBORN, W. R. & YEOMANS, J. M. 1996 Lattice Boltzmann
simulations of liquid–gas and binary fluid systems. Phys. Rev. E 54 (5), 5041–5052.TOPIN, V., MONERIE, Y., PERALES, F. & RADJAI, F. 2012 Collapse dynamics and runout of dense
granular materials in a fluid. Phys. Rev. Lett. 109, 188001.VOIVRET, C., RADJAÏ, F., DELENNE, J.-Y. & EL YOUSSOUFI, M. S. 2007 Space-filling properties
of polydisperse granular media. Phys. Rev. E 76, 021301.WILLETT, C., ADANS, M., JOHNSON, S. & SEVILLE, J. 2000 Capillary bridges between two spherical
bodies. Langmuir 16, 9396–9405.YUAN, P. & SCHAEFER, L. 2006 Equations of state in a lattice Boltzmann model. Phys. Fluids 18,
042101.


![Entropy clustering-based granular classifiers for network ......the expression (6). [Step 3] Calculate the decision function of the support vector machine according to the expression](https://img.pdfslide.us/doc/110x75/610d3adb3a85a1580d2ec5ad/entropy-clustering-based-granular-classifiers-for-network-the-expression.jpg)
![Index [researchonline.jcu.edu.au]...Cantilever sheet piles, 385-395 in cohesive :3-oiis, 393-395 in granular s.oils, 386-393 hortzontal bading, 225. 226 Capillary effects, 68-69. 70](https://img.pdfslide.us/doc/110x75/5e83cbc841712f77af2c376b/index-cantilever-sheet-piles-385-395-in-cohesive-3-oiis-393-395-in-granular.jpg)


![Capillary interaction in wet granular assemblies: Part 2 · terized by increasing saturation: pendular, funicular, capillary and slurry [26, 45]. The pendular state is characterized](https://img.pdfslide.us/doc/110x75/5f706940207dc95a941b8cb6/capillary-interaction-in-wet-granular-assemblies-part-2-terized-by-increasing-saturation.jpg)

![Capillary thermostatting in capillary electrophoresis · Capillary thermostatting in capillary electrophoresis ... 75 µm BF 3 Injection: ... 25-µm id BF 5 capillary. Voltage [kV]](https://img.pdfslide.us/doc/110x75/5c176ff509d3f27a578bf33a/capillary-thermostatting-in-capillary-electrophoresis-capillary-thermostatting.jpg)