Embed Size (px)
Citation preview

1
femtosecond crystallography1. In contrast, the closely related lipidic sponge phase (LSP), made by mixing monoolein and water with a third agent such as je�amine or PEG that swells the cubic phase into a liquid phase6,8, can be adapted to serial femtosecond crystallography7,9.. LSP crystallization was origi-nally developed from the observation that the LCP crystalliza-tion of the Rhodobacter sphaeroides reaction center proceeded via an LSP8. Four independent LSP membrane protein structures have been reported to date (Supplementary Table 1); it appears likely that crystals used for determining the structures of several G protein–coupled receptors and one bacterial oxidase grew via a cubic-to-sponge-phase transition (Supplementary Note), and an LSP crystallization screen gave leads from 8 of 11 membrane proteins tested10. In this work we adapted the LSP crystal-lization to yield showers of membrane protein microcrystals that we injected across an X-ray free electron beam using micro-jet technology2. From the di�raction data we recovered a new crystal form of the Bl. viridis photosynthetic reaction center (RCvir) solved using serial femtosecond crystallography.
For batch LSP crystallization experiments we modi�ed earlier hanging-drop conditions11 (Online Methods): we dispen.sed as 250 μl aliquots in septum-sealed glass vials (Fig. 1a). Because the sponge phase is less dense than water, it spontaneously separates8, with the LSP �oating on the top (Fig. 1a). We used optical microscopy to identify crystallization conditions under which showers of microcrystals grew in the LSP over 2 weeks (Fig. 1b) and used cross-polarization analysis to .con�rm their ordered nature through birefringence (Supplementary Fig. 1). We shipped these sealed glass vials at room temperature to the Linac Coherent Light Source (LCLS) at SLAC National Laboratory, USA. We collected the colored upper phase (Fig. 1a) and removed large crystals that could potentially block the micro-jet by passing the LSP through a 10-μm-cuto� metal �lter (Online Methods and Supplementary Fig. 2). We injected these suspensions as a rapidly �owing liquid micro-jet2
Q3Q3
Q4
Q5
Lipidic phase membrane protein serial femtosecond crystallography
A full list of authors and a�liations appears at the end of the paper.
PUBLISHED ONLINE 29 Jan 2012 DOI :10.1038/nmeth.1859
X-ray free electron laser (X- FEL)-based serial femtosecond crystallography is an emerging method with potential to rapidly advance the challenging field of membrane protein structural biology. Here we recorded interpretable di�raction data from micrometer-sized lipidic sponge phase crystals of the Blastochloris viridis photosynthetic reaction center delivered into an X- FEL beam using a sponge phase micro-jet.
Studyi.ng membrane proteins remains a major challenge for struc-tural biologists. �ese proteins contain hydrophobic and hydrophilic surfaces, are typically scarce and highly �exible, frequently become unstable when removed from their natural membrane environment and are usually di�cult to grow into large, well-ordered crystals suitable for conventional crystallography. Serial femtosecond crys-tallography1, which allows X-ray di�raction data to be recorded from thousands of sub-micrometer– to micrometer-sized crystals, holds great promise for the structural analysis of membrane pro-teins. �is emerging method has been �rst demonstrated 1 using sub-micrometer crystals of cyanobacterial photosystem I (PSI) delivered to the X-ray beam using a thin liquid jet2. PSI, which is a large membrane protein complex, is exceptional in that it crystal-lizes overnight at low ionic strength3 (8 mM MgSO4). More rep-resentative membrane protein crystallization conditions involve higher concentrations of salt (typically 50–300 mM) and polyeth-ylene glycol (PEG; typically 10–35%), which pose challenges for micro-jet injection owing to higher viscosity and the risk that salt crystals or aggregates may clog the micro jet nozzle.
Lipidic cubic phase (LCP) crystallization of membrane pro-teins4–6 is a generic crystallization method developed to mimic the natural lipid bilayer of membrane proteins and thereby enhance their stability during crystallization. In the original formulation5, solubilized membrane proteins were �rst mixed with the lipid monoolein in the ratio 60:40 to form the semisolid LCP, to which crystallization agents were then added. LCP crystallization rapidly led to X-ray structures of archaeal rhodopsins6 and more recently structures of G protein–coupled receptors7 (Supplementary Note and Supplementary Table 1).
Because of its semisolid nature, the LCP does not readily form a micrometer-sized jet required to deliver microcrystals in serial
Q2
a b
10 mm 20 μm
Figure 1 | LSP batch crystallization of RCvir. ( a) A 250- μl batch-crystallization setup in a glass vial with the sponge phase containing RCvir (brown) �oating on top. ( b) Optical microscopy image of the sponge phase showing crystals. Larger crystals are ~20 μm long.

across a focused X-FEL beam12. �e sponge phase (Fig. 1a) readily �owed at a rate similar to that of water (10 μl min−1) and produced a stable jet ~4 μm in diameter (Fig. 2a). Because the diameter of this jet was of the same order of magnitude as that of the RCvir
.microcrystals, the LSP provided a low-background environ-ment for serial femtosecond crystallography.
We collected di�raction data at the Atomic Molecular and Optical (AMO) beamline13 of the LCLS on the Center for Free-Electron Laser Science Advanced Study Group multipur-pose chamber (CAMP) p.-n junction charge-coupled devices9 (pnCCDs) with two vertically o�set panels that we read out at 60 Hz, which was the repetition rate of the FEL X-ray pulses. Each X-FEL pulse was nominally 70 fs in duration and contained up to 1013 2-keV X-rays .((λ) = 6.17 Å) focused into a 10 μm2 spot. �e maximum resolution accessible with this energy and detector geometry was 7.4 Å, and reaction center microcrystals repeat-edly di�racted to this resolution limit (Fig. 2b). Of the 365,035 recorded frames (~100 min of data collection), we observed 1,542 di�raction patterns of which we processed 265 in the space group P212121 (Fig. 2c) with unit cell axes a = 57.6 Å, b = 84.6 Å, c = 375.8 Å and α = β = γ = 90° (Supplementary Fig. 3), repre-senting a new crystal form of RCvir.
As we processed 265 di�raction patterns from 365,035 images, the hit rate was below 0.1%, approximately an order of magnitude lower than that obtained for PSI1. A probable explanation for this di�erence is that the RCvir microcrystals tended to have a high
Q6
Q7Q7
Q8Q8
Q9Q9
mosaic spread (Supplementary Fig. 4), which, in combination with one cell axis being longer than 300 Å, made data-processing challenging. Because we grew PSI microcrystals overnight on-site at the LCLS1, it is reasonable to expect that the quality of RCvir microcrystals would improve if long-distance shipping at room temperature could be avoided. Further improvements include more robust di�raction-spot �nding and indexing routines and changes in crystallization conditions to maximize the number of di�racting microcrystals.
We processed these di�raction data using Monte Carlo meth-ods14,15 because each di�raction pattern recorded only partial re�ections from randomly oriented microcrystals. We summa-rize the crystallographic data recovered from this analysis in Supplementary Table 2 and provide crystallographic statistics for each resolution shell in Supplementary Table 3. �e best molecu-lar replacement solution (Online Methods) showed the crystals to pack as stacked layers of 2D crystals typically found in lipidic phase crystallization6 (Supplementary Fig. 5). During struc-tural re�nement we cut the di�raction data to 8.2 Å resolution for which the multiplicity was greater than 4 and completeness was above 95% (Supplementary Table 3). Structural re�nement yielded Rfactor
.and Rfree values of 35% and 38%, respectively (Supplementary Table 2; in Supplementary Table 4 we provide a breakdown by resolution shell) and both the 2Fobs − Fcalc electron density map (Fig. 3a) and composite omit map (Supplementary Fig. 6) clearly indicated transmembrane α helices. Moreover, when we removed all four heme groups of the RCvir cytochrome subunit from the structural model, we recovered positive Fobs − Fcalc electron density associated with each of these cofactors in the resulting omit map (Fig. 3b and Supplementary Fig. 7).
We also recovered well-performing micro-jets using LSPs derived from monoolein, water and PEG 400, PEG 1500 or PEG 4000 (Supplementary Fig. 8). As je�amine and PEG conditions form the basis of a validated LSP crystallization screen10, and PEG 400 has been a crystallization agent in all recent LCP crys-tal structures of G-protein–coupled receptors (Supplementary Table 1), the adaption of LSP crystallization to serial femtosecond crystallography appears promising for solving membrane protein targets of unknown structure.
Shorter X-ray wavelength beamlines (λ of ~1.5 Å) and higher repetition rates (120 Hz) have recently become available at the LCLS. As such, high-resolution membrane protein crystal struc-tures should soon be achievable using X-FEL radiation. We esti-mate that an order of 10,000 processed di�raction images will be
Q10Q10
a
200 μm
b cFigure 2 | Serial femtosecond crystallography of RCvir crystals grown in a LSP. (a) Liquid jet formed by the sponge phase containing RCvir crystals. The X-FEL beam interacting with the liquid jet is visible as a white �uorescent spot (white arrow). ( b) Bragg di�raction spots (dark spots) recorded from a single RCvir crystal using a single X-FEL pulse of 70 fs. ( c) An identical di�raction image as shown in b but with the predicted spot positions after data indexing shown as circles. The resolution was limited to 7.4 Å in the corners of the lower pnCCD detector panel.
a
b
Figure 3 | Electron density for the LSP serial femtosecond crystallography RCvir structure at 8.2 Å resolution. ( a) Stereo view of the 2m Fobs − DFcalc electron density map (contoured at 1.0 σ) recovered from 265 processed RCvir di�raction images. ( b) Stereo view of the mFobs − DFcalc omit electron density map (contoured at 2.0 σ), calculated with the four heme groups of the cytochrome subunit removed from the structural model. This �gure was generated with Pymol (DeLano Scienti�c LLC).
Q20Q20

3
needed for high-resolution electron density maps to be recovered using serial femtosecond crystallography, which would require three 12-h shi�s at the hit rate reported here. Nevertheless, because we solved the structure of RCvir to 8.2 Å resolution by molecular replacement with only 265 processed images, this bodes well for future applications of lipidic phase serial femtosecond crystallography to membrane protein structural biology.
METHODSMethods and any associated references are available in the online version of the paper at http://www.nature.com/naturemethods/.
Accession codes. Protein Data Bank: 4ac5.
Note: Supplementary information is available at the end of this article.
ACKNOWLEDGMENTSExperiments were carried out at the LCLS, a national user facility operated by Stanford University on behalf of the US Department of Energy, O�ce of Basic Energy Sciences. We acknowledge �nancial support from the Swedish Science Research Council ( ), the Swedish Foundation for International Cooperation in Research and Higher Education ( ), Stiftelsen Olle Engkvist Byggmästare, the Max Planck Society for funding the development and operation of the CAMP instrument, the US National Science Foundation grant MCB 0919195, the US Department of Energy O�ce of Basic Energy Sciences through the Photon Ultrafast Laser Science and Engineering Center Institute at the SLAC National Accelerator Laboratory and the Energy Frontier Research Center for Bio-Inspired Solar Fuel Production (award DE-SC0001016), the Hamburg Ministry of Science and Research and Joachim Herz Stiftung as part of the Hamburg Initiative for Excellence in Research ( ) and the Hamburg School for Structure and Dynamics in Infection, National Science Foundation (awards 0417142 and MCB-1021557), US National Institutes of Health (awards 1R01GM095583-01 and 1U54GM094625-01), the Deutsche Forschungsgemeinschaft Cluster of Excellence at the Munich Center for Advanced Photonics, Center for Biophotonics Science and Technology at the University of California (cooperative agreement PHY 0120999).
AUTHOR CONTRIBUTIONSL.C.J., R.N., H.N.C., J.C.H.S. and P.F. conceived the experiment, which was designed with A.B., R.A.K., J.C.H.S., D.P.D., U.W., R.B.D., M.J.B., D.S., I.S., S.M.
Q14Q14
Q15Q15Q16Q16
Q17Q17Q18Q18
and J.H. S.W.E., R.H., D.R., A.R., C .Sch, L.F., N.K., P.H., B.R., B.E., A.H., Ch.R., D.P., G.W., L.S., G.H., H.G., J.U., I.S., S.H., G.Sch., F.Sch., H.S., K.-UK, R.A., K.-D.S., F.K., Ma.B., S.Sch., D.Ru., M.A., T.G., H.H., L.G., G.P., H.G. and B.N. designed and set up the CAMP instrument and/or developed and operated the pnCCD detectors. C.B. and J.D.B. set up and aligned the beamline; L.C.J. and D.A. grew sponge phase crystals; U.W., R.B.D., J.C.H.S., D.P.D., R.L.S. and L.L. designed and operated the injector; H.N.C., A.B., A.A., J.S., D.P.D., U.W., R.B.D., S.B., M.J.B., L.G., J.H., M.M.S., N.T., J.A., S.S. and J.C.H.S. developed di�raction instrumentation; L.C.J., D.A., T.A.W., D.P.D., U.W., R.B.D., R.L.S., L.L., E.M., J.D., K.N., M.L., A.A., M.B., A.B., M.J.B., C.B., J.D.B., C.C., R.C., N.C., T.E., H.F., P.F., C.Y.H., J.M.H., M.S.H., S.K., R.A.K., F.R.N.C.M., A.V.M., I.S., M.M.S., R.G.S., F.S., N.T., X.W., C.W., H.N.C., J.C.H.S. and R.N. collected data; L.C.J., D.A., T.A.W., G.K., W.Y.W. and K.N. analyzed the di�raction data using software developed by J.C.H.S., T.A.W., R.A.K., A.B. and H.N.C.; L.C.J. and R.N. wrote the paper with discussion and improvements from all authors.
1. Chapman, H.N. et al. Nature 470 , 73–77 (2011).2. DePonte, D.P. et al. J. Phys. D Appl. Phys. 41, 195505 (2008).3. Jordan, P. et al. Nature 411 , 909–917 (2001).4. Landau, E.M. & Rosenbusch, J.P. Proc. Natl. Acad. Sci. USA 93 ,
14532–14535 (1996).5. Ca�rey, M. Annu. Rev. Biophys. 38 , 29–51 (2009).6. Johansson, L.C., Wohri, A.B., Katona, G., Engstrom, S. & Neutze, R. Curr.
Opin. Struct. Biol. 19, 372–378 (2009).7. Rosenbaum, D.M., Rasmussen, S.G. & Kobilka, B.K. Nature 459 , 356–363
(2009).8. Wadsten, P. et al. J. Mol. Biol. 364 , 44–53 (2006).9. Strüder, L. et al. Nucl. Instrum. Methods Phys. Res. A 614, 483–496
(2010).10. Wöhri, A.B. et al. Structure 16, 1003–1009 (2008).11. Wohri, A.B. et al. Biochemistry 48 , 9831–9838 (2009).12. Emma, P. et al. Nat. Photonics 4, 641–647 (2010).13. Bozek, J.D. Eur. Phys. J. Spec. Top. 169 , 129–132 (2009).14. Kirian, R.A. et al. Opt. Express 18, 5713–5723 (2010).15. Kirian, R.A. et al. Acta Crystallogr. A 67 , 131–140 (2011).
Q24Q24Q22Q22 Q23Q23
Q19Q19
Linda C Johansson1, David Arnlund1, �omas A White2, Gergely Katona1, Daniel P DePonte2, Uwe Weierstall3, R Bruce Doak3, Robert L Shoeman4, Lukas Lomb4, Erik Malmerberg1, Jan Davidsson5, Karol Nass6, Mengning Liang2, Jakob Andreasson7, Andrew Aquila2, Saša Bajt2, Miriam Barthelmess8, Anton Barty2, Michael J Bogan9, Christoph Bostedt10, John D Bozek10, Carl Caleman2, Ryan Co�ee10, Nicola Coppola2,18, Tomas Ekeberg7, Sascha W Epp11,12, Benjamin Erk11,12, Holger Fleckenstein2, Lutz Foucar4,11, Heinz Graafsma8, Lars Gumprecht2, Janos Hajdu7, Christina Y Hampton9, Robert Hartmann13, Andreas Hartmann13, Günter Hauser14, Helmut Hirsemann8, Peter Holl13, James M Holton15, Mark S Hunter16, Stephan Kassemeyer4, Nils Kimmel14, Richard A Kirian3, Filipe R N C Maia15, Stefano Marchesini15, Andrew V Martin2, Christian Reich13, Daniel Rolles4,11, Benedikt Rudek11,12, Artem Rudenko11,12, Ilme Schlichting4,11, Joachim Schulz2, M Marvin Seibert7,18, Raymond G Sierra9, Heike Soltau13, Dimitri Starodub9, Francesco Stellato2, Stephan Stern2, Lothar Strüder11,14, Nicusor Timneanu7, Joachim Ullrich11,12, Weixiao Y Wahlgren1, Xiaoyu Wang3, Georg Weidenspointner14,17, Cornelia Wunderer8, Petra Fromme16, Henry N Chapman2,6, John C H Spence3 & Richard Neutze1Q1Q1
1Department of Chemistry and Molecular Biology, University of Gothenburg, Gothenburg, Sweden. 2Center for Free-Electron Laser Science, Deutsches Elektronen-Synchrotron, Hamburg, Germany. 3Department of Physics, Arizona State University, Tempe, Arizona, USA. 4Max-Planck-Institut für Medizinische Forschung, Heidelberg, Germany. 5Department of Photochemistry and Molecular Science, Uppsala University, Uppsala, Sweden. 6University of Hamburg, Hamburg, Germany. 7Laboratory of Molecular Biophysics, Department of Cell and Molecular Biology, Uppsala University, Uppsala, Sweden. 8Photon Science, Deutsches Elektronen-Synchrotron, Hamburg, Germany. 9Photon Ultrafast Laser Science and Engineering Center Institute, Stanford Linear Accelerator Center (SLAC) National Accelerator Laboratory, Menlo Park, California, USA. 10Linac Coherent Light Source, SLAC National Accelerator Laboratory, Menlo Park, California, USA. 11Max Planck Advanced Study Group, Center for Free Electron Laser Science, Hamburg, Germany. 12Max-Planck-Institut für Kernphysik, Heidelberg, Germany. 13PNSensor GmbH, München, Germany. 14Max-Planck-Institut Halbleiterlabor, München, Germany. 15Advanced Light Source, Lawrence Berkeley National Laboratory, Berkeley, California, USA. 16Department of Chemistry and Biochemistry, Arizona State University, Tempe, Arizona, USA. 17Max-Planck-Institut für extraterrestrische Physik, Garching, Germany. 18Present addresses: European XFEL GmbH, Hamburg, Germany (N.C.) and Linac Coherent Light Source, SLAC National Accelerator Laboratory, Menlo Park, California, USA (M.M.S.). Correspondence should be addressed to R.N. ([email protected]).
Q25Q25

4
ONLINE METHODSGrowth and puri�cation of reaction center from Bl. viridis. We cultivated the photosynthetic reaction center from Bl. viridis as described11. We modi�ed the puri�cation by using 250 ml POROS 50 micron .HQ media (Applied Biosystems Europe BV) packed in an XK 50/20 column (GE Healthcare) and a HiPrep 26/60 Sephacryl S-300 column (GE Healthcare). �is protocol yielded ~3 mg of pure RCvir per liter of cell culture.
Lipidic sponge phase batch crystallization. We prepared LSPs as previously described11. We set up batch crystallizations in septum-sealed glass vials (Sigma-Aldrich) containing 100 μl protein (20–30 mg ml−1), 100 μl LSP (12% monoolein, 17.5% je�amine M-600, 1.0 M Hepes (pH 8.0), 0.7 M (NH4)2SO4 and 2.5% 1,2,3-heptanetriol) and 50 μl of 1.0–1.2 M trisodium citrate. �ese setups were le� to equilibrate for 2–4 weeks at 20 °C. We diluted crystals 4:1 in a solution containing 0.1 M Hepes (pH 8.0), 0.1.% (LDAO) before �ltering in a 10-μm-cuto� titanium �lter (VICI AG International). We developed the conditions for large-batch crystallization setups by initially screening for batch crystalliza-tion conditions using smaller batch crystallization volumes (60 μl to 100 μl setups).
Liquid microjet. We delivered samples to the injector nozzle via a sample loop, and we injected these into the X-FEL beam at a �ow rate of 10 μl min−1. �e liquid capillary of the nozzle had an inner diameter of 50 μm and the liquid was focused by coaxially �owing helium gas to a continuous jet-stream of ~4 μm diameter2. We aligned the X-ray beam to hit the liquid in the continuous jet region before the breakup into droplets occurred (Fig. 2a). For PEG-based LSPs, we required an inner diameter of 100 μm for the jet to �ow (Supplementary Fig. 8). �ese LSPs consisted of 40% PEG 400, PEG 1500 or PEG 4000 mixed with 30% Monoolein and 30% bu�er (0.1 M Hepes, pH 8.0, 0.1 M NaCl and 0.1 M MgCl2).
Data collection. We collected di�raction data at the atomic molecular and optical (AMO) beamline at the Linac Coherent Light Source13 using the CAMP instrument9. We recorded di�rac-tion data on two 76.8 mm by 38.4 mm pnCCDs located 64.7 mm and 67.7 mm from the sample position. �e pnCCDs we o�set asymmetrically such that X-ray di�raction was sampled from 3.5° to 49.0°, which maximized the sampled resolution (7.4 Å at the outer corners; Fig. 2b). �e X-ray wavelength at AMO was 6.17 Å, and we focused the beam to a 10 μm2 spot.
Data processing. We processed di�raction data using in-house code that called DirAx16 and MOSFLM17 for automated indexing1. We indexed data from 265 di�raction images in P212121 with unit cell axes a = 57.6 Å, b = 84.6 Å, c = 375.8 Å and α = β = γ = 90°. We did not observe subpopulations of other crystal forms (Supplementary Fig. 3). Small variations in the length of the c axis, however, arose perhaps owing to pulse-to-pulse �uctuations in the X-FEL wavelength. Because every observation is a partial re�ection, we scaled and merged this integrated data using Monte
Q11Q11
Q12Q12
Carlo methods14,15. We estimated I/σ values for each resolution bin (Supplementary Table 3) from re�ections with both positive intensity and a multiplicity higher than 1. NZ-test and L-test plots showed the expected distributions (Supplementary Fig. 9).
Molecular replacement and re�nement. We obtained phases by molecular replacement using Phaser18 2.3.0 with PDB entry 2WJN11 as the search model. �e best solution had a transla -tion function Z score (TFZ) of 8.5, the rotation function Z score (RFZ) of 5.8, and a log likelihood gain (LLG) of 81. �is was well discriminated from second best solution with scores of TFZ, 4.6; RFZ, 5.8; and LLG, 39. We evaluated the crystal packing and con�rmed that only the best molecular replacement solution was physically meaningful. We performed 20 cycles of rigid body and restrained re�nement using REFMAC19, converging to Rfactor = 35% and Rfree = 38%, and an overall �gure of merit of 0.62. During re�nement we used simple Wilson scaling and a constant den-sity (using default values) we assigned to the region of the unit cell not occupied by protein atoms. We calculated the solvent mask using default parameters: increase van der Waals radius of non-ion atoms by 1.2 Å, increase ionic radius of potential ions by 0.8 Å, shrink the area of the mask by 0.8 Å a�er calculation. Crystallographic data statistics are summarized in Supplementary Table 2, and resolution shell breakdowns of the crystallographic data and re�nement statistics are given in Supplementary Tables 3 and 4, respectively.
Control map calculations. We performed test calculations using two control datasets: one with the serial femtosecond crystallography data randomly shu�ed and another where all observations were set equal. Molecular replacement failed with both control datasets. When we combined the phases generated using the molecular replacement solution recovered against the experimental data with these control datasets, the result-ing electron density maps did not show α-helical structure (Supplementary Fig. 10).
Omit map calculations. We calculated Fobs − Fcalc omit electron density maps using REFMAC19 with all four hemes of the cyto-chrome subunit removed from the structural model (Fig. 3b and Supplementary Fig. 7).
Composite omit map calculations. We calculated composite omit electron density maps (Supplementary Fig. 6) using .(CNS)20,21 version 1.3 with ~5% of the structure excluded, no simulated annealing, no minimization and no bulk-solvent correction.
Q13Q13
16. Duisenberg, A.J.M. J. Appl. Cryst. 25, 92–96 (1992 ).17. Leslie, A.G.W. Joint CCP4 and ESF-EAMCB Newsletter on Protein
Crystallography 26 (1992).18. McCoy, A.J. et al. J. Appl. Cryst. 40, 658–674 (2007).19. Murshudov, G.N., Vagin, A.A. & Dodson, E.J. Acta Crystallogr. D53 ,
240–255 (1997).20. Brunger, A.T. et al. Acta Crystallogr. D Biol. Crystallogr. 54 , 905–921
(1998).21. Brunger, A.T. Nat. Protoc. 2, 2728–2733 (2007).
Q21Q21

Nature Methods
In vivo protein crystallization opens new routes in structural biology Rudolf Koopmann, Karolina Cupelli, Lars Redecke, Karol Nass, Daniel DePonte, Thomas A White,
Francesco Stellato, Dirk Rehders, Mengning Liang, Jakob Andreasson, Andrew Aquila, Sasa Bajt, Miriam
Barthelmess, Anton Barty, Michael J Bogan, Christoph Bostedt, Sébastien Boutet, John D Bozek, Carl
Caleman, Nicola Coppola, Jan Davidsson, R Bruce Doak, Tomas Ekeberg, Sascha W Epp, Benjamin Erk,
Holger Fleckenstein, Lutz Foucar, Heinz Graafsma, Lars Gumprecht, Janos Hajdu, Christina Y Hampton,
Andreas Hartmann, Robert Hartmann, Günter Hauser, Helmut Hirsemann, Peter Holl, Mark S Hunter,
Stephan Kassemeyer, Nils Kimmel, Richard A Kirian, Lukas Lomb, Filipe R N C Maia, Andrew V Martin,
Marc Messerschmidt, Christian Reich, Daniel Rolles, Benedikt Rudek, Artem Rudenko, Ilme Schlichting,
Joachim Schulz, M Marvin Seibert, Robert L Shoeman, Raymond G Sierra, Heike Soltau, Stephan Stern,
Lothar Strüder, Nicusor Timneanu, Joachim Ullrich, Xiaoyu Wang, Georg Weidenspointner, Uwe
Weierstall, Garth J Williams, Cornelia Wunderer, Petra Fromme, John C H Spence, Thilo Stehle, Henry N
Chapman, Christian Betzel & Michael Duszenko
Supplementary Figure 1 Characterization of TbCatB isolated from in vivo crystals. Supplementary Figure 2 Experimental setup of serial femtosecond crystallography at LCLS. Supplementary Figure 3 Quality measures of TbCatB diffraction dataset obtained at LCLS. Supplementary Table 1 Diffraction data statistics by resolution shell.
Supplementary Table 2 Data collection and refinement statistics for re-crystallized TbCatB analyzed at SLS.
Supplementary Table 3 Electron and photon beam parameters for SFX experiment at LCLS. Supplementary Note
Nature Methods: doi:10.1038/nmeth.1859

Supplementary Figure 1
Characterization of TbCatB isolated from in vivo crystals.
Supplementary Figure 1: Characterization of TbCatB isolated from in vivo crystals. (a)
Western blot analysis: 1, commercial Cathepsin B from Bos Taurus; 2, TbCatB solubilised
from isolated in vivo crystals; (b) Specific activity of TbCatB solubilised from isolated in vivo
crystals. Different amounts of TbCatB were tested using a commercial CatB activity assay
(online methods). As a control, enzyme activity was analyzed in the presence of 50 M CatB
specific inhibitor as well as after boiling the enzyme solution for 5 min. (c) Deglycosylation of
solubilised TbCatB using different amounts of PNGase F (15 % SDS gel, silver staining).
Nature Methods: doi:10.1038/nmeth.1859

Supplementary Figure 2
Experimental setup of serial femtosecond crystallography at LCLS
Supplementary Figure 2: Experimental setup of serial femtosecond crystallography at LCLS.
Each single 70 fs X-ray pulse focussed to 2.5 3 m2 at the FWHM hits the 4 m diameter
water jet containing the in vivo crystals injected perpendicular to the FEL beam. The
diffraction pattern of each single crystal was recorded by a high frame rate pnCCD detector1
operating at the 60 Hz repetition rate of the X-ray pulses.
Nature Methods: doi:10.1038/nmeth.1859
Supplementary Figure 3
Quality measures of TbCatB diffraction dataset obtained at LCLS
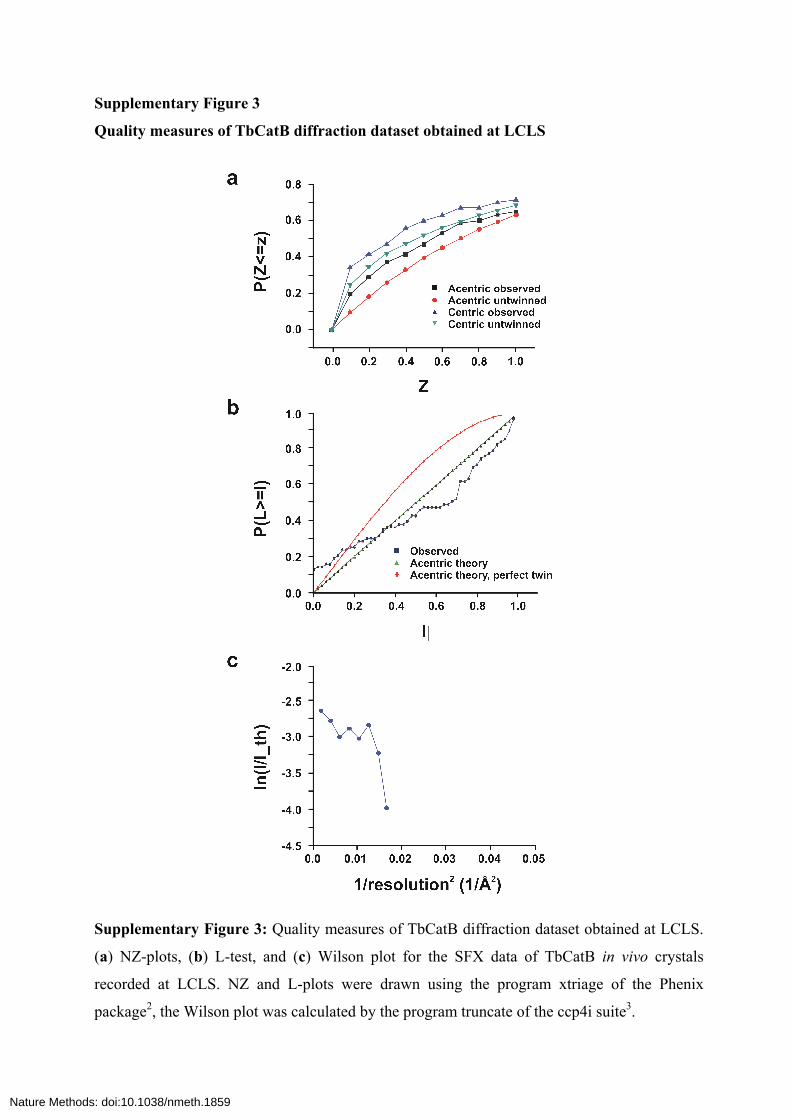
Supplementary Figure 3: Quality measures of TbCatB diffraction dataset obtained at LCLS.
(a) NZ-plots, (b) L-test, and (c) Wilson plot for the SFX data of TbCatB in vivo crystals
recorded at LCLS. NZ and L-plots were drawn using the program xtriage of the Phenix
package2, the Wilson plot was calculated by the program truncate of the ccp4i suite3.
Nature Methods: doi:10.1038/nmeth.1859

Supplementary Table 1: Quality indicators for the resolution shells of the partial dataset
collected from TbCatB in vivo crystals using the SFX method at LCLS.
Resolution shell (Å)
No. of unique reflections
Multiplicity Completeness
(%) Merged
I/
43.468-15.748 63 11.9 88.3 7.06
15.748-12.600 66 18.2 95.6 2.35
12.600-11.037 67 27.0 97.1 2.44
11.037-10.042 56 19.0 87.1 2.45
10.042-9.329 59 18.1 91.2 2.10
9.329-8.784 55 15.1 90.4 1.98
8.784-8.348 49 10.8 82.3 1.88
8.348-7.986 52 11.3 83.8 1.81
7.986-7.681 37 4.2 80.4 0.75
7.681-7.417 16 1.6 37.0 1.36
Total 514 13.72 83.3 2.63
Nature Methods: doi:10.1038/nmeth.1859

Supplementary Table 2: X-ray data collection and refinement statistics for re-crystallized
TbCatB analyzed at the Swiss Light Source (SLS).
Data collection
Space group P21
Cell dimensions
a, b, c (Å) 53.91, 75.49, 75.60
α, β, γ () 90.0, 104.8, 90.0
Resolution (Å) 48.7 - 2.55 (2.62 - 2.55)
Rmeas 15.3 (47.2)
I/I 8.60 (2.69)
Completeness (%) 97.2 (98.4)
Redundancy 2.2 (2.1)
Refinement
Resolution (Å) 48.0 - 2.55
No. reflections 17,772
Rwork / Rfree 20.2 / 24.3
No. atoms
Protein 4,020
Carbohydrate 56
Water 54
B-factors (Å2)
Protein 10.1
Carbohydrate 25.3
Water 21.5
R.m.s. deviations
Bond lengths (Å) 0.006
Bond angles () 0.600
Values in parentheses refer to the highest resolution shell.
Nature Methods: doi:10.1038/nmeth.1859

Supplementary Table 3: Electron and photon beam parameters for SFX experiment of
TbCatB in vivo crystals at LCLS.
Parameter Mean Standard deviation
Electron energy [MeV]a 6,710.8 8.4
Number of electronsa 1.56 e09 2.99 e07
Charge [nC]a 0.249 0.005
Peak current after second bunch compressor [A]a 3,613.05 434.59
X-ray pulse duration [fs]a 67.4 -
Electron pulse duration [fs]a 70.1 9.1
Photon energy [mJ]a 2.13 0.18
Number of photonsa 6.7 e12 5.5 e11
Photon energy [eV]a 1,995.4 5.4
Photon wavelength [Å]a 6.21 0.02
Wavelength jitter [%] 0.27 -
Peak X-ray power [GW]a 30.5 2.5
Beam intensity in focus [W cm-2]b 5.1 e18 - a) Varies from shot to shot; b) Focus 2 x 3 m2
Nature Methods: doi:10.1038/nmeth.1859

Supplementary Note
Analysis of protein content from solubilised in vivo crystals. Isolated and purified in vivo
crystals were solubilised in sodium acetate buffer at pH 3.5. As shown by Western blot
analysis, a polyclonal Cathepsin B specific antibody detected the solubilised protein
(Supplementary Fig. 1a), suggesting that the expressed TbCatB protein is a major constituent
of the in vivo crystals. This was confirmed by a commercial CatB activity assay containing a
flourogenic dipeptide substrate and a specific CatB inhibitor (Supplementary Fig. 1b) as well
as by mass spectrometry performed on the trypsin digested gel bands (data not shown). N-
terminal sequencing identified Glu63 of the propeptide as the first protein residue within the in
vivo crystals, confirming the persistence of a part of the propeptide that is normally auto-
catalytically cleaved in the lysosome4. Two protein bands corresponding to molecular weights
of approx. 30 and 34 kDa were detected by SDS-PAGE analysis (Supplementary Fig. 1c),
which converged after de-glycosylation treatment to a single protein band at about 30 kDa.
Since the identified amino acid sequence of TbCatB contains two N-glycosylation consensus
motifs, one within the remnant pro-region at Asn76 and another at Asn216 of the mature
protein sequence, different glycosylation states of TbCatB in the in vivo crystals are indicated.
Crystal contacts within in vitro crystallized TbCatB. The essential crystal contacts
maintaining the crystal lattice primarily involve the hydrophobic patches of two equivalent
anti-parallel -helices within the two neighbouring monomers A and B, comprising residues
Arg84 to Pro95 of the propeptide sequence of each molecule. The patch is flanked by a region
of hydrogen bonds, polar contacts, and hydrophobic interactions that are mediated by the
monomers A, B and C (Fig. 3b). In total, these interactions bury a surface area of approx.
1,730 Å2, thus comprising the largest continuous buried surface area in the crystal packing.
Therefore, the presence of the C-terminal residues of the propeptide of TbCatB might
influence also the crystal formation in vivo.
Differences of TbCatB to human Cathepsin B. Although the structure of TbCatB exhibits
the characteristic papain/CatB fold, there are distinct differences to human CatB (PDB ID:
1GMY)5 that are particularly important to consider for rational drug discovery investigations.
Both TbCatB structures still contain an additional segment of the pro-peptide that is in
principle predicted to be completely cleaved during protein maturation under acidic
conditions4. This remnant pro-peptide end, located near the S2-pocket and reducing the
Nature Methods: doi:10.1038/nmeth.1859

accessibility of the catalytic cleft, may influence and trigger the binding of ligands.
Furthermore, some residues of the S2-pocket itself, which is considered to be important for
substrate specificity of the protease6, differ to the corresponding residues of the human protein.
For example, HsCatB contains glutamate at position 324 and tyrosine at position 154 close to
the bottom of the pocket, while TbCatB has a glycine and an aspartic acid residue at the
corresponding position 328 and 166, respectively. This modification results in an enlarged
pocket for TbCatB, allowing substrates with larger and non-polar amino acid side chains to
bind. These significant structural differences can be used to guide the design of a specific
inhibitor, since the remaining active site is highly conserved.
1. Strüder, L. et al. Nuc. Inst. Meth. Phys. Res. A 614, 483-496 (2010).
2. Adams, P.D. et al. Acta Crystallogr. D Biol. Crystallogr. 58, 1948-1954 (2002).
3. Collaborative Computational Project, Number 4, Acta Crystallogr. D Biol. Crystallogr.
50, 760-763 (1994).
4. Mackey, Z.B., O'Brien, T.C., Greenbaum, D.C., Blank, R.B. & McKerrow, J.H. J. Biol.
Chem. 279, 48426-48433 (2004).
5. Greenspan, P.D. et al. J. Med. Chem. 44, 4524-4534 (2001).
6. Sajid, M. & McKerrow, J.H. Mol. Biochem. Parasitol. 120, 1-21 (2002).
Nature Methods: doi:10.1038/nmeth.1859