Embed Size (px)
Citation preview
Jour
nal o
f Cel
l Sci
ence
RESEARCH ARTICLE
Lipid droplet formation in response to oleic acid in Huh-7 cells ismediated by the fatty acid receptor FFAR4
Arndt Rohwedder*, Qifeng Zhang, Simon A. Rudge and Michael J. O. Wakelam`
ABSTRACT
It is unclear how changes in lipid droplet size and number are
regulated – for example, it is not known whether this involves a
signalling pathway or is directed by cellular lipid uptake. Here, we
show that oleic acid stimulates lipid droplet formation by activating
the long-chain fatty acid receptor FFAR4, which signals through a
pertussis-toxin-sensitive G-protein signalling pathway involving
phosphoinositide 3-kinase (PI3-kinase), AKT (also known as
protein kinase B) and phospholipase D (PLD) activities. This initial
lipid droplet formation is not dependent upon exogenous lipid,
whereas the subsequent more sustained increase in the number
of lipid droplets is dependent upon lipid uptake. These two
mechanisms of lipid droplet formation point to distinct potential
intervention points.
KEY WORDS: Lipid droplets, Oleic acid, PI3-kinase, Phospholipase
D, FFAR4, Fatty acid receptor
INTRODUCTIONLipid droplets are intracellular storage organelles found in most
cells in essentially all organisms (Athenstaedt et al., 1999; Wan
et al., 2007; Fujimoto et al., 2008). Lipid droplets are made up of
a core of neutral lipids (Zweytick et al., 2000; Cheng et al., 2009)
surrounded by a monolayer of phospholipids (Tauchi-Sato et al.,
2002; Fujimoto and Ohsaki, 2006) in which is embedded a unique
set of proteins (Goodman, 2009; Walther and Farese, 2009;
Hodges and Wu, 2010; Meex et al., 2009). Lipid droplets are
highly dynamic organelles, and the application of long-chain fatty
acids generates droplets in most cell types (Schadinger et al.,
2005; Fujimoto et al., 2006). Extensive generation of these
neutral lipid storage organelles has been implicated in a number
of diseases, including non-alcoholic steatohepatitis (NASH)
(Anderson and Borlak, 2008; Neuschwander-Tetri, 2010),
obesity and type 2 diabetes (Agarwal and Garg, 2006; Thiele
and Spandl, 2008; Bostrom et al., 2009). Dysregulation of the
formation of lipid droplets also affects the process of
atherosclerosis (Paul et al., 2008). In addition, lipid droplets are
important in infection by hepatitis type C virus (HCV); a capsid
(core) and a non-structural protein (NS5A) are targeted to lipid
droplets, resulting in HCV particles assembling at lipid droplets –
indeed, disturbance of lipid droplet targeting can suppress HCV
production (Sato et al., 2006; Fujimoto et al., 2008; Clement
et al., 2011).
The excessive accumulation of intracellular lipid droplets canhave further implications. In Chanarin-Dorfman syndrome,
triacylglycerol, a major lipid constituent of lipid droplets, isdeposited and stored in different tissues, but not in adipose tissue(Fujimoto et al., 2008). Lipodystrophy is marked by a loss of
adipose tissue in Berardinelli-Seip congenital lipodystrophy 2(BSCL2) (Boutet et al., 2009), associated with a reduction ordefect in the sorting of caveolin-1 (Blouin et al., 2010). Thecontrol of lipid droplet generation, composition and turnover is
therefore important for cells. However, it remains unclearwhether this regulation is brought about through an externallyactivated signalling pathway or is just directed by cellular lipid
availability and, thus, uptake (Digel et al., 2010). It has beensuggested that the formation, localisation and growth of lipiddroplets is dependent upon phospholipase D (PLD) and the ERK
pathway (Nakamura et al., 2005; Andersson et al., 2006) but,despite this, the involvement of signalling pathways in thestimulated formation of lipid droplets in response to cell exposureto fatty acids, an indicator of nutritional uptake, is unclear. In
order to investigate this, the hepatoma cell line Huh-7 wasexamined as a model of hepatic lipid uptake. Under normalconditions, this cell line contains a high number of lipid droplets
of an intermediate average size, and the cells can be used torepresent hepatic conditions. The results presented in this paperprovide evidence that long-chain fatty acids increase lipid droplet
formation through both an acute fatty-acid-receptor-mediatedsignalling pathway and a longer lasting lipid-uptake-mediatedpathway.
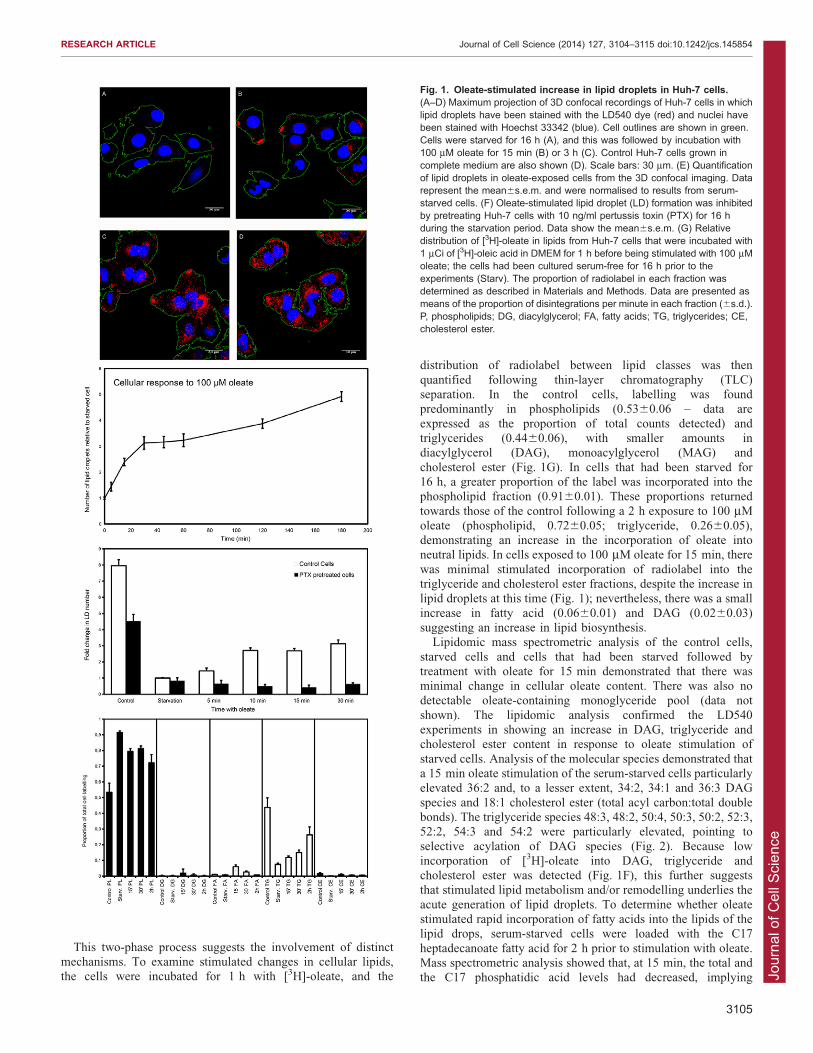
RESULTSDepletion of fatty acids from cell culture medium by overnightserum withdrawal brought about an ,85% reduction in the
number of detectable lipid droplets in Huh-7 cells; this couldbe reversed by the addition of 100 mM oleate to the serum-free medium (Fig. 1). This increase in the number of lipid
droplets was apparent within a few minutes after the addition ofoleate (Fig. 1) and was concentration dependent. The increase inlipid droplet number following oleate addition was a biphasic
process; the rapid increase from the starvation level wasobservable by 5 min after oleate addition (the fold increaseabove the starved control was 1.4460.17; 6s.e.m.) and increasedup to 30 min (3.1360.24), followed by a plateau phase to
,60 min (3.2360.24), after which there followed a continuousincrease in lipid droplet number (120 min, 3.8860.18; 180 min,4.9260.19) (Fig. 1E). In control untreated cells, the fold
elevation in the number of droplets per cell compared with thatof the starved condition was 7.9560.37. Oleate-stimulateddroplet formation was ablated in pertussis-toxin-treated cells
(Fig. 1F).
Signalling Programme, Babraham Institute, Babraham Research Campus,Cambridge CB22 3AT, UK.*Present address: Christian-Albrechts-Universitat zu Kiel, MOIN-CC, AmBotanischen Garten 14, 24118 Kiel, Germany.
`Author for correspondence ([email protected])
Received 6 November 2013; Accepted 26 April 2014
� 2014. Published by The Company of Biologists Ltd | Journal of Cell Science (2014) 127, 3104–3115 doi:10.1242/jcs.145854
3104
Jour
nal o
f Cel
l Sci
ence
This two-phase process suggests the involvement of distinctmechanisms. To examine stimulated changes in cellular lipids,the cells were incubated for 1 h with [3H]-oleate, and the
distribution of radiolabel between lipid classes was then
quantified following thin-layer chromatography (TLC)separation. In the control cells, labelling was foundpredominantly in phospholipids (0.5360.06 – data are
expressed as the proportion of total counts detected) andtriglycerides (0.4460.06), with smaller amounts indiacylglycerol (DAG), monoacylglycerol (MAG) and
cholesterol ester (Fig. 1G). In cells that had been starved for16 h, a greater proportion of the label was incorporated into thephospholipid fraction (0.9160.01). These proportions returned
towards those of the control following a 2 h exposure to 100 mMoleate (phospholipid, 0.7260.05; triglyceride, 0.2660.05),demonstrating an increase in the incorporation of oleate intoneutral lipids. In cells exposed to 100 mM oleate for 15 min, there
was minimal stimulated incorporation of radiolabel into thetriglyceride and cholesterol ester fractions, despite the increase inlipid droplets at this time (Fig. 1); nevertheless, there was a small
increase in fatty acid (0.0660.01) and DAG (0.0260.03)suggesting an increase in lipid biosynthesis.
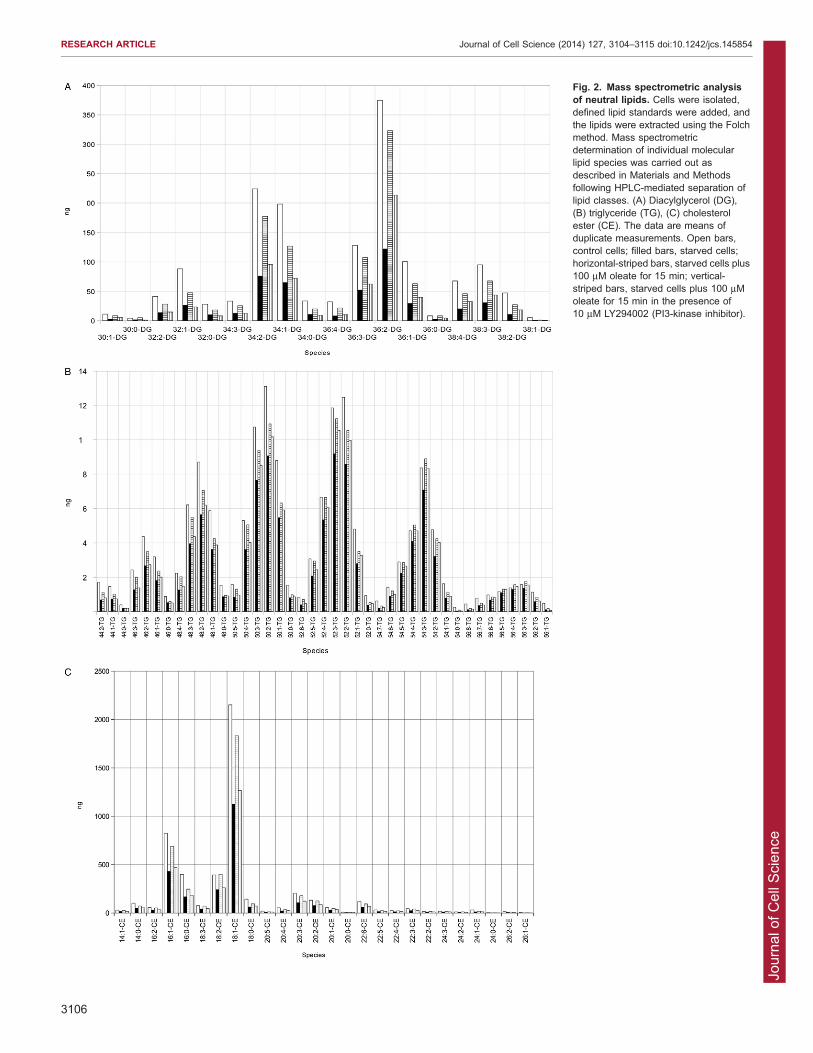
Lipidomic mass spectrometric analysis of the control cells,
starved cells and cells that had been starved followed bytreatment with oleate for 15 min demonstrated that there wasminimal change in cellular oleate content. There was also nodetectable oleate-containing monoglyceride pool (data not
shown). The lipidomic analysis confirmed the LD540experiments in showing an increase in DAG, triglyceride andcholesterol ester content in response to oleate stimulation of
starved cells. Analysis of the molecular species demonstrated thata 15 min oleate stimulation of the serum-starved cells particularlyelevated 36:2 and, to a lesser extent, 34:2, 34:1 and 36:3 DAG
species and 18:1 cholesterol ester (total acyl carbon:total doublebonds). The triglyceride species 48:3, 48:2, 50:4, 50:3, 50:2, 52:3,52:2, 54:3 and 54:2 were particularly elevated, pointing to
selective acylation of DAG species (Fig. 2). Because lowincorporation of [3H]-oleate into DAG, triglyceride andcholesterol ester was detected (Fig. 1F), this further suggeststhat stimulated lipid metabolism and/or remodelling underlies the
acute generation of lipid droplets. To determine whether oleatestimulated rapid incorporation of fatty acids into the lipids of thelipid drops, serum-starved cells were loaded with the C17
heptadecanoate fatty acid for 2 h prior to stimulation with oleate.Mass spectrometric analysis showed that, at 15 min, the total andthe C17 phosphatidic acid levels had decreased, implying
Fig. 1. Oleate-stimulated increase in lipid droplets in Huh-7 cells.(A–D) Maximum projection of 3D confocal recordings of Huh-7 cells in whichlipid droplets have been stained with the LD540 dye (red) and nuclei havebeen stained with Hoechst 33342 (blue). Cell outlines are shown in green.Cells were starved for 16 h (A), and this was followed by incubation with100 mM oleate for 15 min (B) or 3 h (C). Control Huh-7 cells grown incomplete medium are also shown (D). Scale bars: 30 mm. (E) Quantificationof lipid droplets in oleate-exposed cells from the 3D confocal imaging. Datarepresent the mean6s.e.m. and were normalised to results from serum-starved cells. (F) Oleate-stimulated lipid droplet (LD) formation was inhibitedby pretreating Huh-7 cells with 10 ng/ml pertussis toxin (PTX) for 16 hduring the starvation period. Data show the mean6s.e.m. (G) Relativedistribution of [3H]-oleate in lipids from Huh-7 cells that were incubated with1 mCi of [3H]-oleic acid in DMEM for 1 h before being stimulated with 100 mMoleate; the cells had been cultured serum-free for 16 h prior to theexperiments (Starv). The proportion of radiolabel in each fraction wasdetermined as described in Materials and Methods. Data are presented asmeans of the proportion of disintegrations per minute in each fraction (6s.d.).P, phospholipids; DG, diacylglycerol; FA, fatty acids; TG, triglycerides; CE,cholesterol ester.
RESEARCH ARTICLE Journal of Cell Science (2014) 127, 3104–3115 doi:10.1242/jcs.145854
3105
Jour
nal o
f Cel
l Sci
ence
Fig. 2. Mass spectrometric analysisof neutral lipids. Cells were isolated,defined lipid standards were added, andthe lipids were extracted using the Folchmethod. Mass spectrometricdetermination of individual molecularlipid species was carried out asdescribed in Materials and Methodsfollowing HPLC-mediated separation oflipid classes. (A) Diacylglycerol (DG),(B) triglyceride (TG), (C) cholesterolester (CE). The data are means ofduplicate measurements. Open bars,control cells; filled bars, starved cells;horizontal-striped bars, starved cells plus100 mM oleate for 15 min; vertical-striped bars, starved cells plus 100 mMoleate for 15 min in the presence of10 mM LY294002 (PI3-kinase inhibitor).
RESEARCH ARTICLE Journal of Cell Science (2014) 127, 3104–3115 doi:10.1242/jcs.145854
3106

Jour
nal o
f Cel
l Sci
ence
increased de novo triglyceride synthesis. The extremely highamounts of triglyceride relative to other lipids makes itimpossible to quantify the shift in lipids from MAG, DAG and
phosphatidic acid to triglyceride (see Table 1). Additionally, totalMAG and DAG increased after 15 min but there was no increasein C17 incorporation – the level of C17 cholesterol ester declined
as oleate incorporation was increased. These data support the
proposition that at the early (up to 15 min) time-points theincrease in lipids in droplets comes from increased synthesis fromexisting cellular lipids, rather than the incorporation of external
oleate.In cells that were stimulated by the addition of medium
containing 100 mM oleate for 10 min, after which the oleate
was removed and the cells were washed with warmed PBS,
Table 1 Mass spectrometric measurement of lipids in heptadecanoate-loaded cells
Quantification of lipid species in a particular lipid class that contain a C-17-fatty-acyl-derived group
C-17 lipid (6106 ng) 0-min oleate 15-min oleate 30-min oleate 120-min oleate
MAG 1.8 1.63 0.99 0.25DAG 170 180 170 201TG 8600 8245 8310 8385PA 44 21 17 14CE 14 13 8 3FACoA 0.12 0.13 0.13 0.1PC 2060 2390 2082 2331
Quantification of all lipids present in a particular lipid class
Lipid (6106 ng) 0-min oleate 15-min oleate 30-min oleate 120-min oleate
MAG 29.5 135.5 117 154DAG 2771 3502 3494 4010TG 11,805 10,895 11,545 15,428PA 734 494 471 379CE 271 211 210 110FACoA 12.5 13.9 13.5 13.2PC 45,905 51,005 44,845 52,100
Cells were incubated for 18 h in DMEM+1% BSA, followed by the addition of 3 mM heptadecanoate. Following a further 2 h, the cells were stimulated with 100 mMoleate. The lipidswere extracted at the times indicated and quantified bymass spectrometry. The data aremeans of duplicatemeasurements froma single experiment.MAG, monoacylglycerol; DAG, diacylglycerol; TG, triglyceride; PA, phosphatidic acid; CE, cholesterol ester; FACoA, fatty acylCoA; PC, phosphatidylcholine.
Fig. 3. Dependence of continued lipid droplet formation upon extracellular oleate. Starved Huh-7 cells were exposed to 100 mM oleate (OA) for10 min. Subsequently, either this was maintained (black bars) or the medium was removed and, following a PBS wash, the cells were incubated in freshfatty-acid-free medium (open bars). The cells were fixed at the stated time-points, and lipid droplets were identified by LD540 staining and quantified by usingmicroscopy. The data were normalised to results from fatty-acid-starved cells (starvation) and are expressed as the mean6s.e.m. The P-values are: 15 min,P50.9; 30 min, P50.5; 120 min, P,10210; 180 min P,10210 (Student’s t-test).
RESEARCH ARTICLE Journal of Cell Science (2014) 127, 3104–3115 doi:10.1242/jcs.145854
3107
Jour
nal o
f Cel
l Sci
ence
lipid droplet formation continued, as though the oleate hadremained present, for at least a further 20 min (Fig. 3). The foldincrease in the number of lipid droplets above that of the starved
control cells after 30 min (i.e. 10 min oleate exposure followedby 20 min in its absence) was 3.5260.28, but this declined to1.660.16-fold after 2 h, which was similar to the fold change inlipid droplet number observed after a 5 min oleate stimulation
(1.4560.17).
An increase in lipid droplet generation was also observed instarved cells in response to the addition of other long-chain fattyacids (e.g. linoleic acid), but not short-chain fatty acids (e.g. capric
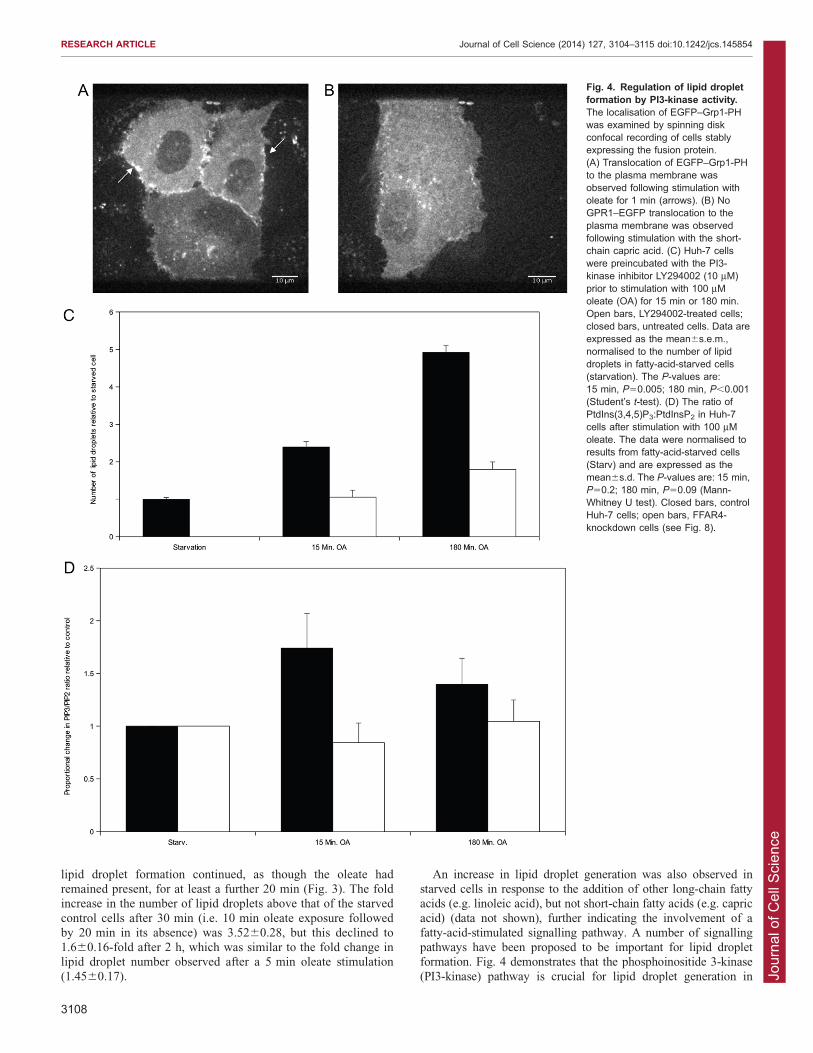
acid) (data not shown), further indicating the involvement of afatty-acid-stimulated signalling pathway. A number of signallingpathways have been proposed to be important for lipid dropletformation. Fig. 4 demonstrates that the phosphoinositide 3-kinase
(PI3-kinase) pathway is crucial for lipid droplet generation in
Fig. 4. Regulation of lipid dropletformation by PI3-kinase activity.The localisation of EGFP–Grp1-PHwas examined by spinning diskconfocal recording of cells stablyexpressing the fusion protein.(A) Translocation of EGFP–Grp1-PHto the plasma membrane wasobserved following stimulation witholeate for 1 min (arrows). (B) NoGPR1–EGFP translocation to theplasma membrane was observedfollowing stimulation with the short-chain capric acid. (C) Huh-7 cellswere preincubated with the PI3-kinase inhibitor LY294002 (10 mM)prior to stimulation with 100 mMoleate (OA) for 15 min or 180 min.Open bars, LY294002-treated cells;closed bars, untreated cells. Data areexpressed as the mean6s.e.m.,normalised to the number of lipiddroplets in fatty-acid-starved cells(starvation). The P-values are:15 min, P50.005; 180 min, P,0.001(Student’s t-test). (D) The ratio ofPtdIns(3,4,5)P3:PtdInsP2 in Huh-7cells after stimulation with 100 mMoleate. The data were normalised toresults from fatty-acid-starved cells(Starv) and are expressed as themean6s.d. The P-values are: 15 min,P50.2; 180 min, P50.09 (Mann-Whitney U test). Closed bars, controlHuh-7 cells; open bars, FFAR4-knockdown cells (see Fig. 8).
RESEARCH ARTICLE Journal of Cell Science (2014) 127, 3104–3115 doi:10.1242/jcs.145854
3108
Jour
nal o
f Cel
l Sci
ence
oleate-stimulated starved cells. Preincubation with 10 mMLY294002 (a PI3-kinase inhibitor) prior to oleate stimulation
completely inhibited lipid droplet generation at the 15 min time-point and significantly suppressed the fold increase in lipid dropletnumber at 180 min (control, 5.1060.19; +LY294002, 1.7960.21)(Fig. 4C). Mass spectrometric analysis also showed that the oleate-
stimulated increases in DAG, triglyceride and cholesterol esterspecies were inhibited by LY294002 (Fig. 2). This indicates astrong dependence of droplet generation upon PI3-kinase-
dependent signalling. To confirm the involvement of PI3-kinasesignalling in oleate stimulation, three strategies were adopted.First, measurement of phosphatidylinositol (3,4,5)-trisphosphate
[PtdIns(3,4,5)P3] concentration by mass spectrometry demonstratedan oleate-stimulated increase in cellular PtdIns(3,4,5)P3, asquantified by the PtdIns(3,4,5)P3:PtdInsP2 (phosphatidylinositol
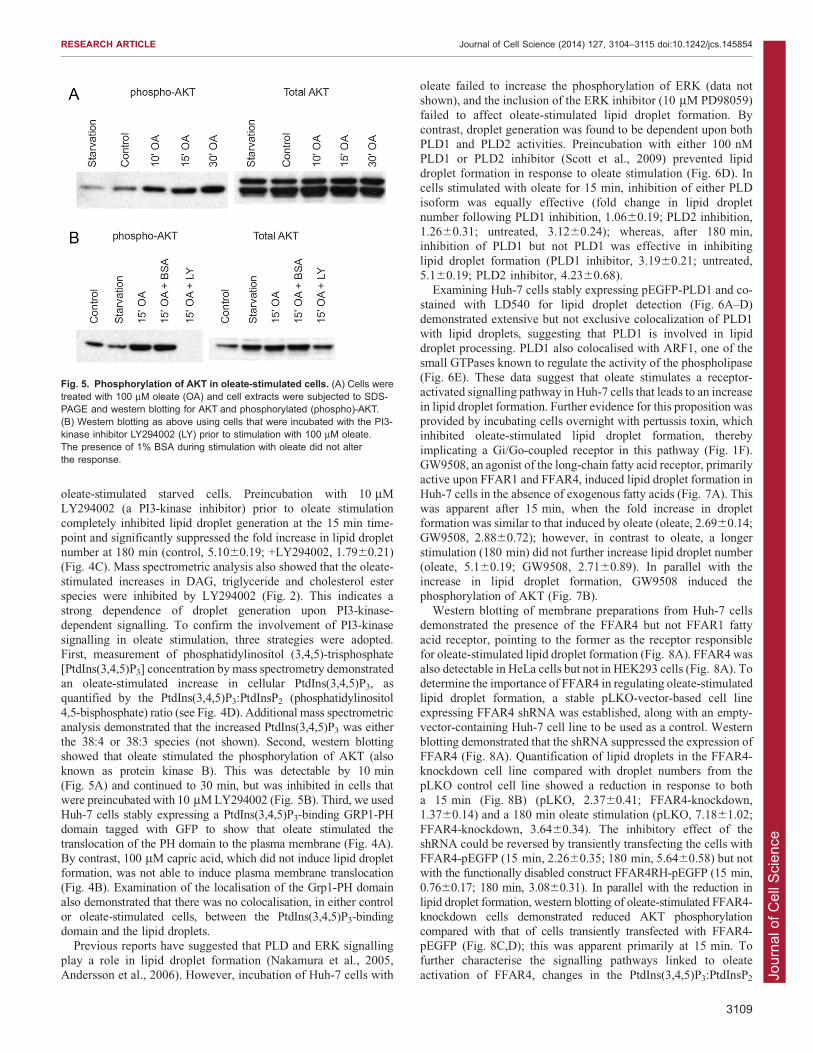
4,5-bisphosphate) ratio (see Fig. 4D). Additional mass spectrometricanalysis demonstrated that the increased PtdIns(3,4,5)P3 was eitherthe 38:4 or 38:3 species (not shown). Second, western blottingshowed that oleate stimulated the phosphorylation of AKT (also
known as protein kinase B). This was detectable by 10 min(Fig. 5A) and continued to 30 min, but was inhibited in cells thatwere preincubated with 10 mM LY294002 (Fig. 5B). Third, we used
Huh-7 cells stably expressing a PtdIns(3,4,5)P3-binding GRP1-PHdomain tagged with GFP to show that oleate stimulated thetranslocation of the PH domain to the plasma membrane (Fig. 4A).
By contrast, 100 mM capric acid, which did not induce lipid dropletformation, was not able to induce plasma membrane translocation(Fig. 4B). Examination of the localisation of the Grp1-PH domainalso demonstrated that there was no colocalisation, in either control
or oleate-stimulated cells, between the PtdIns(3,4,5)P3-bindingdomain and the lipid droplets.
Previous reports have suggested that PLD and ERK signalling
play a role in lipid droplet formation (Nakamura et al., 2005,Andersson et al., 2006). However, incubation of Huh-7 cells with
oleate failed to increase the phosphorylation of ERK (data notshown), and the inclusion of the ERK inhibitor (10 mM PD98059)
failed to affect oleate-stimulated lipid droplet formation. Bycontrast, droplet generation was found to be dependent upon bothPLD1 and PLD2 activities. Preincubation with either 100 nMPLD1 or PLD2 inhibitor (Scott et al., 2009) prevented lipid
droplet formation in response to oleate stimulation (Fig. 6D). Incells stimulated with oleate for 15 min, inhibition of either PLDisoform was equally effective (fold change in lipid droplet
number following PLD1 inhibition, 1.0660.19; PLD2 inhibition,1.2660.31; untreated, 3.1260.24); whereas, after 180 min,inhibition of PLD1 but not PLD1 was effective in inhibiting
lipid droplet formation (PLD1 inhibitor, 3.1960.21; untreated,5.160.19; PLD2 inhibitor, 4.2360.68).
Examining Huh-7 cells stably expressing pEGFP-PLD1 and co-
stained with LD540 for lipid droplet detection (Fig. 6A–D)demonstrated extensive but not exclusive colocalization of PLD1with lipid droplets, suggesting that PLD1 is involved in lipiddroplet processing. PLD1 also colocalised with ARF1, one of the
small GTPases known to regulate the activity of the phospholipase(Fig. 6E). These data suggest that oleate stimulates a receptor-activated signalling pathway in Huh-7 cells that leads to an increase
in lipid droplet formation. Further evidence for this proposition wasprovided by incubating cells overnight with pertussis toxin, whichinhibited oleate-stimulated lipid droplet formation, thereby
implicating a Gi/Go-coupled receptor in this pathway (Fig. 1F).GW9508, an agonist of the long-chain fatty acid receptor, primarilyactive upon FFAR1 and FFAR4, induced lipid droplet formation in
Huh-7 cells in the absence of exogenous fatty acids (Fig. 7A). Thiswas apparent after 15 min, when the fold increase in dropletformation was similar to that induced by oleate (oleate, 2.6960.14;GW9508, 2.8860.72); however, in contrast to oleate, a longer
stimulation (180 min) did not further increase lipid droplet number(oleate, 5.160.19; GW9508, 2.7160.89). In parallel with theincrease in lipid droplet formation, GW9508 induced the
phosphorylation of AKT (Fig. 7B).Western blotting of membrane preparations from Huh-7 cells
demonstrated the presence of the FFAR4 but not FFAR1 fatty
acid receptor, pointing to the former as the receptor responsiblefor oleate-stimulated lipid droplet formation (Fig. 8A). FFAR4 wasalso detectable in HeLa cells but not in HEK293 cells (Fig. 8A). Todetermine the importance of FFAR4 in regulating oleate-stimulated
lipid droplet formation, a stable pLKO-vector-based cell lineexpressing FFAR4 shRNA was established, along with an empty-vector-containing Huh-7 cell line to be used as a control. Western
blotting demonstrated that the shRNA suppressed the expression ofFFAR4 (Fig. 8A). Quantification of lipid droplets in the FFAR4-knockdown cell line compared with droplet numbers from the
pLKO control cell line showed a reduction in response to botha 15 min (Fig. 8B) (pLKO, 2.3760.41; FFAR4-knockdown,1.3760.14) and a 180 min oleate stimulation (pLKO, 7.1861.02;
FFAR4-knockdown, 3.6460.34). The inhibitory effect of theshRNA could be reversed by transiently transfecting the cells withFFAR4-pEGFP (15 min, 2.2660.35; 180 min, 5.6460.58) but notwith the functionally disabled construct FFAR4RH-pEGFP (15 min,
0.7660.17; 180 min, 3.0860.31). In parallel with the reduction inlipid droplet formation, western blotting of oleate-stimulated FFAR4-knockdown cells demonstrated reduced AKT phosphorylation
compared with that of cells transiently transfected with FFAR4-pEGFP (Fig. 8C,D); this was apparent primarily at 15 min. Tofurther characterise the signalling pathways linked to oleate
activation of FFAR4, changes in the PtdIns(3,4,5)P3:PtdInsP2
Fig. 5. Phosphorylation of AKT in oleate-stimulated cells. (A) Cells weretreated with 100 mM oleate (OA) and cell extracts were subjected to SDS-PAGE and western blotting for AKT and phosphorylated (phospho)-AKT.(B) Western blotting as above using cells that were incubated with the PI3-kinase inhibitor LY294002 (LY) prior to stimulation with 100 mM oleate.The presence of 1% BSA during stimulation with oleate did not alterthe response.
RESEARCH ARTICLE Journal of Cell Science (2014) 127, 3104–3115 doi:10.1242/jcs.145854
3109

Jour
nal o
f Cel
l Sci
ence
Fig. 6. See next page for legend.
RESEARCH ARTICLE Journal of Cell Science (2014) 127, 3104–3115 doi:10.1242/jcs.145854
3110

Jour
nal o
f Cel
l Sci
ence
ratio were determined by mass spectrometry in FFAR4-knockdown cells compared with the changes in pLKO-
expressing cells (Fig. 4D). A 1.7460.32-fold stimulation inresponse to oleate stimulation for 15 min was detected in thepLKO cells, but this was not observed in the FFAR4-knockdown
cells (0.8460.19).Not only could transfection of FFAR4-pEGP rescue the oleate
stimulation of lipid droplet formation in FFAR4-knockdown
cells, but the alterative receptor FFAR1 could also substitute forFFAR4. Stimulation of the FFAR1-transfected cells with 100 mMoleate generated a similar increase in the number of lipid dropletsas was observed in mock-transfected pLKO cells, and this
recovered response was ablated by preincubation with LY294002(data not shown), indicating that the same signalling pathway isused by both fatty acid receptors.
DISCUSSIONThe accumulation of excess lipid in cells and tissues has been
associated with pathological disorders, such as insulin resistanceand even heart failure. It is thus essential that cells store lipids in ahighly regulated manner in lipid droplets. However, lipid droplets
are more than simple storage structures; instead, they arespecialised dynamic organelles that can also operate as aplatform for intracellular signalling and viral synthesis. Thus,their regulation is crucial, and it is surprising that little is known
about the acute regulation of their formation. Lipid dropletformation clearly requires cellular lipid uptake, modification andsubsequent storage in the organelle (Sturley and Hussain, 2012;
Brasaemle and Wolins, 2012); nevertheless, the results presentedin this paper point to a regulated process of lipid dropletgeneration, rather than it being solely a consequence of increased
lipid uptake.The dynamic nature of cellular lipid droplets is demonstrated
by their reduction in response to starvation and the subsequent
recovery in number following the addition of exogenous fattyacids, notably oleate (Fig. 1). It is not possible to state whetherthe droplets are lost in response to starvation or whether theybecome too small to be detectable or become lipid-free structures
that cannot be detected using lipid-specific dyes such as LD540.However, it is clear that the addition of oleate to serum-freemedium rapidly induces the appearance of detectable lipid
droplets. The [3H]-oleate incorporation experiments (Fig. 1G)and C-17 fatty acid mass spectrometry experiments (Table 1)demonstrated that at short times (15 and 30 min) following oleate
addition to the medium there was limited incorporation of fatty
acid into triglycerides and cholesterol ester, despite there being asignificant increase in the number and size of lipid droplets (see
Fig. 1A–C). This implies that oleate addition stimulates theincorporation of endogenous cellular lipid into lipid droplets, asdemonstrated by the mass spectrometric analysis (Table 1;Fig. 2), with the non-regular increase in lipid droplet size either
being due to stimulated droplet fusion or variable increases inuptake into particular droplets. By contrast, the longer incubationwith oleate demonstrates a clearer incorporation of added [3H]-
oleate into droplet-associated lipids and also a significant increasein total triglyceride content.
This clearly biphasic generation of lipid droplets in response to
oleate points to distinct mechanisms of their formation. Whereasthe longer-time-dependent increase is undoubtedly dependentupon oleate uptake and incorporation, the more acute response is
suggestive of a signalling process. This is supported by the datapresented in Figs 2, 3 and 7, which show that a pulse of oleate canstimulate lipid droplet formation, that the droplet formation isspecific for long-chain monounsaturated lipids and that GW9508,
a small molecule agonist of the FFAR1 and FFAR4 fatty acidreceptors, can replace oleate in stimulating the short-term but notthe long-term increase in lipid droplet formation. The Huh-7 cells
examined in this study express FFAR4, but not FFAR1, pointingto the role of these receptors in oleate-stimulated lipid dropletformation; indeed, depletion of the FFAR4, using an shRNA
approach, ablated oleate-stimulated droplet formation following a15 min incubation and significantly suppressed droplet formationafter 120 min (Fig. 8).
Occupation of the FFAR4 fatty acid receptor stimulates lipiddroplet formation through a signalling cascade. It has beenpreviously suggested that lipid droplet formation requires PLDand ERK activity (Andersson et al., 2006). Although our inhibitor
studies provide support for the proposal that PLD activity plays arole in droplet formation, with apparent differences in thefunctions of PLD1 and PLD2, we found no evidence for ERK
involvement; it is possible that this difference in result is due toour use of a newer generation of more specific ERK inhibitors. Inaddition to PLD signalling, ligating the FFAR4 receptor activates
PI3-kinase, presumably through the pertussis-toxin-sensitive Gi.This is detectable as an increase in PtdIns(3,4,5)P3 mass, asmeasured by mass spectrometry, in response to oleate stimulationin control but not FFAR4-knockdown cells and by an increase in
oleate-stimulated AKT phosphorylation, which was sensitive tothe PI3-kinase inhibitor LY294002 and could be mimicked byGW9508. In addition, we observed an increase in the plasma
membrane localisation of a transfected GFP–Grp1-PH-domain inresponse to oleate but not capric acid stimulation, and we did notdetect accumulation of PtdIns(3,4,5)P3 at the lipid droplet. The
localisation of PtdIns(3,4,5)P3 at the plasma membrane impliesthat this is the receptor-linked signalling process that stimulateslipid droplet formation. PLD, by contrast, appears to be more
closely associated with the droplet, along with its regulatory smallGTPase, ARF1. This suggests that PLD signalling is downstreamof PI3-kinase in the oleate-stimulated cascade, and that it mighthave a more direct effect upon the lipid droplet. Both PLD1 and
PLD2 inhibitors have an inhibitory effect upon acute oleate-stimulated lipid droplet formation; by contrast, longer termdroplet formation is also inhibited by the inhibition of PLD1,
whereas the inhibition of PLD2 has a minimal effect. PLD2 is aplasma-membrane-localised isoform (McDermott et al., 2004),thus pointing to PLD1 as a major regulator at the lipid droplet.
The stimulation of PLD activity by oleate acting through a fatty
Fig. 6. PLD partially colocalises with lipid droplets in Huh-7-cells and isnecessary for lipid droplet formation. Huh-7 cells expressing GFP–PLD1(A, green) and stained with LD540 (B, red). The isolated colocalised pixelsfrom GFP–PLD1 and LD540 images was determined using ImageJ – theRGB colocalisation plugin showed a strong association of PLD1 with lipiddroplets (C, white). (D) Preincubation of Huh-7 cells with the PLD1 or PLD2inhibitors (each at 100 nM) prior to stimulation with 100 mM oleate (OA).Closed bars, control cells; open bars, PLD1 inhibitor; horizontal-striped bars,PLD2 inhibitor. The data were normalised to the number of lipid droplets infatty-acid-starved cells (starvation) and are expressed as the mean6s.e.m.The P-values are: 15 min PLD1 inhibitor, P59.461025; 15 min PLD2inhibitor, P50.0002; 180 min PLD1 inhibitor, P5161028; 180 min PLD2inhibitor, P50.09 (Student’s t-test). N.S, non-significant. (E) Maximumprojection of 3D confocal recordings of transiently transfected Huh-7 cells.Cells were transfected with GFP–PLD1 (green, left) and Arf1–mCherry(red, middle). Cells were stimulated for 15 min or 180 min with 100 mMoleate prior to fixing and imaging. Some colocalisation (yellow) was observedin control starved cells (not shown).
RESEARCH ARTICLE Journal of Cell Science (2014) 127, 3104–3115 doi:10.1242/jcs.145854
3111

Jour
nal o
f Cel
l Sci
ence
acid receptor also provides an explanation for the long-standingissue that there is an oleate-stimulated PLD enzyme (Kasai et al.,1998) in cells that has never been identified – receptor-mediated
stimulation of PLD1 and PLD2 following oleate treatment thusremoves the need to implicate an unidentified PLD species.
The recognised role of PLD in regulating membrane trafficking,
fusion and fission events suggests that this enzyme might bedirectly involved in oleate-stimulated lipid droplet formation,whether this happens using existing droplets, by budding from theendoplasmic reticulum (Robenek et al., 2009) or fission of lipid
droplets (Long et al., 2012) remains to be resolved. How PI3-kinase regulates the process is unclear, although the fact that itsinhibition ablates the increase in droplet number both after 15 min
and 180 min exposure to oleate implies a fundamental regulatoryrole. Although PtdIns(3,4,5)P3 can regulate guanine nucleotideexchange factors (GEFs) such as Arno (officially known as
CYTH2) that activate ARF and thereby control PLD1 activity,there might be a separate function for AKT signalling that remainsto be determined. A role for PI3-kinase signalling in regulatinglipid droplets has been previously suggested. In microglia, the
generation of lipid droplets following lipopolysaccharide (LPS)stimulation is sensitive to LY294002 (Khatchadourian et al., 2012).A regulatory effect of AKT upon the lipid droplet pool in different
cell types through insulin signalling has also been suggested(Vereshchagina and Wilson, 2006; Bell et al., 2008). Inhibition ofPLD activity only fully ablates oleate-stimulated droplet formation
at early time-points, linking it to the receptor-stimulated pathway.At later time-points there is only partial inhibition, suggestingeither that other phosphatidic-acid-generating pathways can
compensate at these times, or that only the early stimulatedpathway is phosphatidic-acid-dependent, provided that themolecular species is similar to that generated by PLD (Pettitt
et al., 2001). This is in contrast to PI3-kinase activity, whichappears to be fully essential for lipid droplet formation. Anadditional possibility is suggested by the reports that phosphatidic
acid can regulate mTOR (Fang et al., 2001), although this hasproved to be a contentious suggestion. Nevertheless, if both PLDand PI3-kinase activities are feeding into an increase in mTOR
activity this might be a means to activate lipid droplet formation –indeed, mTOR is known to promote cellular lipid storage.
The data in this paper suggest a model in which the length ofexposure to elevated concentrations of fatty acid is crucial for
the mechanism of lipid droplet formation; short-term exposurestimulates the generation or growth of droplets in cells primarilyfrom endogenous lipid, whereas longer exposure results in the
incorporation of exogenous lipid following uptake. This couldsuggest that the magnitude and length of exposure to elevatedconcentrations of fatty acids could be an important switch in
regulating the amount of lipid droplet formation and, thus,between health and disease. In healthy states, the lipid dropletsserve as storage devices for lipids, whereas, in diseases, such asobesity and type 2 diabetes, excess droplet formation occurs. PI3-
kinase inhibitors have been considered as anti-insulin drugs, andthey might also prove to be effective in reducing lipid deposition.Alternatively, PLD inhibitors could play a role in reducing
acute lipid droplet formation in response to a high-fat diet. Theeffects of FFAR4 dysfunction have been demonstrated byIchimura et al., using a combined epidemiological and
knockout approach (Ichimura et al., 2012). The importance of afunctioning FFAR4 receptor was shown – in its absence there wasan increase in obesity, including a fatty liver. This points to a key
regulatory role for the signalling pathway activated by thisreceptor, in contrast to the more deleterious effects observedfollowing unregulated lipid uptake in its absence.
Fig. 7. Stimulation ofcells with FFAR4agonist. (A) Quantificationof lipid droplets from 3Dconfocal recordings incells stimulated with theFFAR4 agonist GW9508(open bars) compared withcontrol cells (closed bars)after oleate (OA)stimulation. The data werenormalised to results fromfatty-acid-starved cells(starvation) and areexpressed as themean6s.e.m. The P-values are: 15 min,P50.8; 180 min,P50.0003 (Student’s t-test). N.S., non-significant.(B) Western blots to showAKT phosphorylation(pAKT) in the GW9508-stimulated cells.
RESEARCH ARTICLE Journal of Cell Science (2014) 127, 3104–3115 doi:10.1242/jcs.145854
3112

Jour
nal o
f Cel
l Sci
ence
Fig. 8. The long-chain fatty acidreceptor FFAR4 mediates oleate-stimulated signalling. (A) Detection ofFFAR4 (FFA4) in Huh-7 cells and Helacells. wt, wild type. (B) The effects ofknockdown of FFAR4 in Huh-7 cells. Openbars, Huh-7 cells stably expressing FFAR4shRNA; closed bars, cells transfected withan empty pLKO vector; vertical-stripedbars, additional transfection with FFAR4–GFP; horizontal-striped bars, additionaltransfection with a non-functionaldominant-negative mutant (FFAR4RH).OA, oleate. Data are expressed as themean6s.e.m. The P-values are: 15 minFFAR4 shRNA knockdown, P50.014;15 min FFAR4 shRNAknockdown+FFAR4–GFP, P50.093;180 min FFAR4 shRNA knockdown,P50.375; 180 min FFAR4 shRNAknockdown+FFAR4–GFP, P50.531;15 min FFAR4 shRNAknockdown+FFAR4RH, P50.078; 180 minFFAR4 shRNA knockdown+FFAR4RH,P50.391 (Mann-Whitney U test).(C) Phosphorylation of AKT in the shRNA-treated cells. FA-Starv, fatty-acid-starvedcells. (D) Relative quantification of the datafrom multiple blots determining changes inAKT phosphorylation (representative blotshown in Fig. 8C). LY, PI3-kinaseinhibitor LY294002.
RESEARCH ARTICLE Journal of Cell Science (2014) 127, 3104–3115 doi:10.1242/jcs.145854
3113

Jour
nal o
f Cel
l Sci
ence
MATERIALS AND METHODSCell culture and stimulationHuh-7 cells were grown to a confluency of 50% in DMEM (PAA)
supplemented with 10% fetal calf serum (FCS) (PAA) and 1% penicillin-
streptomycin on 22-mm round coverslips (VWR). The medium was
replaced with DMEM supplemented with 1% penicillin-streptomycin and
1% bovine serum albumin (BSA; fatty acid free, endotoxin free) for
starvation for 16 h prior to stimulation with fatty acids, agonists or
inhibitors. The PLD1 and PLD2 inhibitors were used as described
previously (Norton et al., 2011). LY294002 (Calbiochem) in DMSO was
applied 20 min before stimulation at a final concentration of 10 mM.
Confocal microscopyCells were fixed by incubating with 800 ml of 4% paraformaldehyde (PFA)
in PBS for 45 min at room temperature and then washing three times
with 1 ml of ice-cold PBS. Samples were stained with 800 ml of
LD540 (diluted 1:1000 in PBS; provided by Christophe Thiele, Bonn,
Germany) and Hoechst 33342 (1:10,000) for 10 min. The cells were
viewed under 1 ml of PBS during recording using an Olympus
FLUOVIEW FV1000 at a resolution of 0.265 mm/pixel, 8006800 pixel.
The z dimensions were 2560.45 mm/slice. The excitation wavelengths
were 405 nm for Hoechst 33342 and 488 nm for LD540, and the filter
settings for recording were SDM490, 425–420 nm for Hoechst 33342;
500–600 nm for LD540. Three-dimensional (3D) quantification of lipid
droplets was performed with VolocityH 3D Image Analysis Software
(PerkinElmer). For live-cell imaging of GPR1–GFP-transfected Huh7-
cells, a spinning disc confocal microscope was used with filter settings for
GFP (excitation 488 nm, emission §525nm). The exposure time was
350 ms.
Western blottingSDS-PAGE was performed using 10% acrylamide gels with kaleidoscope
pre-stained standards. Semi-dry transfer preceded blotting with the
following primary antibodies: rabbit anti-AKT, anti-phospho-AKT (Cell
Signaling Technologies), rabbit anti-FFAR4 (MBL) and rabbit anti-
FFAR1 (Abcam). Incubation with the secondary antibody (HRP-coupled
anti-rabbit-IgG) was followed by ECL detection using Hyperfilm ECL
high performance chemiluminescence film (Amersham).
Lipid analysisAfter stimulation, PtdIns(3,4,5)P3 was determined by mass spectrometry as
described previously (Clark et al., 2011), and neutral lipids were determined
by mass spectrometry as described previously (Griffiths et al., 2013; Gaunt
et al., 2013). Huh-7 cells were incubated with 1 mCi of [3H]-oleic acid in
DMEM containing 1% penicillin-streptomycin and 1% fatty-acid-free BSA
for 1 h prior to stimulation. Lipids were extracted from cell pellets using the
Folch method. A total of 1 mg of TLC Mix 40 (Larodan) was added as a
standard, and lipids were separated by TLC on activated silica gel 60
(Merck) plates developed using hexane:diethylether:acetic acid (80:20:1).
Lipids were identified with iodine vapour, scraped from the plate and the
radioactivity was determined by scintillation counting. Huh-7 cells were
loaded with 3 mM C17 heptadecanoate fatty acid in DMEM containing 1%
penicillin-streptomycin and 1% fatty-acid-free BSA for 2 h before oleate
stimulation.
Mass spectrometryCell pellets (66106 cells) were washed twice with cold PBS and
resuspended in 1.5 ml of methanol in silanised glass tubes on dry ice.
After spiking with 400 ng of 17:0/20:4-phosphatidylinositol, 400 ng of
12:0/12:0-phosphatidylcholine, 100 ng of 12:0/12:0-phosphatidic acid,
100 ng of 12:0/12:012:0-triglyceride, 100 ng of 12:0/12:0-DAG, 50 ng
of 12:0-MAG, 200 ng of 17:0-free fatty acid, 100 ng of d7-cholesterol
and 100 ng of 17:0-cholesterol ester as internal standards, 1.5 ml of
0.88% NaCl and 3 ml of chloroform were added. The mixture was
vortexed for 20 s at room temperature and sonicated in an ice-cold
sonication water bath for 2 min, and then centrifuged at 1000 g at 4 C for
15 min. The lower phase was collected. The upper phase was extracted
with 3 ml of synthetic lower phase and the resulting extractions were
combined and dried under vacuum at room temperature with SpeedVac
(Thermo) and redissolved in 100 ml of chloroform. A total of 7 ml was
injected for liquid chromatography-mass spectrometry (LC/MS) analysis.
For LC/MS analysis, we used a Thermo Orbitrap Elite system (Thermo
Fisher) hyphenated with a five-channel online degasser, four-pump,
column oven and autosampler with cooler, Shimadzu Prominence HPLC
system (Shimadzu) for lipids analysis. In detail, lipid classes were
separated on a normal phase silica gel column (2.16150 mm, 4micro,
MicoSolv Technology) with a hexane/dichloromethane/chloroform/
methanol/acetanitrile/water/ethylamine solvent gradient based on the
polarity of head group. High resolution (240 k at m/z 400)/accurate mass
(with mass accuracy ,5 ppm) and tandem mass spectrometry [collision
induced dissociation (CID) fragmentation] were used for molecular
species identification and quantification. The identity of lipid was further
confirmed by reference to appropriate lipids standards. The Orbitrap Elite
mass spectrometer operation conditions for positive-ion lipids analysis
were as follows: heated electrospray ionisation (ESI) source in positive
ESI mode, heater temperature of 325 C, sheath gas flow rate (arb) of 35,
aux gas flow rate (arb) of 5, sweep gas flow rate (arb) of 0, I spray
voltage of 3.5 kV, capillary temperature of 325 C, S-lens radio frequency
level of 60%. The Orbitrap mass analyser was operated as SIM scan
mode with two events. Event 1 – mass range, m/z 238–663; mass
resolution, 240 k at m/z 400. Event 2 – mass range, m/z 663–1088; mass
resolution, 240 k at m/z 400. The Orbitrap Elite mass spectrometer
operation conditions for negative ion lipids analysis were as follows:
heated ESI source in negative ESI mode, heater temperature of 325 C,
sheath gas flow rate (arb) of 45, aux gas flow rate (arb) of 10, sweep gas
flow rate (arb) of 0, I spray voltage of 3.0 kV, capillary temperature of
375C , S-lens RF level of 70%. The Orbitrap mass analyser was operated
as SIM scan mode with two events. Event 1 – mass range, m/z 218–628;
mass resolution, 240 k at m/z 400. Event 2 – mass range, m/z 628–1038;
mass resolution, 240 k at m/z 400. The ion trap mass analyser was
operated as dependent scan in CID mode at normal scan speed. All the
solvents used for lipid extraction and LC/MS/MS analysis are LC-MS
grade from Fisher Scientific.
For cholesterol and cholesterol ester analysis, the lipid extract was
acetylated with 170 ml acetyl chloride:chloroform (1:5) at room
temperature for 2 h. Solvent was removed at room temperature under
vacuum. The acetylated lipid was re-dissolved in 70 ml of 10 mM
ammonium acetate methanol:chloroform (3:1). A total of 7 ml was injected
by autosampler for ESI-MS/MS analysis using a Shimadzu Prominence
HPLC hyphenated with ABSciex 4000 QTRAP. 0.25 ml/min 10 mM
ammonium acetate methanol:chloroform (3:1) was pumped to the 4000
QTRAP source for ESI-MS/MS analysis. The following mass spectrometry
operation parameters were used. Source/gas parameters: curtain gas, 20;
collision gas, medium; IonSpray voltage, 5500; temperature, 400 C; ion
source gas 1, 45; ion source gas 2, 20; interface heater, on. Compound
parameters: entrance potential (EP), 9.0; collision cell exit potential (CXP),
11.0; declustering potential, 60 for cholesterol ester analysis and 50 for
acetylated cholesterol analysis; collision energy, 19 for cholesterol ester
analysis and 15 for acetylated cholesterol analysis. Unit resolution was
used for both Q1 Mass and Q3 Mass for multiple reaction monitoring
analysis of cholesterol ester and cholesterol.
Transfection and cell line generationHuh-7 cells were transfected using FuGENE 6 (Roche). For selection of
the expression of GFP-tagged gene products, G418 (Invitrogen) was used
at concentration of 400 mg/ml, with subsequent maintenance of the cells
at 100 mg/ml G418. pLKO-associated gene products were selected for
with puromycin (Invitrogen) at 10 mg/ml and their expression was
maintained with 1 mg/ml puromycin.
FFAR4 and FFAR1 vectors and shRNAshRNA clones for FFAR4 were purchased from Open Biosystem. The
sequence encoding the shRNA was 59-CCGGCCACCTGCTCTTCTACG-
TGATCTCGAGATCACGTAGAAGAGCAGGTGGTTTTT-39. Vectors
for FFAR4 and FFAR1 were kindly provided by Gozo Tsujimoto
(Hirasawa et al., 2005; Hara et al., 2009). NheI-EcoRI FFAR4-GFP was
RESEARCH ARTICLE Journal of Cell Science (2014) 127, 3104–3115 doi:10.1242/jcs.145854
3114

Jour
nal o
f Cel
l Sci
ence
cloned into XhoI-EcoRI pEGFP-C1. The primers were: 59 NheI-FFAR4-
GFP, 59-GCCGCCCCGGCTAGCATGTCCCCTGAATGCGCGCGGGCA-
39; 39 EcoRI-FFAR4-GFP, 59-GCTTCGAATTCTTTACTTGTACAGCT-
CGTCCAT-39. The 59 primer containing an XhoI site for cloning FFAR1 into
pEGFP-C1 was 59-CTCAGATCTCGAGCTGACCTGCCCCCGCAGCT-
CTCC-39. The 39 primer containing an EcoRI site for cloning FFAR1 into
pEGFP-C1 was 59-GCTTCGAATTCTTTACTTCTGGGACTTGCCCCC-
39. Introduction of the R270H mutation into the FFAR4-GFP vector was
performed using the 59 mutating R270H primer 59-AGCCACCAGATCCA-
CGTGTCCCAGCAG-39 and the 39 mutating R270H primer 59-CTGCTGG-
GACACGTGGATCTGGTGGCT-39.
Competing interestsThe authors declare no competing interests.
Author contributionsM.J.O.W., S.A.R. and A.R. conceived the project and designed the experimentalstrategy. A.R. performed the majority of the experiments, S.A.R. also performedexperiments and the molecular biology, and Q.Z. performed the massspectrometric lipid analysis. M.J.O.W., A.R. and S.A.R. wrote the manuscript.
FundingThis work was supported by the European Union FP7 LipidomicNet project; andby the Biotechnology and Biological Sciences Research Council (UK).
ReferencesAgarwal, A. K. andGarg, A. (2006). Genetic disorders of adipose tissue development,differentiation, and death. Annu. Rev. Genomics Hum. Genet. 7, 175-199.
Anderson, N. and Borlak, J. (2008). Molecular mechanisms and therapeutictargets in steatosis and steatohepatitis. Pharmacol. Rev. 60, 311-357.
Andersson, L., Bostrom, P., Ericson, J., Rutberg,M., Magnusson, B., Marchesan,D., Ruiz, M., Asp, L., Huang, P., Frohman, M. A. et al. (2006). PLD1 and ERK2regulate cytosolic lipid droplet formation. J. Cell Sci. 119, 2246-2257.
Athenstaedt, K., Zweytick, D., Jandrositz, A., Kohlwein, S. D. and Daum, G.(1999). Identification and characterization of major lipid particle proteins of theyeast Saccharomyces cerevisiae. J. Bacteriol. 181, 6441-6448.
Bell, M., Wang, H., Chen, H., McLenithan, J. C., Gong, D.-W., Yang, R.-Z., Yu,D., Fried, S. K., Quon, M. J., Londos, C. et al. (2008). Consequences of lipiddroplet coat protein downregulation in liver cells: abnormal lipid dropletmetabolism and induction of insulin resistance. Diabetes 57, 2037-2045.
Blouin, C. M., Le Lay, S., Eberl, A., Kofeler, H. C., Guerrera, I. C., Klein, C., LeLiepvre, X., Lasnier, F., Bourron, O., Gautier, J.-F. et al. (2010). Lipid dropletanalysis in caveolin-deficient adipocytes: alterations in surface phospholipidcomposition and maturation defects. J. Lipid Res. 51, 945-956.
Bostrom, P., Andersson, L., Li, L., Perkins, R., Højlund, K., Boren, J. andOlofsson, S.-O. (2009). The assembly of lipid droplets and its relation to cellularinsulin sensitivity. Biochem. Soc. Trans. 37, 981-985.
Boutet, E., El Mourabit, H., Prot, M., Nemani, M., Khallouf, E., Colard, O.,Maurice, M., Durand-Schneider, A.-M., Chretien, Y., Gres, S. et al. (2009).Seipin deficiency alters fatty acid Delta9 desaturation and lipid droplet formationin Berardinelli-Seip congenital lipodystrophy. Biochimie 91, 796-803.
Brasaemle, D. L. and Wolins, N. E. (2012). Packaging of fat: an evolving modelof lipid droplet assembly and expansion. J. Biol. Chem. 287, 2273-2279.
Cheng, J., Fujita, A., Ohsaki, Y., Suzuki, M., Shinohara, Y. and Fujimoto, T.(2009). Quantitative electron microscopy shows uniform incorporation oftriglycerides into existing lipid droplets. Histochem. Cell Biol. 132, 281-291.
Clark, J., Anderson, K. E., Juvin, V., Smith, T. S., Karpe, F., Wakelam, M. J. O.,Stephens, L. R. and Hawkins, P. T. (2011). Quantification of PtdInsP3molecular species in cells and tissues by mass spectrometry. Nat. Meth. 8, 267-272
Clement, S., Peyrou, M., Sanchez-Pareja, A., Bourgoin, L., Ramadori, P.,Suter, D., Vinciguerra, M., Guilloux, K., Pascarella, S., Rubbia-Brandt, L.et al. (2011). Down-regulation of phosphatase and tensin homolog by hepatitisC virus core 3a in hepatocytes triggers the formation of large lipid droplets.Hepatology 54, 38-49.
Digel, M., Ehehalt, R. and Fullekrug, J. (2010). Lipid droplets lighting up: insightsfrom live microscopy. FEBS Lett. 584, 2168-2175.
Fang, Y., Vilella-Bach, M., Bachmann, R., Flanigan, A. and Chen, J. (2001).Phosphatidic acid-mediated mitogenic activation of mTOR signaling. Science294, 1942-1945.
Fujimoto, T. and Ohsaki, Y. (2006). Cytoplasmic lipid droplets: rediscovery of anold structure as a unique platform. Ann. N. Y. Acad. Sci. 1086, 104-115.
Fujimoto, Y., Onoduka, J., Homma, K. J., Yamaguchi, S., Mori, M., Higashi, Y.,Makita, M., Kinoshita, T., Noda, J., Itabe, H. et al. (2006). Long-chain fattyacids induce lipid droplet formation in a cultured human hepatocyte in a mannerdependent of Acyl-CoA synthetase. Biol. Pharm. Bull. 29, 2174-2180.
Fujimoto, T., Ohsaki, Y., Cheng, J., Suzuki, M. and Shinohara, Y. (2008). Lipiddroplets: a classic organelle with new outfits. Histochem. Cell Biol. 130, 263-279.
Gaunt, E., Zhang, Q., Cheung, W., Wakelam, M. J. O., Lever, A. andDesselberger, U. (2013). Lipidome analysis of rotavirus-infected cells
confirms the close interaction of lipid droplets with viroplasms. J. Gen. Virol.94, 1576-1586.
Goodman, J. M. (2009). Demonstrated and inferred metabolism associated withcytosolic lipid droplets. J. Lipid Res. 50, 2148-2156.
Griffiths, B., Lewis, C. A., Bensaad, K., Ros, S., Zhang, Q., Ferber, E. C.,Konisti, S., Peck, B., Miess, H., East, P. et al. (2013). Sterol regulatory elementbinding protein-dependent regulation of lipid synthesis supports cell survival andtumor growth. Cancer and Metabolism 1, 3.
Hara, T., Hirasawa, A., Sun, Q., Koshimuzu, T. A., Itsubo, C., Sadakane, K.,Awaji, T. and Tsujimoto, G. (2009). Flow cytometry-based binding assay forGPR40 (FFAR1; free fatty acid receptor 1). Mol. Pharmacol. 75, 85-91
Hirasawa, A., Tsumaya, K., Awaji, T., Katsuma, S., Adachi, T., Yamada, M.,Sugimoto, Y., Miyazaki, S. and Tsujimoto, G. (2005). Free fatty acids regulategut incretin glucagon-like peptide-1 secretion through GPR120. Nat Med. 11,90-94
Hodges, B. D. M. and Wu, C. C. (2010). Proteomic insights into an expandedcellular role for cytoplasmic lipid droplets. J. Lipid Res. 51, 262-273.
Ichimura, A., Hirasawa, A., Poulain-Godefroy, O., Bonnefond, A., Hara, T.,Yengo, L., Kimura, I., Leloire, A., Liu, N., Iida, K. et al. (2012). Dysfunction oflipid sensor GPR120 leads to obesity in both mouse and human. Nature 483,350-354.
Kasai, T., Ohguchi, K., Nakashima, S., Ito, Y., Naganawa, T., Kondo, N. andNozawa, Y. (1998). Increased activity of oleate-dependent type phospholipaseD during actinomycin D-induced apoptosis in Jurkat T cells. J. Immunol. 161,6469-6474.
Khatchadourian, A., Bourque, S. D., Richard, V. R., Titorenko, V. I. andMaysinger, D. (2012). Dynamics and regulation of lipid droplet formation inlipopolysaccharide (LPS)-stimulated microglia. Biochim. Biophys. Acta 1821,607-617.
Long, A. P., Manneschmidt, A. K., VerBrugge, B., Dortch, M. R., Minkin, S. C.,Prater, K. E., Biggerstaff, J. P., Dunlap, J. R. and Dalhaimer, P. (2012). Lipiddroplet de novo formation and fission are linked to the cell cycle in fission yeast.Traffic 13, 705-714.
McDermott, M., Wakelam, M. J. O. and Morris, A. J. (2004). Phospholipase D.Biochem. Cell Biol. 82, 225-253.
Meex, R. C. R., Schrauwen, P. and Hesselink, M. K. C. (2009). Modulation ofmyocellular fat stores: lipid droplet dynamics in health and disease. Am.J. Physiol. 297, R913-R924.
Nakamura, N., Banno, Y. and Tamiya-Koizumi, K. (2005). Arf1-dependent PLD1is localized to oleic acid-induced lipid droplets in NIH3T3 cells. Biochem.Biophys. Res. Commun. 335, 117-123.
Neuschwander-Tetri, B. A. (2010). Nontriglyceride hepatic lipotoxicity: the newparadigm for the pathogenesis of NASH. Curr. Gastroenterol. Rep. 12, 49-56.
Norton, L. J., Zhang, Q., Saqib, K. M., Schrewe, H., Macura, K., Anderson,K. E., Lindsley, C. W., Brown, H. A., Rudge, S. A. and Wakelam, M. J. O.(2011). PLD1 rather than PLD2 regulates phorbol ester-, adhesion dependent-and Fcg receptor-stimulated reactive oxygen species production in neutrophils.J. Cell Sci. 124, 1973-1983
Paul, A., Chang, B. H.-J., Li, L., Yechoor, V. K. and Chan, L. (2008). Deficiencyof adipose differentiation-related protein impairs foam cell formation andprotects against atherosclerosis. Circ. Res. 102, 1492-1501.
Pettitt, T. R., McDermott, M., Saqib, K. M., Shimwell, N. and Wakelam, M. J. O.(2001). Phospholipase D1b and D2a generate structurally identical phosphatidicacid species in mammalian cells. Biochem. J. 360, 707-715.
Robenek, H., Buers, I., Hofnagel, O., Robenek, M. J., Troyer, D. and Severs,N. J. (2009). Compartmentalization of proteins in lipid droplet biogenesis.Biochim. Biophys. Acta 1791, 408-418.
Sato, S., Fukasawa, M., Yamakawa, Y., Natsume, T., Suzuki, T., Shoji, I.,Aizaki, H., Miyamura, T. and Nishijima, M. (2006). Proteomic profiling of lipiddroplet proteins in hepatoma cell lines expressing hepatitis C virus core protein.J. Biochem. 139, 921-930.
Schadinger, S. E., Bucher, N. L. R., Schreiber, B. M. and Farmer, S. R. (2005).PPARgamma2 regulates lipogenesis and lipid accumulation in steatotichepatocytes. Am. J. Physiol. 288, E1195-E1205.
Scott, S. A., Selvy, P. E., Buck, J. R., Cho, H. P., Criswell, T. L., Thomas, A. L.,Armstrong, M. D., Arteaga, C. L., Lindsley, C. W. and Brown, H. A. (2009).Design of isoform-selective phospholipase D inhibitors that modulate cancer cellinvasiveness. Nat. Chem. Biol. 5, 108-117.
Sturley, S. L. and Hussain, M. M. (2012). Lipid droplet formation on opposingsides of the endoplasmic reticulum. J. Lipid Res. 53, 1800-1810.
Tauchi-Sato, K., Ozeki, S., Houjou, T., Taguchi, R. and Fujimoto, T. (2002). Thesurface of lipid droplets is a phospholipid monolayer with a unique Fatty Acidcomposition. J. Biol. Chem. 277, 44507-44512.
Thiele, C. and Spandl, J. (2008). Cell biology of lipid droplets. Curr. Opin. CellBiol. 20, 378-385.
Vereshchagina, N. and Wilson, C. (2006). Cytoplasmic activated protein kinaseAkt regulates lipid-droplet accumulation in Drosophila nurse cells. Development133, 4731-4735.
Walther, T. C. and Farese, R. V., Jr (2009). The life of lipid droplets. Biochim.Biophys. Acta 1791, 459-466.
Wan, H.-C., Melo, R. C. N., Jin, Z., Dvorak, A. M. and Weller, P. F. (2007). Rolesand origins of leukocyte lipid bodies: proteomic and ultrastructural studies.FASEB J. 21, 167-178.
Zweytick, D., Athenstaedt, K. and Daum, G. (2000). Intracellular lipid particles ofeukaryotic cells. Biochim. Biophys. Acta 1469, 101-120.
RESEARCH ARTICLE Journal of Cell Science (2014) 127, 3104–3115 doi:10.1242/jcs.145854
3115