Embed Size (px)
Citation preview
MARINE ECOLOGY PROGRESS SERIESMar Ecol Prog Ser
Vol. 325: 29–42, 2006 Published November 7
INTRODUCTION
Gelatinous zooplankton occur throughout the watercolumn in all of the world’s oceans. When numerous,jellyfish commonly disrupt fisheries, tourism andcoastal industries. Whether the frequency and extentof such blooms have increased worldwide remains dis-putable; however, at local scales numerous examplesexist (Mills 2001, Lynam et al. 2004). The ecologicalimpact of jellyfish proliferations on foodweb structureand dynamics may at times be significant. For exam-ple, large jellyfish populations may directly controllarval fish (Purcell & Arai 2001) and zooplankton pop-
ulations (Olesen 1995). Reports on impact of jellyfishon lower trophic levels are few however, despite thepossibility of both indirect cascade effects (Stibor etal. 2004) and direct substrate generation (Hansson &Norrman 1995). Their voracious feeding activity onzooplankton and fish may potentially elicit cascadingeffects in pelagic foodwebs affecting trophic levelsdown to microbes. For instance, Priddle et al. (2003)demonstrated in the northern Scotia Sea that variationsin krill biomass change the relative impact of krill andcopepods on phytoplankton, which in turn regulatesnutrient cycles. Stibor et al. (2004) examined cascadingeffects on phytoplankton and found that jellyfish con-
© Inter-Research 2006 · www.int-res.com*Email: [email protected]
Links between jellyfish and microbes in a jellyfishdominated fjord
Lasse Riemann1,*, Josefin Titelman2, Ulf Båmstedt2, 3
1Department of Natural Sciences, Kalmar University, 39182 Kalmar, Sweden2Department of Biology, University of Bergen, PO Box 7800, 5020 Bergen, Norway
3Umeå Marine Science Centre, University of Umeå, Norrbyn, 91020 Hörnefors, Sweden
ABSTRACT: Research on the impact of mass aggregations of jellyfish on foodweb structure hasmainly focused on trophic control of copepods and fish larvae, while impacts on lower trophic levelshave received little attention. Jellyfish release nutrients and dissolved organic matter through theiractivities. Hence, both direct and cascading impacts of jellyfish on the bacterial community are con-ceivable. In the Norwegian Lurefjorden, the abundance of the deepwater scyphomedusa Periphyllaperiphylla reaches concentrations much higher than in any other area investigated. We used Lure-fjorden as a model system to examine effects of high jellyfish biomass on the microbial planktonicfoodweb, and targeted bacterial activity and community composition in relation to the distribution ofP. periphylla as monitored using a Remotely Operated Vehicle. P. periphylla performed pronounceddiel vertical migrations; however, no significant diel effects on microbial activity were observed insurface waters. Surface waters were characterized by a high biomass of mesozooplankton. Integrat-ing over 24 h, the highest jellyfish biomass was found at 200 to 300 m depth. This concurred with ele-vated total organic carbon, bacterial production and ectoenzymatic activities. Analysis of bacterio-plankton community composition by denaturing gradient gel electrophoresis (DGGE) and 16S rDNAsequencing revealed that specific phylotypes related to Bacteroidetes and to δ-Proteobacteria werefound with depth. Overall, phylotypes related to Bacteroidetes dominated the bacterial community.Our results indicate that P. periphylla has a structuring impact on the pelagic deep-water microbialcommunity in Lurefjorden. We suggest that jellyfish proliferations may also be quantitatively impor-tant for lower trophic levels of the pelagic foodweb.
KEY WORDS: Periphylla periphylla · Jellyfish · Bacteria · Community composition · DGGE
Resale or republication not permitted without written consent of the publisher
Mar Ecol Prog Ser 325: 29–42, 2006
sistently reduced copepod biomass while the net effecton algal biomass depended on initial cell size, andtheir susceptibility to copepod grazing. Altered phyto-plankton size distribution likely influences the releaseof organic carbon from algal cells (Bjørnsen 1988),which in turn, affects bacterial growth. Jellyfish bio-mass may also stimulate bacterial growth directlythrough release of nutrients (Schneider 1989, Nemazieet al. 1993) and bio-available dissolved organic matter(DOM) (Hansson & Norrman 1995, Titelman et al.2006, this volume). Hence, by modifying carbon andnutrient conditions jellyfish may potentially influencemicrobial community composition (Martinez et al.1996), however this has not yet been examined in situ.
Most jellyfish may undergo rapid population increa-ses, as well as aggregations, in response to changes infood availability and the physical environment. Natu-rally, the irregularity and unpredictability of these pro-liferations constrain studies of their impact on the con-comitant planktonic community. In a few Norwegianfjords, the perennial deepwater scyphomedusa Peri-phylla periphylla abounds year-round (Youngbluth &Båmstedt 2001) forming lasting mass-occurrences withaverage concentrations of ~0.4 m–3 in the deep basin ofLurefjorden (integrating over the entire water column,Sørnes 2005). Such concentrations are several orders ofmagnitude greater than in the open ocean (Young-bluth & Båmstedt 2001).
Here, Lurefjorden was used as a model system toexamine the effects of a persistently high jellyfish bio-mass on the planktonic foodweb and, especially, onbacterial activity and community composition. Wehypothesized that the diel vertical migration of jellyfish(Youngbluth & Båmstedt 2001) would cause an accu-mulation of jellyfish biomass near the surface at nightand at depth during the day, which through the releaseof bioavailable dissolved organic carbon and nutrients,would stimulate bacterial activity (Schneider 1989,Nemazie et al. 1993, Hansson & Norrman 1995) nearthe surface and at depth at day and night, respectively.We also hypothesized that the strong vertical gradientin jellyfish biomass would lead to changes in bacterialcommunity composition with depth.
MATERIALS AND METHODS
We examined the potential impact of the jellyfishbiomass and its tremendous diel biomass-movementon planktonic microbial activity and biomass in thedeep basin (max. depth 439 m) of Lurefjorden, WesternNorway, (60° 42.73’ N, 05° 05.60’ E) on April 22 to 23,2004. We conducted a 24 h study at 5 m depth, wherePeriphylla periphylla are completely absent duringdaytime, but abound at night, as well as a vertical pro-
file study to document changes during day and nightconditions. The hydrography of Lurefjorden and thebiology of P. periphylla is described in detail elsewhere(Eiane et al. 1999, Youngbluth & Båmstedt 2001).
For the 24 h study, water samples were obtainedfrom 5 m depth with 10 l Niskin bottles attached to arosette sampler every 3 h between 04:00 h April 22 and04:00 h April 23. The vertical profiles were performedat daytime (13:00 h) on April 22 and at nighttime(01:00 h) on April 23, where bottle samples were takenat 5, 25, 50, 100, 200 and 300 m depth. The water wastransferred to 10 l acid-washed containers and sam-pled for chlorophyll a (chl a), nutrients, total organiccarbon (TOC), bacterial production, aminopeptidaseand phosphatase activities, bacterial community DNA,and bacterial, viral, ciliate and copepod abundance.Temperature and salinity were measured simultane-ously during each sampling. The distribution and bio-mass of Periphylla periphylla was assessed from videoprofiles from a Remotely Operated Vehicle (ROV) andnet sampling, respectively.
Periphylla periphylla . Methods and equipmentassociated with sampling P. periphylla are described indetail elsewhere (Youngbluth & Båmstedt 2001, Sørnes2005) and therefore summarized only briefly here. Ver-tical distribution in the entire water column wasassessed from 6 video profiles on April 22–23 by theROV ‘Aglantha’ in the deep basin (320 to 439 m depth).The recordings were conducted at a ROV descent rateof ~0.5 m s–1. The depth of each jellyfish was deter-mined, and abundance was subsequently integrated in10 m depth intervals. To convert data to concentra-tions, we multiplied the vertical distance traveled withempirically determined horizontal surface areas of 2.31and 6.09 m2, determined for small (2 cm coronal diam-eter) and large (10 cm coronal diameter) P. periphylla(Youngbluth & Båmstedt 2001). Following Sørnes(2005) we report concentrations as ranges using the 2area factors, as jellyfish sizes cannot be accuratelydetermined with this video set-up. We complimentedthese data with direct surface counts at night.
Depth integrated Periphylla periphylla biomass wasobtained from vertical net tows (2 m mouth diameter,12.5 m long, 3 to 1 mm graded mesh size, plastic bagcod end) between the bottom and the surface at a rateof ~6 m min–1. The diameter of all animals was mea-sured to the nearest mm and their wet weight deter-mined to the nearest 0.1 g.
Chl a, nutrients and total organic carbon (TOC).Duplicate 1 l samples were filtered and chl a extractedin ethanol and measured using a Turner design 10-AUfluorometer (excitation 340 to 500 nm band pass;emission >665 nm cut-off) calibrated with a standardchl a solution (Sigma). For nitrate/nitrite, ammonia andphosphate, three 12 ml samples were filtered through
30
Riemann et al.: Influence of jellyfish on bacteria
glass fiber filters (Whatman GF/F) into 15 ml poly-propylene tubes and frozen until analysis using aBran & Luebbe TRAACS 800 autoanalyzer and stan-dard seawater methods (Grasshoff et al. 1983). ForTOC, duplicate 12 ml samples were frozen in 15 mlpolypropylene tubes and analyzed using a ShimadzuTOC-5000 high temperature catalytic oxidation instru-ment. Samples were acidified and sparged prior toanalysis. Calculation of carbon concentrations wasmade with potassium hydrogen phthalate as standardsubstance.
Ciliates. For ciliate counts, 250 ml samples werefixed with Lugol’s solution. Ciliates were enumeratedunder an inverted microscope using sedimentationchambers. Cell volumes (x; µm3) were estimated fromlength and width measurements, and converted to car-bon biomass (y; pg C) using the relationship deter-mined for protists: y = 0.216x0.939 (Menden-Deuer &Lessard 2000).
Mesozooplankton. Mesozooplankton from ~5 l wereconcentrated on a 45 µm mesh, preserved in formalin(4% final) and measured and identified under a dis-secting microscope. Prosome lengths (copepodids)and total lengths (nauplii) were converted to carbonweights using regressions in Rey-Rassat et al. (2004)(Calanus spp.), Sabatini & Kiørboe (1994) (Oithonasimilis, also used for Oncaea spp.), and Berggreen etal. (1988) (Acartia tonsa, used for all other species andfor nauplii).
Bacterial and viral abundance. Aliquots of 45 mlwere fixed with 0.2 µm filtered formalin (2% final) andstored at 4°C for 1 mo before bacterial and viral enu-meration. Bacteria were stained with SYTO 13 (Molec-ular Probes) and counted on a FACSCalibur flowcytometer (Becton Dickinson) (Gasol & del Giorgio2000) using fluorescent beads (True counts, BectonDickinson) as standards. For viral counts, 5 to 7 mlaliquots were filtered onto 0.02 µm Anodisc filters(Whatman), stained with SYBR Green I (Molecularprobes), and mounted in glycerol/p-phenylenediamine(Noble & Fuhrman 1998). More than 200 viruses filter–1
(or >15 fields filter–1) were counted at 1250× using epi-fluorescence microscopy (Zeiss Axioplan). Duplicatefilters were counted on 3 occasions. The coefficient ofvariation between duplicate filters was on average 7%.The bacterial and viral counts are probably conserva-tive because of the preservation in formalin (e.g. Wenet al. 2004).
Bacterial production. Bacterial production was mea-sured by [3H]-thymidine incorporation (Fuhrman &Azam 1982). For each sample, triplicate aliquots (10 ml)and a fixed blank were incubated with [methyl-3H]-thymidine (10 nM final, Amersham Pharmacia Biotech)in polyethylene vials in a water bath with flowing sur-face seawater on deck for ca. 1 h. Samples with 5%
trichloroacetic acid added prior to the addition of [3H]-thymidine were used as blanks. Samples were filteredonto 0.2 µm mixed cellulose ester filters (AdvantecMFS), rinsed carefully with ice-cold 5% trichloroaceticacid, and counted by liquid scintillation spectrometry.Bacterial carbon production was calculated using 1.1 ×10¹⁸ cells mol–1 thymidine incorporated (Riemann et al.1987) and a carbon-to-cell ratio of 20 fg C bacterium–1
(Lee & Fuhrman 1987).Hydrolytic ectoenzyme activities. Triplicate 4 ml
samples were incubated with fluorogenic substrates(methylumbelliferyl [MUF] and amino-methylcou-marin [AMC] derivatives, Sigma) to determine poten-tial hydrolysis rates. The substrates used (and enzymesassayed) were L-leucine-AMC (aminopeptidase) andMUF-phosphate (alkaline phosphatase). Substratehydrolysis rates were measured with a Turner TD-700fluorometer using heat-killed samples as controls. Thefluorometer was calibrated with standard solutions ofMUF and AMC (Sigma) and potential activities at200 µM substrate concentration were measured.
DNA filtration and extraction. For DNA extraction, 2to 3 liters of water was filtered through a 0.22 µmSterivex capsule filter (Millipore) via a peristalticpump. Filters were frozen at –20°C until extraction.DNA was extracted from filters using an enzyme/phe-nol-chloroform protocol as described in Riemann et al.(2000), but with a few modifications: a 30 min lysozymetreatment (5 mg ml–1, final) and an overnight pro-teinase K (2 mg ml–1 final) treatment at 55°C as opti-mized by Boström et al. (2004). DNA was re-suspendedin TE (10 mM Tris, 1 mM EDTA, pH 8.0) and quantifiedfluorometrically (PicoGreen; Molecular Probes).
PCR-amplification, DGGE and 16S rDNA sequenc-ing. Bacterial 16S rDNA was amplified using a Bacter-ial primer complementary to position 341 to 358 with a40 bp GC-clamp (Muyzer et al. 1993) and a universalprimer complementary to position 907 to 927 (Muyzeret al. 1998). PCR reactions (75 µl) contained 1X PCRbuffer with MgCl2 (Roche), 0.8 mM deoxynucleotidetriphosphates, 0.5 µM of each primer, ≈7.5 ng of tem-plate DNA, and 1.5 units of Taq polymerase (Roche).Initial denaturation was at 95°C for 2 min followed by athermal cycling program as follows: denaturation for30 s at 94°C; annealing for 30 s at an initial 63°C,decreasing 1°C every 2 cycles to a final of 53°C; exten-sion for 90 s at 72°C. Ten cycles were run at 53°C for atotal of 30 cycles followed by final 7 min incubationat 72°C. A negative control, in which the templatewas replaced by an equivalent volume of sterile water,was included in each batch of PCR reactions. Qualityand size of PCR products were verified by agarose gelelectrophoresis.
Duplicate 75 µl PCR reactions were pooled, purifiedusing the QIAquick Nucleotide Removal Kit (Qiagen),
31
Mar Ecol Prog Ser 325: 29–42, 2006
and quantified fluorometrically. We analysed 60 ngof PCR product by DGGE using the D Gene System(Bio-Rad) at 60°C for 6 h at 150 V (Riemann & Mid-delboe 2002). DGGE bands were excised, eluted, re-amplified, and cloned (Riemann & Winding 2001).DGGE profiles of re-amplified, cloned DNA were usedto check for heteroduplexes and to confirm the positionof cloned bands relative to the original sample. Insertswere bi-directionally sequenced using the DYE-namic™ ET terminator cycle sequencing kit (Amer-sham Biosciences) and an ABI PRISM 377 sequencer(Applied Biosystems) as described by the manufac-turer. Sequences were aligned to known sequencesusing BLAST (Altschul et al. 1990) and analyzed by theprogram Chimera Check (Cole et al. 2003). DGGEband sequences have been deposited in GenBank,using the abbreviations LUR 1 to 15 (LUR refers toLurefjorden), under the accession numbers (in order)AY960276 to AY960290.
RESULTS
Vertical study
Basic parameters
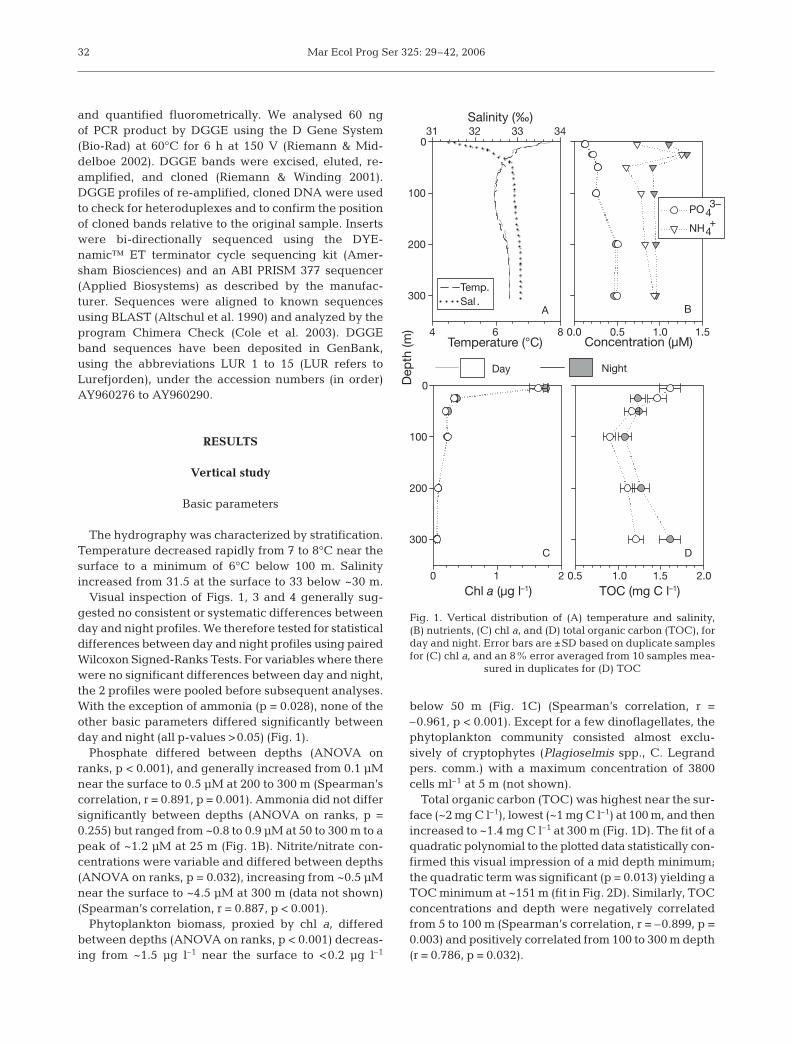
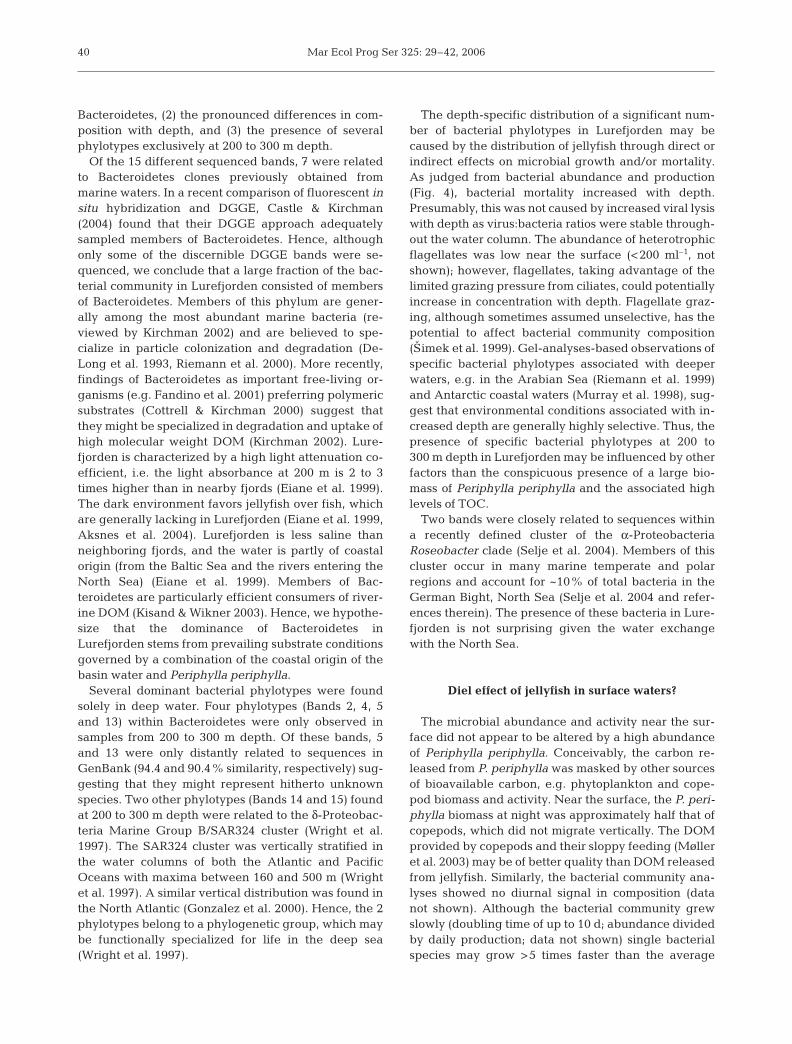
The hydrography was characterized by stratification.Temperature decreased rapidly from 7 to 8°C near thesurface to a minimum of 6°C below 100 m. Salinityincreased from 31.5 at the surface to 33 below ~30 m.
Visual inspection of Figs. 1, 3 and 4 generally sug-gested no consistent or systematic differences betweenday and night profiles. We therefore tested for statisticaldifferences between day and night profiles using pairedWilcoxon Signed-Ranks Tests. For variables where therewere no significant differences between day and night,the 2 profiles were pooled before subsequent analyses.With the exception of ammonia (p = 0.028), none of theother basic parameters differed significantly betweenday and night (all p-values >0.05) (Fig. 1).
Phosphate differed between depths (ANOVA onranks, p < 0.001), and generally increased from 0.1 µMnear the surface to 0.5 µM at 200 to 300 m (Spearman’scorrelation, r = 0.891, p = 0.001). Ammonia did not differsignificantly between depths (ANOVA on ranks, p =0.255) but ranged from ~0.8 to 0.9 µM at 50 to 300 m to apeak of ~1.2 µM at 25 m (Fig. 1B). Nitrite/nitrate con-centrations were variable and differed between depths(ANOVA on ranks, p = 0.032), increasing from ~0.5 µMnear the surface to ~4.5 µM at 300 m (data not shown)(Spearman’s correlation, r = 0.887, p < 0.001).
Phytoplankton biomass, proxied by chl a, differedbetween depths (ANOVA on ranks, p < 0.001) decreas-ing from ~1.5 µg l–1 near the surface to <0.2 µg l–1
below 50 m (Fig. 1C) (Spearman’s correlation, r =–0.961, p < 0.001). Except for a few dinoflagellates, thephytoplankton community consisted almost exclu-sively of cryptophytes (Plagioselmis spp., C. Legrandpers. comm.) with a maximum concentration of 3800cells ml–1 at 5 m (not shown).
Total organic carbon (TOC) was highest near the sur-face (~2 mg C l–1), lowest (~1 mg C l–1) at 100 m, and thenincreased to ~1.4 mg C l–1 at 300 m (Fig. 1D). The fit of aquadratic polynomial to the plotted data statistically con-firmed this visual impression of a mid depth minimum;the quadratic term was significant (p = 0.013) yielding aTOC minimum at ~151 m (fit in Fig. 2D). Similarly, TOCconcentrations and depth were negatively correlatedfrom 5 to 100 m (Spearman’s correlation, r = –0.899, p =0.003) and positively correlated from 100 to 300 m depth(r = 0.786, p = 0.032).
32
A
Temperature (°C)4 6 8
Dep
th (m
)
0
100
200
300
Salinity (‰)31 32 33 34
Temp.Sal .
D
TOC (mg C l–1)0.5 1.0 2.01.5
B
Concentration (µM)0.0 1.00.5 1.5
PO43–
NH4+
C
Chl a (µg l–1)0 1 2
0
100
200
300
Day Night
Fig. 1. Vertical distribution of (A) temperature and salinity, (B) nutrients, (C) chl a, and (D) total organic carbon (TOC), forday and night. Error bars are ±SD based on duplicate samplesfor (C) chl a, and an 8% error averaged from 10 samples mea-
sured in duplicates for (D) TOC
Riemann et al.: Influence of jellyfish on bacteria
Biomass and distribution of Periphylla periphylla
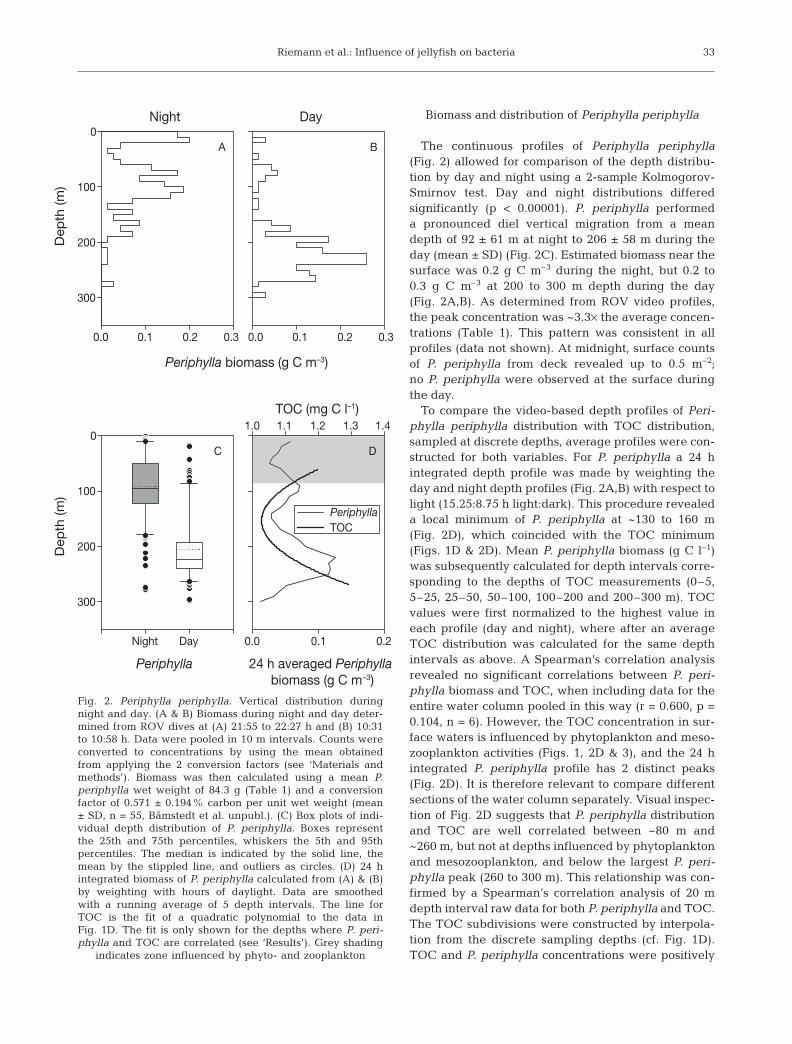
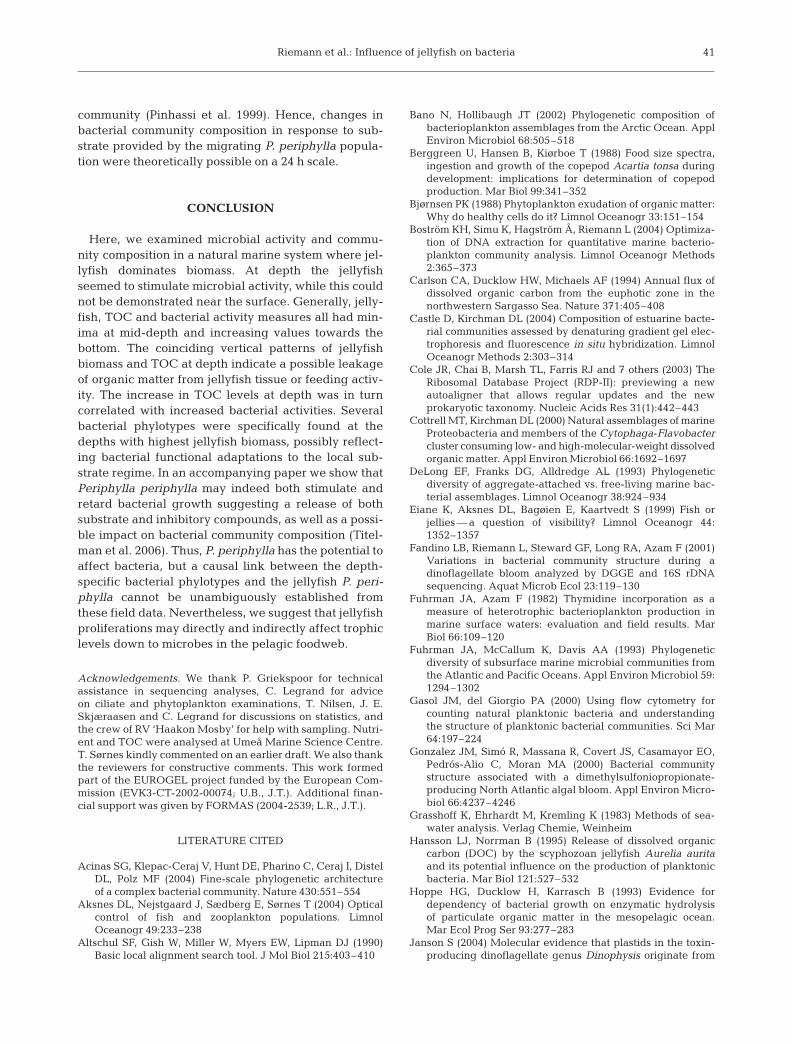
The continuous profiles of Periphylla periphylla(Fig. 2) allowed for comparison of the depth distribu-tion by day and night using a 2-sample Kolmogorov-Smirnov test. Day and night distributions differedsignificantly (p < 0.00001). P. periphylla performeda pronounced diel vertical migration from a meandepth of 92 ± 61 m at night to 206 ± 58 m during theday (mean ± SD) (Fig. 2C). Estimated biomass near thesurface was 0.2 g C m–3 during the night, but 0.2 to0.3 g C m–3 at 200 to 300 m depth during the day(Fig. 2A,B). As determined from ROV video profiles,the peak concentration was ~3.3× the average concen-trations (Table 1). This pattern was consistent in allprofiles (data not shown). At midnight, surface countsof P. periphylla from deck revealed up to 0.5 m–2;no P. periphylla were observed at the surface duringthe day.
To compare the video-based depth profiles of Peri-phylla periphylla distribution with TOC distribution,sampled at discrete depths, average profiles were con-structed for both variables. For P. periphylla a 24 hintegrated depth profile was made by weighting theday and night depth profiles (Fig. 2A,B) with respect tolight (15.25:8.75 h light:dark). This procedure revealeda local minimum of P. periphylla at ~130 to 160 m(Fig. 2D), which coincided with the TOC minimum(Figs. 1D & 2D). Mean P. periphylla biomass (g C l–1)was subsequently calculated for depth intervals corre-sponding to the depths of TOC measurements (0–5,5–25, 25–50, 50–100, 100–200 and 200–300 m). TOCvalues were first normalized to the highest value ineach profile (day and night), where after an averageTOC distribution was calculated for the same depthintervals as above. A Spearman’s correlation analysisrevealed no significant correlations between P. peri-phylla biomass and TOC, when including data for theentire water column pooled in this way (r = 0.600, p =0.104, n = 6). However, the TOC concentration in sur-face waters is influenced by phytoplankton and meso-zooplankton activities (Figs. 1, 2D & 3), and the 24 hintegrated P. periphylla profile has 2 distinct peaks(Fig. 2D). It is therefore relevant to compare differentsections of the water column separately. Visual inspec-tion of Fig. 2D suggests that P. periphylla distributionand TOC are well correlated between ~80 m and~260 m, but not at depths influenced by phytoplanktonand mesozooplankton, and below the largest P. peri-phylla peak (260 to 300 m). This relationship was con-firmed by a Spearman’s correlation analysis of 20 mdepth interval raw data for both P. periphylla and TOC.The TOC subdivisions were constructed by interpola-tion from the discrete sampling depths (cf. Fig. 1D).TOC and P. periphylla concentrations were positively
33
24 h averaged Periphylla biomass (g C m–3)
0.0 0.1 0.2
TOC (mg C l–1)1.0 1.1 1.2 1.3 1.4
PeriphyllaTOC
DC
Periphylla
Night
Night Day
Day
0
100
200
300
A
Periphylla biomass (g C m–3)
0.0 0.1 0.2 0.3 0.0 0.1 0.2 0.3
Dep
th (m
)D
epth
(m)
0
100
200
300
B
Fig. 2. Periphylla periphylla. Vertical distribution duringnight and day. (A & B) Biomass during night and day deter-mined from ROV dives at (A) 21:55 to 22:27 h and (B) 10:31to 10:58 h. Data were pooled in 10 m intervals. Counts wereconverted to concentrations by using the mean obtainedfrom applying the 2 conversion factors (see ‘Materials andmethods’). Biomass was then calculated using a mean P.periphylla wet weight of 84.3 g (Table 1) and a conversionfactor of 0.571 ± 0.194% carbon per unit wet weight (mean± SD, n = 55, Båmstedt et al. unpubl.). (C) Box plots of indi-vidual depth distribution of P. periphylla. Boxes representthe 25th and 75th percentiles, whiskers the 5th and 95thpercentiles. The median is indicated by the solid line, themean by the stippled line, and outliers as circles. (D) 24 hintegrated biomass of P. periphylla calculated from (A) & (B)by weighting with hours of daylight. Data are smoothedwith a running average of 5 depth intervals. The line forTOC is the fit of a quadratic polynomial to the data inFig. 1D. The fit is only shown for the depths where P. peri-phylla and TOC are correlated (see ‘Results’). Grey shading
indicates zone influenced by phyto- and zooplankton
Mar Ecol Prog Ser 325: 29–42, 2006
correlated between 80 and 260 m (r = 0.667, p = 0.025,n = 9). When including depths below the P. periphyllapeak (i.e. >260 m) or above 80 m the correlations breakdown.
Biomass and distribution of micro- and mesozooplankton
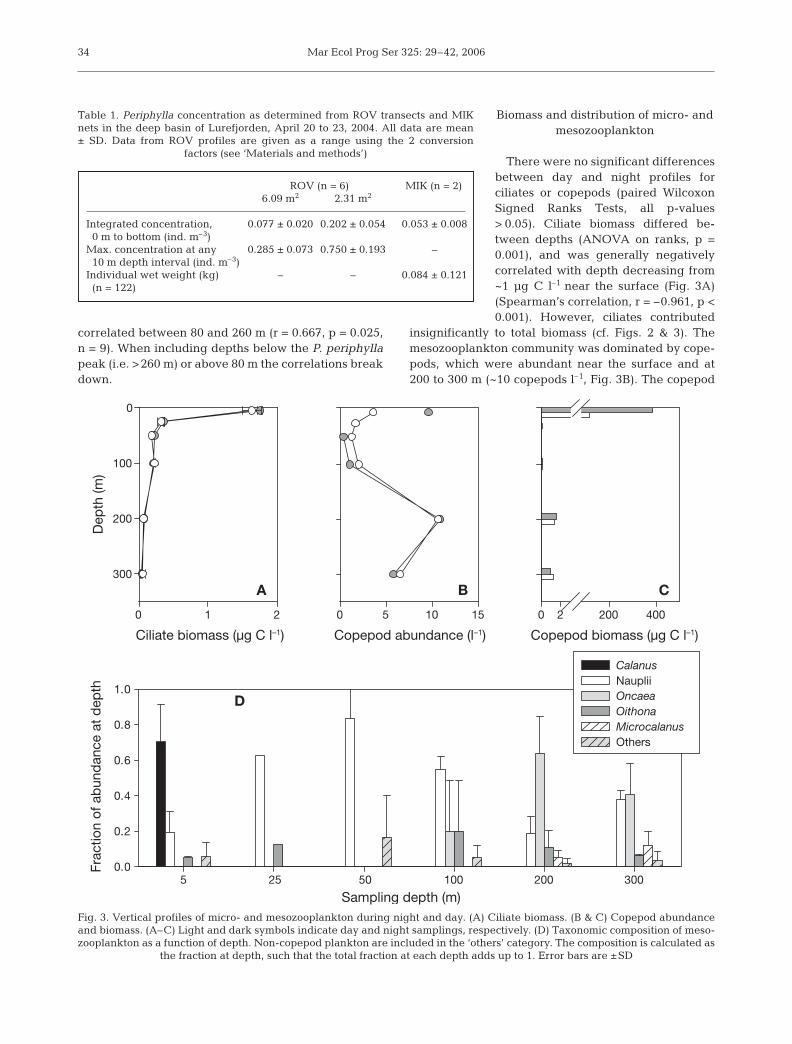
There were no significant differencesbetween day and night profiles forciliates or copepods (paired WilcoxonSigned Ranks Tests, all p-values> 0.05). Ciliate biomass differed be-tween depths (ANOVA on ranks, p =0.001), and was generally negativelycorrelated with depth decreasing from~1 µg C l–1 near the surface (Fig. 3A)(Spearman’s correlation, r = –0.961, p <0.001). However, ciliates contributed
insignificantly to total biomass (cf. Figs. 2 & 3). Themesozooplankton community was dominated by cope-pods, which were abundant near the surface and at200 to 300 m (~10 copepods l–1, Fig. 3B). The copepod
34
Table 1. Periphylla concentration as determined from ROV transects and MIKnets in the deep basin of Lurefjorden, April 20 to 23, 2004. All data are mean± SD. Data from ROV profiles are given as a range using the 2 conversion
factors (see ‘Materials and methods’)
ROV (n = 6) MIK (n = 2)6.09 m2 2.31 m2
Integrated concentration, 0.077 ± 0.020 0.202 ± 0.054 0.053 ± 0.0080 m to bottom (ind. m–3)
Max. concentration at any 0.285 ± 0.073 0.750 ± 0.193 –10 m depth interval (ind. m–3)
Individual wet weight (kg) – – 0.084 ± 0.121(n = 122)
B
Copepod abundance (l–1)
0 5 10 15
C
0 2 200 400
A
Ciliate biomass (µg C l–1) Copepod biomass (µg C l–1)
0 1 2
Dep
th (m
)
0
100
200
300
D
Sampling depth (m)5 25 50 100 200 300
Frac
tion
of a
bun
dan
ce a
t d
epth
0.0
0.2
0.4
0.6
0.8
1.0
CalanusNaupliiOncaeaOithonaMicrocalanusOthers
Fig. 3. Vertical profiles of micro- and mesozooplankton during night and day. (A) Ciliate biomass. (B & C) Copepod abundanceand biomass. (A–C) Light and dark symbols indicate day and night samplings, respectively. (D) Taxonomic composition of meso-zooplankton as a function of depth. Non-copepod plankton are included in the ‘others’ category. The composition is calculated as
the fraction at depth, such that the total fraction at each depth adds up to 1. Error bars are ±SD
Riemann et al.: Influence of jellyfish on bacteria
community was dominated numerically by Calanusspp. copepodite stages near the surface and by smallcopepods (mainly Oncaea spp., Oithona spp. and nau-plii) at 200 to 300 m depth (Fig. 3D). Copepod biomassdiffered between depths (ANOVA on ranks, p < 0.001).Calanus spp. dominated the copepod biomass, as evi-dent from the ≥100-fold higher values at 5 m relative tothe other depths. The many nauplii and small cope-pods at depth contributed comparatively little to thebiomass (Fig. 3C).
Microbial abundance and activity
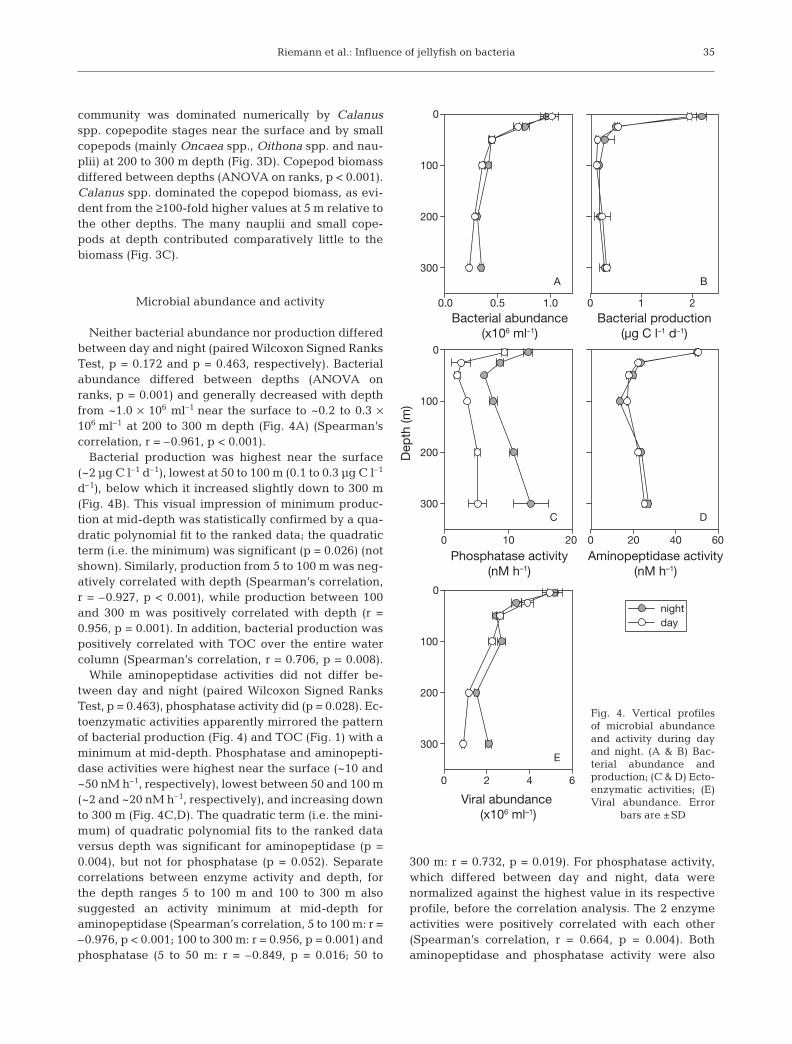
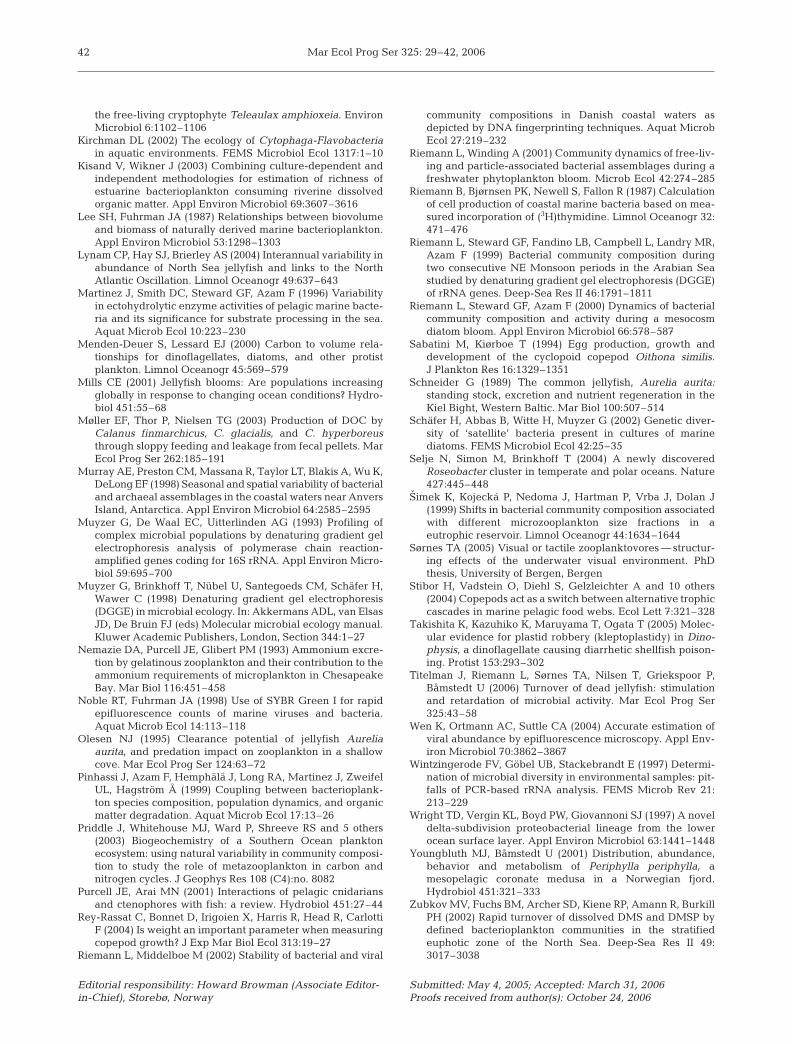
Neither bacterial abundance nor production differedbetween day and night (paired Wilcoxon Signed RanksTest, p = 0.172 and p = 0.463, respectively). Bacterialabundance differed between depths (ANOVA onranks, p = 0.001) and generally decreased with depthfrom ~1.0 × 10⁶ ml–1 near the surface to ~0.2 to 0.3 ×10⁶ ml–1 at 200 to 300 m depth (Fig. 4A) (Spearman’scorrelation, r = –0.961, p < 0.001).
Bacterial production was highest near the surface(~2 µg C l–1 d–1), lowest at 50 to 100 m (0.1 to 0.3 µg C l–1
d–1), below which it increased slightly down to 300 m(Fig. 4B). This visual impression of minimum produc-tion at mid-depth was statistically confirmed by a qua-dratic polynomial fit to the ranked data; the quadraticterm (i.e. the minimum) was significant (p = 0.026) (notshown). Similarly, production from 5 to 100 m was neg-atively correlated with depth (Spearman’s correlation,r = –0.927, p < 0.001), while production between 100and 300 m was positively correlated with depth (r =0.956, p = 0.001). In addition, bacterial production waspositively correlated with TOC over the entire watercolumn (Spearman’s correlation, r = 0.706, p = 0.008).
While aminopeptidase activities did not differ be-tween day and night (paired Wilcoxon Signed RanksTest, p = 0.463), phosphatase activity did (p = 0.028). Ec-toenzymatic activities apparently mirrored the patternof bacterial production (Fig. 4) and TOC (Fig. 1) with aminimum at mid-depth. Phosphatase and aminopepti-dase activities were highest near the surface (~10 and~50 nM h–1, respectively), lowest between 50 and 100 m(~2 and ~20 nM h–1, respectively), and increasing downto 300 m (Fig. 4C,D). The quadratic term (i.e. the mini-mum) of quadratic polynomial fits to the ranked dataversus depth was significant for aminopeptidase (p =0.004), but not for phosphatase (p = 0.052). Separatecorrelations between enzyme activity and depth, forthe depth ranges 5 to 100 m and 100 to 300 m alsosuggested an activity minimum at mid-depth foraminopeptidase (Spearman’s correlation, 5 to 100 m: r =–0.976, p < 0.001; 100 to 300 m: r = 0.956, p = 0.001) andphosphatase (5 to 50 m: r = –0.849, p = 0.016; 50 to
300 m: r = 0.732, p = 0.019). For phosphatase activity,which differed between day and night, data werenormalized against the highest value in its respectiveprofile, before the correlation analysis. The 2 enzymeactivities were positively correlated with each other(Spearman’s correlation, r = 0.664, p = 0.004). Bothaminopeptidase and phosphatase activity were also
35
A
Bacterial abundance(x106 ml–1)
0.0 0.5 1.0 0 1 2
0
100
200
300
nightday
B
Bacterial production(µg C l–1 d–1)
C
Phosphatase activity(nM h–1)
0 10 20 0 20 40 60
Dep
th (m
)
0
100
200
300D
Aminopeptidase activity(nM h–1)
E
Viral abundance (x106 ml–1)
0 2 4 6
0
100
200
300
Fig. 4. Vertical profilesof microbial abundanceand activity during dayand night. (A & B) Bac-terial abundance andproduction; (C & D) Ecto-enzymatic activities; (E)Viral abundance. Error
bars are ±SD
Mar Ecol Prog Ser 325: 29–42, 2006
positively correlated with TOC over the entire watercolumn (Spearman’s correlation, r = 0.806, p = 0.001,and r = 0.547, p = 0.041, respectively). However, whilebacterial production and aminopeptidase activity weresignificantly correlated (Spearman’s correlation, r =0.755, p = 0.002), the correlation was not significantfor phosphatase activity (r = 0.455, p = 0.074).
Viral abundance did not differ between day and night(Wilcoxon’s paired rank test, p = 0.345), but differed be-tween depths (ANOVA on ranks, p = 0.001). Viral abun-dance was negatively correlated with depth (Spearman,r = –0.933, p < 0.001) decreasing from ~5 × 10⁶ ml–1 nearthe surface to ~1–2 × 10⁶ ml–1 at 200 to 300 m (Fig. 4E).Viral abundance was positively correlated with bothbacterial abundance (Spearman, r = 0.965, p < 0.001,1-tailed) and bacterial production (Spearman, r = 0.545,p = 0.033) over the entire water column.
Bacterial community composition
We used PCR-DGGE analysis of 16S rDNA to exam-ine bacterial community composition. Ideally, thisanalysis provides a graphical ‘fingerprint’ of the bacte-rial community composition. Potential biases inherentin the DNA extraction and PCR-DGGE protocols aredescribed elsewhere (Wintzingerode et al. 1997,Muyzer et al. 1998).
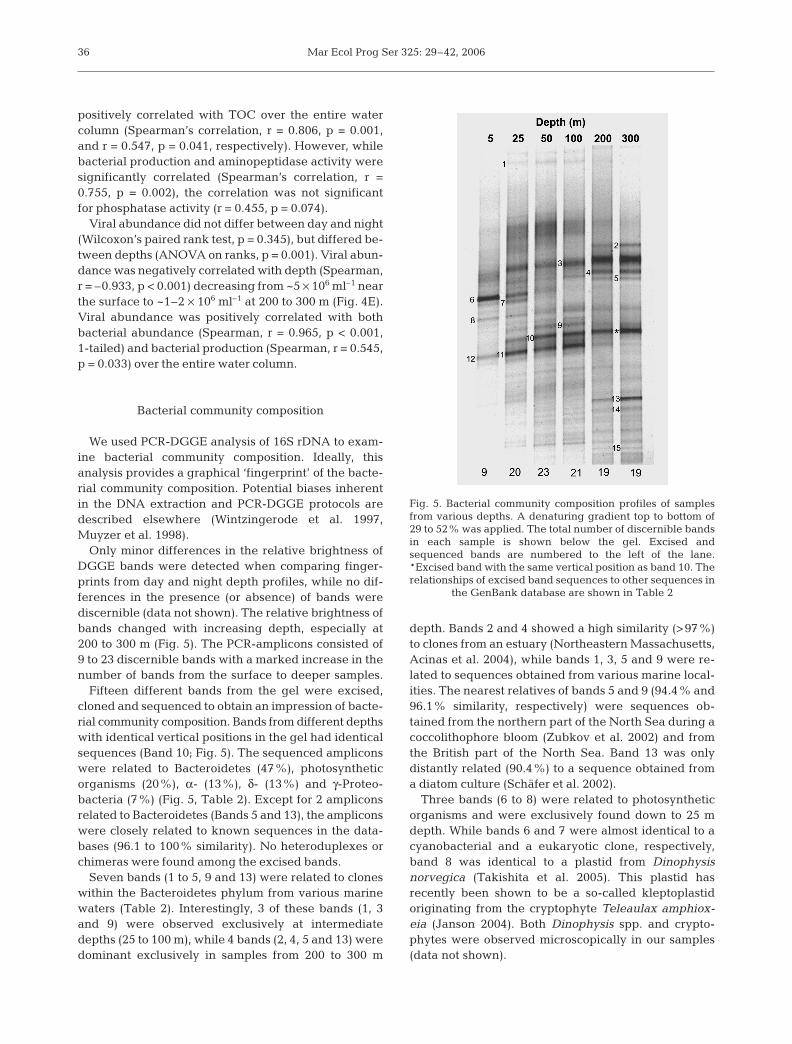
Only minor differences in the relative brightness ofDGGE bands were detected when comparing finger-prints from day and night depth profiles, while no dif-ferences in the presence (or absence) of bands werediscernible (data not shown). The relative brightness ofbands changed with increasing depth, especially at200 to 300 m (Fig. 5). The PCR-amplicons consisted of9 to 23 discernible bands with a marked increase in thenumber of bands from the surface to deeper samples.
Fifteen different bands from the gel were excised,cloned and sequenced to obtain an impression of bacte-rial community composition. Bands from different depthswith identical vertical positions in the gel had identicalsequences (Band 10; Fig. 5). The sequenced ampliconswere related to Bacteroidetes (47%), photosyntheticorganisms (20%), α- (13%), δ- (13%) and γ-Proteo-bacteria (7%) (Fig. 5, Table 2). Except for 2 ampliconsrelated to Bacteroidetes (Bands 5 and 13), the ampliconswere closely related to known sequences in the data-bases (96.1 to 100% similarity). No heteroduplexes orchimeras were found among the excised bands.
Seven bands (1 to 5, 9 and 13) were related to cloneswithin the Bacteroidetes phylum from various marinewaters (Table 2). Interestingly, 3 of these bands (1, 3and 9) were observed exclusively at intermediatedepths (25 to 100 m), while 4 bands (2, 4, 5 and 13) weredominant exclusively in samples from 200 to 300 m
depth. Bands 2 and 4 showed a high similarity (>97%)to clones from an estuary (Northeastern Massachusetts,Acinas et al. 2004), while bands 1, 3, 5 and 9 were re-lated to sequences obtained from various marine local-ities. The nearest relatives of bands 5 and 9 (94.4% and96.1% similarity, respectively) were sequences ob-tained from the northern part of the North Sea during acoccolithophore bloom (Zubkov et al. 2002) and fromthe British part of the North Sea. Band 13 was onlydistantly related (90.4%) to a sequence obtained froma diatom culture (Schäfer et al. 2002).
Three bands (6 to 8) were related to photosyntheticorganisms and were exclusively found down to 25 mdepth. While bands 6 and 7 were almost identical to acyanobacterial and a eukaryotic clone, respectively,band 8 was identical to a plastid from Dinophysisnorvegica (Takishita et al. 2005). This plastid hasrecently been shown to be a so-called kleptoplastidoriginating from the cryptophyte Teleaulax amphiox-eia (Janson 2004). Both Dinophysis spp. and crypto-phytes were observed microscopically in our samples(data not shown).
36
Fig. 5. Bacterial community composition profiles of samplesfrom various depths. A denaturing gradient top to bottom of29 to 52% was applied. The total number of discernible bandsin each sample is shown below the gel. Excised andsequenced bands are numbered to the left of the lane.*Excised band with the same vertical position as band 10. Therelationships of excised band sequences to other sequences in
the GenBank database are shown in Table 2
Riemann et al.: Influence of jellyfish on bacteria
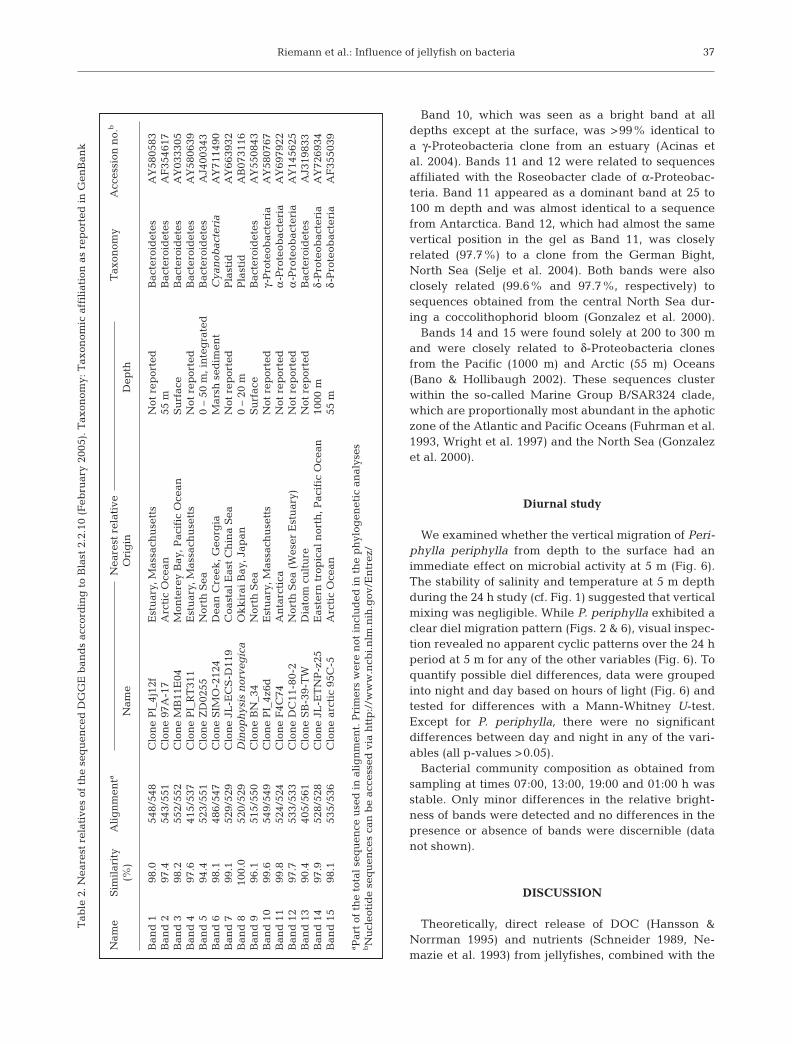
Band 10, which was seen as a bright band at alldepths except at the surface, was >99% identical toa γ-Proteobacteria clone from an estuary (Acinas etal. 2004). Bands 11 and 12 were related to sequencesaffiliated with the Roseobacter clade of α-Proteobac-teria. Band 11 appeared as a dominant band at 25 to100 m depth and was almost identical to a sequencefrom Antarctica. Band 12, which had almost the samevertical position in the gel as Band 11, was closelyrelated (97.7%) to a clone from the German Bight,North Sea (Selje et al. 2004). Both bands were alsoclosely related (99.6% and 97.7%, respectively) tosequences obtained from the central North Sea dur-ing a coccolithophorid bloom (Gonzalez et al. 2000).
Bands 14 and 15 were found solely at 200 to 300 mand were closely related to δ-Proteobacteria clonesfrom the Pacific (1000 m) and Arctic (55 m) Oceans(Bano & Hollibaugh 2002). These sequences clusterwithin the so-called Marine Group B/SAR324 clade,which are proportionally most abundant in the aphoticzone of the Atlantic and Pacific Oceans (Fuhrman et al.1993, Wright et al. 1997) and the North Sea (Gonzalezet al. 2000).
Diurnal study
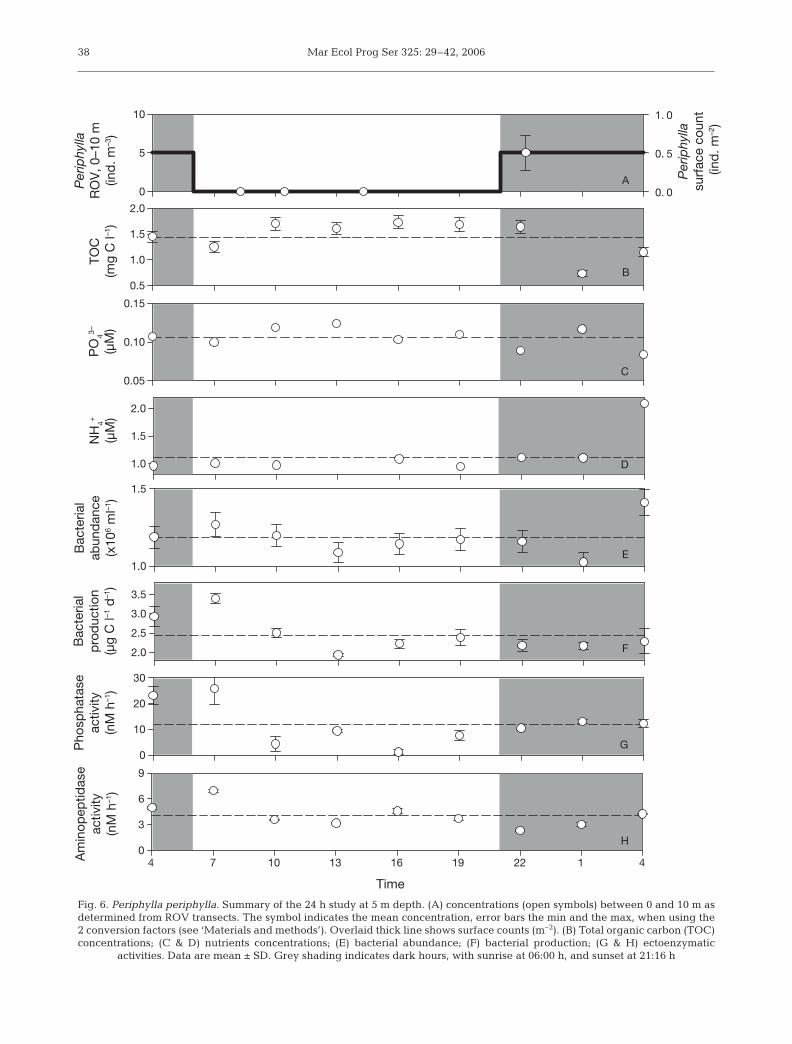
We examined whether the vertical migration of Peri-phylla periphylla from depth to the surface had animmediate effect on microbial activity at 5 m (Fig. 6).The stability of salinity and temperature at 5 m depthduring the 24 h study (cf. Fig. 1) suggested that verticalmixing was negligible. While P. periphylla exhibited aclear diel migration pattern (Figs. 2 & 6), visual inspec-tion revealed no apparent cyclic patterns over the 24 hperiod at 5 m for any of the other variables (Fig. 6). Toquantify possible diel differences, data were groupedinto night and day based on hours of light (Fig. 6) andtested for differences with a Mann-Whitney U-test.Except for P. periphylla, there were no significantdifferences between day and night in any of the vari-ables (all p-values >0.05).
Bacterial community composition as obtained fromsampling at times 07:00, 13:00, 19:00 and 01:00 h wasstable. Only minor differences in the relative bright-ness of bands were detected and no differences in thepresence or absence of bands were discernible (datanot shown).
DISCUSSION
Theoretically, direct release of DOC (Hansson &Norrman 1995) and nutrients (Schneider 1989, Ne-mazie et al. 1993) from jellyfishes, combined with the
37
Tab
le 2
. Nea
rest
rel
ativ
es o
f th
e se
qu
ence
d D
GG
E b
and
s ac
cord
ing
to
Bla
st 2
.2.1
0 (F
ebru
ary
2005
). T
axon
omy:
Tax
onom
ic a
ffil
iati
on a
s re
por
ted
in
Gen
Ban
k
Nam
eS
imil
arit
yA
lig
nm
enta
Nea
rest
rel
ativ
eT
axon
omy
Acc
essi
on n
o.b
(%)
Nam
eO
rig
inD
epth
Ban
d 1
98.0
548/
548
Clo
ne
PI_
4j12
f E
stu
ary,
Mas
sach
use
tts
Not
rep
orte
dB
acte
roid
etes
AY
5805
83B
and
297
.454
3/55
1C
lon
e 97
A-1
7 A
rcti
c O
cean
55 m
Bac
tero
idet
esA
F35
4617
Ban
d 3
98.2
552/
552
Clo
ne
MB
11E
04M
onte
rey
Bay
, Pac
ific
Oce
anS
urf
ace
Bac
tero
idet
esA
Y03
3305
Ban
d 4
97.6
415/
537
Clo
ne
PI_
RT
311
Est
uar
y, M
assa
chu
sett
sN
ot r
epor
ted
Bac
tero
idet
esA
Y58
0639
Ban
d 5
94.4
523/
551
Clo
ne
ZD
0255
Nor
th S
ea0
– 50
m, i
nte
gra
ted
Bac
tero
idet
esA
J400
343
Ban
d 6
98.1
486/
547
Clo
ne
SIM
O-2
124
Dea
n C
reek
, Geo
rgia
Mar
sh s
edim
ent
Cya
nob
acte
ria
AY
7114
90B
and
799
.152
9/52
9C
lon
e JL
-EC
S-D
119
Coa
stal
Eas
t C
hin
a S
eaN
ot r
epor
ted
Pla
stid
AY
6639
32B
and
810
0.0
520/
529
Din
oph
ysis
nor
veg
ica
Ok
kir
ai B
ay, J
apan
0 –
20 m
Pla
stid
AB
0731
16B
and
996
.151
5/55
0C
lon
e B
N_3
4N
orth
Sea
Su
rfac
eB
acte
roid
etes
AY
5508
43B
and
10
99.6
549/
549
Clo
ne
PI_
4z6d
E
stu
ary,
Mas
sach
use
tts
Not
rep
orte
dγ-
Pro
teob
acte
ria
AY
5807
67B
and
11
99.8
524/
524
Clo
ne
F4C
74
An
tarc
tica
Not
rep
orte
dα-
Pro
teob
acte
ria
AY
6979
22B
and
12
97.7
533/
533
Clo
ne
DC
11-8
0-2
Nor
th S
ea (
Wes
er E
stu
ary)
Not
rep
orte
dα-
Pro
teob
acte
ria
AY
1456
25B
and
13
90.4
405/
561
Clo
ne
SB
-39-
TW
Dia
tom
cu
ltu
reN
ot r
epor
ted
Bac
tero
idet
esA
J319
833
Ban
d 1
497
.952
8/52
8C
lon
e JL
-ET
NP
-z25
Eas
tern
tro
pic
al n
orth
, Pac
ific
Oce
an10
00 m
δ-P
rote
obac
teri
aA
Y72
6934
Ban
d 1
598
.153
5/53
6C
lon
e ar
ctic
95C
-5A
rcti
c O
cean
55 m
δ-P
rote
obac
teri
aA
F35
5039
a Par
t of
th
e to
tal
seq
uen
ce u
sed
in
ali
gn
men
t. P
rim
ers
wer
e n
ot i
ncl
ud
ed i
n t
he
ph
ylog
enet
ic a
nal
yses
bN
ucl
eoti
de
seq
uen
ces
can
be
acce
ssed
via
htt
p:/
/ww
w.n
cbi.
nlm
.nih
.gov
/En
trez
/
Mar Ecol Prog Ser 325: 29–42, 200638
Bac
teria
lab
und
ance
(x10
6 m
l–1)
1.0
1.5
TOC
(mg
C l–1
)
0.5
1.0
1.5
2.0
Bac
teria
lp
rod
uctio
n(µ
g C
l–1 d
–1)
2.0
2.5
3.0
3.5
Pho
spha
tase
activ
ity(n
M h
–1)
0
10
20
30
Time
4 7 10 13 16 19 22 1 4Am
inop
eptid
ase
activ
ity(n
M h
–1)
0
3
6
9
PO
43–
(µM
)
0.05
0.10
0.15
NH
4+
(µM
)
1.0
1.5
2.0
Per
iphy
llaR
OV
, 0–1
0 m
(ind
. m–3
)
0
5
10
Per
iphy
lla
surf
ace
coun
t (in
d. m
–2)
0. 0
0. 5
1. 0
A
B
C
D
E
F
G
H
Fig. 6. Periphylla periphylla. Summary of the 24 h study at 5 m depth. (A) concentrations (open symbols) between 0 and 10 m asdetermined from ROV transects. The symbol indicates the mean concentration, error bars the min and the max, when using the2 conversion factors (see ‘Materials and methods’). Overlaid thick line shows surface counts (m–2). (B) Total organic carbon (TOC)concentrations; (C & D) nutrients concentrations; (E) bacterial abundance; (F) bacterial production; (G & H) ectoenzymatic
activities. Data are mean ± SD. Grey shading indicates dark hours, with sunrise at 06:00 h, and sunset at 21:16 h
Riemann et al.: Influence of jellyfish on bacteria
re-structuring impact of jellyfish predation on highertrophic levels (Olesen 1995, Purcell & Arai 2001, Stiboret al. 2004) should affect bacterial growth conditionsthrough changes in substrate quantity and quality.Hence, changes in bacterial community compositionwould be expected (Martinez et al. 1996). Here, weused Lurefjorden as a model of a jellyfish dominatedsystem to examine effects of a large vertically migratingjellyfish population on microbial abundance, activityand community composition in situ. In an accompany-ing study, we demonstrated that dead Periphyllaperiphylla may stimulate as well as inhibit growth ofvarious bacterial species (Titelman et al. 2006).
Coupling between jellyfish, TOC and bacterialactivity at depth?
Given the >15 h of daylight at the time of sampling,>50% of the Periphylla periphylla biomass was locatedat 200 to 300 m depth when integrating over a day(Fig. 2D). Interestingly, the depth of minimum P. peri-phylla concentrations coincided with the TOC mini-mum. We attribute the subsurface elevated levels inTOC to the large P. periphylla biomass at depth, as wecan rule out alternative explanations related to mixingand activities of other biota. Marine subsurface max-ima of TOC resulting from a deep mixing event havebeen observed in the Sargasso Sea (Carlson et al.1994). For Lurefjorden mixing is an unlikely explana-tion for the mid-water TOC minimum and elevatedTOC levels at depth, as water exchange is restrictedprimarily to the layer above the sill, while the rest ofthe water column is vertically stable (sill depth = 20 m;Youngbluth & Båmstedt 2001, Sørnes 2005). P. peri-phylla dominates the pelagic biomass in Lurefjorden.The number of jellyfish was recently estimated from4 yr of surveying to be 0.4 ± 0.25 P. periphylla m–3 yearround (Sørnes 2005). The biomass of other biota,whose activities could potentially contribute to theTOC pool (e.g. Møller et al. 2003), is generally insignif-icant in the deeper parts of Lurefjorden (Figs. 1 & 3;Båmstedt & Youngbluth 2001, Sørnes 2005).
The combination of only 3 discrete TOC samplingdepths, which were not influenced by phytoplanktonproductivity (100, 200 and 300 m), and a continuousprofiling of Periphylla periphylla with 2 distinct peakshamper statistical analyses; correlations betweenP. periphylla biomass and TOC are not significant atsuch large depth intervals (and low n). However, inter-polation and subdividing into 20 m intervals yielded asignificant correlation between TOC and P. periphyllabetween 80 and 260 m, i.e. at depths around and belowthe minimum TOC (see ‘Results’). It is not surprisingthat TOC and P. periphylla profiles do not correlate
perfectly at large depths, as the resolution of the TOCsampling was much lower than that of the P. periphyllasampling; i.e. there are no TOC samples from theP. periphylla peak. Also, the amplitude of the P. peri-phylla migration varies with season with deeper distri-bution in autumn (Sørnes 2005), which may influencethe TOC distribution at greater depths.
The pattern of a TOC minimum at ~100 to 150 mwith increasing levels towards the bottom was accom-panied by quantitatively similar patterns in bacterialproduction and ectoenzymatic activities. Bacterialactivities were higher at 200 to 300 m relative to thoseat 100 m depth. This is in contrast to the North Atlantic,where bacterial production and enzyme activity de-crease steadily with depth (0 to 300 m, Hoppe et al.1993). Here we observed significant correlations be-tween TOC and measures of bacterial activity. Hence,it is tempting to speculate that the elevated bacterialactivity with depth in Lurefjorden is due to readilyaccessible carbon released by the Periphylla peri-phylla. Hansson & Norrman (1995) found that the jelly-fish Aurelia aurita stimulated bacterial growth byreleasing ~1 mg DOC ind.–1 d–1. They speculated thatthis release may be quantitatively important in semi-enclosed systems with many jellyfish (Hansson & Nor-rman 1995). Physiological differences between P. peri-phylla and A. aurita may bias attempts to calculate therelease of DOC from P. periphylla, as may the widesize variation in P. periphylla (0.05 to 2000 g, Sørnes2005). However, directly applying the weight normal-ized release rate of A. aurita (0.012 mg C [g wet weightjellyfish]–1 d–1; Hansson & Norrman 1995), P. periphyllaROV concentrations of 0.75 m–3, and a mean wetweight of 84 g (Table 1) suggest release rates of~0.8 mg C m–3 d–1 in the layers of high P. periphyllaabundance. The persistent P. periphylla population, incombination with the limited water exchange in Lure-fjorden (Sørnes 2005), may thus contribute substan-tially to the DOC pool at depth on a yearly basis. In anaccompanying paper, we found that dead P. periphyllaleak TOC at rates as high as 0.5 mg C (g wet weightjellyfish)–1 d–1 (Titelman et al. 2006).
Bacterial community composition
To our knowledge, the DGGE and 16S rDNA ana-lyses performed here provide the first informationavailable on bacterial community composition from amarine system consistently dominated by jellyfish. Thenumber of discernible bands was from 9 to 23, which iswell within the range usually reported for marinewaters (e.g. Fandino et al. 2001, Riemann & Middelboe2002). The most striking findings from the analyseswere (1) the profound dominance of phylotypes within
39
Mar Ecol Prog Ser 325: 29–42, 2006
Bacteroidetes, (2) the pronounced differences in com-position with depth, and (3) the presence of severalphylotypes exclusively at 200 to 300 m depth.
Of the 15 different sequenced bands, 7 were relatedto Bacteroidetes clones previously obtained frommarine waters. In a recent comparison of fluorescent insitu hybridization and DGGE, Castle & Kirchman(2004) found that their DGGE approach adequatelysampled members of Bacteroidetes. Hence, althoughonly some of the discernible DGGE bands were se-quenced, we conclude that a large fraction of the bac-terial community in Lurefjorden consisted of membersof Bacteroidetes. Members of this phylum are gener-ally among the most abundant marine bacteria (re-viewed by Kirchman 2002) and are believed to spe-cialize in particle colonization and degradation (De-Long et al. 1993, Riemann et al. 2000). More recently,findings of Bacteroidetes as important free-living or-ganisms (e.g. Fandino et al. 2001) preferring polymericsubstrates (Cottrell & Kirchman 2000) suggest thatthey might be specialized in degradation and uptake ofhigh molecular weight DOM (Kirchman 2002). Lure-fjorden is characterized by a high light attenuation co-efficient, i.e. the light absorbance at 200 m is 2 to 3times higher than in nearby fjords (Eiane et al. 1999).The dark environment favors jellyfish over fish, whichare generally lacking in Lurefjorden (Eiane et al. 1999,Aksnes et al. 2004). Lurefjorden is less saline thanneighboring fjords, and the water is partly of coastalorigin (from the Baltic Sea and the rivers entering theNorth Sea) (Eiane et al. 1999). Members of Bac-teroidetes are particularly efficient consumers of river-ine DOM (Kisand & Wikner 2003). Hence, we hypothe-size that the dominance of Bacteroidetes inLurefjorden stems from prevailing substrate conditionsgoverned by a combination of the coastal origin of thebasin water and Periphylla periphylla.
Several dominant bacterial phylotypes were foundsolely in deep water. Four phylotypes (Bands 2, 4, 5and 13) within Bacteroidetes were only observed insamples from 200 to 300 m depth. Of these bands, 5and 13 were only distantly related to sequences inGenBank (94.4 and 90.4% similarity, respectively) sug-gesting that they might represent hitherto unknownspecies. Two other phylotypes (Bands 14 and 15) foundat 200 to 300 m depth were related to the δ-Proteobac-teria Marine Group B/SAR324 cluster (Wright et al.1997). The SAR324 cluster was vertically stratified inthe water columns of both the Atlantic and PacificOceans with maxima between 160 and 500 m (Wrightet al. 1997). A similar vertical distribution was found inthe North Atlantic (Gonzalez et al. 2000). Hence, the 2phylotypes belong to a phylogenetic group, which maybe functionally specialized for life in the deep sea(Wright et al. 1997).
The depth-specific distribution of a significant num-ber of bacterial phylotypes in Lurefjorden may becaused by the distribution of jellyfish through direct orindirect effects on microbial growth and/or mortality.As judged from bacterial abundance and production(Fig. 4), bacterial mortality increased with depth.Presumably, this was not caused by increased viral lysiswith depth as virus:bacteria ratios were stable through-out the water column. The abundance of heterotrophicflagellates was low near the surface (<200 ml–1, notshown); however, flagellates, taking advantage of thelimited grazing pressure from ciliates, could potentiallyincrease in concentration with depth. Flagellate graz-ing, although sometimes assumed unselective, has thepotential to affect bacterial community composition(Simek et al. 1999). Gel-analyses-based observations ofspecific bacterial phylotypes associated with deeperwaters, e.g. in the Arabian Sea (Riemann et al. 1999)and Antarctic coastal waters (Murray et al. 1998), sug-gest that environmental conditions associated with in-creased depth are generally highly selective. Thus, thepresence of specific bacterial phylotypes at 200 to300 m depth in Lurefjorden may be influenced by otherfactors than the conspicuous presence of a large bio-mass of Periphylla periphylla and the associated highlevels of TOC.
Two bands were closely related to sequences withina recently defined cluster of the α-ProteobacteriaRoseobacter clade (Selje et al. 2004). Members of thiscluster occur in many marine temperate and polarregions and account for ~10% of total bacteria in theGerman Bight, North Sea (Selje et al. 2004 and refer-ences therein). The presence of these bacteria in Lure-fjorden is not surprising given the water exchangewith the North Sea.
Diel effect of jellyfish in surface waters?
The microbial abundance and activity near the sur-face did not appear to be altered by a high abundanceof Periphylla periphylla. Conceivably, the carbon re-leased from P. periphylla was masked by other sourcesof bioavailable carbon, e.g. phytoplankton and cope-pod biomass and activity. Near the surface, the P. peri-phylla biomass at night was approximately half that ofcopepods, which did not migrate vertically. The DOMprovided by copepods and their sloppy feeding (Mølleret al. 2003) may be of better quality than DOM releasedfrom jellyfish. Similarly, the bacterial community ana-lyses showed no diurnal signal in composition (datanot shown). Although the bacterial community grewslowly (doubling time of up to 10 d; abundance dividedby daily production; data not shown) single bacterialspecies may grow >5 times faster than the average
40
Riemann et al.: Influence of jellyfish on bacteria
community (Pinhassi et al. 1999). Hence, changes inbacterial community composition in response to sub-strate provided by the migrating P. periphylla popula-tion were theoretically possible on a 24 h scale.
CONCLUSION
Here, we examined microbial activity and commu-nity composition in a natural marine system where jel-lyfish dominates biomass. At depth the jellyfishseemed to stimulate microbial activity, while this couldnot be demonstrated near the surface. Generally, jelly-fish, TOC and bacterial activity measures all had min-ima at mid-depth and increasing values towards thebottom. The coinciding vertical patterns of jellyfishbiomass and TOC at depth indicate a possible leakageof organic matter from jellyfish tissue or feeding activ-ity. The increase in TOC levels at depth was in turncorrelated with increased bacterial activities. Severalbacterial phylotypes were specifically found at thedepths with highest jellyfish biomass, possibly reflect-ing bacterial functional adaptations to the local sub-strate regime. In an accompanying paper we show thatPeriphylla periphylla may indeed both stimulate andretard bacterial growth suggesting a release of bothsubstrate and inhibitory compounds, as well as a possi-ble impact on bacterial community composition (Titel-man et al. 2006). Thus, P. periphylla has the potential toaffect bacteria, but a causal link between the depth-specific bacterial phylotypes and the jellyfish P. peri-phylla cannot be unambiguously established fromthese field data. Nevertheless, we suggest that jellyfishproliferations may directly and indirectly affect trophiclevels down to microbes in the pelagic foodweb.
Acknowledgements. We thank P. Griekspoor for technicalassistance in sequencing analyses, C. Legrand for adviceon ciliate and phytoplankton examinations, T. Nilsen, J. E.Skjæraasen and C. Legrand for discussions on statistics, andthe crew of RV ‘Haakon Mosby’ for help with sampling. Nutri-ent and TOC were analysed at Umeå Marine Science Centre.T. Sørnes kindly commented on an earlier draft. We also thankthe reviewers for constructive comments. This work formedpart of the EUROGEL project funded by the European Com-mission (EVK3-CT-2002-00074; U.B., J.T.). Additional finan-cial support was given by FORMAS (2004-2539; L.R., J.T.).
LITERATURE CITED
Acinas SG, Klepac-Ceraj V, Hunt DE, Pharino C, Ceraj I, DistelDL, Polz MF (2004) Fine-scale phylogenetic architectureof a complex bacterial community. Nature 430:551–554
Aksnes DL, Nejstgaard J, Sædberg E, Sørnes T (2004) Opticalcontrol of fish and zooplankton populations. LimnolOceanogr 49:233–238
Altschul SF, Gish W, Miller W, Myers EW, Lipman DJ (1990)Basic local alignment search tool. J Mol Biol 215:403–410
Bano N, Hollibaugh JT (2002) Phylogenetic composition ofbacterioplankton assemblages from the Arctic Ocean. ApplEnviron Microbiol 68:505–518
Berggreen U, Hansen B, Kiørboe T (1988) Food size spectra,ingestion and growth of the copepod Acartia tonsa duringdevelopment: implications for determination of copepodproduction. Mar Biol 99:341–352
Bjørnsen PK (1988) Phytoplankton exudation of organic matter:Why do healthy cells do it? Limnol Oceanogr 33:151–154
Boström KH, Simu K, Hagström Å, Riemann L (2004) Optimiza-tion of DNA extraction for quantitative marine bacterio-plankton community analysis. Limnol Oceanogr Methods2:365–373
Carlson CA, Ducklow HW, Michaels AF (1994) Annual flux ofdissolved organic carbon from the euphotic zone in thenorthwestern Sargasso Sea. Nature 371:405–408
Castle D, Kirchman DL (2004) Composition of estuarine bacte-rial communities assessed by denaturing gradient gel elec-trophoresis and fluorescence in situ hybridization. LimnolOceanogr Methods 2:303–314
Cole JR, Chai B, Marsh TL, Farris RJ and 7 others (2003) TheRibosomal Database Project (RDP-II): previewing a newautoaligner that allows regular updates and the newprokaryotic taxonomy. Nucleic Acids Res 31(1):442–443
Cottrell MT, Kirchman DL (2000) Natural assemblages of marineProteobacteria and members of the Cytophaga-Flavobactercluster consuming low- and high-molecular-weight dissolvedorganic matter. Appl Environ Microbiol 66:1692–1697
DeLong EF, Franks DG, Alldredge AL (1993) Phylogeneticdiversity of aggregate-attached vs. free-living marine bac-terial assemblages. Limnol Oceanogr 38:924–934
Eiane K, Aksnes DL, Bagøien E, Kaartvedt S (1999) Fish orjellies — a question of visibility? Limnol Oceanogr 44:1352–1357
Fandino LB, Riemann L, Steward GF, Long RA, Azam F (2001)Variations in bacterial community structure during adinoflagellate bloom analyzed by DGGE and 16S rDNAsequencing. Aquat Microb Ecol 23:119–130
Fuhrman JA, Azam F (1982) Thymidine incorporation as ameasure of heterotrophic bacterioplankton production inmarine surface waters: evaluation and field results. MarBiol 66:109–120
Fuhrman JA, McCallum K, Davis AA (1993) Phylogeneticdiversity of subsurface marine microbial communities fromthe Atlantic and Pacific Oceans. Appl Environ Microbiol 59:1294–1302
Gasol JM, del Giorgio PA (2000) Using flow cytometry forcounting natural planktonic bacteria and understandingthe structure of planktonic bacterial communities. Sci Mar64:197–224
Gonzalez JM, Simó R, Massana R, Covert JS, Casamayor EO,Pedrós-Alio C, Moran MA (2000) Bacterial communitystructure associated with a dimethylsulfoniopropionate-producing North Atlantic algal bloom. Appl Environ Micro-biol 66:4237–4246
Grasshoff K, Ehrhardt M, Kremling K (1983) Methods of sea-water analysis. Verlag Chemie, Weinheim
Hansson LJ, Norrman B (1995) Release of dissolved organiccarbon (DOC) by the scyphozoan jellyfish Aurelia auritaand its potential influence on the production of planktonicbacteria. Mar Biol 121:527–532
Hoppe HG, Ducklow H, Karrasch B (1993) Evidence fordependency of bacterial growth on enzymatic hydrolysisof particulate organic matter in the mesopelagic ocean.Mar Ecol Prog Ser 93:277–283
Janson S (2004) Molecular evidence that plastids in the toxin-producing dinoflagellate genus Dinophysis originate from
41
Mar Ecol Prog Ser 325: 29–42, 2006
the free-living cryptophyte Teleaulax amphioxeia. EnvironMicrobiol 6:1102–1106
Kirchman DL (2002) The ecology of Cytophaga-Flavobacteriain aquatic environments. FEMS Microbiol Ecol 1317:1–10
Kisand V, Wikner J (2003) Combining culture-dependent andindependent methodologies for estimation of richness ofestuarine bacterioplankton consuming riverine dissolvedorganic matter. Appl Environ Microbiol 69:3607–3616
Lee SH, Fuhrman JA (1987) Relationships between biovolumeand biomass of naturally derived marine bacterioplankton.Appl Environ Microbiol 53:1298–1303
Lynam CP, Hay SJ, Brierley AS (2004) Interannual variability inabundance of North Sea jellyfish and links to the NorthAtlantic Oscillation. Limnol Oceanogr 49:637–643
Martinez J, Smith DC, Steward GF, Azam F (1996) Variabilityin ectohydrolytic enzyme activities of pelagic marine bacte-ria and its significance for substrate processing in the sea.Aquat Microb Ecol 10:223–230
Menden-Deuer S, Lessard EJ (2000) Carbon to volume rela-tionships for dinoflagellates, diatoms, and other protistplankton. Limnol Oceanogr 45:569–579
Mills CE (2001) Jellyfish blooms: Are populations increasingglobally in response to changing ocean conditions? Hydro-biol 451:55–68
Møller EF, Thor P, Nielsen TG (2003) Production of DOC byCalanus finmarchicus, C. glacialis, and C. hyperboreusthrough sloppy feeding and leakage from fecal pellets. MarEcol Prog Ser 262:185–191
Murray AE, Preston CM, Massana R, Taylor LT, Blakis A, Wu K,DeLong EF (1998) Seasonal and spatial variability of bacterialand archaeal assemblages in the coastal waters near AnversIsland, Antarctica. Appl Environ Microbiol 64:2585–2595
Muyzer G, De Waal EC, Uitterlinden AG (1993) Profiling ofcomplex microbial populations by denaturing gradient gelelectrophoresis analysis of polymerase chain reaction-amplified genes coding for 16S rRNA. Appl Environ Micro-biol 59:695–700
Muyzer G, Brinkhoff T, Nübel U, Santegoeds CM, Schäfer H,Wawer C (1998) Denaturing gradient gel electrophoresis(DGGE) in microbial ecology. In: Akkermans ADL, van ElsasJD, De Bruin FJ (eds) Molecular microbial ecology manual.Kluwer Academic Publishers, London, Section 344:1–27
Nemazie DA, Purcell JE, Glibert PM (1993) Ammonium excre-tion by gelatinous zooplankton and their contribution to theammonium requirements of microplankton in ChesapeakeBay. Mar Biol 116:451–458
Noble RT, Fuhrman JA (1998) Use of SYBR Green I for rapidepifluorescence counts of marine viruses and bacteria.Aquat Microb Ecol 14:113–118
Olesen NJ (1995) Clearance potential of jellyfish Aureliaaurita, and predation impact on zooplankton in a shallowcove. Mar Ecol Prog Ser 124:63–72
Pinhassi J, Azam F, Hemphälä J, Long RA, Martinez J, ZweifelUL, Hagström Å (1999) Coupling between bacterioplank-ton species composition, population dynamics, and organicmatter degradation. Aquat Microb Ecol 17:13–26
Priddle J, Whitehouse MJ, Ward P, Shreeve RS and 5 others(2003) Biogeochemistry of a Southern Ocean planktonecosystem: using natural variability in community composi-tion to study the role of metazooplankton in carbon andnitrogen cycles. J Geophys Res 108 (C4):no. 8082
Purcell JE, Arai MN (2001) Interactions of pelagic cnidariansand ctenophores with fish: a review. Hydrobiol 451:27–44
Rey-Rassat C, Bonnet D, Irigoien X, Harris R, Head R, CarlottiF (2004) Is weight an important parameter when measuringcopepod growth? J Exp Mar Biol Ecol 313:19–27
Riemann L, Middelboe M (2002) Stability of bacterial and viral
community compositions in Danish coastal waters asdepicted by DNA fingerprinting techniques. Aquat MicrobEcol 27:219–232
Riemann L, Winding A (2001) Community dynamics of free-liv-ing and particle-associated bacterial assemblages during afreshwater phytoplankton bloom. Microb Ecol 42:274–285
Riemann B, Bjørnsen PK, Newell S, Fallon R (1987) Calculationof cell production of coastal marine bacteria based on mea-sured incorporation of (3H)thymidine. Limnol Oceanogr 32:471–476
Riemann L, Steward GF, Fandino LB, Campbell L, Landry MR,Azam F (1999) Bacterial community composition duringtwo consecutive NE Monsoon periods in the Arabian Seastudied by denaturing gradient gel electrophoresis (DGGE)of rRNA genes. Deep-Sea Res II 46:1791–1811
Riemann L, Steward GF, Azam F (2000) Dynamics of bacterialcommunity composition and activity during a mesocosmdiatom bloom. Appl Environ Microbiol 66:578–587
Sabatini M, Kiørboe T (1994) Egg production, growth anddevelopment of the cyclopoid copepod Oithona similis.J Plankton Res 16:1329–1351
Schneider G (1989) The common jellyfish, Aurelia aurita:standing stock, excretion and nutrient regeneration in theKiel Bight, Western Baltic. Mar Biol 100:507–514
Schäfer H, Abbas B, Witte H, Muyzer G (2002) Genetic diver-sity of ‘satellite’ bacteria present in cultures of marinediatoms. FEMS Microbiol Ecol 42:25–35
Selje N, Simon M, Brinkhoff T (2004) A newly discoveredRoseobacter cluster in temperate and polar oceans. Nature427:445–448
Simek K, Kojecká P, Nedoma J, Hartman P, Vrba J, Dolan J(1999) Shifts in bacterial community composition associatedwith different microzooplankton size fractions in aeutrophic reservoir. Limnol Oceanogr 44:1634–1644
Sørnes TA (2005) Visual or tactile zooplanktovores — structur-ing effects of the underwater visual environment. PhDthesis, University of Bergen, Bergen
Stibor H, Vadstein O, Diehl S, Gelzleichter A and 10 others(2004) Copepods act as a switch between alternative trophiccascades in marine pelagic food webs. Ecol Lett 7:321–328
Takishita K, Kazuhiko K, Maruyama T, Ogata T (2005) Molec-ular evidence for plastid robbery (kleptoplastidy) in Dino-physis, a dinoflagellate causing diarrhetic shellfish poison-ing. Protist 153:293–302
Titelman J, Riemann L, Sørnes TA, Nilsen T, Griekspoor P,Båmstedt U (2006) Turnover of dead jellyfish: stimulationand retardation of microbial activity. Mar Ecol Prog Ser325:43–58
Wen K, Ortmann AC, Suttle CA (2004) Accurate estimation ofviral abundance by epifluorescence microscopy. Appl Env-iron Microbiol 70:3862–3867
Wintzingerode FV, Göbel UB, Stackebrandt E (1997) Determi-nation of microbial diversity in environmental samples: pit-falls of PCR-based rRNA analysis. FEMS Microb Rev 21:213–229
Wright TD, Vergin KL, Boyd PW, Giovannoni SJ (1997) A noveldelta-subdivision proteobacterial lineage from the lowerocean surface layer. Appl Environ Microbiol 63:1441–1448
Youngbluth MJ, Båmstedt U (2001) Distribution, abundance,behavior and metabolism of Periphylla periphylla, amesopelagic coronate medusa in a Norwegian fjord.Hydrobiol 451:321–333
Zubkov MV, Fuchs BM, Archer SD, Kiene RP, Amann R, BurkillPH (2002) Rapid turnover of dissolved DMS and DMSP bydefined bacterioplankton communities in the stratifiedeuphotic zone of the North Sea. Deep-Sea Res II 49:3017–3038
42
Editorial responsibility: Howard Browman (Associate Editor-in-Chief), Storebø, Norway
Submitted: May 4, 2005; Accepted: March 31, 2006Proofs received from author(s): October 24, 2006