Embed Size (px)
Citation preview
LINKING VEGETABLE GROWERS TO FIVE-STAR HOTELS – AGRICULTURAL
MARKETING PERSPECTIVE
By
PRIYANKA V
B.Sc. Agricultural Marketing and Co-operation
CHAUDHARY CHARAN SINGH NATIONAL INSTITUTE OF AGRICULTURAL
MARKETING
JAIPUR, RAJASTHAN - 302033
2019
LINKING VEGETABLE GROWERS TO FIVE-STAR HOTELS – AGRICULTURAL
MARKETING PROSPECTIVE
Report submitted in fulfillment of the requirement for
Research Internship Programme
To
Chaudhary Charan Singh National Institute of Agricultural Marketing,
Jaipur, Rajasthan
By
Priyanka V
B.Sc. Agricultural Marketing and Co-operation
CHAUDHARY CHARAN SINGH NATIONAL INSTITUTE OF AGRICULTURAL
MARKETING
JAIPUR, RAJASTHAN – 302033
2019
CERTIFICATE
This is to certify that the report entitled, “LINKING VEGETABLE GROWERS TO FIVE-
STAR HOTELS -AGRICULTURAL MARKETING PERSPECTIVE” submitted in
fulfillment of Research Internship Programme to Chaudhary Charan Singh National
Institute of Agricultural Marketing, Jaipur, Rajasthan is a record of bonafide research work
carried out by Ms. PRIYANKA V under my supervision and guidance and that no part of the
report has been submitted for the award of any other degree, diploma, fellowships or other
similar titles or prizes.
Place: Jaipur
Date:
Approved By
ACKNOWLEDGEMENT
This research process would have never come to achievement without the help and
encouragement I received from various individuals.
I feel immense pleasure in placing my deep sense of gratitude and sincere thanks
to beloved Dr. SATISH CHANDRA PANT, Assistant Professor, CCS National Institute of
Agricultural Marketing, for his continued encouragement during the various stages of the
research process. I feel extreme happiness to the opportunity conferred upon me to work
under his guidance.
A special gratitude I gave to Dr. P CHANDRA SHEKARA, Director General,
NIAM for all his support, motivation, valuable suggestions and guidance.
I’m thankful to Dr. R K MISHRA, Professor and HOD, Department of Agricultural
Economics, OUAT, Bhubaneshwar, who informed and guided for this golden opportunity.
I would express my heartfelt thanks to Ms. Shika Verma, Training Consultant, CCS
NIAM, who supports me a lot in all stages. Special thanks for her support and
encouragement throughout my research.
Finally, I am thankful to God, without whose mediation, this opportunity to further
my life’s goal could not have been realized.
(PRIYANKA V)
CONTENTS
CHAPTER TITLE PAGE
I INTRODUCTION 1-5
II REVIEW OF LITERATURE 6
III DESCRIPTION OF STUDY AREA 7-8
IV METHODOLOGY 9-11
V RESULTS AND DISCUSSION 12-21
VI SUMMARY AND CONCLUSION 22-23
ANNEXURE
ABSTRACT
LINKING VEGETABLE GROWERS TO FIVE-STAR HOTELS
India has a thriving and well- acclaimed hospitality industry. Food is the most
important part of the business. It has to maintain quality and quantity standards. As the
phrase “Farm-to-table” speaks, the study is an attempt to channelize farmer to the hotel
industry for the betterment of farming community as well as for the hoteliers. On one side
hoteliers are serving their clients and feeding number of visitors. On the other hand, they
are serving number of farmers indirectly by buying vegetables. People everywhere are
looking for a more locally authentic experience, starting with what they eat, leading to an
increased scrutiny on the origin and the procurement of their food. The surge can benefit
hotels with an opportunity to adjust their menus to provide fresher foods that draw guests
and farmers to increase their income and marketing platforms. The study is performed in
Karnataka state, For the best results Sheraton and Taj group of hotels and J Venkatapura
village of Sidlaghatta Taluk in Chikkballapur District were studied. A sample of 30 farmers
were selected randomly, primary data was collected and analysed. As it is evident that the
grocery bill of hotels is very high, even though the vegetable growers sell the vegetables at
very meagre price. This price gap is due to the many economic reasons, among those
intermediaries and quality aspects plays a major role. This price gap can be bridged by
linking vegetable growers to five-star hotels which leads to mutual benefit of both the
participants. The vegetable growers become economically stable and have a better
livelihood as well as the hotels get quantity, quality, and timely availability of vegetables
at reasonable prices.
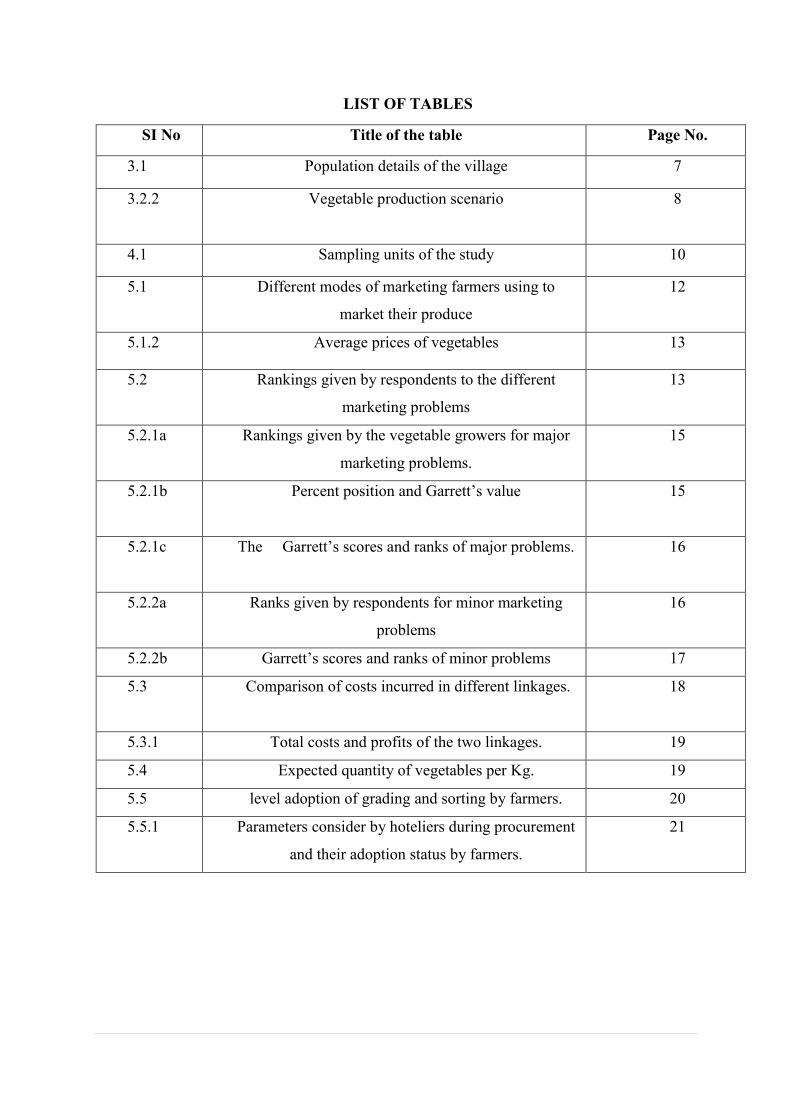
LIST OF TABLES
SI No Title of the table Page No.
3.1 Population details of the village 7
3.2.2 Vegetable production scenario
8
4.1 Sampling units of the study 10
5.1 Different modes of marketing farmers using to
market their produce
12
5.1.2 Average prices of vegetables 13
5.2 Rankings given by respondents to the different
marketing problems
13
5.2.1a Rankings given by the vegetable growers for major
marketing problems.
15
5.2.1b Percent position and Garrett’s value
15
5.2.1c The Garrett’s scores and ranks of major problems.
16
5.2.2a Ranks given by respondents for minor marketing
problems
16
5.2.2b Garrett’s scores and ranks of minor problems 17
5.3 Comparison of costs incurred in different linkages.
18
5.3.1 Total costs and profits of the two linkages. 19
5.4 Expected quantity of vegetables per Kg. 19
5.5 level adoption of grading and sorting by farmers. 20
5.5.1 Parameters consider by hoteliers during procurement
and their adoption status by farmers.
21
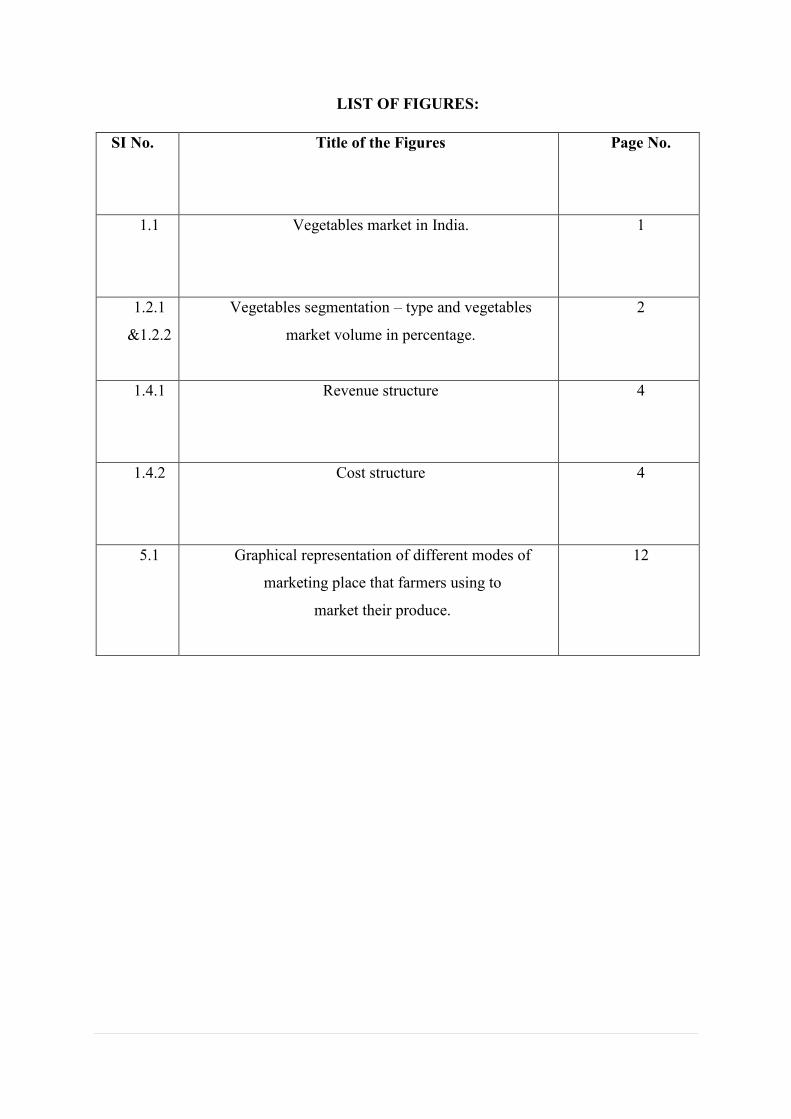
LIST OF FIGURES:
SI No. Title of the Figures Page No.
1.1 Vegetables market in India. 1
1.2.1
&1.2.2
Vegetables segmentation – type and vegetables
market volume in percentage.
2
1.4.1 Revenue structure 4
1.4.2 Cost structure 4
5.1 Graphical representation of different modes of
marketing place that farmers using to
market their produce.
12
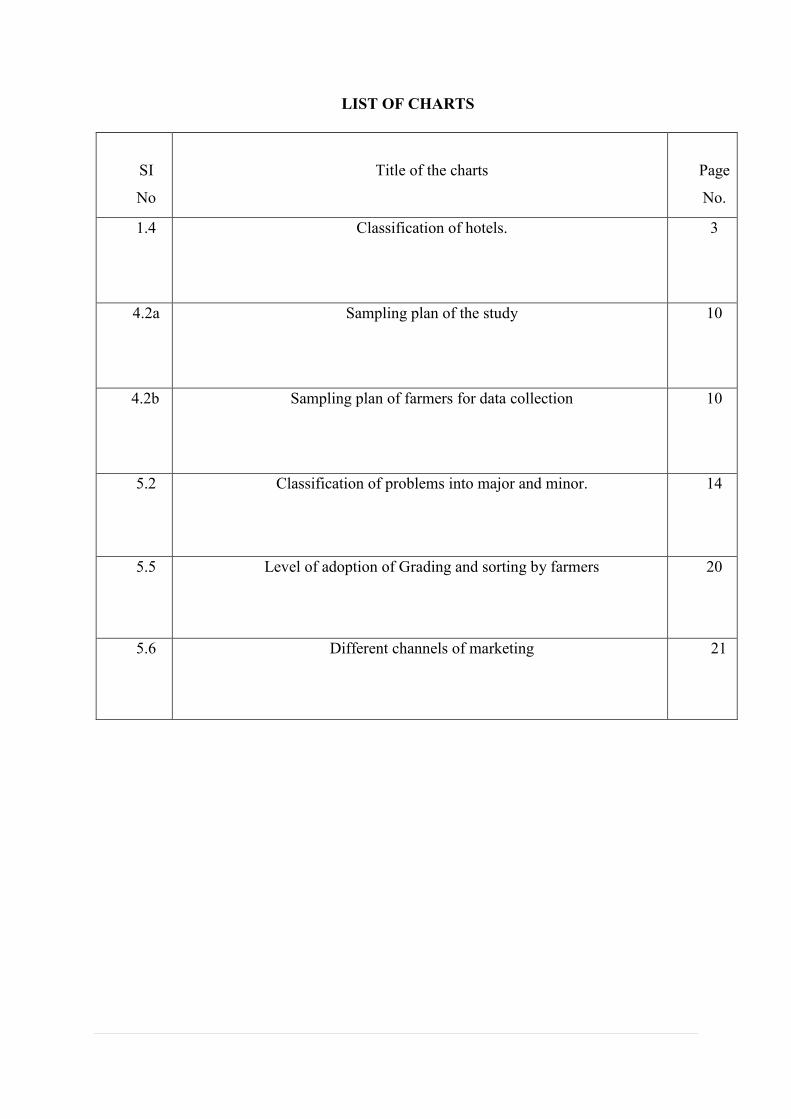
LIST OF CHARTS
SI
No
Title of the charts
Page
No.
1.4 Classification of hotels. 3
4.2a Sampling plan of the study 10
4.2b Sampling plan of farmers for data collection 10
5.2 Classification of problems into major and minor.
14
5.5 Level of adoption of Grading and sorting by farmers 20
5.6 Different channels of marketing 21
1 | P a g e
CHAPTER I
INTRODUCTION
1.1 Vegetable scenario in India.
India is an agrarian country, where more than 50% of population is depend on
agriculture for their livelihood. India’s diverse climate ensure availability of all varieties of
fresh fruits and vegetables. It ranks second in fruit and vegetable production in the world.
According to Ministry of Agriculture and Farmer’s Welfare 2017-18, India produced
187367 ’000 metric tonnes of vegetables. The area under cultivation of fruits stood at 10123
‘000 hectares.
India is largest producer of ginger and okra amongst vegetables, ranks second in
production of potatoes, onions, cauliflowers, brinjal, cabbages, etc. and third in tomatoes.
The vast production base offers India tremendous opportunities for export and different
business entities with in country. During 2017-18, India exported vegetables worth Rs.
5181.78 crores and Indian fruits and vegetable market is majorly dominated by vegetables
with 65% market share. (Technova research analysis).
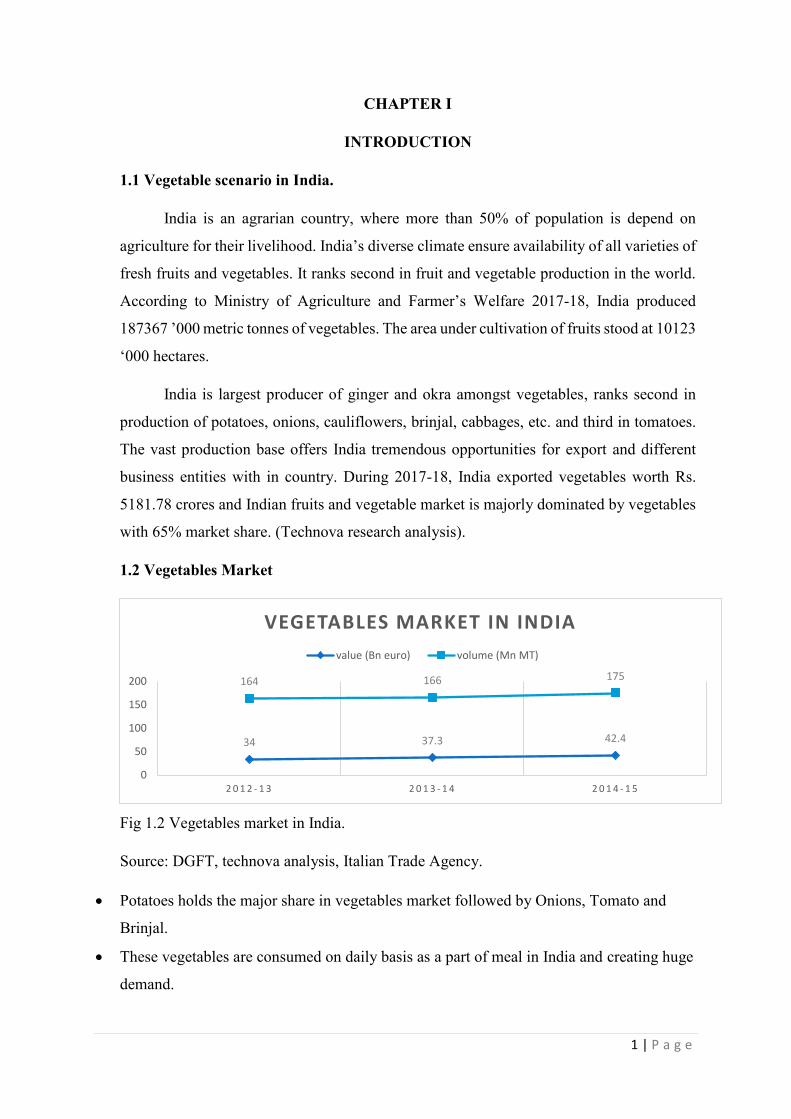
1.2 Vegetables Market
Fig 1.2 Vegetables market in India.
Source: DGFT, technova analysis, Italian Trade Agency.
• Potatoes holds the major share in vegetables market followed by Onions, Tomato and
Brinjal.
• These vegetables are consumed on daily basis as a part of meal in India and creating huge
demand.
34 37.3 42.4
164 166 175
0
50
100
150
200
2 0 1 2 - 1 3 2 0 1 3 - 1 4 2 0 1 4 - 1 5
VEGETABLES MARKET IN INDIA
value (Bn euro) volume (Mn MT)
2 | P a g e
• The five-star and seven-star hotels are also major consumers in India which feeds and
shelters for Indian as well as foreign tourists and delegates and creates huge demand for
almost all Indian and Exotic vegetables.
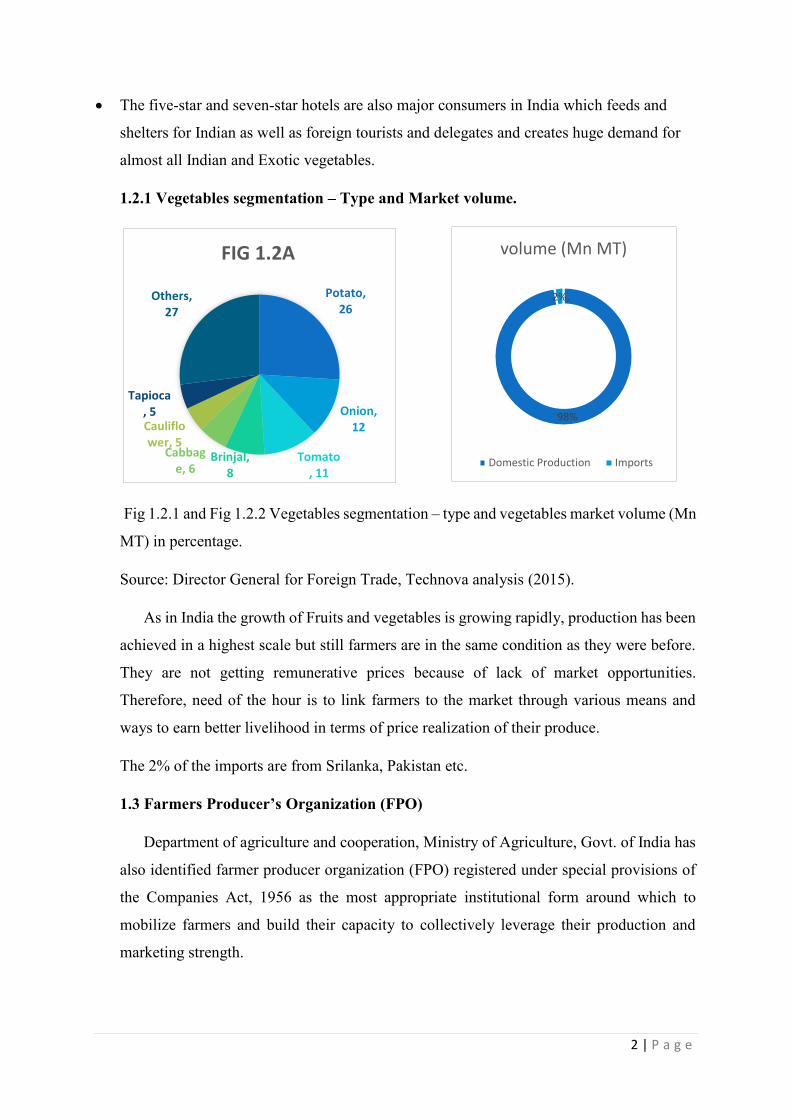
1.2.1 Vegetables segmentation – Type and Market volume.
Fig 1.2.1 and Fig 1.2.2 Vegetables segmentation – type and vegetables market volume (Mn
MT) in percentage.
Source: Director General for Foreign Trade, Technova analysis (2015).
As in India the growth of Fruits and vegetables is growing rapidly, production has been
achieved in a highest scale but still farmers are in the same condition as they were before.
They are not getting remunerative prices because of lack of market opportunities.
Therefore, need of the hour is to link farmers to the market through various means and
ways to earn better livelihood in terms of price realization of their produce.
The 2% of the imports are from Srilanka, Pakistan etc.
1.3 Farmers Producer’s Organization (FPO)
Department of agriculture and cooperation, Ministry of Agriculture, Govt. of India has
also identified farmer producer organization (FPO) registered under special provisions of
the Companies Act, 1956 as the most appropriate institutional form around which to
mobilize farmers and build their capacity to collectively leverage their production and
marketing strength.
Potato, 26
Onion, 12
Tomato, 11
Brinjal, 8
Cabbage, 6
Cauliflower, 5
Tapioca, 5
Others, 27
FIG 1.2A
98%
2%,
volume (Mn MT)
Domestic Production Imports
3 | P a g e
On to date in Karnataka there are 125 FPO’s of which 119 are registered and 6 are under
the process of registration (DOACF, GOI).
1.4 Hotel industry
The Indian hospitality industry has emerged as one of the key industries driving the
growth of the services sector and, thereby, the Indian economy. The tourism and hospitality
sector’s direct contribution to GDP in 2016 was US$ 47 billion (hotel industry research, CARE
Ratings 2017). Also, this in India accounts for 7.5% of GDP and is the 3rd largest foreign
exchange earner for the country.
There are 106 five-star alliances in India comprising number of hotels, as India is one of
the most popular tourists and faster developing country in the world. These hotels are more
interested to serve the better needs of the varied human races. Among them food is the most
important part of their business for which they consider many quality and quantity standards
to purchase. There is a beautiful quote, “High quality food, every-day of the year”, which is
also an essential business motto of the hotel management regarding the quality of food they
food.
As India comprises of many 5-star alliances with number of branches, a greater number of
farmers will get benefitted if they are linked with hotel industry for marketing of their produce.
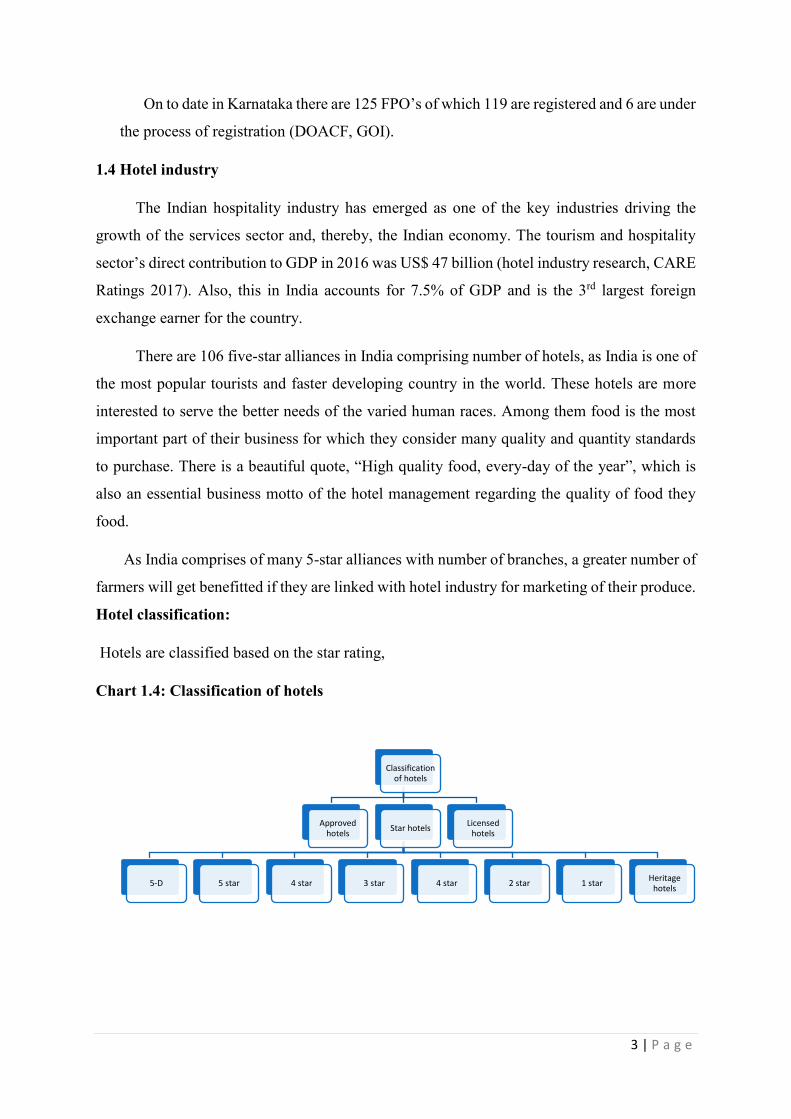
Hotel classification:
Hotels are classified based on the star rating,
Chart 1.4: Classification of hotels
Classification of hotels
Approved hotels
Star hotels
5-D 5 star 4 star 3 star 4 star 2 star 1 starHeritage
hotels
Licensed hotels
4 | P a g e
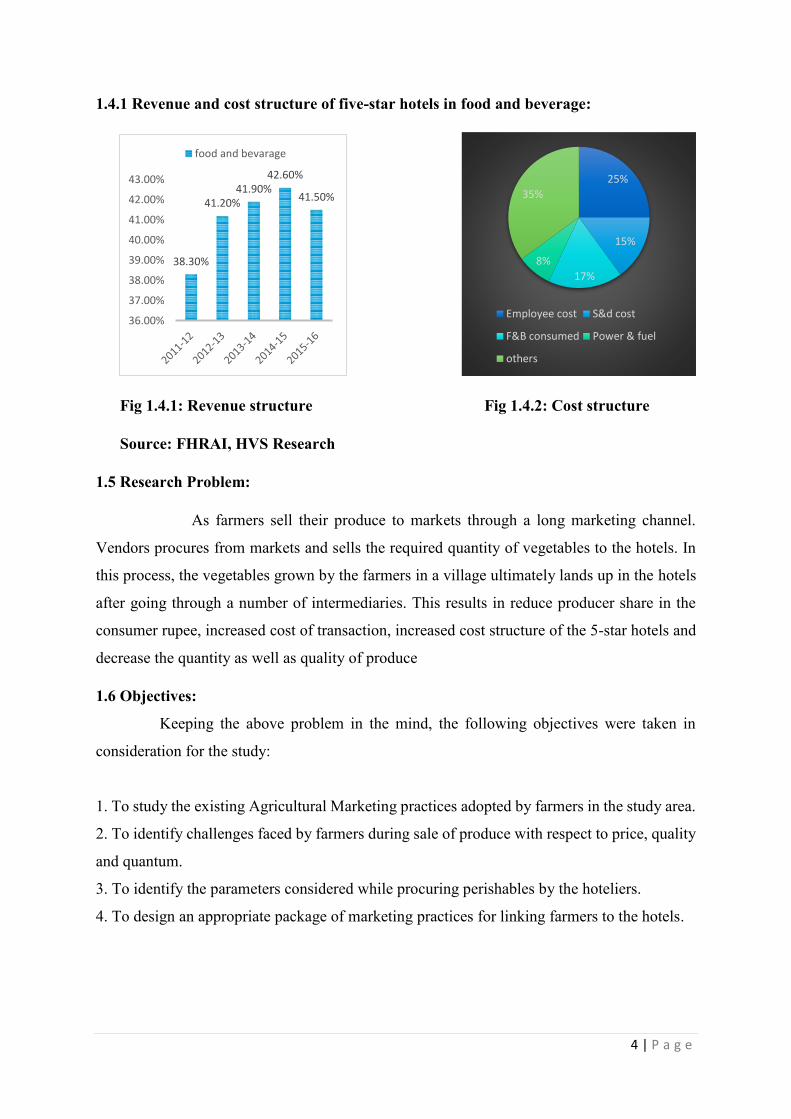
1.4.1 Revenue and cost structure of five-star hotels in food and beverage:
Fig 1.4.1: Revenue structure Fig 1.4.2: Cost structure
Source: FHRAI, HVS Research
1.5 Research Problem:
As farmers sell their produce to markets through a long marketing channel.
Vendors procures from markets and sells the required quantity of vegetables to the hotels. In
this process, the vegetables grown by the farmers in a village ultimately lands up in the hotels
after going through a number of intermediaries. This results in reduce producer share in the
consumer rupee, increased cost of transaction, increased cost structure of the 5-star hotels and
decrease the quantity as well as quality of produce
1.6 Objectives:
Keeping the above problem in the mind, the following objectives were taken in
consideration for the study:
1. To study the existing Agricultural Marketing practices adopted by farmers in the study area.
2. To identify challenges faced by farmers during sale of produce with respect to price, quality
and quantum.
3. To identify the parameters considered while procuring perishables by the hoteliers.
4. To design an appropriate package of marketing practices for linking farmers to the hotels.
38.30%
41.20%41.90%
42.60%
41.50%
36.00%
37.00%
38.00%
39.00%
40.00%
41.00%
42.00%
43.00%
food and bevarage
25%
15%
17%
8%
35%
Employee cost S&d cost
F&B consumed Power & fuel
others
5 | P a g e
1.7 Limitations of the study:
1. The data collected from hotels may be risky because it is not sufficient, reliable and
adequate.
2. This survey is restricted to Bangalore city and Chikkaballapur districts.
3. The sample size for the survey of hotels and farmers were limited to 2 and 30
respondents as the study is time bound is research.
4. The results are totally derived from the respondent’s answers. There might be difference
between actual and projected results.
5. Research also depends on surveyors’ bias and his/her ability to analyse the data draw
conclusion.
6 | P a g e
CHAPTER II
RVIEW OF LITERATURE
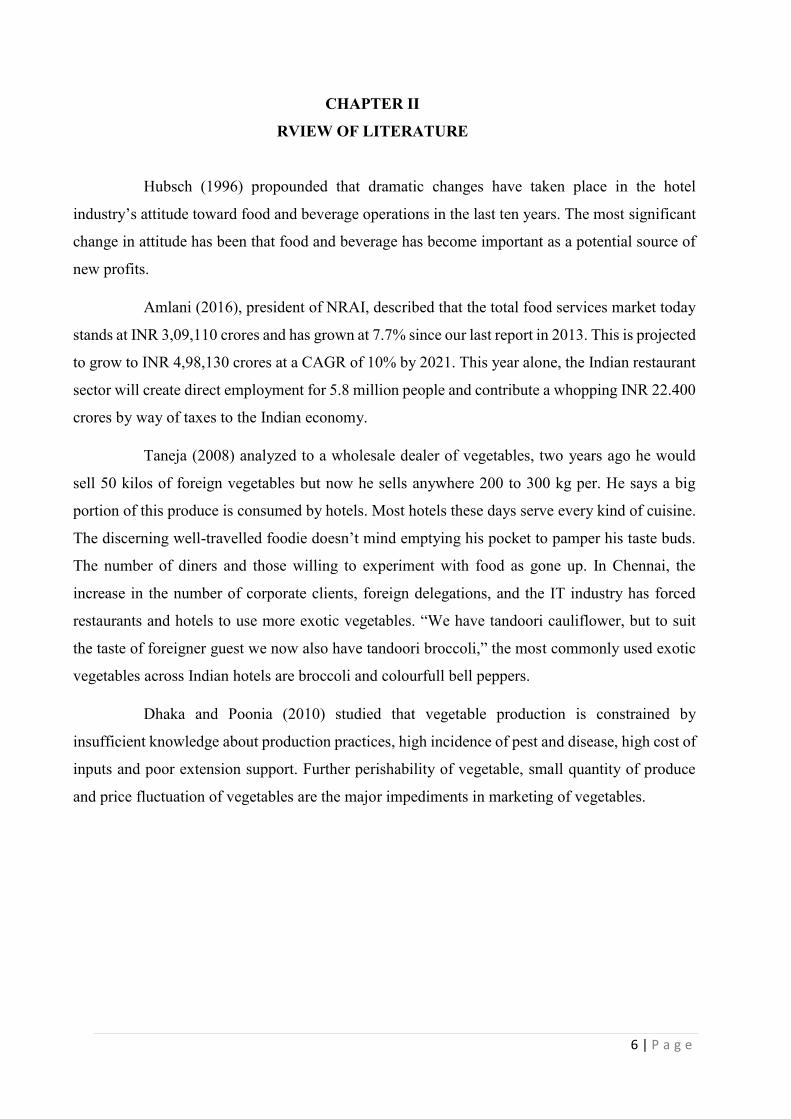
Hubsch (1996) propounded that dramatic changes have taken place in the hotel
industry’s attitude toward food and beverage operations in the last ten years. The most significant
change in attitude has been that food and beverage has become important as a potential source of
new profits.
Amlani (2016), president of NRAI, described that the total food services market today
stands at INR 3,09,110 crores and has grown at 7.7% since our last report in 2013. This is projected
to grow to INR 4,98,130 crores at a CAGR of 10% by 2021. This year alone, the Indian restaurant
sector will create direct employment for 5.8 million people and contribute a whopping INR 22.400
crores by way of taxes to the Indian economy.
Taneja (2008) analyzed to a wholesale dealer of vegetables, two years ago he would
sell 50 kilos of foreign vegetables but now he sells anywhere 200 to 300 kg per. He says a big
portion of this produce is consumed by hotels. Most hotels these days serve every kind of cuisine.
The discerning well-travelled foodie doesn’t mind emptying his pocket to pamper his taste buds.
The number of diners and those willing to experiment with food as gone up. In Chennai, the
increase in the number of corporate clients, foreign delegations, and the IT industry has forced
restaurants and hotels to use more exotic vegetables. “We have tandoori cauliflower, but to suit
the taste of foreigner guest we now also have tandoori broccoli,” the most commonly used exotic
vegetables across Indian hotels are broccoli and colourfull bell peppers.
Dhaka and Poonia (2010) studied that vegetable production is constrained by
insufficient knowledge about production practices, high incidence of pest and disease, high cost of
inputs and poor extension support. Further perishability of vegetable, small quantity of produce
and price fluctuation of vegetables are the major impediments in marketing of vegetables.
7 | P a g e
CHAPTER III
DESCRIPTION OF STUDY AREA
3.1 General particulars of village:
For specified purpose, the performance and current status of Sheraton hotel and Taj
Bangalore hotel of Bangalore, Karnataka are selected as target area of research.
For the data collection from vegetable growers, villages under J Venkatapura panchayat
was studied. J Venkatapura is a Village in Sidlaghatta Taluk in Chikballapur District of
Karnataka State, India. It is located 19 KM towards East from District head-quarters
Chikballapur,70 KM from State capital Bangalore. Along with vegetables growing farmers are
widely undergoing Sericulture. As the target village is very near to metropolitan and big cities
of state, there was a huge demand for vegetable growers from all the sectors.
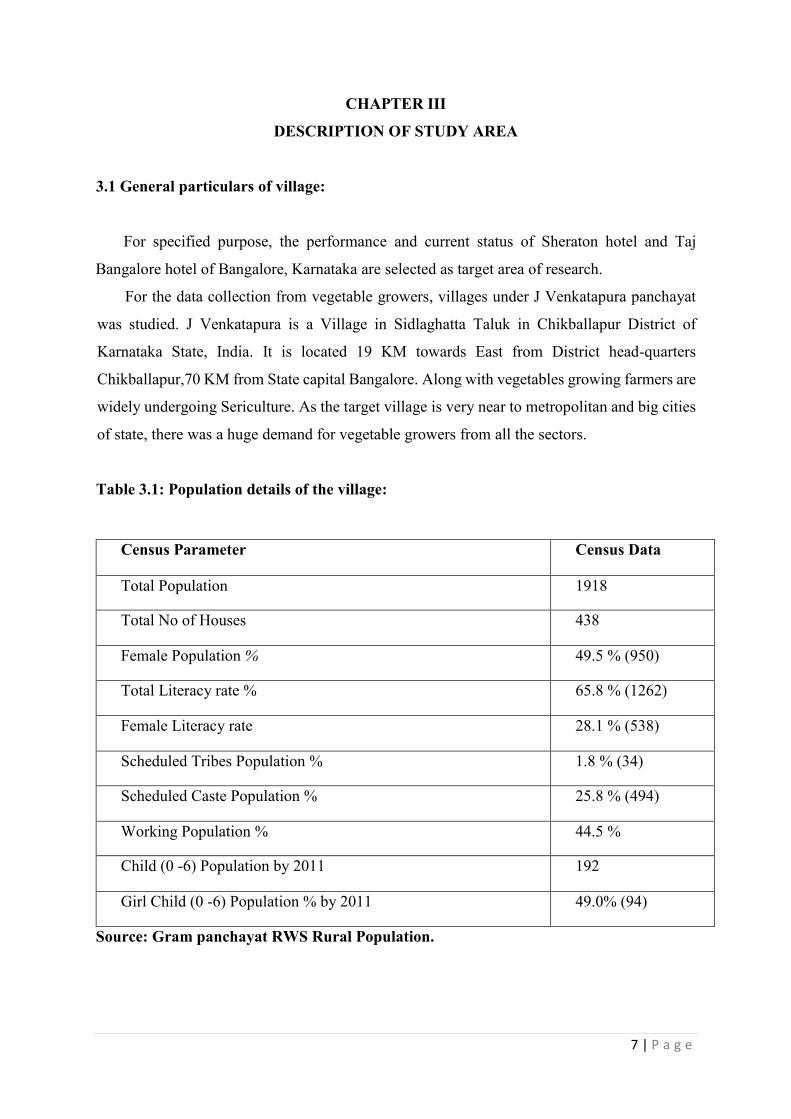
Table 3.1: Population details of the village:
Census Parameter Census Data
Total Population 1918
Total No of Houses 438
Female Population % 49.5 % (950)
Total Literacy rate % 65.8 % (1262)
Female Literacy rate 28.1 % (538)
Scheduled Tribes Population % 1.8 % (34)
Scheduled Caste Population % 25.8 % (494)
Working Population % 44.5 %
Child (0 -6) Population by 2011 192
Girl Child (0 -6) Population % by 2011 49.0% (94)
Source: Gram panchayat RWS Rural Population.
8 | P a g e
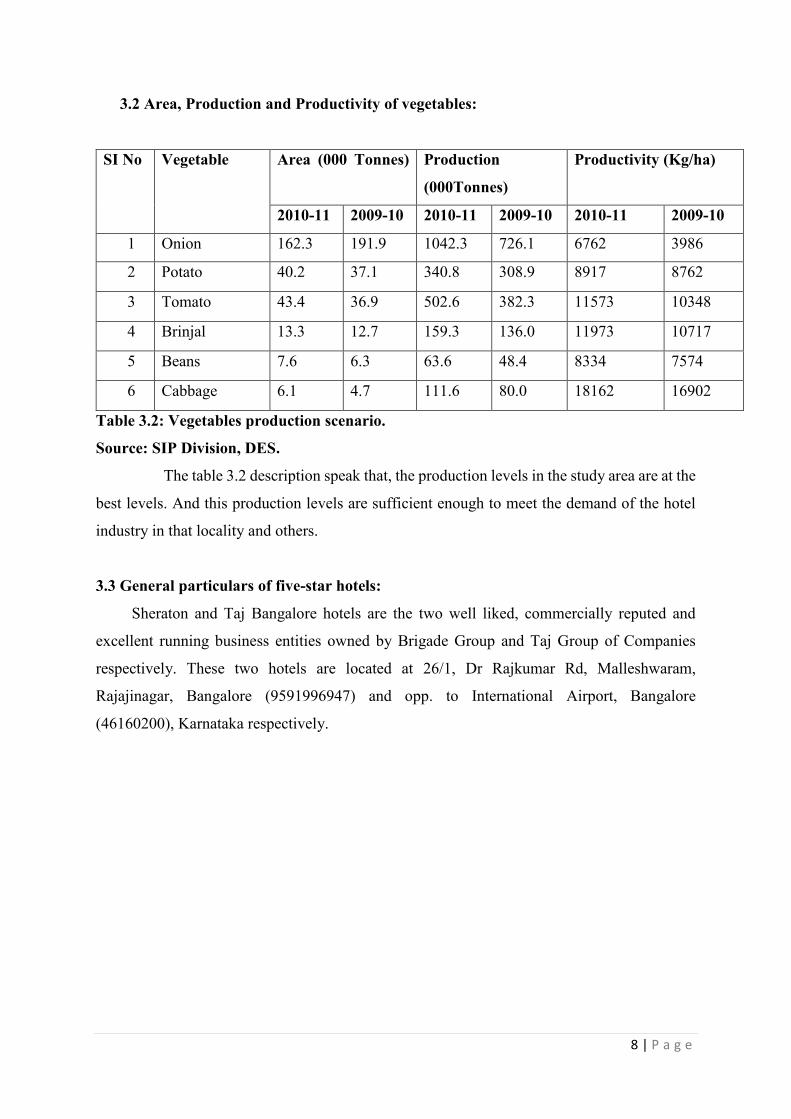
3.2 Area, Production and Productivity of vegetables:
SI No Vegetable Area (000 Tonnes)
Production
(000Tonnes)
Productivity (Kg/ha)
2010-11 2009-10 2010-11 2009-10 2010-11 2009-10
1 Onion 162.3 191.9 1042.3 726.1 6762 3986
2 Potato 40.2 37.1 340.8 308.9 8917 8762
3 Tomato 43.4 36.9 502.6 382.3 11573 10348
4 Brinjal 13.3 12.7 159.3 136.0 11973 10717
5 Beans 7.6 6.3 63.6 48.4 8334 7574
6 Cabbage 6.1 4.7 111.6 80.0 18162 16902
Table 3.2: Vegetables production scenario.
Source: SIP Division, DES.
The table 3.2 description speak that, the production levels in the study area are at the
best levels. And this production levels are sufficient enough to meet the demand of the hotel
industry in that locality and others.
3.3 General particulars of five-star hotels:
Sheraton and Taj Bangalore hotels are the two well liked, commercially reputed and
excellent running business entities owned by Brigade Group and Taj Group of Companies
respectively. These two hotels are located at 26/1, Dr Rajkumar Rd, Malleshwaram,
Rajajinagar, Bangalore (9591996947) and opp. to International Airport, Bangalore
(46160200), Karnataka respectively.
9 | P a g e
CHAPTER IV METHODOLOGY
4.1 Research Design:
Descriptive research design is applied to analyse and formulate the existing
mechanism in the vegetables marketing between farmers and hotels.
4.1a Data sources:
The study was analysed based on the primary data collected from the farmers, hotels
and some government organisations using a set of structured interview schedule.
The secondary data is the results and outcomes of the researches that have done
earlier, DGFT reports, FHRAI and Ministry of Agriculture. In addition, various literatures
like Books, Journals, Newspapers, Magazines etc. were studied for better results.
4.1b Area of study:
The proposed study is conducted in J Venkatapura post of Chikkballapur District and
Bangalore of Karnataka State to analyse the existing system of vegetables marketing from
farmer to hotels. For the better results, the current prices of vegetables were collected from
nearby APMC (Sidlaghatta) and Shandi (Yelahanka Raithu Bazaar).
The analysis was done based on the primary data collected from the 30 local vegetable
growers using the prepared structured interview schedule. Multistage random sampling was
used in selecting the respondents. The details regarding performance, structure and other
crucial details of 5-star hotels was collected from Purchasing Managers of the hotel
procurement department. For the better analysis, the current prices of vegetables were collected
from the nearby APMC (Sidlaghatta) and Shandi (Yelahanka Raithu Bazaar).
4.2 Sampling Design:
The study is based on both probability and non-probability sampling design for the better
assessment of results.
10 | P a g e
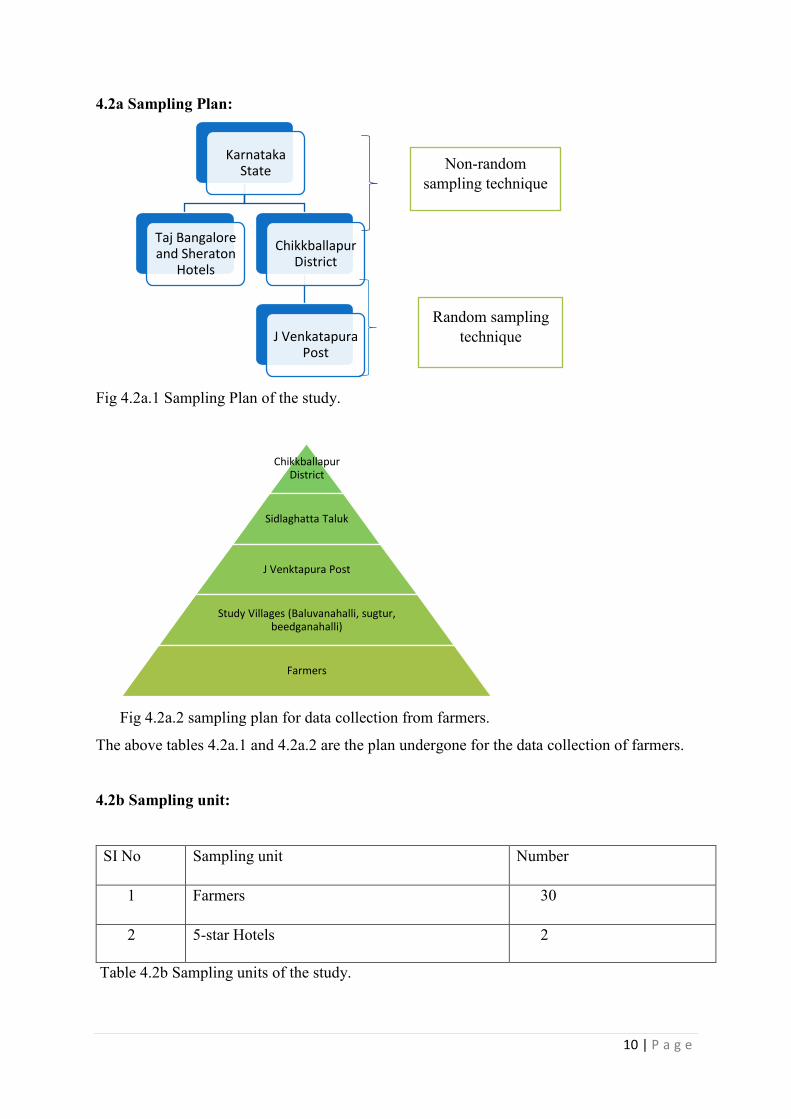
4.2a Sampling Plan:
Fig 4.2a.1 Sampling Plan of the study.
Fig 4.2a.2 sampling plan for data collection from farmers.
The above tables 4.2a.1 and 4.2a.2 are the plan undergone for the data collection of farmers.
4.2b Sampling unit:
SI No Sampling unit Number
1 Farmers 30
2 5-star Hotels 2
Table 4.2b Sampling units of the study.
Karnataka State
Taj Bangalore and Sheraton
Hotels
Chikkballapur District
J Venkatapura Post
Chikkballapur District
Sidlaghatta Taluk
J Venktapura Post
Study Villages (Baluvanahalli, sugtur, beedganahalli)
Farmers
Non-random sampling technique
Random sampling technique
11 | P a g e
4.2c Research instrument:
The required data was collected from farmers and hotel procurement department (purchase
managers) by personal interview method through well prepared structured questionnaires.
4.2d Analytical tools:
Simple statistical tools like tabular analysis and graphical method (through bar graph,
pie graph, and line graph by using excel). Weighted averages, mean and percentages were used
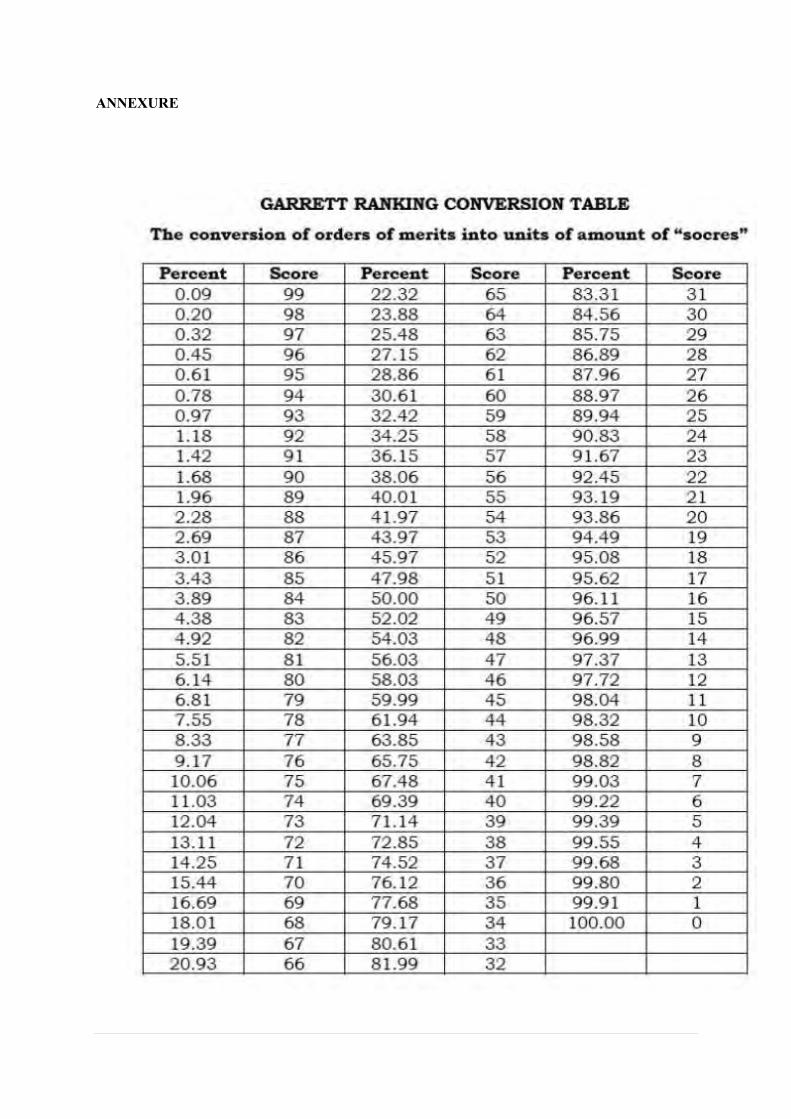
for analysis of data where ever needed. Henry Garrett’s Ranking Technique is used for ranking
the marketing problems of farmers.
4.2d.1 Henry Garrett’s Ranking Technique:
This technique was used to evaluate the problems faced by the researchers. The orders of
merit given by respondents were converted in to rank by using the formula. To find out the
most significant factor which influences respondent, Garrett’s technique was used. As per this
method, respondents have been asked assign ranks for all factors and the outcomes of such
ranking have been converted into score value with the help of the fallowing formula:
Percent position = 100(Rij-0.5)/Nj
Where, Rij = Rank given for the ith variable by jth respondents
Nj = Number of variables ranked by jth respondents.
For the current analysis, the respondents were asked to rank from 1 to 5 for the problems
they are facing in the existing marketing system. Based on the data earned the problems are
classified into two different groups and then analysed. The scores are calculated and those
scores were manipulated mathematically and each problem has been assigned a rank based on
its importance and influence over the vegetable growers.
12 | P a g e
CHAPTER V
RESULTS AND DISCUSSION
The analysis of the present research as well as relevant discussion have been presented under
following heads:
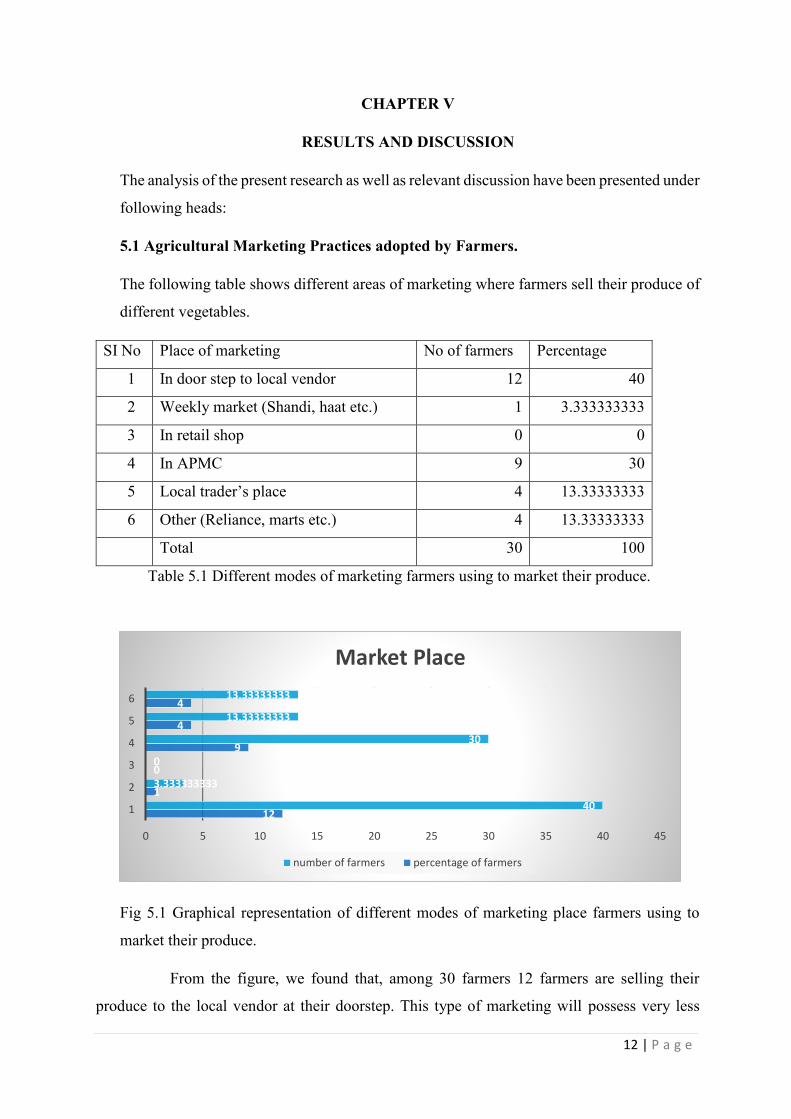
5.1 Agricultural Marketing Practices adopted by Farmers.
The following table shows different areas of marketing where farmers sell their produce of
different vegetables.
SI No Place of marketing No of farmers Percentage
1 In door step to local vendor 12 40
2 Weekly market (Shandi, haat etc.) 1 3.333333333
3 In retail shop 0 0
4 In APMC 9 30
5 Local trader’s place 4 13.33333333
6 Other (Reliance, marts etc.) 4 13.33333333
Total 30 100
Table 5.1 Different modes of marketing farmers using to market their produce.
Fig 5.1 Graphical representation of different modes of marketing place farmers using to
market their produce.
From the figure, we found that, among 30 farmers 12 farmers are selling their
produce to the local vendor at their doorstep. This type of marketing will possess very less
12
1
0
9
4
4
40
3.333333333
0
30
13.33333333
13.33333333
0 5 10 15 20 25 30 35 40 45
1
2
3
4
5
6
Market Place
number of farmers percentage of farmers
13 | P a g e
marketing costs but the system reduces the percentage of producers share in consumer’s rupee
that farmer will get by moving to other channels.
5.1.2 Prices of Tomato, Potato and Cauliflower that farmers got obtained in existing
linkage:
The below table gives information about the average prices per kg of tomato, potato and
cauliflower that farmers received at different markets.
SI No Place of marketing Tomato Potato Cauliflower
1 In door step to local vendor - 20 -
2 Weekly market (Shandi, haat etc.) - - -
3 In retail shop - - -
4 In APMC 18.8 - 6
5 Local trader’s place 10 - -
6 Other (Reliance, marts etc.) - 15 -
Total 14.4 17.5 6
Table 5.1.2 average prices of tomato, potato and cauliflower at different markets.
From the table 5.1.2 it is found that farmers confined selling of their produce in only few
markets even though there are different ways for marketing of their produce. The reason for
farmers to sell their produce in the same market is due lack of time, labour and market
awareness.
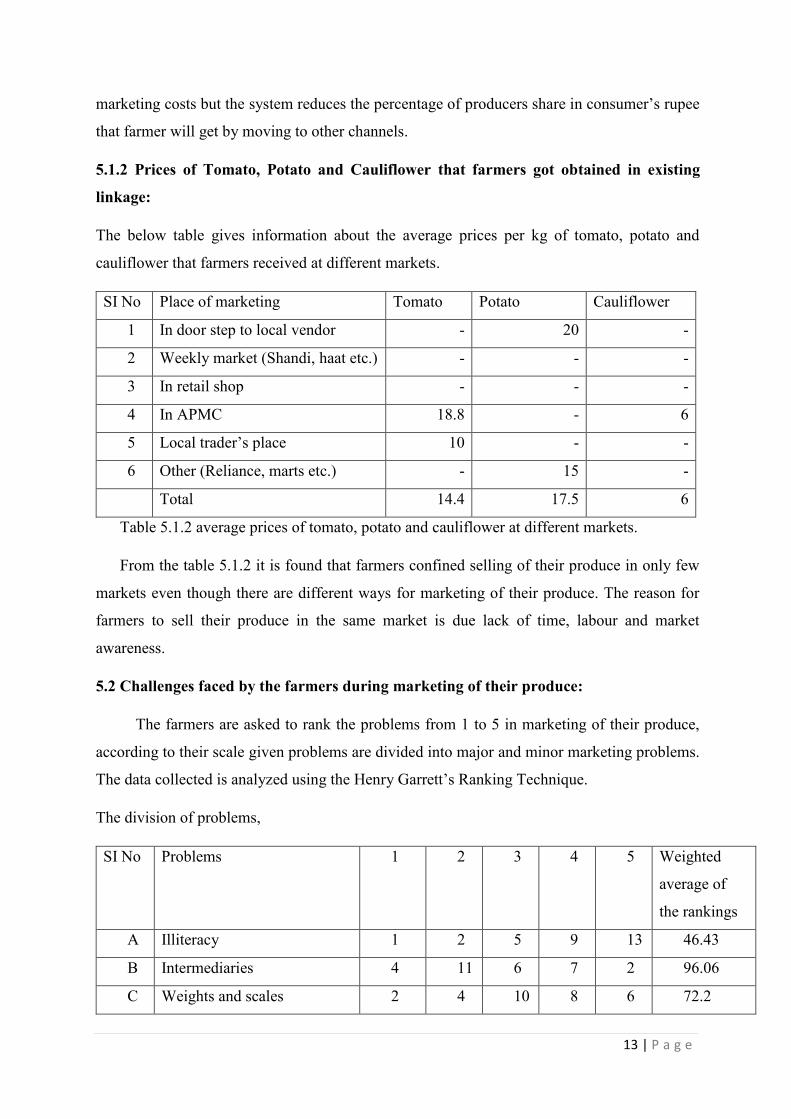
5.2 Challenges faced by the farmers during marketing of their produce:
The farmers are asked to rank the problems from 1 to 5 in marketing of their produce,
according to their scale given problems are divided into major and minor marketing problems.
The data collected is analyzed using the Henry Garrett’s Ranking Technique.
The division of problems,
SI No Problems 1 2 3 4 5 Weighted
average of
the rankings
A Illiteracy 1 2 5 9 13 46.43
B Intermediaries 4 11 6 7 2 96.06
C Weights and scales 2 4 10 8 6 72.2
14 | P a g e
D Financial problems 5 12 7 4 2 102.06
E Lack of organized marketing
system
1 18 6 3 2 101.06
F Lack of transportation
facilities
0 5 11 7 7 67.23
G Standardization and grading 1 6 13 5 5 74.16
H Lack of market awareness 1 7 8 8 6 69.2
I Storage facilities 24 3 0 1 2 134.06
J Price fluctuations 29 1 0 0 0 145.13
Table 5.2 rankings given to different marketing problems by farmers.
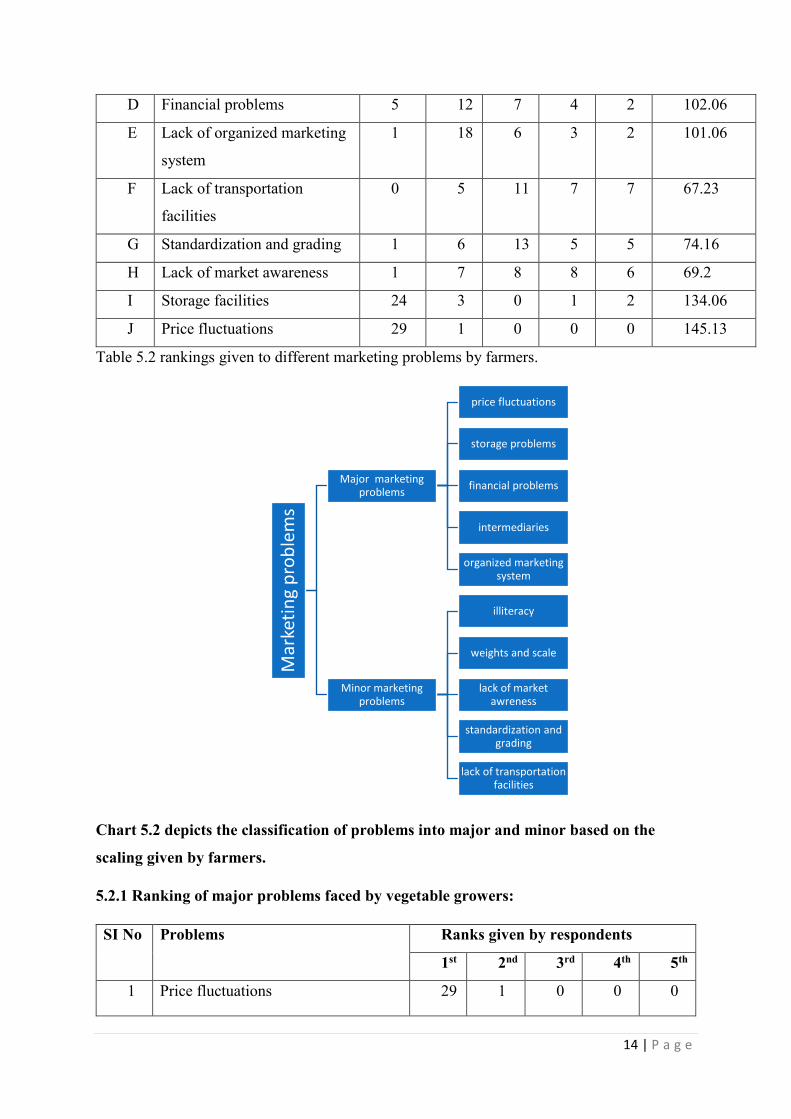
Chart 5.2 depicts the classification of problems into major and minor based on the
scaling given by farmers.
5.2.1 Ranking of major problems faced by vegetable growers:
SI No Problems Ranks given by respondents
1st 2nd 3rd 4th 5th
1 Price fluctuations 29 1 0 0 0
Mar
keti
ng
pro
ble
ms
Major marketing problems
price fluctuations
storage problems
financial problems
intermediaries
organized marketing system
Minor marketing problems
illiteracy
weights and scale
lack of market awreness
standardization and grading
lack of transportation facilities
15 | P a g e
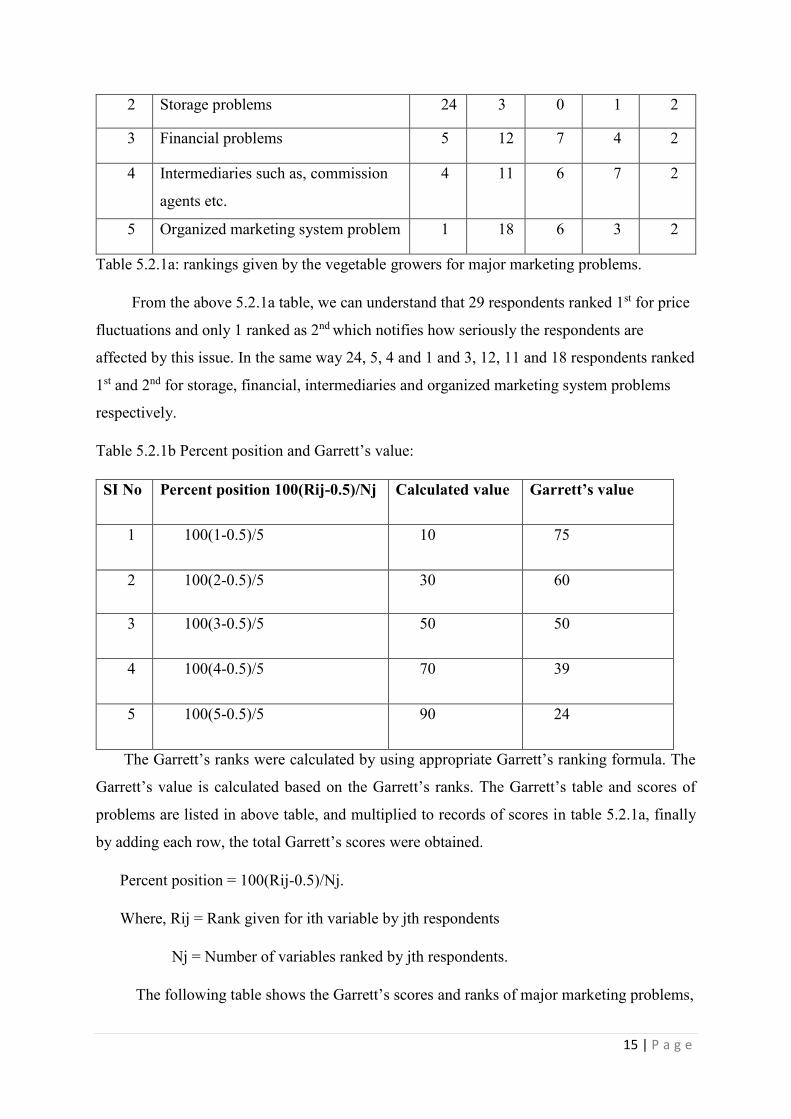
2 Storage problems 24 3 0 1 2
3 Financial problems 5 12 7 4 2
4 Intermediaries such as, commission
agents etc.
4 11 6 7 2
5 Organized marketing system problem 1 18 6 3 2
Table 5.2.1a: rankings given by the vegetable growers for major marketing problems.
From the above 5.2.1a table, we can understand that 29 respondents ranked 1st for price
fluctuations and only 1 ranked as 2nd which notifies how seriously the respondents are
affected by this issue. In the same way 24, 5, 4 and 1 and 3, 12, 11 and 18 respondents ranked
1st and 2nd for storage, financial, intermediaries and organized marketing system problems
respectively.
Table 5.2.1b Percent position and Garrett’s value:
SI No Percent position 100(Rij-0.5)/Nj Calculated value Garrett’s value
1 100(1-0.5)/5 10 75
2 100(2-0.5)/5 30 60
3 100(3-0.5)/5 50 50
4 100(4-0.5)/5 70 39
5 100(5-0.5)/5 90 24
The Garrett’s ranks were calculated by using appropriate Garrett’s ranking formula. The
Garrett’s value is calculated based on the Garrett’s ranks. The Garrett’s table and scores of
problems are listed in above table, and multiplied to records of scores in table 5.2.1a, finally
by adding each row, the total Garrett’s scores were obtained.
Percent position = 100(Rij-0.5)/Nj.
Where, Rij = Rank given for ith variable by jth respondents
Nj = Number of variables ranked by jth respondents.
The following table shows the Garrett’s scores and ranks of major marketing problems,
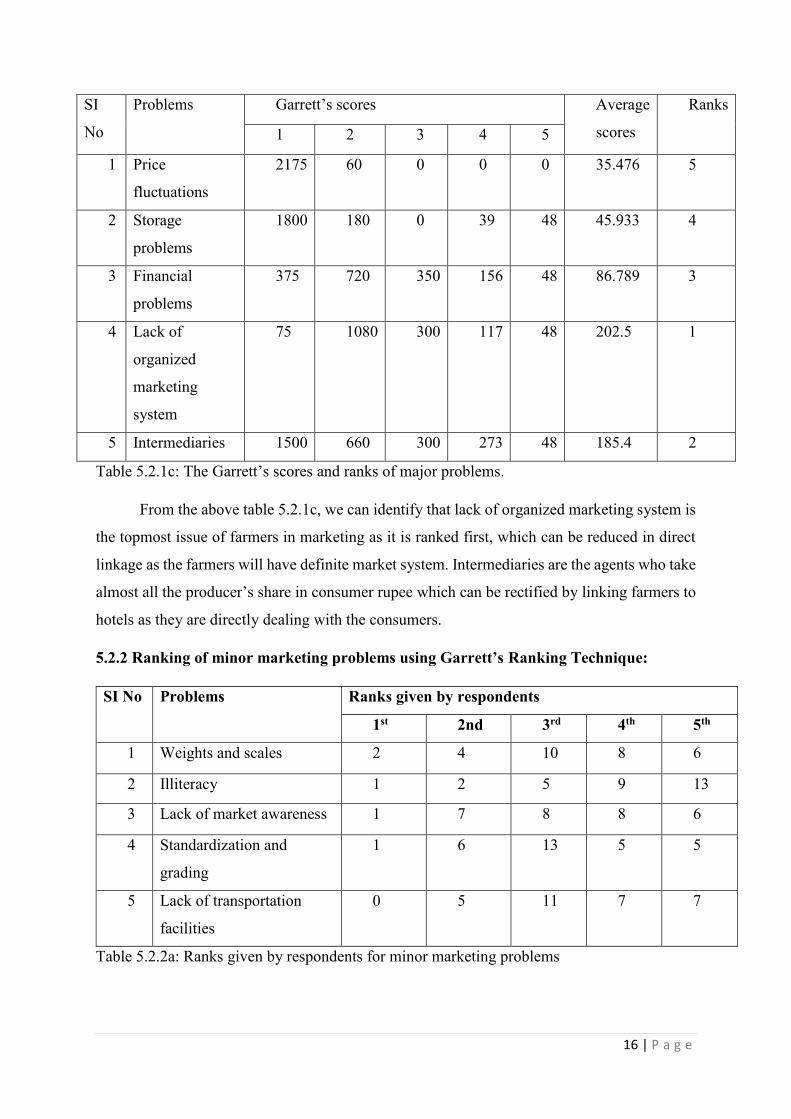
16 | P a g e
SI
No
Problems Garrett’s scores Average
scores
Ranks
1 2 3 4 5
1 Price
fluctuations
2175 60 0 0 0 35.476 5
2 Storage
problems
1800 180 0 39 48 45.933 4
3 Financial
problems
375 720 350 156 48 86.789 3
4 Lack of
organized
marketing
system
75 1080 300 117 48 202.5 1
5 Intermediaries 1500 660 300 273 48 185.4 2
Table 5.2.1c: The Garrett’s scores and ranks of major problems.
From the above table 5.2.1c, we can identify that lack of organized marketing system is
the topmost issue of farmers in marketing as it is ranked first, which can be reduced in direct
linkage as the farmers will have definite market system. Intermediaries are the agents who take
almost all the producer’s share in consumer rupee which can be rectified by linking farmers to
hotels as they are directly dealing with the consumers.
5.2.2 Ranking of minor marketing problems using Garrett’s Ranking Technique:
SI No Problems Ranks given by respondents
1st 2nd 3rd 4th 5th
1 Weights and scales 2 4 10 8 6
2 Illiteracy 1 2 5 9 13
3 Lack of market awareness 1 7 8 8 6
4 Standardization and
grading
1 6 13 5 5
5 Lack of transportation
facilities
0 5 11 7 7
Table 5.2.2a: Ranks given by respondents for minor marketing problems
17 | P a g e
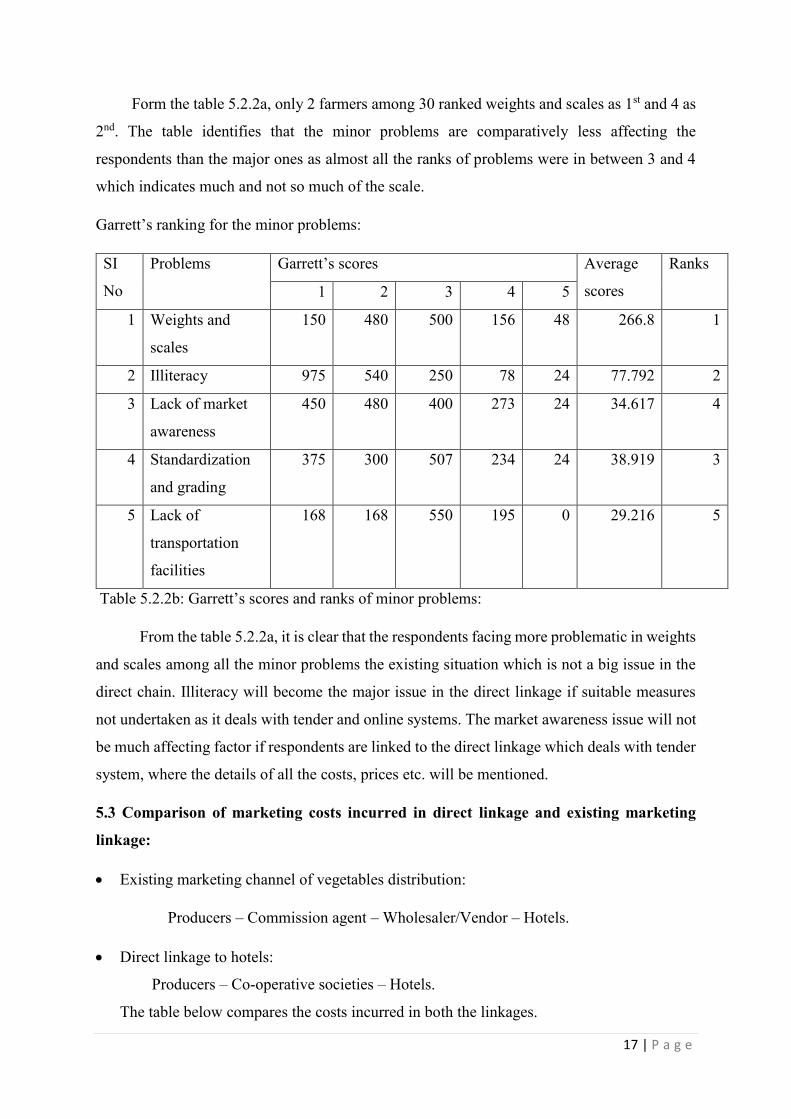
Form the table 5.2.2a, only 2 farmers among 30 ranked weights and scales as 1st and 4 as
2nd. The table identifies that the minor problems are comparatively less affecting the
respondents than the major ones as almost all the ranks of problems were in between 3 and 4
which indicates much and not so much of the scale.
Garrett’s ranking for the minor problems:
SI
No
Problems Garrett’s scores Average
scores
Ranks
1 2 3 4 5
1 Weights and
scales
150 480 500 156 48 266.8 1
2 Illiteracy 975 540 250 78 24 77.792 2
3 Lack of market
awareness
450 480 400 273 24 34.617 4
4 Standardization
and grading
375 300 507 234 24 38.919 3
5 Lack of
transportation
facilities
168 168 550 195 0 29.216 5
Table 5.2.2b: Garrett’s scores and ranks of minor problems:
From the table 5.2.2a, it is clear that the respondents facing more problematic in weights
and scales among all the minor problems the existing situation which is not a big issue in the
direct chain. Illiteracy will become the major issue in the direct linkage if suitable measures
not undertaken as it deals with tender and online systems. The market awareness issue will not
be much affecting factor if respondents are linked to the direct linkage which deals with tender
system, where the details of all the costs, prices etc. will be mentioned.
5.3 Comparison of marketing costs incurred in direct linkage and existing marketing
linkage:
• Existing marketing channel of vegetables distribution:
Producers – Commission agent – Wholesaler/Vendor – Hotels.
• Direct linkage to hotels:
Producers – Co-operative societies – Hotels.
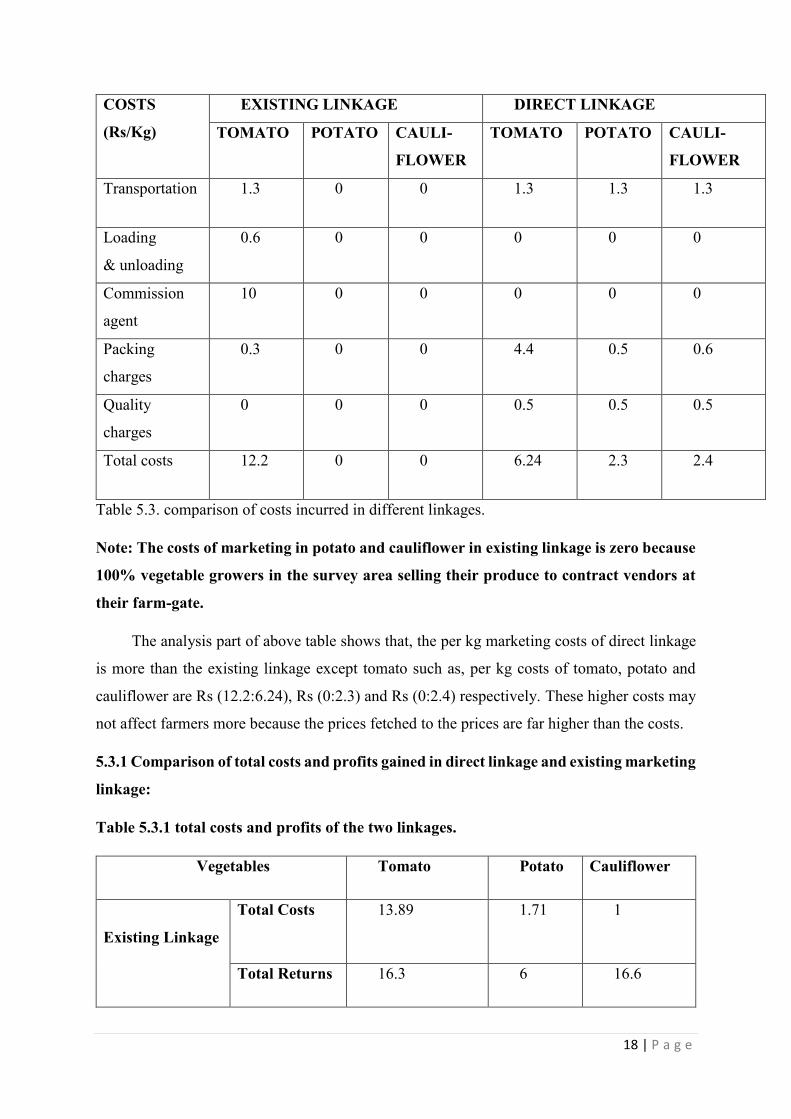
The table below compares the costs incurred in both the linkages.
18 | P a g e
COSTS
(Rs/Kg)
EXISTING LINKAGE DIRECT LINKAGE
TOMATO POTATO CAULI-
FLOWER
TOMATO POTATO CAULI-
FLOWER
Transportation 1.3 0 0 1.3 1.3 1.3
Loading
& unloading
0.6 0 0 0 0 0
Commission
agent
10 0 0 0 0 0
Packing
charges
0.3 0 0 4.4 0.5 0.6
Quality
charges
0 0 0 0.5 0.5 0.5
Total costs 12.2 0 0 6.24 2.3 2.4
Table 5.3. comparison of costs incurred in different linkages.
Note: The costs of marketing in potato and cauliflower in existing linkage is zero because
100% vegetable growers in the survey area selling their produce to contract vendors at
their farm-gate.
The analysis part of above table shows that, the per kg marketing costs of direct linkage
is more than the existing linkage except tomato such as, per kg costs of tomato, potato and
cauliflower are Rs (12.2:6.24), Rs (0:2.3) and Rs (0:2.4) respectively. These higher costs may
not affect farmers more because the prices fetched to the prices are far higher than the costs.
5.3.1 Comparison of total costs and profits gained in direct linkage and existing marketing
linkage:
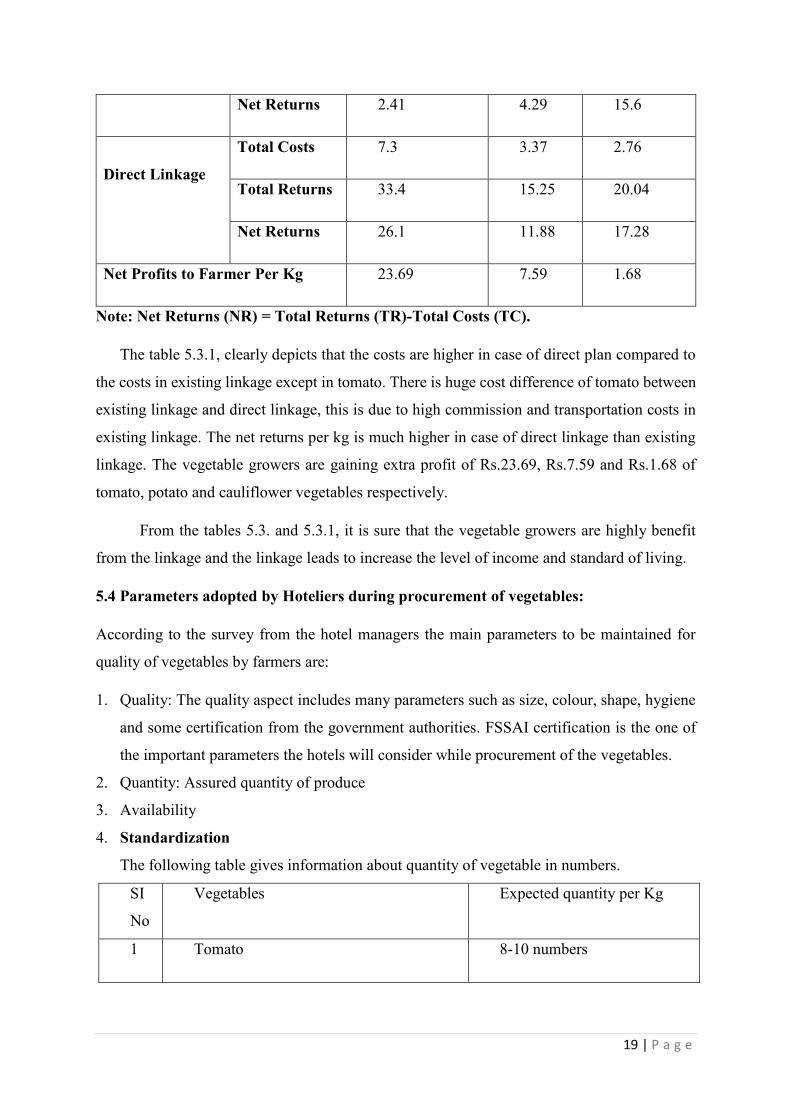
Table 5.3.1 total costs and profits of the two linkages.
Vegetables Tomato Potato Cauliflower
Existing Linkage
Total Costs 13.89 1.71 1
Total Returns 16.3 6 16.6
19 | P a g e
Net Returns 2.41 4.29 15.6
Direct Linkage
Total Costs 7.3 3.37 2.76
Total Returns 33.4 15.25 20.04
Net Returns 26.1 11.88 17.28
Net Profits to Farmer Per Kg 23.69 7.59 1.68
Note: Net Returns (NR) = Total Returns (TR)-Total Costs (TC).
The table 5.3.1, clearly depicts that the costs are higher in case of direct plan compared to
the costs in existing linkage except in tomato. There is huge cost difference of tomato between
existing linkage and direct linkage, this is due to high commission and transportation costs in
existing linkage. The net returns per kg is much higher in case of direct linkage than existing
linkage. The vegetable growers are gaining extra profit of Rs.23.69, Rs.7.59 and Rs.1.68 of
tomato, potato and cauliflower vegetables respectively.
From the tables 5.3. and 5.3.1, it is sure that the vegetable growers are highly benefit
from the linkage and the linkage leads to increase the level of income and standard of living.
5.4 Parameters adopted by Hoteliers during procurement of vegetables:
According to the survey from the hotel managers the main parameters to be maintained for
quality of vegetables by farmers are:
1. Quality: The quality aspect includes many parameters such as size, colour, shape, hygiene
and some certification from the government authorities. FSSAI certification is the one of
the important parameters the hotels will consider while procurement of the vegetables.
2. Quantity: Assured quantity of produce
3. Availability
4. Standardization
The following table gives information about quantity of vegetable in numbers.
SI
No
Vegetables Expected quantity per Kg
1 Tomato 8-10 numbers
20 | P a g e
2 Potato 6-8 numbers
3 Cauliflower Only flower (1f=0.5-0.75 kg)
4 Onion 8-10 numbers
Table 5.4.1 Expected quantity of vegetables per Kg.
The table 5.4.1 indicates that per kg of tomato, potato and onion should contain 8-10, 6-
8, and 8-10 number respectively. This is the most important parameter that the hotel
procurement department want farmers to maintain. Accordingly, the farmer should undergo
grading and sorting activities to satisfy the hotel management which the farmers are already
adopting in the existing situation.
5.5 Parameters adopted by farmers in the study area:
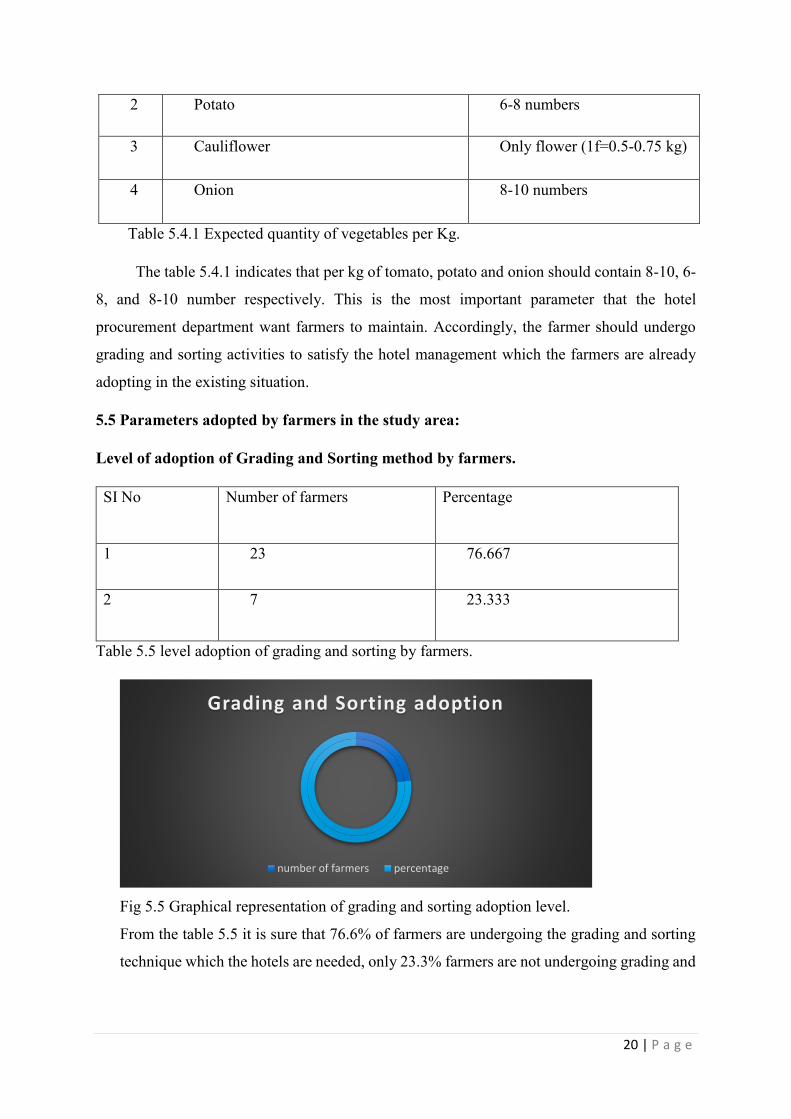
Level of adoption of Grading and Sorting method by farmers.
SI No Number of farmers Percentage
1 23 76.667
2 7 23.333
Table 5.5 level adoption of grading and sorting by farmers.
Fig 5.5 Graphical representation of grading and sorting adoption level.
From the table 5.5 it is sure that 76.6% of farmers are undergoing the grading and sorting
technique which the hotels are needed, only 23.3% farmers are not undergoing grading and
Grading and Sorting adoption
number of farmers percentage
21 | P a g e
sorting. This 23.3% is because the farmers are selling their produce at their door step to
local vendors.
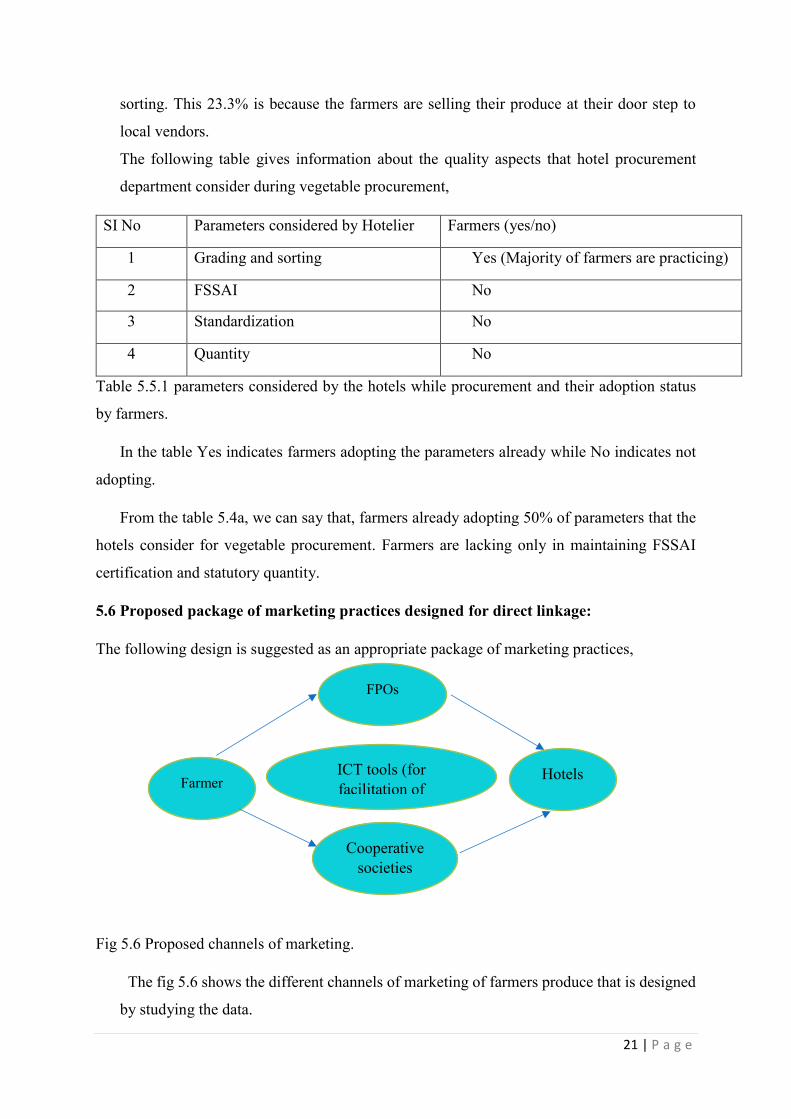
The following table gives information about the quality aspects that hotel procurement
department consider during vegetable procurement,
SI No Parameters considered by Hotelier Farmers (yes/no)
1 Grading and sorting Yes (Majority of farmers are practicing)
2 FSSAI No
3 Standardization No
4 Quantity No
Table 5.5.1 parameters considered by the hotels while procurement and their adoption status
by farmers.
In the table Yes indicates farmers adopting the parameters already while No indicates not
adopting.
From the table 5.4a, we can say that, farmers already adopting 50% of parameters that the
hotels consider for vegetable procurement. Farmers are lacking only in maintaining FSSAI
certification and statutory quantity.
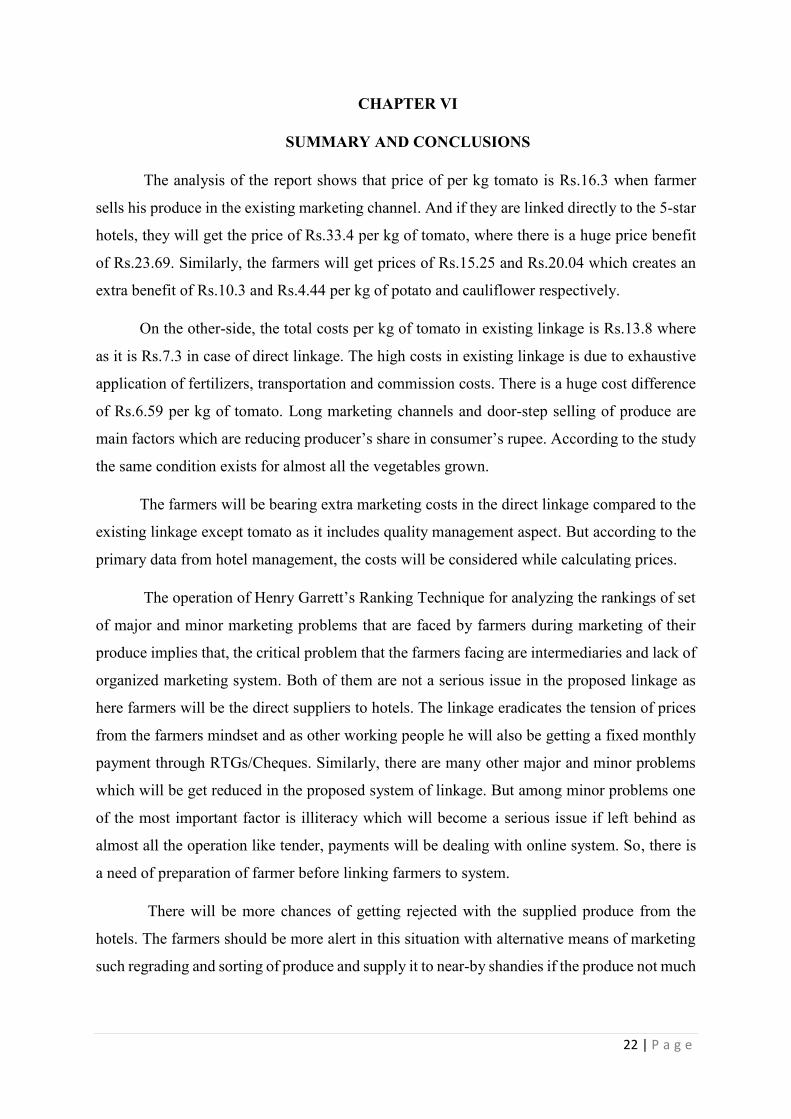
5.6 Proposed package of marketing practices designed for direct linkage:
The following design is suggested as an appropriate package of marketing practices,
Fig 5.6 Proposed channels of marketing.
The fig 5.6 shows the different channels of marketing of farmers produce that is designed
by studying the data.
Farmer
Cooperative societies
FPOs
ICT tools (for facilitation of
process)
Hotels
22 | P a g e
CHAPTER VI
SUMMARY AND CONCLUSIONS
The analysis of the report shows that price of per kg tomato is Rs.16.3 when farmer
sells his produce in the existing marketing channel. And if they are linked directly to the 5-star
hotels, they will get the price of Rs.33.4 per kg of tomato, where there is a huge price benefit
of Rs.23.69. Similarly, the farmers will get prices of Rs.15.25 and Rs.20.04 which creates an
extra benefit of Rs.10.3 and Rs.4.44 per kg of potato and cauliflower respectively.
On the other-side, the total costs per kg of tomato in existing linkage is Rs.13.8 where
as it is Rs.7.3 in case of direct linkage. The high costs in existing linkage is due to exhaustive
application of fertilizers, transportation and commission costs. There is a huge cost difference
of Rs.6.59 per kg of tomato. Long marketing channels and door-step selling of produce are
main factors which are reducing producer’s share in consumer’s rupee. According to the study
the same condition exists for almost all the vegetables grown.
The farmers will be bearing extra marketing costs in the direct linkage compared to the
existing linkage except tomato as it includes quality management aspect. But according to the
primary data from hotel management, the costs will be considered while calculating prices.
The operation of Henry Garrett’s Ranking Technique for analyzing the rankings of set
of major and minor marketing problems that are faced by farmers during marketing of their
produce implies that, the critical problem that the farmers facing are intermediaries and lack of
organized marketing system. Both of them are not a serious issue in the proposed linkage as
here farmers will be the direct suppliers to hotels. The linkage eradicates the tension of prices
from the farmers mindset and as other working people he will also be getting a fixed monthly
payment through RTGs/Cheques. Similarly, there are many other major and minor problems
which will be get reduced in the proposed system of linkage. But among minor problems one
of the most important factor is illiteracy which will become a serious issue if left behind as
almost all the operation like tender, payments will be dealing with online system. So, there is
a need of preparation of farmer before linking farmers to system.
There will be more chances of getting rejected with the supplied produce from the
hotels. The farmers should be more alert in this situation with alternative means of marketing
such regrading and sorting of produce and supply it to near-by shandies if the produce not much
23 | P a g e
destroyed. If the produce is with less quality than he should go for the processing of the
vegetable into instant dishes and sell it which will at-least get the costs return.
Suggestions:
The following suggestions may be considered for further research and development based on
the above results.
The research clearly indicates that the profits earned by the proposed linkage are much
higher than the existing linkage. Therefore, need of the hour is to strengthen the linkage with
proper policy implications from state and center government.
As hoteliers demand stringent quality parameters, certifications and standardized
packaging which incur a cost to the supplier’s end. However, the price realization is far better
than other channel and suppliers got ultimate profit at the end of a procurement cycle. This
require initial investment which an individual farmer cannot bear hence farmers has to come
up with groups and form FPOs or Cooperatives to break the financial burden, to increase
marketing opportunities, to increase negotiations power and to enhance other operational
capabilities for better linkage and profit. In addition, skill-based training programmes focused
on quality, hygiene, certification and linkage process i.e. tendering and payment has to be
incorporated through various Govt. and NGOs in the farmer’s interest.
During the survey it was observed that farmers were not showing an interest towards the
hotel linkage because of lack of guidance and awareness about the innovative market. Hence,
the sensitization campaign has to be initiated in collaboration with 5-star hotels.
REFERENCES:
1. Area and Production of Horticultural crops: All India, Ministry of Agriculture and
Farmer’s Welfare 2017-18.
2. Food Sector- Fruits and Vegetables, Technova Research and Analysis (2015).
3. Indian Hotel Industry Survey 2016-2017, The Federation of Hotel and Restaurant
Associations of India.
4. hotel industry research, CARE Ratings 2017.
5. Hubsch, A.W. (1996). Cornell Hotel and Restaurant Administration Quarterly. Hotel
Food and Beverage Management. 7. pp. 9-11.
6. Amlani, R. (2016) NRAI Report.
7. Food Sector- Fruits and Vegetables, Director General and Foreign Trade, Technova
Research and Analysis, Indian Trade Agency (2015).
8. Taneja, S.T. (2008). The New Exotic Platter. Available at http://www.hindu.com.
9. Dhaka, B. L. and Poonia, M. K. (2010). Identification of Constraints Encountered by the
Farmers in Production and Marketing of Vegetables in Bundi District of Rajasthan.
Indian Journal of Agricultural Marketing, 24(1):20-25.
ANNEXURE
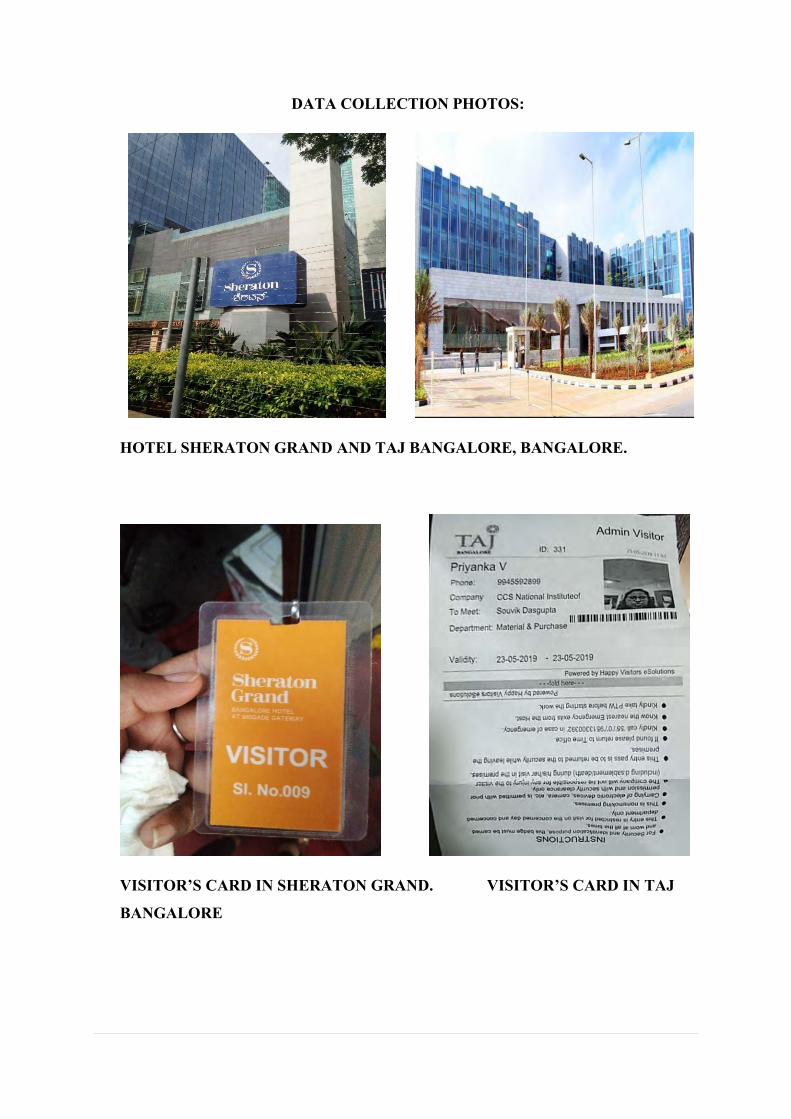
DATA COLLECTION PHOTOS:
HOTEL SHERATON GRAND AND TAJ BANGALORE, BANGALORE.
VISITOR’S CARD IN SHERATON GRAND. VISITOR’S CARD IN TAJ
BANGALORE
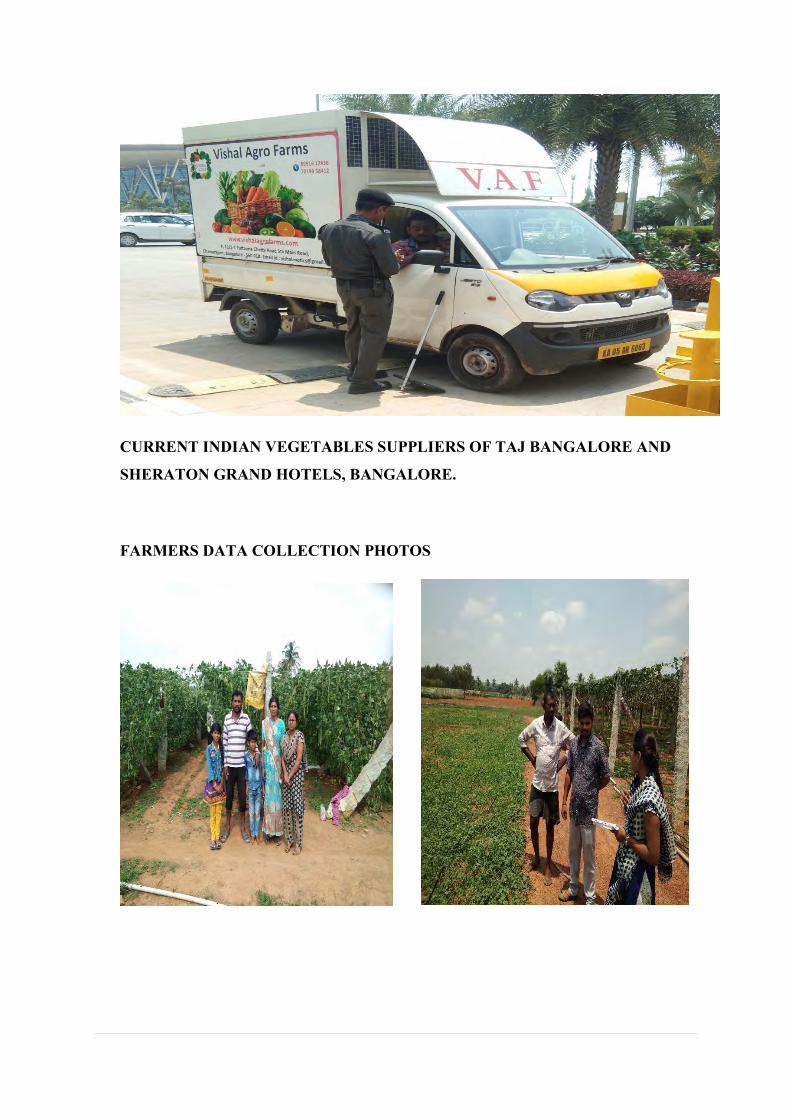
CURRENT INDIAN VEGETABLES SUPPLIERS OF TAJ BANGALORE AND
SHERATON GRAND HOTELS, BANGALORE.
FARMERS DATA COLLECTION PHOTOS
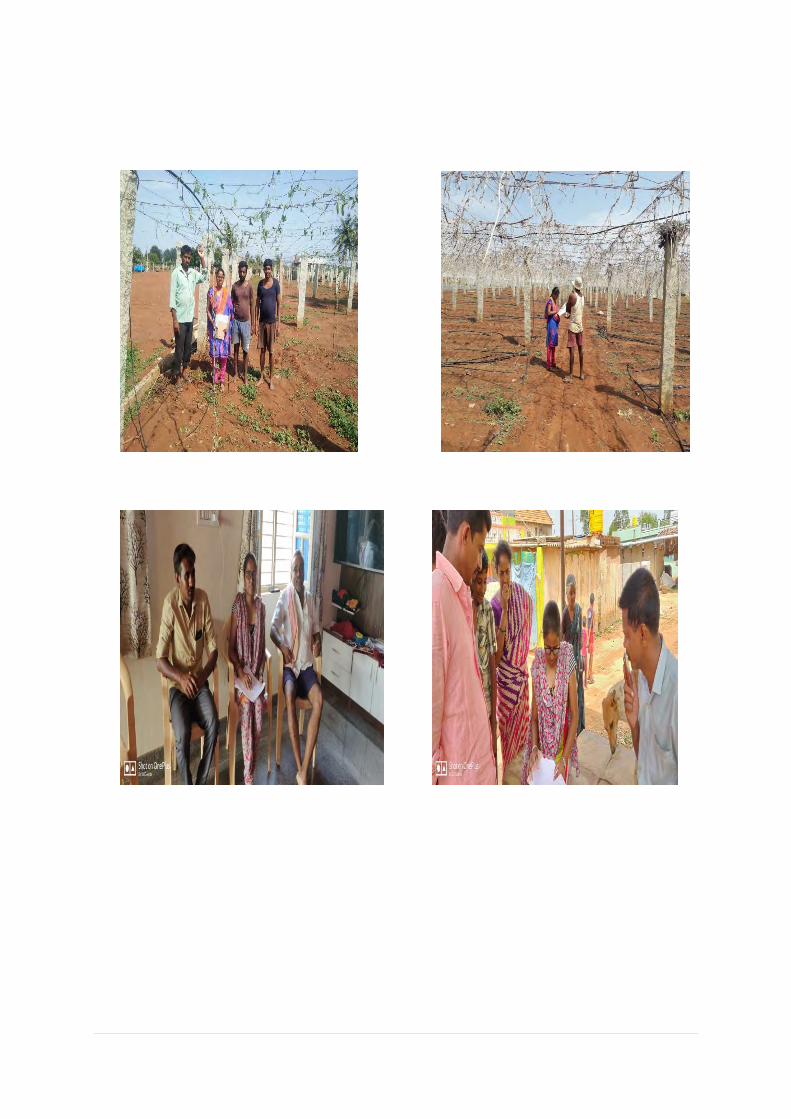
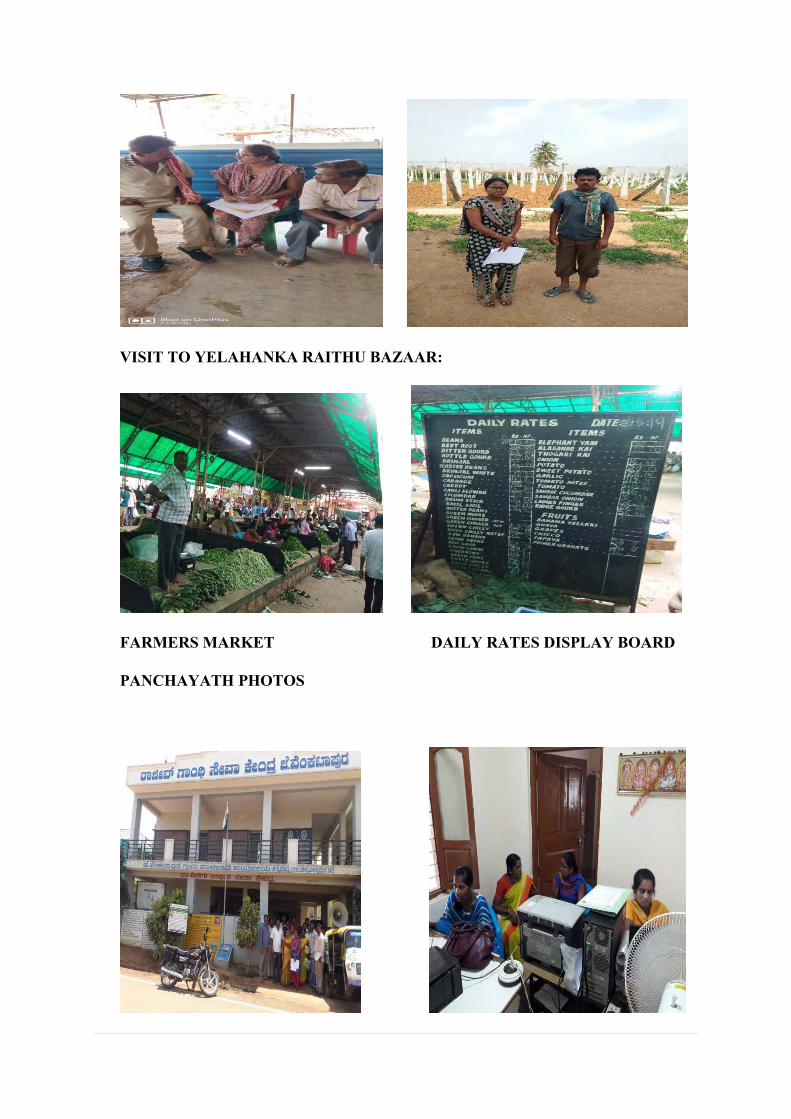
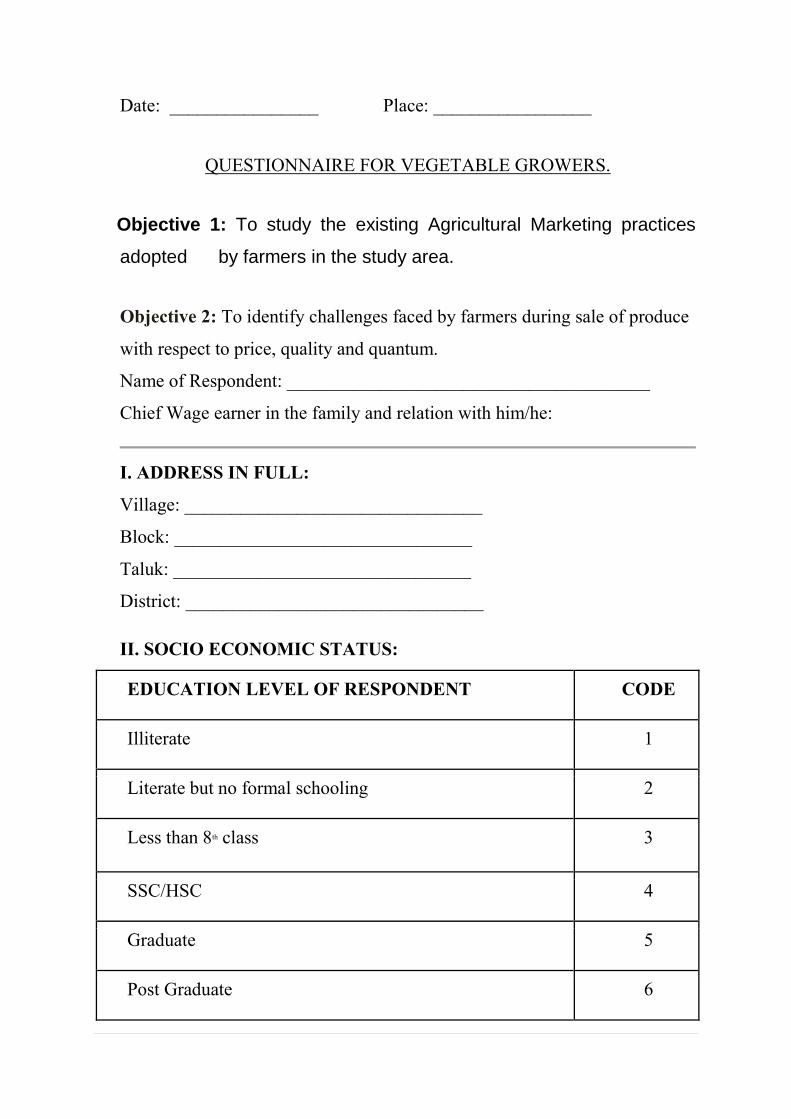
VISIT TO YELAHANKA RAITHU BAZAAR:
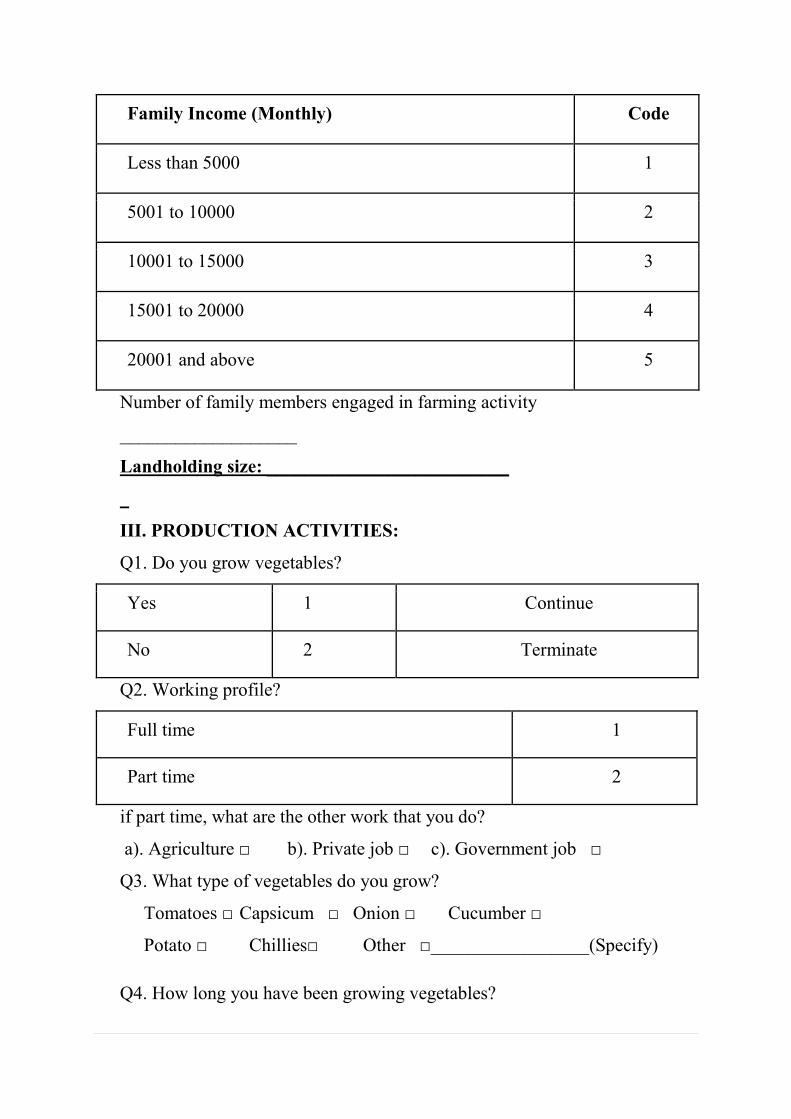
FARMERS MARKET DAILY RATES DISPLAY BOARD
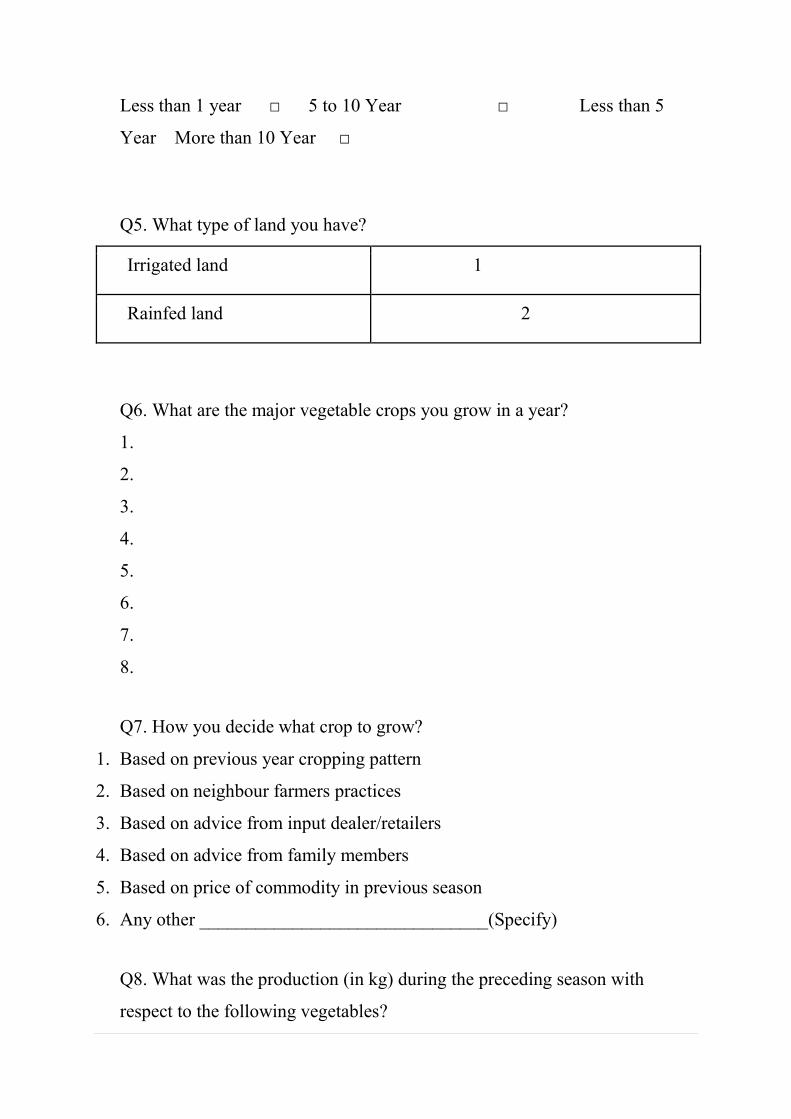
PANCHAYATH PHOTOS
Date: ________________ Place: _________________
QUESTIONNAIRE FOR VEGETABLE GROWERS.
Objective 1: To study the existing Agricultural Marketing practices
adopted by farmers in the study area.
Objective 2: To identify challenges faced by farmers during sale of produce
with respect to price, quality and quantum.
Name of Respondent: _______________________________________
Chief Wage earner in the family and relation with him/he:
I. ADDRESS IN FULL:
Village: ________________________________
Block: ________________________________
Taluk: ________________________________
District: ________________________________
II. SOCIO ECONOMIC STATUS:
EDUCATION LEVEL OF RESPONDENT CODE
Illiterate 1
Literate but no formal schooling 2
Less than 8th class 3
SSC/HSC 4
Graduate 5
Post Graduate 6
Family Income (Monthly) Code
Less than 5000 1
5001 to 10000 2
10001 to 15000 3
15001 to 20000 4
20001 and above 5
Number of family members engaged in farming activity
___________________
Landholding size: __________________________
III. PRODUCTION ACTIVITIES:
Q1. Do you grow vegetables?
Yes 1 Continue
No 2 Terminate
Q2. Working profile?
Full time 1
Part time 2
if part time, what are the other work that you do?
a). Agriculture □ b). Private job □ c). Government job □
Q3. What type of vegetables do you grow?
Tomatoes □ Capsicum □ Onion □ Cucumber □
Potato □ Chillies□ Other □_________________(Specify)
Q4. How long you have been growing vegetables?
Less than 1 year □ 5 to 10 Year □ Less than 5
Year More than 10 Year □
Q5. What type of land you have?
Irrigated land 1
Rainfed land 2
Q6. What are the major vegetable crops you grow in a year?
1.
2.
3.
4.
5.
6.
7.
8.
Q7. How you decide what crop to grow?
1. Based on previous year cropping pattern
2. Based on neighbour farmers practices
3. Based on advice from input dealer/retailers
4. Based on advice from family members
5. Based on price of commodity in previous season
6. Any other _______________________________(Specify)
Q8. What was the production (in kg) during the preceding season with
respect to the following vegetables?
SI.NO VEGETABLES QUANTITY (kg)
1
2
3
4
5
6
Q9. What are the costs incurred for production of the crop per acre in
rupees?
SI.NO VEGETABLES COSTS (Rs.)
1
2
3
4
5
6
Q10. Where did you sell your produce?
1. In door step to local vendor
2. In nearby Shandi or Haat (Weekly Market)
3. In retail shop
4. In APMC Market
5. Local trader’s place
6. Other _______________(Specify)
Q11: How you sell the produce?
1. Individually
2. Collectively in a small group
3. Collectively In a larger group
Q12. How frequently you sell the vegetables?
1. On daily basis
2. Every alternate day
3. weekly
Q13. How much time you spent during selling of vegetable?
____________________________Hrs
Q14. Do you follow grading and sorting practice for selling of your produce?
1. Yes
2. No
If yes- State the benefit of grading and sorting
1.
2.
3.
Q15. What are the prices of your produce that you get from market per kg?
Vegetables Price (Rs/kg)
Q16. How would you rank the problems faced while marketing your
produce?
No
Proble
m
Not
so
mu
ch
Mu
ch
Ver
y
Mu
ch
Sever
e
Proble
m
Illiteracy 1 2 3 4 5
Intermediates
problems (commission
agents, traders etc.)
1 2 3 4 5
Weights and scales 1 2 3 4 5
Financial problems 1 2 3 4 5
Lack of organised
marketing system
1 2 3 4 5
Lack of transportation 1 2 3 4 5
Standardisation and
grading problems
1 2 3 4 5
Lack of awareness of
market
1 2 3 4 5
Storage problems 1 2 3 4 5
Any other
(__________________
___)
1 2 3 4 5
Q17. Do you grow your vegetables organically?
1. Yes
2. No
If yes- Name the manures used,
1.
2.
3.
If no-What are the alternative fertilisers used?
1.
2.
3.
Q18. Do you undertake any control measures for insect and pest
management?
1. Yes
2. No
If yes-State the measure undergone
1.
2.
3.
If no-Why?
Q19. Do you undergo any special agronomic practices for better yields?
1. Yes
2. No
If yes- Mention them,
1.
2.
3.
Q20. What is the soil type of the agricultural land?
Red soil □ black soil □ sandy soil □ clay soil □
Q21. Do you undertake any special operations during harvesting to maintain
quality of the produce?
1. Yes
2. No
If yes- Mention them,
1.
2.
3.
Q22. Is there any special post-harvest operation do you undertake?
1. Yes
2. No
If yes- Mention them,
1.
2.
3.
IV. SOME OTHER QUESTIONS RELATED TO THE OBJECTIVES:
Q1. Would you like to sell your produce to Five-star hotels?
Yes 1 Continue
No 2 Terminate
Q2. Can you increase your area under cultivation and production of
particular crop if the hotels demand?
Yes 1 Continue
No 2 Terminate
Q3. Are you ready to cultivate other crops if demanded by Five-star hotels?
Yes 1 Continue
No 2 Terminate
Q4. Are you ready to swift to other cultural practices if Five-star hotels
demanded?
Yes 1 Continue
No 2 Terminate
Q5. Are you ready to maintain all the quality parameters that are asked by
Five-star hotels?
Yes 1 Continue
No 2 Terminate
HOTEL INTERVIEWSCHEDULE
Date:
I. GENERAL DETAILS:
Name of the hotel: ______________________
Address Details: ______________________
Email id: ______________________
Contact no: ______________________
Name of the respondent: ______________________
Respondent position in hotel: ______________________
II. WORKING DETAILS:
Q1. Did you ever procure vegetables from farmer/local growers? (Mark tick
wherever apply)
1. Yes
2. NO
If Yes, a) do you still buy vegetable from farmer/local growers?
1. Yes
2. No
If Yes - i) What are the major vegetables
1. 2. 3. 4
ii) From which area or village?
1. 2. 3. 4.
If No- i) Reasons for discontinuation-
1. ______________________
2. ______________________
3. ______________________
4. ______________________
5. ______________________
If No. From where you buy vegetables? List the sources.
1. ______________________
2. ______________________
3. ______________________
Q2. Whether you buy vegetables from same source or different source?
1. Same source
2. Different source
If Same source- State the reasons?
1. ______________________
2. ______________________
3. ______________________
4. ______________________
5. ______________________
If different source-State the reasons?
1. ______________________
2. ______________________
3. ______________________
4. ______________________
5. ______________________
Q3. What are the vegetables that are being used extensively for preparation?
1.
2.
3.
4.
5.
6.
Q4. Details about vegetable procurement? (*Price of Current Season)
SI.NO Vegetable Source of
procurement
Quantity/Week
or Qt/Month
Price
per
Kg. *
1
2
3
4
5
6
Q5. While purchasing vegetables what are the parameters you are looking
at?
SI.
N
O
Vege
table
Para
mete
r 1
Para
mete
r 2
Para
mete
r 3
Para
mete
r 4
Para
mete
r 5
Para
mete
r 6
1
2
3
4
5
6
7
Q6. How frequent you purchase vegetables
1. Daily basis
2. On Alternate day
3. Twice Weekly
4. Once in a week
5. In a fortnight
Q7. Do you have any storage facility for preserving vegetables?
1. Yes
2. NO
If Yes: For how long you preserve vegetables with you. _____________
Q8: Do you get vegetable produce at your doorstep?
1. Yes
2. NO
If No: How far you have to visit for Purchasing (Provide
details)_____________
_____________________________________________________________
_____________________________________________________________
___________________________________
Q9. What are the different costs involved in procurement of vegetables?
SI.NO Activities Estimated Cost in Rs.
1
2
3
4
5
6
Q10. What is the purchase policy you have with respect to release of
payment?
1. On spot settlement
2. Credit basis
If Credit basis- what is the time for payment _____________________
Q11. What is the mode of payment?
1. Cash
2. Cheque
3. Other ___________________ (Specify)
Q12. Do you have any suggestions regarding linking of vegetable growers to
five-star hotel?
_____________________________________________________________
_____________________________________________________________
_____________________________________________________________
_____