Embed Size (px)
Citation preview
Linking the Wisconsin Forward Assessments to NWEA MAP Growth Tests* *AsofJune2017MeasuresofAcademicProgress®(MAP®)isknownasMAP®Growth™. January 2017
Page2of26
Introduction
NorthwestEvaluationAssociation™ (NWEA™) is committed toprovidingpartnerswithusefultoolstohelpmakeinferencesfromtheMeasuresofAcademicProgress®(MAP®)interimassessment scores. One important tool is the concordance table between MAP and statesummativeassessments.Concordance tableshavebeenused fordecades to relate scoresondifferent testsmeasuring similar but distinct constructs. These tables, typically derived fromstatisticallinkingprocedures,provideadirectlinkbetweenscoresondifferenttestsandservevarious purposes. Aside fromdescribing how a score on one test relates to performance onanothertest,theycanalsobeusedtoidentifybenchmarkscoresononetestcorrespondingtoperformancecategoriesonanothertest,ortomaintaincontinuityofscoresonatestafterthetest is redesigned or changed. Concordance tables are helpful for educators, parents,administrators,researchers,andpolicymakerstoevaluateandformulateacademicstandingandgrowth.
Recently,NWEAcompletedaconcordancestudytoconnectthescalesoftheWisconsinForwardAssessmentsEnglishLanguageArts(ELA)andmathwiththoseoftheMAPReadingandMAPforMathematicsassessments.Inthisreport,wepresentthe2ndthrough8thgradecutscoresonMAPreadingandmathematicsscalesthatcorrespondtothebenchmarksontheForwardELAandmathtests.InformationabouttheconsistencyrateofclassificationbasedontheestimatedMAP cut scores is also provided, alongwith a series of tables that predict the probability ofreceiving a Level 3 (i.e., “Proficient”) or higher performance designation on the Forwardassessments,basedontheobservedMAPscorestakenduringthesameschoolyear.AdetaileddescriptionofthedataandanalysismethodusedinthisstudyisprovidedintheAppendix.
OverviewofAssessments
Forward includes a series of achievement tests aligned to the Wisconsin AcademicStandards inELAandmathforgrades3-8.Forwardtestsaredeliveredbothonlineandinthepaper-and-pencilform.Foreachgradeandsubject,therearethreecutscoresthatdistinguishbetweenperformancelevels:Level1:BelowBasic,Level2:Basic,Level3:Proficient,andLevel4:Advanced.TheLevel3cutscoredemarkstheminimumlevelofperformanceconsideredtobe“proficient”foraccountabilitypurposes.
MAPtestsare interimassessmentsthatareadministered intheformofcomputerizedadaptivetest(CAT).MAPtestsareconstructedtomeasurestudentachievementfromGradesKto12inmath,reading,languageusage,andscienceandalignedtotheWisconsinStateStandards.LikeForward,MAPassessmentsareverticallyscaledacrossgrades,afeaturethatsupportsdirectmeasurementofacademicgrowthandchange.MAPscoresarereportedonaRaschUnit(RIT)
Page3of26
scalewitharangefrom100to350.EachsubjecthasitsownRITscale.ToaidinterpretationofMAPscores,NWEAperiodicallyconductsnormingstudiesofstudentandschoolperformanceonMAP.Forexample,the2015RITScaleNormingStudy(Thum&Hauser,2015)employedmulti-levelgrowthmodelsonnearly500,000longitudinaltestscoresfromover100,000studentsthatwere weighted to create large, nationally representative norms formath, reading, languageusage,andgeneralscience.
EstimatedMAPCutScoresAssociatedwithForwardReadinessLevels
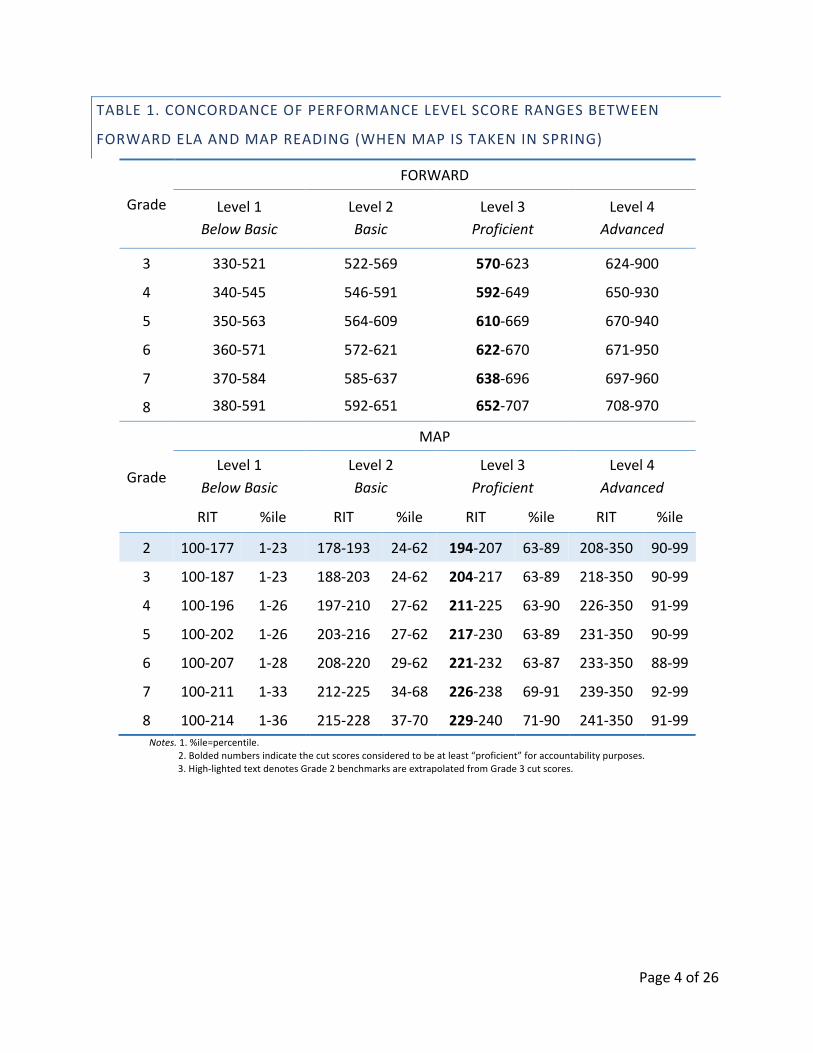
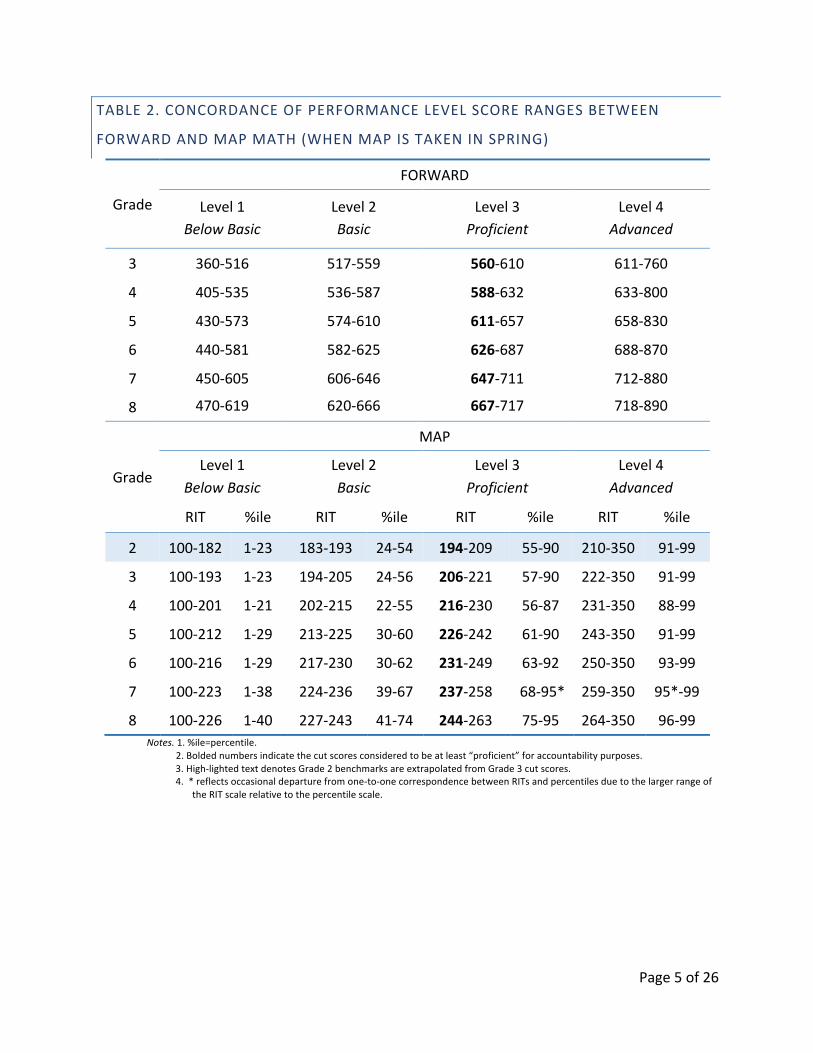
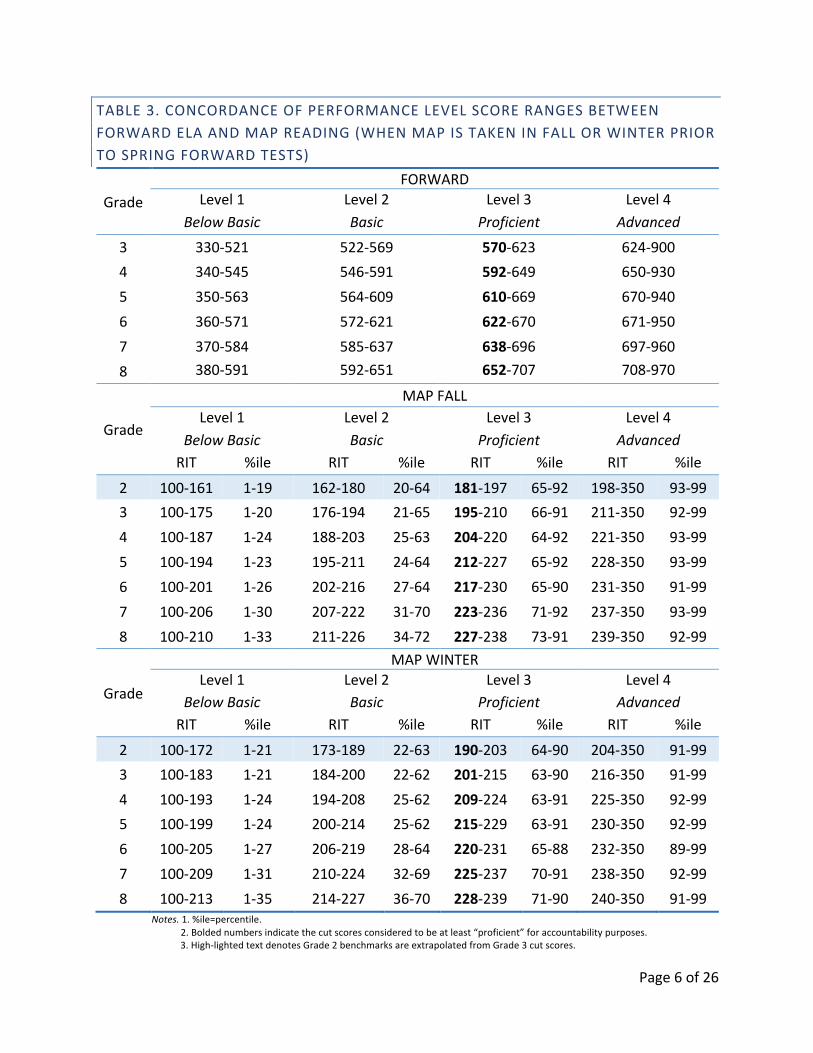
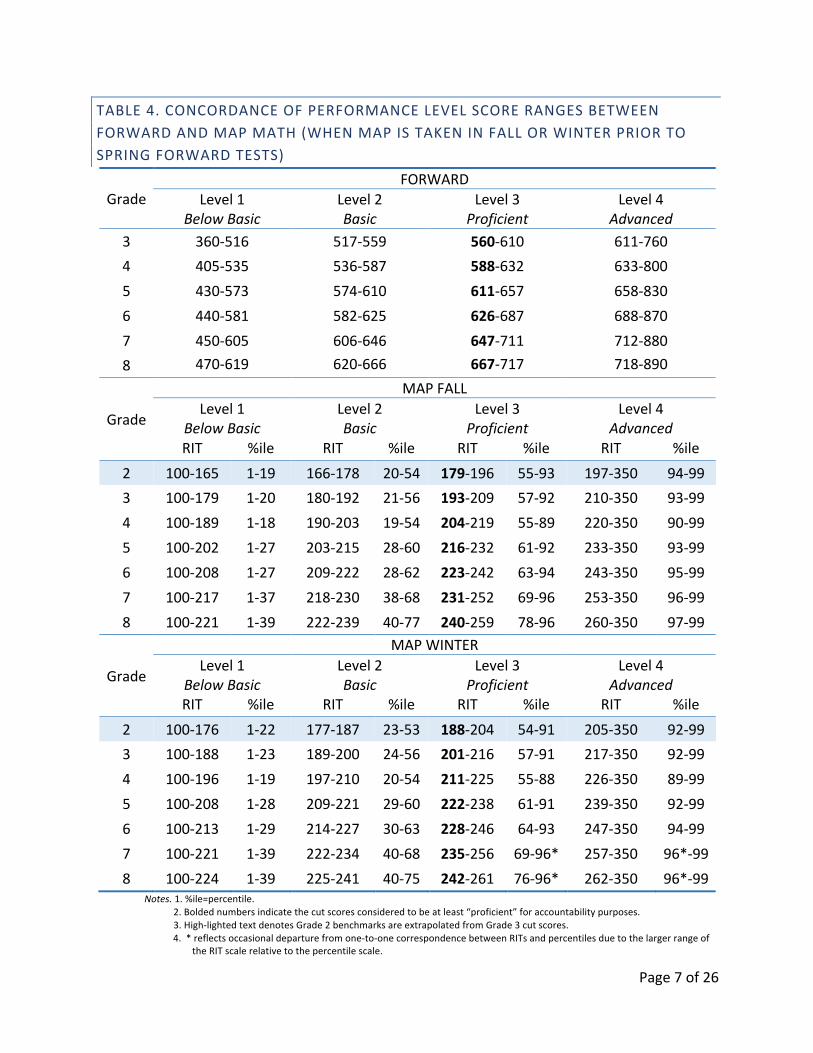
Tables 1 to 4 report the Forward scaled scores associated with each of the fourperformancelevels,aswellastheestimatedscorerangeontheMAPtestsassociatedwitheachForwardperformancelevel.Specifically,Tables1and2applytoMAPscoresobtainedduringthespringtestingseasonforreadingandmath,respectively.Tables3and4applytoMAPteststakeninapriortestingseason(fallorwinter)forreadingandmath,respectively.Thetablesalsoreportthepercentilerank(basedontheNWEA2015MAPNorms)associatedwitheachestimatedMAPcut score. The MAP cut scores can be used to predict students’ most probable Forwardperformancelevel,basedontheirobservedMAPscores.Forexample,a5thgradestudentwhoobtainedaMAPmathscoreof240inthespringtestingseasonislikelytobeattheveryhighendof Level 3 (Proficient) on the Forward taken during that same testing season (see Table 2).Similarly,a3rdgradestudentwhoobtainedaMAPreadingscoreof215inthefalltestingseasonislikelytobeatLevel4(Advanced)ontheForwardtakeninthespringof3rdgrade(seeTable3).
Page4of26
TABLE1.CONCORDANCEOFPERFORMANCELEVELSCORERANGESBETWEEN
FORWARDELAANDMAPREADING(WHENMAPISTAKENINSPRING)
Grade
FORWARD
Level1BelowBasic
Level2Basic
Level3Proficient
Level4Advanced
3 330-521 522-569 570-623 624-900
4 340-545 546-591 592-649 650-930
5 350-563 564-609 610-669 670-940
6 360-571 572-621 622-670 671-950
7 370-584 585-637 638-696 697-960
8 380-591 592-651 652-707 708-970
Grade
MAP
Level1BelowBasic
Level2Basic
Level3Proficient
Level4Advanced
RIT %ile RIT %ile RIT %ile RIT %ile
2 100-177 1-23 178-193 24-62 194-207 63-89 208-350 90-99
3 100-187 1-23 188-203 24-62 204-217 63-89 218-350 90-99
4 100-196 1-26 197-210 27-62 211-225 63-90 226-350 91-99
5 100-202 1-26 203-216 27-62 217-230 63-89 231-350 90-99
6 100-207 1-28 208-220 29-62 221-232 63-87 233-350 88-99
7 100-211 1-33 212-225 34-68 226-238 69-91 239-350 92-99
8 100-214 1-36 215-228 37-70 229-240 71-90 241-350 91-99 Notes.1.%ile=percentile.2.Boldednumbersindicatethecutscoresconsideredtobeatleast“proficient”foraccountabilitypurposes. 3.High-lightedtextdenotesGrade2benchmarksareextrapolatedfromGrade3cutscores.
Page5of26
TABLE2.CONCORDANCEOFPERFORMANCELEVELSCORERANGESBETWEEN
FORWARDANDMAPMATH(WHENMAPISTAKENINSPRING)
Grade
FORWARD
Level1BelowBasic
Level2Basic
Level3Proficient
Level4Advanced
3 360-516 517-559 560-610 611-760
4 405-535 536-587 588-632 633-800
5 430-573 574-610 611-657 658-830
6 440-581 582-625 626-687 688-870
7 450-605 606-646 647-711 712-880
8 470-619 620-666 667-717 718-890
Grade
MAP
Level1BelowBasic
Level2Basic
Level3Proficient
Level4Advanced
RIT %ile RIT %ile RIT %ile RIT %ile
2 100-182 1-23 183-193 24-54 194-209 55-90 210-350 91-99
3 100-193 1-23 194-205 24-56 206-221 57-90 222-350 91-99
4 100-201 1-21 202-215 22-55 216-230 56-87 231-350 88-99
5 100-212 1-29 213-225 30-60 226-242 61-90 243-350 91-99
6 100-216 1-29 217-230 30-62 231-249 63-92 250-350 93-99
7 100-223 1-38 224-236 39-67 237-258 68-95* 259-350 95*-99
8 100-226 1-40 227-243 41-74 244-263 75-95 264-350 96-99 Notes.1.%ile=percentile.2.Boldednumbersindicatethecutscoresconsideredtobeatleast“proficient”foraccountabilitypurposes. 3.High-lightedtextdenotesGrade2benchmarksareextrapolatedfromGrade3cutscores.
4.*reflectsoccasionaldeparturefromone-to-onecorrespondencebetweenRITsandpercentilesduetothelargerrangeoftheRITscalerelativetothepercentilescale.
Page6of26
TABLE3.CONCORDANCEOFPERFORMANCELEVELSCORERANGESBETWEENFORWARDELAANDMAPREADING(WHENMAPISTAKENINFALLORWINTERPRIORTOSPRINGFORWARDTESTS)
GradeFORWARD
Level1BelowBasic
Level2Basic
Level3Proficient
Level4Advanced
3 330-521 522-569 570-623 624-9004 340-545 546-591 592-649 650-9305 350-563 564-609 610-669 670-9406 360-571 572-621 622-670 671-9507 370-584 585-637 638-696 697-9608 380-591 592-651 652-707 708-970
Grade
MAPFALLLevel1
BelowBasicLevel2Basic
Level3Proficient
Level4Advanced
RIT %ile RIT %ile RIT %ile RIT %ile2 100-161 1-19 162-180 20-64 181-197 65-92 198-350 93-993 100-175 1-20 176-194 21-65 195-210 66-91 211-350 92-994 100-187 1-24 188-203 25-63 204-220 64-92 221-350 93-995 100-194 1-23 195-211 24-64 212-227 65-92 228-350 93-996 100-201 1-26 202-216 27-64 217-230 65-90 231-350 91-997 100-206 1-30 207-222 31-70 223-236 71-92 237-350 93-998 100-210 1-33 211-226 34-72 227-238 73-91 239-350 92-99
Grade
MAPWINTERLevel1
BelowBasicLevel2Basic
Level3Proficient
Level4Advanced
RIT %ile RIT %ile RIT %ile RIT %ile2 100-172 1-21 173-189 22-63 190-203 64-90 204-350 91-993 100-183 1-21 184-200 22-62 201-215 63-90 216-350 91-994 100-193 1-24 194-208 25-62 209-224 63-91 225-350 92-995 100-199 1-24 200-214 25-62 215-229 63-91 230-350 92-996 100-205 1-27 206-219 28-64 220-231 65-88 232-350 89-997 100-209 1-31 210-224 32-69 225-237 70-91 238-350 92-998 100-213 1-35 214-227 36-70 228-239 71-90 240-350 91-99
Notes.1.%ile=percentile.2.Boldednumbersindicatethecutscoresconsideredtobeatleast“proficient”foraccountabilitypurposes.
3.High-lightedtextdenotesGrade2benchmarksareextrapolatedfromGrade3cutscores.
Page7of26
TABLE4.CONCORDANCEOFPERFORMANCELEVELSCORERANGESBETWEENFORWARDANDMAPMATH(WHENMAPISTAKENINFALLORWINTERPRIORTOSPRINGFORWARDTESTS)
GradeFORWARD
Level1BelowBasic
Level2Basic
Level3Proficient
Level4Advanced
3 360-516 517-559 560-610 611-7604 405-535 536-587 588-632 633-8005 430-573 574-610 611-657 658-8306 440-581 582-625 626-687 688-8707 450-605 606-646 647-711 712-8808 470-619 620-666 667-717 718-890
Grade
MAPFALLLevel1
BelowBasicLevel2Basic
Level3Proficient
Level4Advanced
RIT %ile RIT %ile RIT %ile RIT %ile2 100-165 1-19 166-178 20-54 179-196 55-93 197-350 94-993 100-179 1-20 180-192 21-56 193-209 57-92 210-350 93-994 100-189 1-18 190-203 19-54 204-219 55-89 220-350 90-995 100-202 1-27 203-215 28-60 216-232 61-92 233-350 93-996 100-208 1-27 209-222 28-62 223-242 63-94 243-350 95-997 100-217 1-37 218-230 38-68 231-252 69-96 253-350 96-998 100-221 1-39 222-239 40-77 240-259 78-96 260-350 97-99
Grade
MAPWINTERLevel1
BelowBasicLevel2Basic
Level3Proficient
Level4Advanced
RIT %ile RIT %ile RIT %ile RIT %ile2 100-176 1-22 177-187 23-53 188-204 54-91 205-350 92-993 100-188 1-23 189-200 24-56 201-216 57-91 217-350 92-994 100-196 1-19 197-210 20-54 211-225 55-88 226-350 89-995 100-208 1-28 209-221 29-60 222-238 61-91 239-350 92-996 100-213 1-29 214-227 30-63 228-246 64-93 247-350 94-997 100-221 1-39 222-234 40-68 235-256 69-96* 257-350 96*-998 100-224 1-39 225-241 40-75 242-261 76-96* 262-350 96*-99
Notes.1.%ile=percentile.2.Boldednumbersindicatethecutscoresconsideredtobeatleast“proficient”foraccountabilitypurposes.3.High-lightedtextdenotesGrade2benchmarksareextrapolatedfromGrade3cutscores.
4.*reflectsoccasionaldeparturefromone-to-onecorrespondencebetweenRITsandpercentilesduetothelargerrangeoftheRITscalerelativetothepercentilescale.
Page8of26
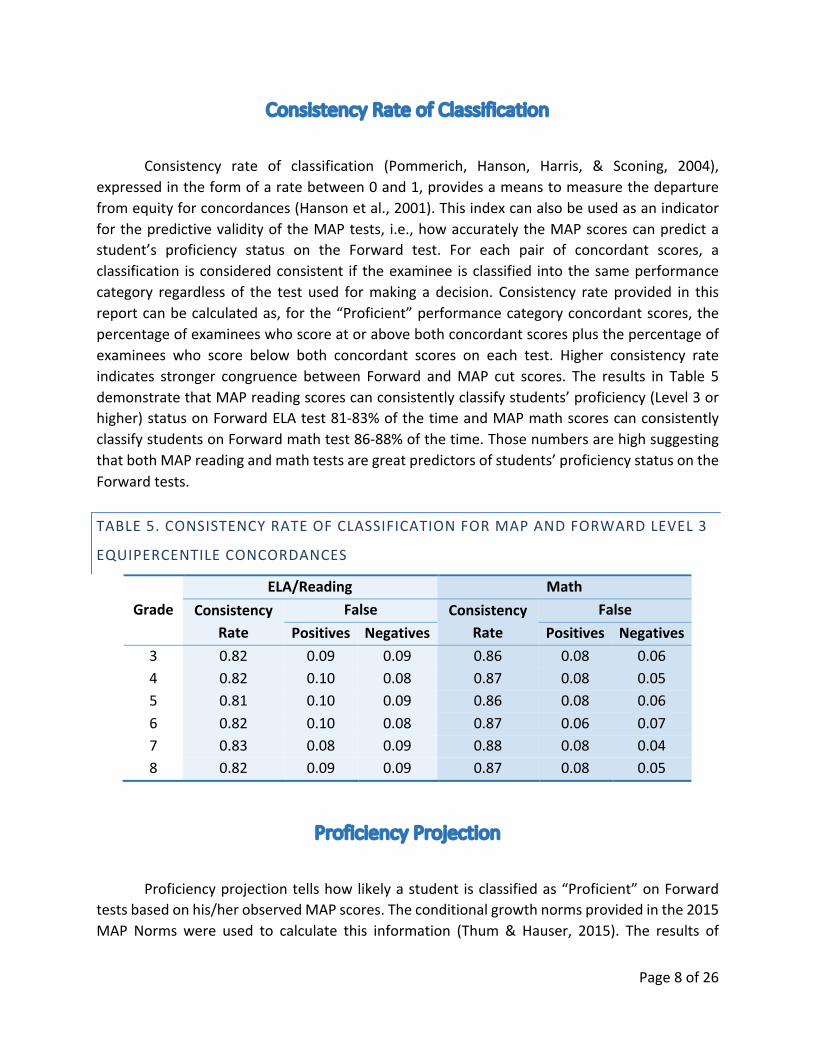
ConsistencyRateofClassification
Consistency rate of classification (Pommerich, Hanson, Harris, & Sconing, 2004),expressedintheformofaratebetween0and1,providesameanstomeasurethedeparturefromequityforconcordances(Hansonetal.,2001).ThisindexcanalsobeusedasanindicatorforthepredictivevalidityoftheMAPtests, i.e.,howaccuratelytheMAPscorescanpredictastudent’s proficiency status on the Forward test. For each pair of concordant scores, aclassification isconsideredconsistent if theexaminee isclassified intothesameperformancecategory regardless of the test used formaking a decision. Consistency rate provided in thisreportcanbecalculatedas,forthe“Proficient”performancecategoryconcordantscores,thepercentageofexamineeswhoscoreatorabovebothconcordantscoresplusthepercentageofexaminees who score below both concordant scores on each test. Higher consistency rateindicates stronger congruence between Forward andMAP cut scores. The results in Table 5demonstratethatMAPreadingscorescanconsistentlyclassifystudents’proficiency(Level3orhigher)statusonForwardELAtest81-83%ofthetimeandMAPmathscorescanconsistentlyclassifystudentsonForwardmathtest86-88%ofthetime.ThosenumbersarehighsuggestingthatbothMAPreadingandmathtestsaregreatpredictorsofstudents’proficiencystatusontheForwardtests.
TABLE5.CONSISTENCYRATEOFCLASSIFICATIONFORMAPANDFORWARDLEVEL3
EQUIPERCENTILECONCORDANCES
GradeELA/Reading Math
ConsistencyRate
False ConsistencyRate
FalsePositives Negatives Positives Negatives
3 0.82 0.09 0.09 0.86 0.08 0.064 0.82 0.10 0.08 0.87 0.08 0.055 0.81 0.10 0.09 0.86 0.08 0.066 0.82 0.10 0.08 0.87 0.06 0.077 0.83 0.08 0.09 0.88 0.08 0.048 0.82 0.09 0.09 0.87 0.08 0.05
ProficiencyProjection
Proficiencyprojectiontellshowlikelyastudent isclassifiedas“Proficient”onForwardtestsbasedonhis/herobservedMAPscores.Theconditionalgrowthnormsprovidedinthe2015MAP Norms were used to calculate this information (Thum& Hauser, 2015). The results of
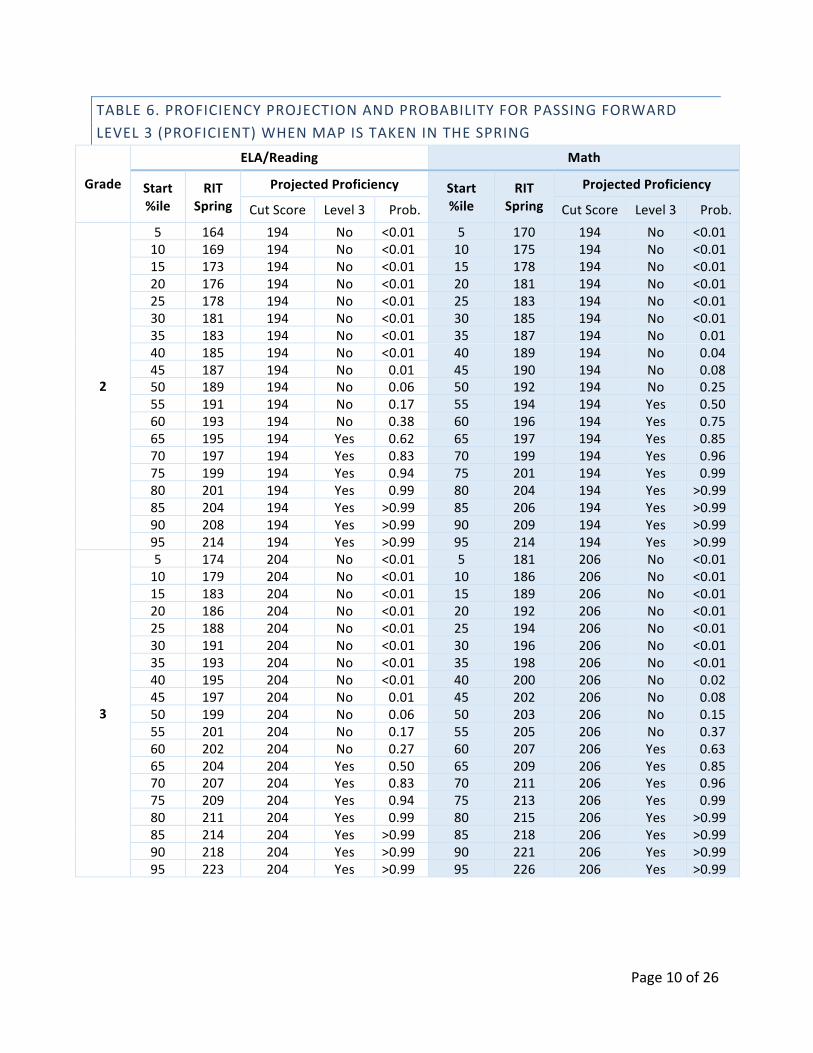
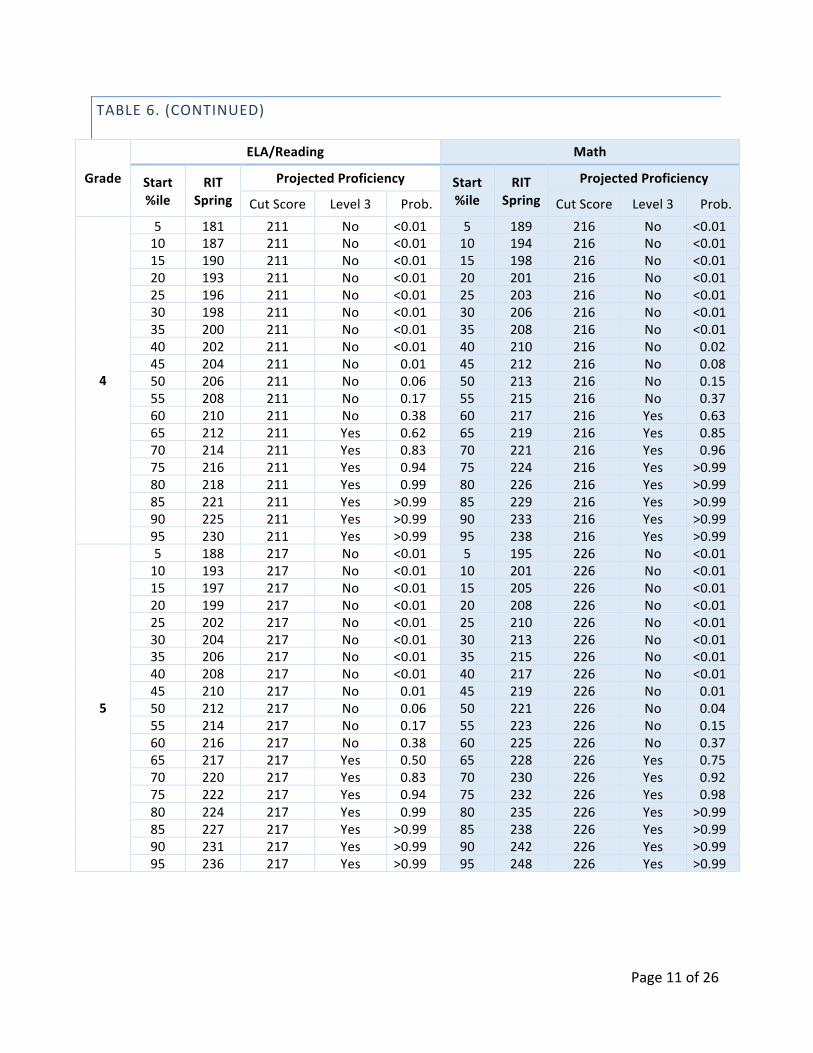
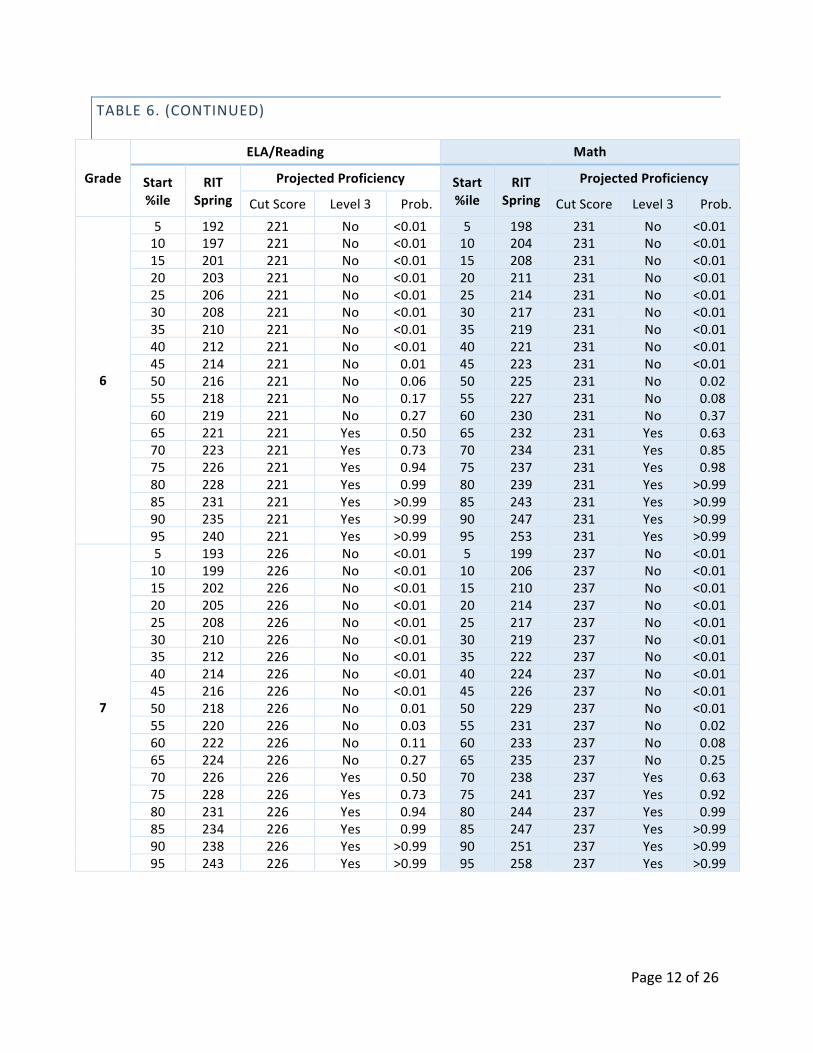
Page9of26
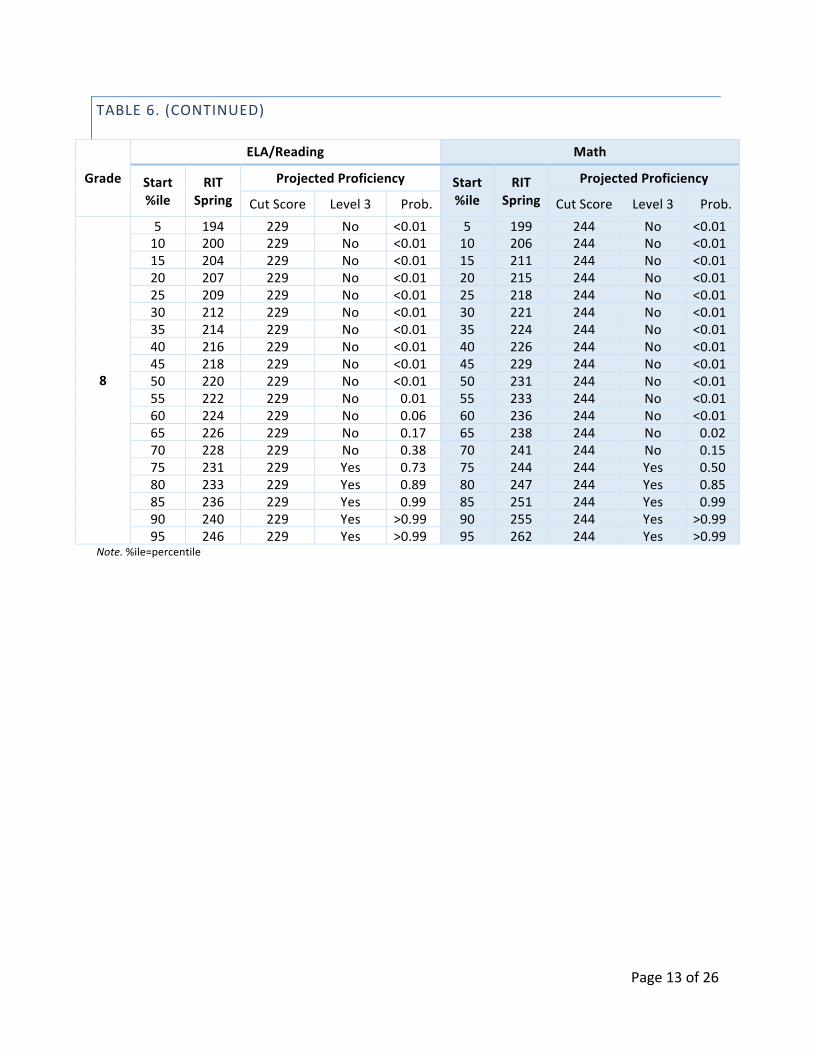
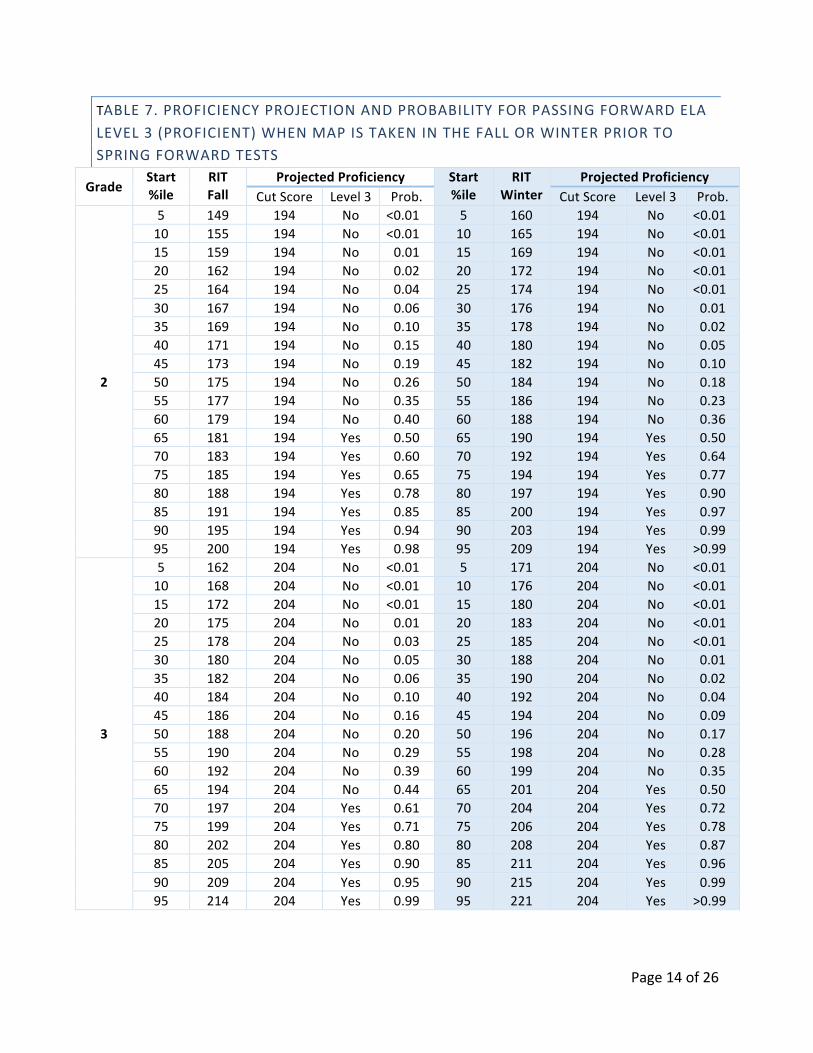
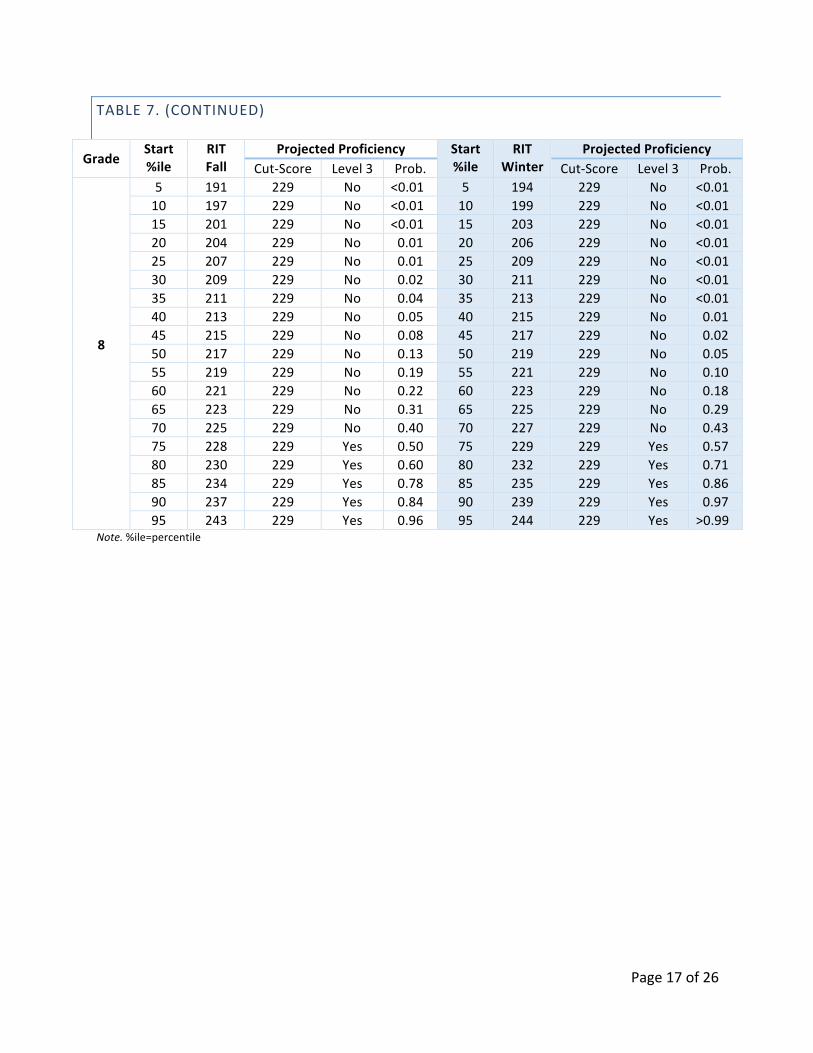
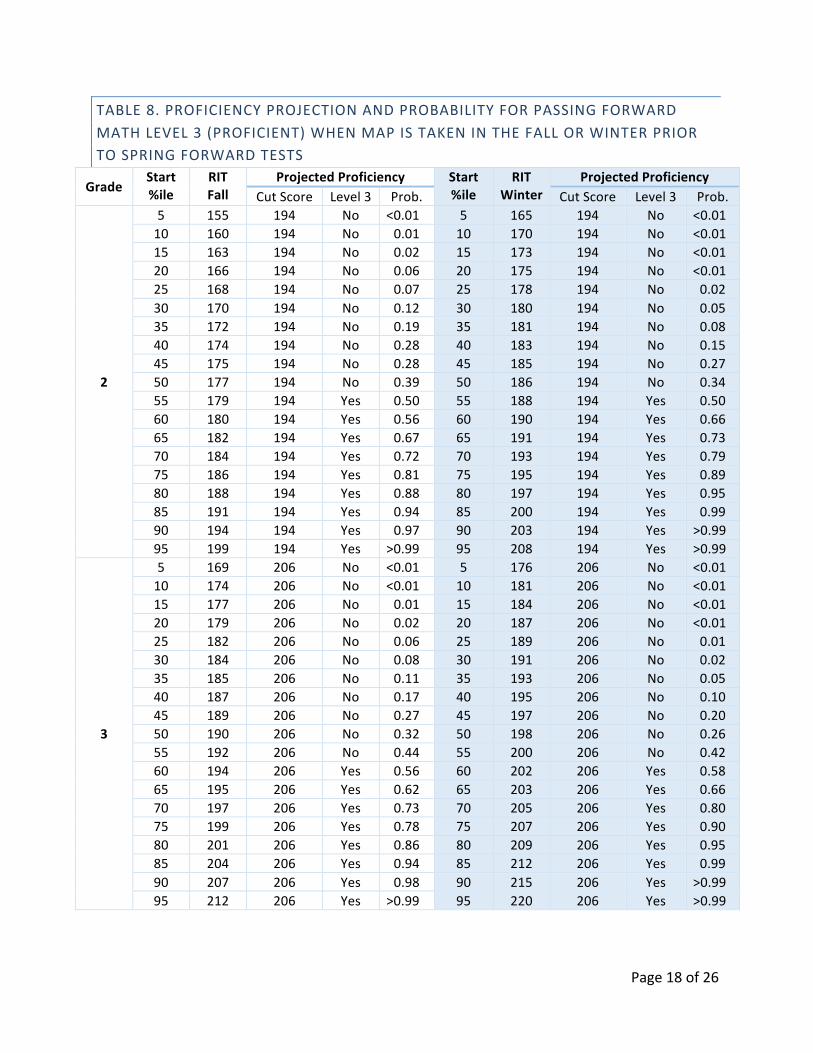
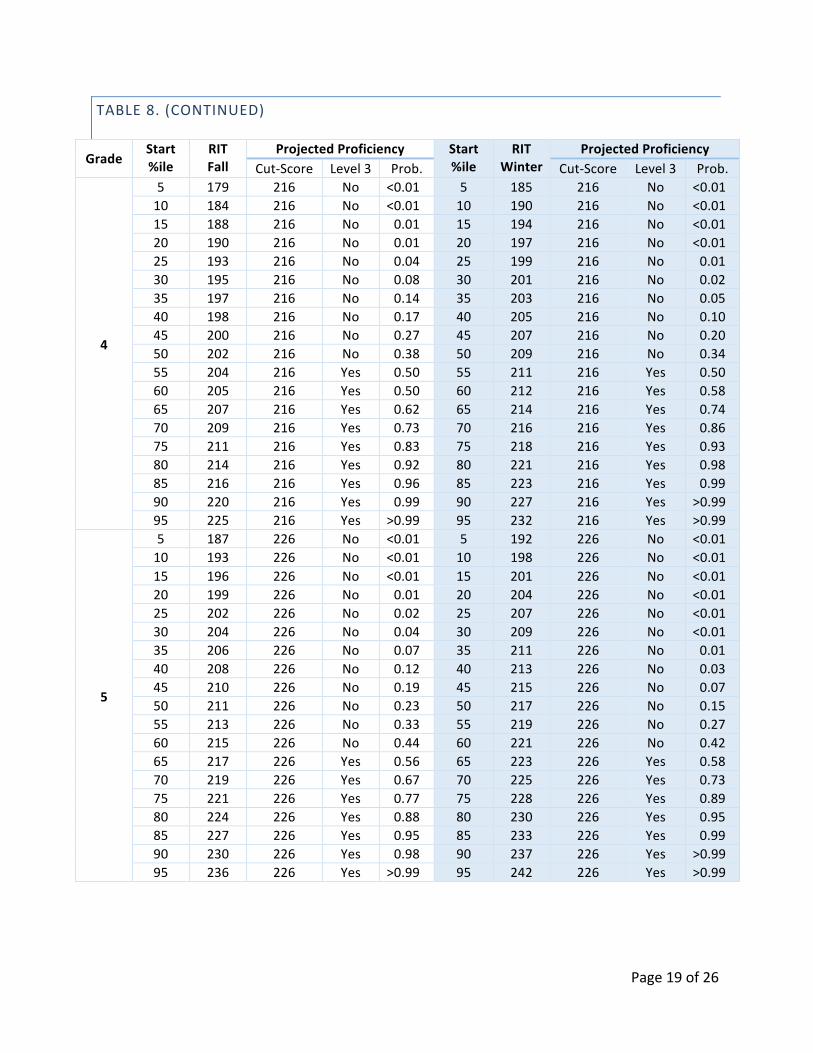
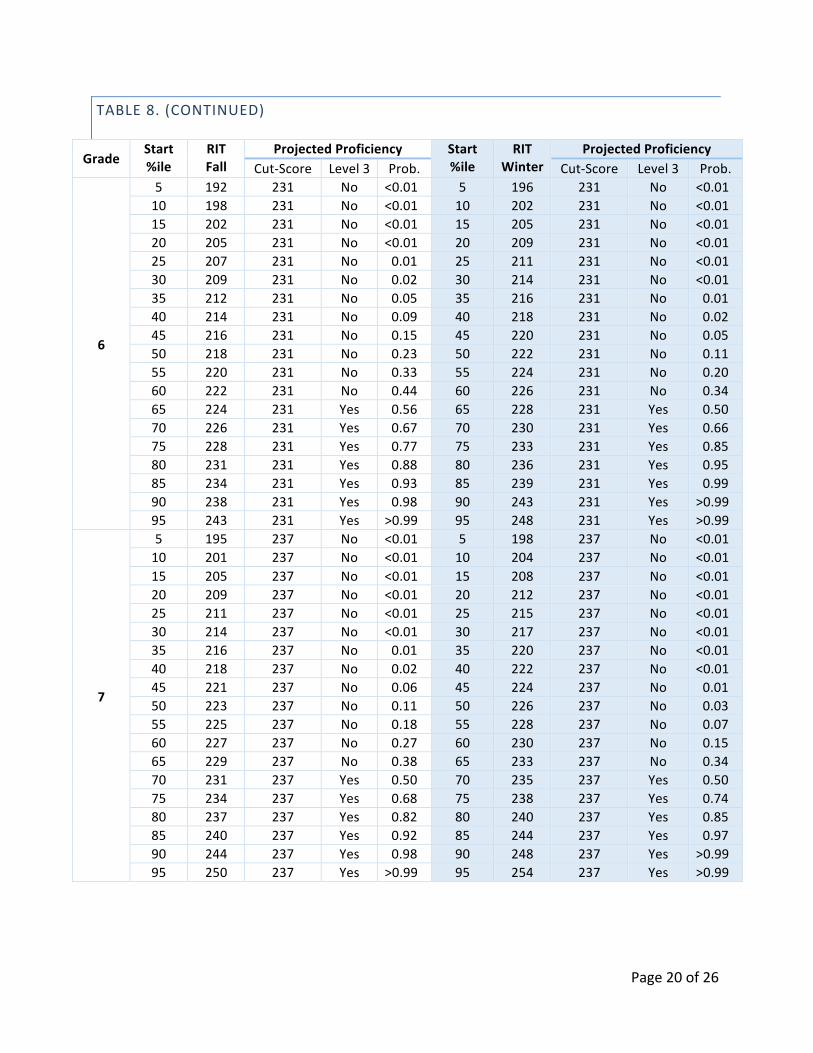
proficiencyprojectionandcorrespondingprobabilityofachieving“Proficient”ontheForwardtestsarepresentedinTables6to8.ThesetablesestimatetheprobabilityofscoringatLevel3oraboveonForwardinthespringandthepriorfallorwintertestingseason.Forexample,ifa3rdgradestudentobtainedaMAPreadingscoreof199inthefall,theprobabilityofobtainingaLevel3 or higher Forward score in the spring of 3rd grade is 71%. Table 6 presents the estimatedprobabilityofmeetingLevel3benchmarkwhenMAPistakeninthespring,whereasTables7and8presenttheestimatedprobabilityofmeetingLevel3benchmarkwhenMAPistakeninthefallorwinterpriortotakingtheForwardtests.
Page10of26
TABLE6.PROFICIENCYPROJECTIONANDPROBABILITYFORPASSINGFORWARDLEVEL3(PROFICIENT)WHENMAPISTAKENINTHESPRING
Grade
ELA/Reading Math
Start%ile
RITSpring
ProjectedProficiency Start%ile
RITSpring
ProjectedProficiency
CutScore Level3 Prob. CutScore Level3 Prob.
2
5 164 194 No <0.01 5 170 194 No <0.0110 169 194 No <0.01 10 175 194 No <0.0115 173 194 No <0.01 15 178 194 No <0.0120 176 194 No <0.01 20 181 194 No <0.0125 178 194 No <0.01 25 183 194 No <0.0130 181 194 No <0.01 30 185 194 No <0.0135 183 194 No <0.01 35 187 194 No 0.0140 185 194 No <0.01 40 189 194 No 0.0445 187 194 No 0.01 45 190 194 No 0.0850 189 194 No 0.06 50 192 194 No 0.2555 191 194 No 0.17 55 194 194 Yes 0.5060 193 194 No 0.38 60 196 194 Yes 0.7565 195 194 Yes 0.62 65 197 194 Yes 0.8570 197 194 Yes 0.83 70 199 194 Yes 0.9675 199 194 Yes 0.94 75 201 194 Yes 0.9980 201 194 Yes 0.99 80 204 194 Yes >0.9985 204 194 Yes >0.99 85 206 194 Yes >0.9990 208 194 Yes >0.99 90 209 194 Yes >0.9995 214 194 Yes >0.99 95 214 194 Yes >0.99
3
5 174 204 No <0.01 5 181 206 No <0.0110 179 204 No <0.01 10 186 206 No <0.0115 183 204 No <0.01 15 189 206 No <0.0120 186 204 No <0.01 20 192 206 No <0.0125 188 204 No <0.01 25 194 206 No <0.0130 191 204 No <0.01 30 196 206 No <0.0135 193 204 No <0.01 35 198 206 No <0.0140 195 204 No <0.01 40 200 206 No 0.0245 197 204 No 0.01 45 202 206 No 0.0850 199 204 No 0.06 50 203 206 No 0.1555 201 204 No 0.17 55 205 206 No 0.3760 202 204 No 0.27 60 207 206 Yes 0.6365 204 204 Yes 0.50 65 209 206 Yes 0.8570 207 204 Yes 0.83 70 211 206 Yes 0.9675 209 204 Yes 0.94 75 213 206 Yes 0.9980 211 204 Yes 0.99 80 215 206 Yes >0.9985 214 204 Yes >0.99 85 218 206 Yes >0.9990 218 204 Yes >0.99 90 221 206 Yes >0.9995 223 204 Yes >0.99 95 226 206 Yes >0.99
Page11of26
TABLE6.(CONTINUED)
Grade
ELA/Reading Math
Start%ile
RITSpring
ProjectedProficiency Start%ile
RITSpring
ProjectedProficiency
CutScore Level3 Prob. CutScore Level3 Prob.
4
5 181 211 No <0.01 5 189 216 No <0.0110 187 211 No <0.01 10 194 216 No <0.0115 190 211 No <0.01 15 198 216 No <0.0120 193 211 No <0.01 20 201 216 No <0.0125 196 211 No <0.01 25 203 216 No <0.0130 198 211 No <0.01 30 206 216 No <0.0135 200 211 No <0.01 35 208 216 No <0.0140 202 211 No <0.01 40 210 216 No 0.0245 204 211 No 0.01 45 212 216 No 0.0850 206 211 No 0.06 50 213 216 No 0.1555 208 211 No 0.17 55 215 216 No 0.3760 210 211 No 0.38 60 217 216 Yes 0.6365 212 211 Yes 0.62 65 219 216 Yes 0.8570 214 211 Yes 0.83 70 221 216 Yes 0.9675 216 211 Yes 0.94 75 224 216 Yes >0.9980 218 211 Yes 0.99 80 226 216 Yes >0.9985 221 211 Yes >0.99 85 229 216 Yes >0.9990 225 211 Yes >0.99 90 233 216 Yes >0.9995 230 211 Yes >0.99 95 238 216 Yes >0.99
5
5 188 217 No <0.01 5 195 226 No <0.0110 193 217 No <0.01 10 201 226 No <0.0115 197 217 No <0.01 15 205 226 No <0.0120 199 217 No <0.01 20 208 226 No <0.0125 202 217 No <0.01 25 210 226 No <0.0130 204 217 No <0.01 30 213 226 No <0.0135 206 217 No <0.01 35 215 226 No <0.0140 208 217 No <0.01 40 217 226 No <0.0145 210 217 No 0.01 45 219 226 No 0.0150 212 217 No 0.06 50 221 226 No 0.0455 214 217 No 0.17 55 223 226 No 0.1560 216 217 No 0.38 60 225 226 No 0.3765 217 217 Yes 0.50 65 228 226 Yes 0.7570 220 217 Yes 0.83 70 230 226 Yes 0.9275 222 217 Yes 0.94 75 232 226 Yes 0.9880 224 217 Yes 0.99 80 235 226 Yes >0.9985 227 217 Yes >0.99 85 238 226 Yes >0.9990 231 217 Yes >0.99 90 242 226 Yes >0.9995 236 217 Yes >0.99 95 248 226 Yes >0.99
Page12of26
TABLE6.(CONTINUED)
Grade
ELA/Reading Math
Start%ile
RITSpring
ProjectedProficiency Start%ile
RITSpring
ProjectedProficiency
CutScore Level3 Prob. CutScore Level3 Prob.
6
5 192 221 No <0.01 5 198 231 No <0.0110 197 221 No <0.01 10 204 231 No <0.0115 201 221 No <0.01 15 208 231 No <0.0120 203 221 No <0.01 20 211 231 No <0.0125 206 221 No <0.01 25 214 231 No <0.0130 208 221 No <0.01 30 217 231 No <0.0135 210 221 No <0.01 35 219 231 No <0.0140 212 221 No <0.01 40 221 231 No <0.0145 214 221 No 0.01 45 223 231 No <0.0150 216 221 No 0.06 50 225 231 No 0.0255 218 221 No 0.17 55 227 231 No 0.0860 219 221 No 0.27 60 230 231 No 0.3765 221 221 Yes 0.50 65 232 231 Yes 0.6370 223 221 Yes 0.73 70 234 231 Yes 0.8575 226 221 Yes 0.94 75 237 231 Yes 0.9880 228 221 Yes 0.99 80 239 231 Yes >0.9985 231 221 Yes >0.99 85 243 231 Yes >0.9990 235 221 Yes >0.99 90 247 231 Yes >0.9995 240 221 Yes >0.99 95 253 231 Yes >0.99
7
5 193 226 No <0.01 5 199 237 No <0.0110 199 226 No <0.01 10 206 237 No <0.0115 202 226 No <0.01 15 210 237 No <0.0120 205 226 No <0.01 20 214 237 No <0.0125 208 226 No <0.01 25 217 237 No <0.0130 210 226 No <0.01 30 219 237 No <0.0135 212 226 No <0.01 35 222 237 No <0.0140 214 226 No <0.01 40 224 237 No <0.0145 216 226 No <0.01 45 226 237 No <0.0150 218 226 No 0.01 50 229 237 No <0.0155 220 226 No 0.03 55 231 237 No 0.0260 222 226 No 0.11 60 233 237 No 0.0865 224 226 No 0.27 65 235 237 No 0.2570 226 226 Yes 0.50 70 238 237 Yes 0.6375 228 226 Yes 0.73 75 241 237 Yes 0.9280 231 226 Yes 0.94 80 244 237 Yes 0.9985 234 226 Yes 0.99 85 247 237 Yes >0.9990 238 226 Yes >0.99 90 251 237 Yes >0.9995 243 226 Yes >0.99 95 258 237 Yes >0.99
Page13of26
TABLE6.(CONTINUED)
Grade
ELA/Reading Math
Start%ile
RITSpring
ProjectedProficiency Start%ile
RITSpring
ProjectedProficiency
CutScore Level3 Prob. CutScore Level3 Prob.
8
5 194 229 No <0.01 5 199 244 No <0.0110 200 229 No <0.01 10 206 244 No <0.0115 204 229 No <0.01 15 211 244 No <0.0120 207 229 No <0.01 20 215 244 No <0.0125 209 229 No <0.01 25 218 244 No <0.0130 212 229 No <0.01 30 221 244 No <0.0135 214 229 No <0.01 35 224 244 No <0.0140 216 229 No <0.01 40 226 244 No <0.0145 218 229 No <0.01 45 229 244 No <0.0150 220 229 No <0.01 50 231 244 No <0.0155 222 229 No 0.01 55 233 244 No <0.0160 224 229 No 0.06 60 236 244 No <0.0165 226 229 No 0.17 65 238 244 No 0.0270 228 229 No 0.38 70 241 244 No 0.1575 231 229 Yes 0.73 75 244 244 Yes 0.5080 233 229 Yes 0.89 80 247 244 Yes 0.8585 236 229 Yes 0.99 85 251 244 Yes 0.9990 240 229 Yes >0.99 90 255 244 Yes >0.9995 246 229 Yes >0.99 95 262 244 Yes >0.99
Note.%ile=percentile
Page14of26
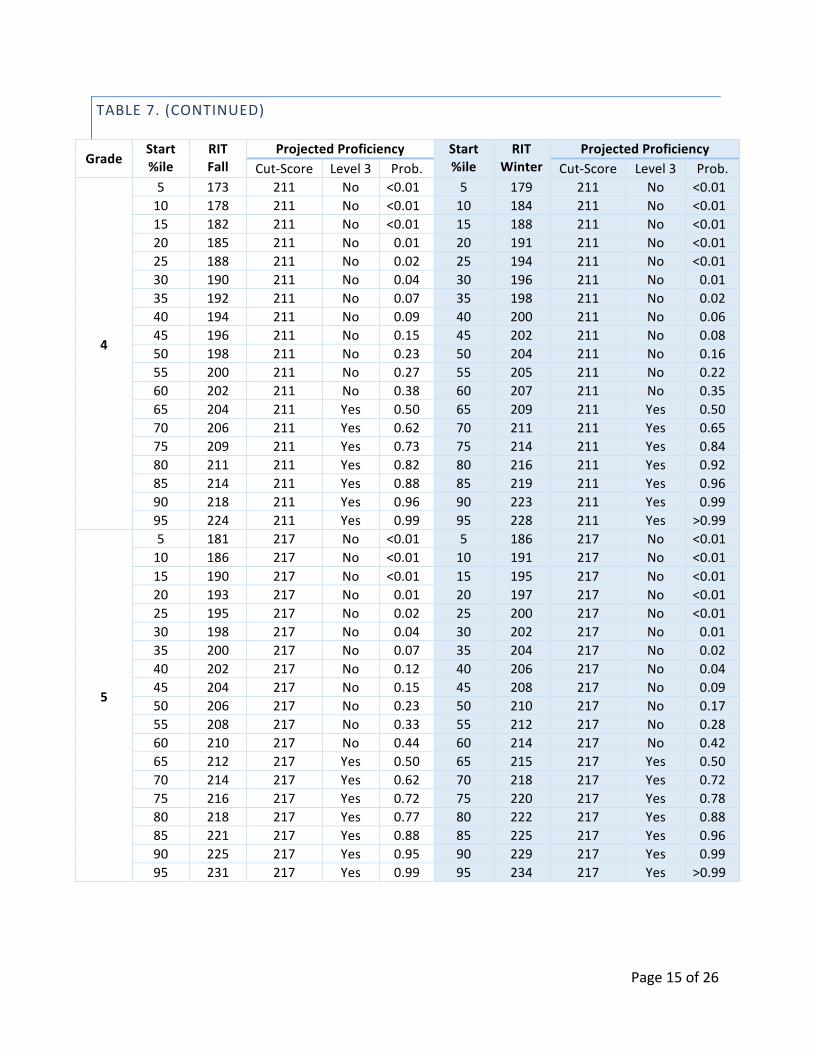
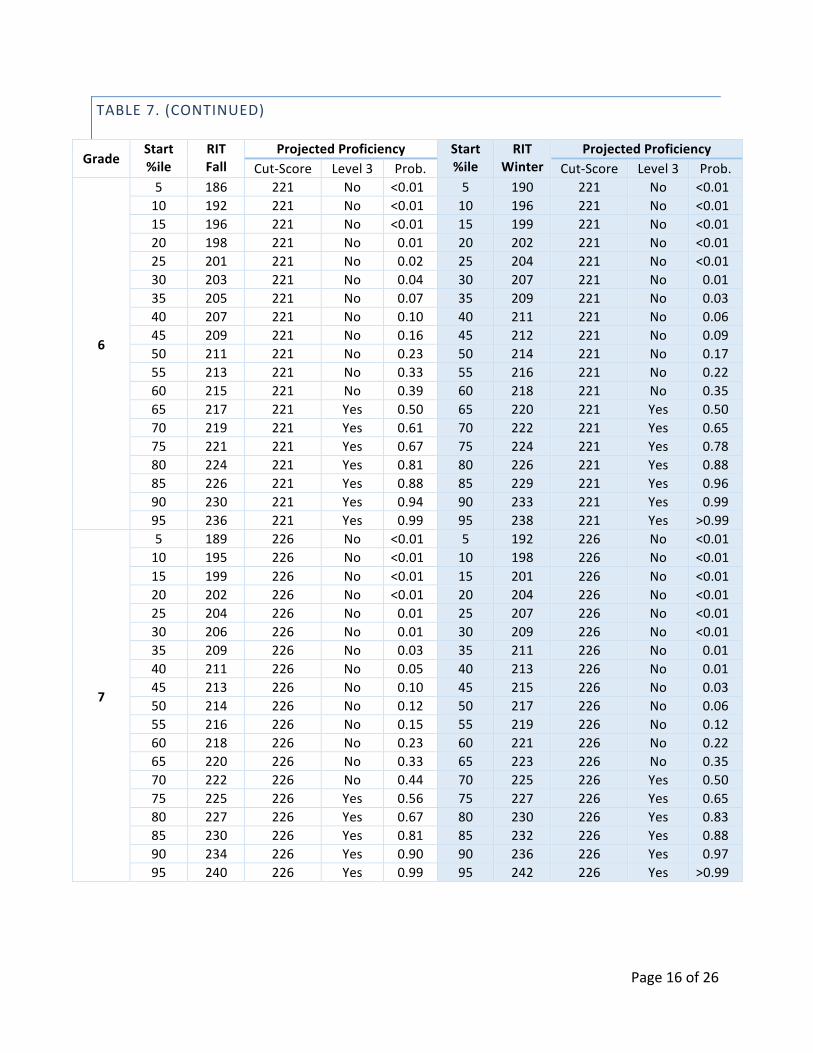
TABLE7.PROFICIENCYPROJECTIONANDPROBABILITYFORPASSINGFORWARDELALEVEL3(PROFICIENT)WHENMAPISTAKENINTHEFALLORWINTERPRIORTOSPRINGFORWARDTESTS
GradeStart%ile
RITFall
ProjectedProficiency Start%ile
RITWinter
ProjectedProficiencyCutScore Level3 Prob. CutScore Level3 Prob.
2
5 149 194 No <0.01 5 160 194 No <0.0110 155 194 No <0.01 10 165 194 No <0.0115 159 194 No 0.01 15 169 194 No <0.0120 162 194 No 0.02 20 172 194 No <0.0125 164 194 No 0.04 25 174 194 No <0.0130 167 194 No 0.06 30 176 194 No 0.0135 169 194 No 0.10 35 178 194 No 0.0240 171 194 No 0.15 40 180 194 No 0.0545 173 194 No 0.19 45 182 194 No 0.1050 175 194 No 0.26 50 184 194 No 0.1855 177 194 No 0.35 55 186 194 No 0.2360 179 194 No 0.40 60 188 194 No 0.3665 181 194 Yes 0.50 65 190 194 Yes 0.5070 183 194 Yes 0.60 70 192 194 Yes 0.6475 185 194 Yes 0.65 75 194 194 Yes 0.7780 188 194 Yes 0.78 80 197 194 Yes 0.9085 191 194 Yes 0.85 85 200 194 Yes 0.9790 195 194 Yes 0.94 90 203 194 Yes 0.9995 200 194 Yes 0.98 95 209 194 Yes >0.99
3
5 162 204 No <0.01 5 171 204 No <0.0110 168 204 No <0.01 10 176 204 No <0.0115 172 204 No <0.01 15 180 204 No <0.0120 175 204 No 0.01 20 183 204 No <0.0125 178 204 No 0.03 25 185 204 No <0.0130 180 204 No 0.05 30 188 204 No 0.0135 182 204 No 0.06 35 190 204 No 0.0240 184 204 No 0.10 40 192 204 No 0.0445 186 204 No 0.16 45 194 204 No 0.0950 188 204 No 0.20 50 196 204 No 0.1755 190 204 No 0.29 55 198 204 No 0.2860 192 204 No 0.39 60 199 204 No 0.3565 194 204 No 0.44 65 201 204 Yes 0.5070 197 204 Yes 0.61 70 204 204 Yes 0.7275 199 204 Yes 0.71 75 206 204 Yes 0.7880 202 204 Yes 0.80 80 208 204 Yes 0.8785 205 204 Yes 0.90 85 211 204 Yes 0.9690 209 204 Yes 0.95 90 215 204 Yes 0.9995 214 204 Yes 0.99 95 221 204 Yes >0.99
Page15of26
TABLE7.(CONTINUED)
GradeStart%ile
RITFall
ProjectedProficiency Start%ile
RITWinter
ProjectedProficiencyCut-Score Level3 Prob. Cut-Score Level3 Prob.
4
5 173 211 No <0.01 5 179 211 No <0.0110 178 211 No <0.01 10 184 211 No <0.0115 182 211 No <0.01 15 188 211 No <0.0120 185 211 No 0.01 20 191 211 No <0.0125 188 211 No 0.02 25 194 211 No <0.0130 190 211 No 0.04 30 196 211 No 0.0135 192 211 No 0.07 35 198 211 No 0.0240 194 211 No 0.09 40 200 211 No 0.0645 196 211 No 0.15 45 202 211 No 0.0850 198 211 No 0.23 50 204 211 No 0.1655 200 211 No 0.27 55 205 211 No 0.2260 202 211 No 0.38 60 207 211 No 0.3565 204 211 Yes 0.50 65 209 211 Yes 0.5070 206 211 Yes 0.62 70 211 211 Yes 0.6575 209 211 Yes 0.73 75 214 211 Yes 0.8480 211 211 Yes 0.82 80 216 211 Yes 0.9285 214 211 Yes 0.88 85 219 211 Yes 0.9690 218 211 Yes 0.96 90 223 211 Yes 0.9995 224 211 Yes 0.99 95 228 211 Yes >0.99
5
5 181 217 No <0.01 5 186 217 No <0.0110 186 217 No <0.01 10 191 217 No <0.0115 190 217 No <0.01 15 195 217 No <0.0120 193 217 No 0.01 20 197 217 No <0.0125 195 217 No 0.02 25 200 217 No <0.0130 198 217 No 0.04 30 202 217 No 0.0135 200 217 No 0.07 35 204 217 No 0.0240 202 217 No 0.12 40 206 217 No 0.0445 204 217 No 0.15 45 208 217 No 0.0950 206 217 No 0.23 50 210 217 No 0.1755 208 217 No 0.33 55 212 217 No 0.2860 210 217 No 0.44 60 214 217 No 0.4265 212 217 Yes 0.50 65 215 217 Yes 0.5070 214 217 Yes 0.62 70 218 217 Yes 0.7275 216 217 Yes 0.72 75 220 217 Yes 0.7880 218 217 Yes 0.77 80 222 217 Yes 0.8885 221 217 Yes 0.88 85 225 217 Yes 0.9690 225 217 Yes 0.95 90 229 217 Yes 0.9995 231 217 Yes 0.99 95 234 217 Yes >0.99
Page16of26
TABLE7.(CONTINUED)
GradeStart%ile
RITFall
ProjectedProficiency Start%ile
RITWinter
ProjectedProficiencyCut-Score Level3 Prob. Cut-Score Level3 Prob.
6
5 186 221 No <0.01 5 190 221 No <0.0110 192 221 No <0.01 10 196 221 No <0.0115 196 221 No <0.01 15 199 221 No <0.0120 198 221 No 0.01 20 202 221 No <0.0125 201 221 No 0.02 25 204 221 No <0.0130 203 221 No 0.04 30 207 221 No 0.0135 205 221 No 0.07 35 209 221 No 0.0340 207 221 No 0.10 40 211 221 No 0.0645 209 221 No 0.16 45 212 221 No 0.0950 211 221 No 0.23 50 214 221 No 0.1755 213 221 No 0.33 55 216 221 No 0.2260 215 221 No 0.39 60 218 221 No 0.3565 217 221 Yes 0.50 65 220 221 Yes 0.5070 219 221 Yes 0.61 70 222 221 Yes 0.6575 221 221 Yes 0.67 75 224 221 Yes 0.7880 224 221 Yes 0.81 80 226 221 Yes 0.8885 226 221 Yes 0.88 85 229 221 Yes 0.9690 230 221 Yes 0.94 90 233 221 Yes 0.9995 236 221 Yes 0.99 95 238 221 Yes >0.99
7
5 189 226 No <0.01 5 192 226 No <0.0110 195 226 No <0.01 10 198 226 No <0.0115 199 226 No <0.01 15 201 226 No <0.0120 202 226 No <0.01 20 204 226 No <0.0125 204 226 No 0.01 25 207 226 No <0.0130 206 226 No 0.01 30 209 226 No <0.0135 209 226 No 0.03 35 211 226 No 0.0140 211 226 No 0.05 40 213 226 No 0.0145 213 226 No 0.10 45 215 226 No 0.0350 214 226 No 0.12 50 217 226 No 0.0655 216 226 No 0.15 55 219 226 No 0.1260 218 226 No 0.23 60 221 226 No 0.2265 220 226 No 0.33 65 223 226 No 0.3570 222 226 No 0.44 70 225 226 Yes 0.5075 225 226 Yes 0.56 75 227 226 Yes 0.6580 227 226 Yes 0.67 80 230 226 Yes 0.8385 230 226 Yes 0.81 85 232 226 Yes 0.8890 234 226 Yes 0.90 90 236 226 Yes 0.9795 240 226 Yes 0.99 95 242 226 Yes >0.99
Page17of26
TABLE7.(CONTINUED)
GradeStart%ile
RITFall
ProjectedProficiency Start%ile
RITWinter
ProjectedProficiencyCut-Score Level3 Prob. Cut-Score Level3 Prob.
8
5 191 229 No <0.01 5 194 229 No <0.0110 197 229 No <0.01 10 199 229 No <0.0115 201 229 No <0.01 15 203 229 No <0.0120 204 229 No 0.01 20 206 229 No <0.0125 207 229 No 0.01 25 209 229 No <0.0130 209 229 No 0.02 30 211 229 No <0.0135 211 229 No 0.04 35 213 229 No <0.0140 213 229 No 0.05 40 215 229 No 0.0145 215 229 No 0.08 45 217 229 No 0.0250 217 229 No 0.13 50 219 229 No 0.0555 219 229 No 0.19 55 221 229 No 0.1060 221 229 No 0.22 60 223 229 No 0.1865 223 229 No 0.31 65 225 229 No 0.2970 225 229 No 0.40 70 227 229 No 0.4375 228 229 Yes 0.50 75 229 229 Yes 0.5780 230 229 Yes 0.60 80 232 229 Yes 0.7185 234 229 Yes 0.78 85 235 229 Yes 0.8690 237 229 Yes 0.84 90 239 229 Yes 0.9795 243 229 Yes 0.96 95 244 229 Yes >0.99
Note.%ile=percentile
Page18of26
TABLE8.PROFICIENCYPROJECTIONANDPROBABILITYFORPASSINGFORWARDMATHLEVEL3(PROFICIENT)WHENMAPISTAKENINTHEFALLORWINTERPRIORTOSPRINGFORWARDTESTS
GradeStart%ile
RITFall
ProjectedProficiency Start%ile
RITWinter
ProjectedProficiencyCutScore Level3 Prob. CutScore Level3 Prob.
2
5 155 194 No <0.01 5 165 194 No <0.0110 160 194 No 0.01 10 170 194 No <0.0115 163 194 No 0.02 15 173 194 No <0.0120 166 194 No 0.06 20 175 194 No <0.0125 168 194 No 0.07 25 178 194 No 0.0230 170 194 No 0.12 30 180 194 No 0.0535 172 194 No 0.19 35 181 194 No 0.0840 174 194 No 0.28 40 183 194 No 0.1545 175 194 No 0.28 45 185 194 No 0.2750 177 194 No 0.39 50 186 194 No 0.3455 179 194 Yes 0.50 55 188 194 Yes 0.5060 180 194 Yes 0.56 60 190 194 Yes 0.6665 182 194 Yes 0.67 65 191 194 Yes 0.7370 184 194 Yes 0.72 70 193 194 Yes 0.7975 186 194 Yes 0.81 75 195 194 Yes 0.8980 188 194 Yes 0.88 80 197 194 Yes 0.9585 191 194 Yes 0.94 85 200 194 Yes 0.9990 194 194 Yes 0.97 90 203 194 Yes >0.9995 199 194 Yes >0.99 95 208 194 Yes >0.99
3
5 169 206 No <0.01 5 176 206 No <0.0110 174 206 No <0.01 10 181 206 No <0.0115 177 206 No 0.01 15 184 206 No <0.0120 179 206 No 0.02 20 187 206 No <0.0125 182 206 No 0.06 25 189 206 No 0.0130 184 206 No 0.08 30 191 206 No 0.0235 185 206 No 0.11 35 193 206 No 0.0540 187 206 No 0.17 40 195 206 No 0.1045 189 206 No 0.27 45 197 206 No 0.2050 190 206 No 0.32 50 198 206 No 0.2655 192 206 No 0.44 55 200 206 No 0.4260 194 206 Yes 0.56 60 202 206 Yes 0.5865 195 206 Yes 0.62 65 203 206 Yes 0.6670 197 206 Yes 0.73 70 205 206 Yes 0.8075 199 206 Yes 0.78 75 207 206 Yes 0.9080 201 206 Yes 0.86 80 209 206 Yes 0.9585 204 206 Yes 0.94 85 212 206 Yes 0.9990 207 206 Yes 0.98 90 215 206 Yes >0.9995 212 206 Yes >0.99 95 220 206 Yes >0.99
Page19of26
TABLE8.(CONTINUED)
GradeStart%ile
RITFall
ProjectedProficiency Start%ile
RITWinter
ProjectedProficiencyCut-Score Level3 Prob. Cut-Score Level3 Prob.
4
5 179 216 No <0.01 5 185 216 No <0.0110 184 216 No <0.01 10 190 216 No <0.0115 188 216 No 0.01 15 194 216 No <0.0120 190 216 No 0.01 20 197 216 No <0.0125 193 216 No 0.04 25 199 216 No 0.0130 195 216 No 0.08 30 201 216 No 0.0235 197 216 No 0.14 35 203 216 No 0.0540 198 216 No 0.17 40 205 216 No 0.1045 200 216 No 0.27 45 207 216 No 0.2050 202 216 No 0.38 50 209 216 No 0.3455 204 216 Yes 0.50 55 211 216 Yes 0.5060 205 216 Yes 0.50 60 212 216 Yes 0.5865 207 216 Yes 0.62 65 214 216 Yes 0.7470 209 216 Yes 0.73 70 216 216 Yes 0.8675 211 216 Yes 0.83 75 218 216 Yes 0.9380 214 216 Yes 0.92 80 221 216 Yes 0.9885 216 216 Yes 0.96 85 223 216 Yes 0.9990 220 216 Yes 0.99 90 227 216 Yes >0.9995 225 216 Yes >0.99 95 232 216 Yes >0.99
5
5 187 226 No <0.01 5 192 226 No <0.0110 193 226 No <0.01 10 198 226 No <0.0115 196 226 No <0.01 15 201 226 No <0.0120 199 226 No 0.01 20 204 226 No <0.0125 202 226 No 0.02 25 207 226 No <0.0130 204 226 No 0.04 30 209 226 No <0.0135 206 226 No 0.07 35 211 226 No 0.0140 208 226 No 0.12 40 213 226 No 0.0345 210 226 No 0.19 45 215 226 No 0.0750 211 226 No 0.23 50 217 226 No 0.1555 213 226 No 0.33 55 219 226 No 0.2760 215 226 No 0.44 60 221 226 No 0.4265 217 226 Yes 0.56 65 223 226 Yes 0.5870 219 226 Yes 0.67 70 225 226 Yes 0.7375 221 226 Yes 0.77 75 228 226 Yes 0.8980 224 226 Yes 0.88 80 230 226 Yes 0.9585 227 226 Yes 0.95 85 233 226 Yes 0.9990 230 226 Yes 0.98 90 237 226 Yes >0.9995 236 226 Yes >0.99 95 242 226 Yes >0.99
Page20of26
TABLE8.(CONTINUED)
GradeStart%ile
RITFall
ProjectedProficiency Start%ile
RITWinter
ProjectedProficiencyCut-Score Level3 Prob. Cut-Score Level3 Prob.
6
5 192 231 No <0.01 5 196 231 No <0.0110 198 231 No <0.01 10 202 231 No <0.0115 202 231 No <0.01 15 205 231 No <0.0120 205 231 No <0.01 20 209 231 No <0.0125 207 231 No 0.01 25 211 231 No <0.0130 209 231 No 0.02 30 214 231 No <0.0135 212 231 No 0.05 35 216 231 No 0.0140 214 231 No 0.09 40 218 231 No 0.0245 216 231 No 0.15 45 220 231 No 0.0550 218 231 No 0.23 50 222 231 No 0.1155 220 231 No 0.33 55 224 231 No 0.2060 222 231 No 0.44 60 226 231 No 0.3465 224 231 Yes 0.56 65 228 231 Yes 0.5070 226 231 Yes 0.67 70 230 231 Yes 0.6675 228 231 Yes 0.77 75 233 231 Yes 0.8580 231 231 Yes 0.88 80 236 231 Yes 0.9585 234 231 Yes 0.93 85 239 231 Yes 0.9990 238 231 Yes 0.98 90 243 231 Yes >0.9995 243 231 Yes >0.99 95 248 231 Yes >0.99
7
5 195 237 No <0.01 5 198 237 No <0.0110 201 237 No <0.01 10 204 237 No <0.0115 205 237 No <0.01 15 208 237 No <0.0120 209 237 No <0.01 20 212 237 No <0.0125 211 237 No <0.01 25 215 237 No <0.0130 214 237 No <0.01 30 217 237 No <0.0135 216 237 No 0.01 35 220 237 No <0.0140 218 237 No 0.02 40 222 237 No <0.0145 221 237 No 0.06 45 224 237 No 0.0150 223 237 No 0.11 50 226 237 No 0.0355 225 237 No 0.18 55 228 237 No 0.0760 227 237 No 0.27 60 230 237 No 0.1565 229 237 No 0.38 65 233 237 No 0.3470 231 237 Yes 0.50 70 235 237 Yes 0.5075 234 237 Yes 0.68 75 238 237 Yes 0.7480 237 237 Yes 0.82 80 240 237 Yes 0.8585 240 237 Yes 0.92 85 244 237 Yes 0.9790 244 237 Yes 0.98 90 248 237 Yes >0.9995 250 237 Yes >0.99 95 254 237 Yes >0.99

Page21of26
TABLE8.(CONTINUED)
GradeStart%ile
RITFall
ProjectedProficiency Start%ile
RITWinter
ProjectedProficiencyCut-Score Level3 Prob. Cut-Score Level3 Prob.
8
5 197 244 No <0.01 5 199 244 No <0.0110 203 244 No <0.01 10 206 244 No <0.0115 208 244 No <0.01 15 210 244 No <0.0120 211 244 No <0.01 20 214 244 No <0.0125 214 244 No <0.01 25 217 244 No <0.0130 217 244 No <0.01 30 220 244 No <0.0135 219 244 No <0.01 35 222 244 No <0.0140 222 244 No 0.01 40 225 244 No <0.0145 224 244 No 0.02 45 227 244 No <0.0150 226 244 No 0.04 50 229 244 No <0.0155 229 244 No 0.10 55 231 244 No 0.0160 231 244 No 0.15 60 234 244 No 0.0665 233 244 No 0.22 65 236 244 No 0.1270 236 244 No 0.30 70 239 244 No 0.2875 238 244 No 0.40 75 241 244 No 0.4280 241 244 Yes 0.55 80 245 244 Yes 0.7285 245 244 Yes 0.74 85 248 244 Yes 0.8890 249 244 Yes 0.88 90 253 244 Yes 0.9995 256 244 Yes 0.98 95 259 244 Yes >0.99
Note.%ile=percentile
Page22of26
SummaryandDiscussion
ThisstudyproducedasetofcutscoresonMAPreadingandmathtestsforGrades2to8thatcorrespondtoeachForwardperformancelevel.Byusingmatchedscoredatafromasampleof students fromWisconsin, the study demonstrates thatMAP scores can accurately predictwhetherastudentcouldbeproficientoraboveonthebasisofhis/herMAPscores.Thisstudyalso used the 2015 NWEA norming study results to project a student’s probability to meetproficiencybasedonthatstudent’spriorMAPscoresinfallandwinter.TheseresultswillhelpeducatorspredictstudentperformanceinForwardtestsasearlyaspossibleandidentifythosestudentswhoareatriskoffailingtomeetrequiredstandardssothattheycanreceivenecessaryresourcesandassistancetomeettheirgoals.
Whileconcordancetablescanbehelpfulandinformative,theyhavegenerallimitations.First,theconcordancetablesprovideinformationaboutscorecomparabilityondifferenttests,butthescorescannotbeassumedtobeinterchangeable.InthecaseforForwardandMAPtests,astheyarenotparallelincontent,scoresfromthesetwotestsshouldnotbedirectlycompared.Second,thesampledatausedinthisstudywerecollectedfrom99schoolsinWisconsin,whichmaylimitthegeneralizabilityoftheresultstotesttakerswhodiffersignificantlyfromthissample.Finally,cautionshouldbeexercisediftheconcordedscoresareusedforasubpopulation.NWEAwillcontinuetogatherinformationaboutForwardperformancefromotherschoolsinWisconsintoenhancethequalityandgeneralizabilityofthestudy.
Page23of26
References
Hanson,B.A.,Harris,D.J.,Pommerich,M.,Sconing,J.A.,&Yi,Q.(2001).Suggestionsfortheevaluationanduseofconcordanceresults.(ACTResearchReportNo.2001-1).IowaCity,IA:ACT,Inc.
Kolen,M.J.,&Brennan,R.L.(2004).Testequating,scaling,andlinking.NewYork:Springer.
Pommerich,M.,Hanson,B.,Harris,D.,&Sconing,J.(2004).Issuesinconductinglinkagebetweendistincttests.AppliedPsychologicalMeasurement,28(4),247-273.
ThumY.M.,&Hauser,C.H.(2015).NWEA2015MAPNormsforStudentandSchoolAchievementStatusandGrowth.NWEAResearchReport.Portland,OR:NWEA.
Page24of26
Appendix
DataandAnalysis
Data
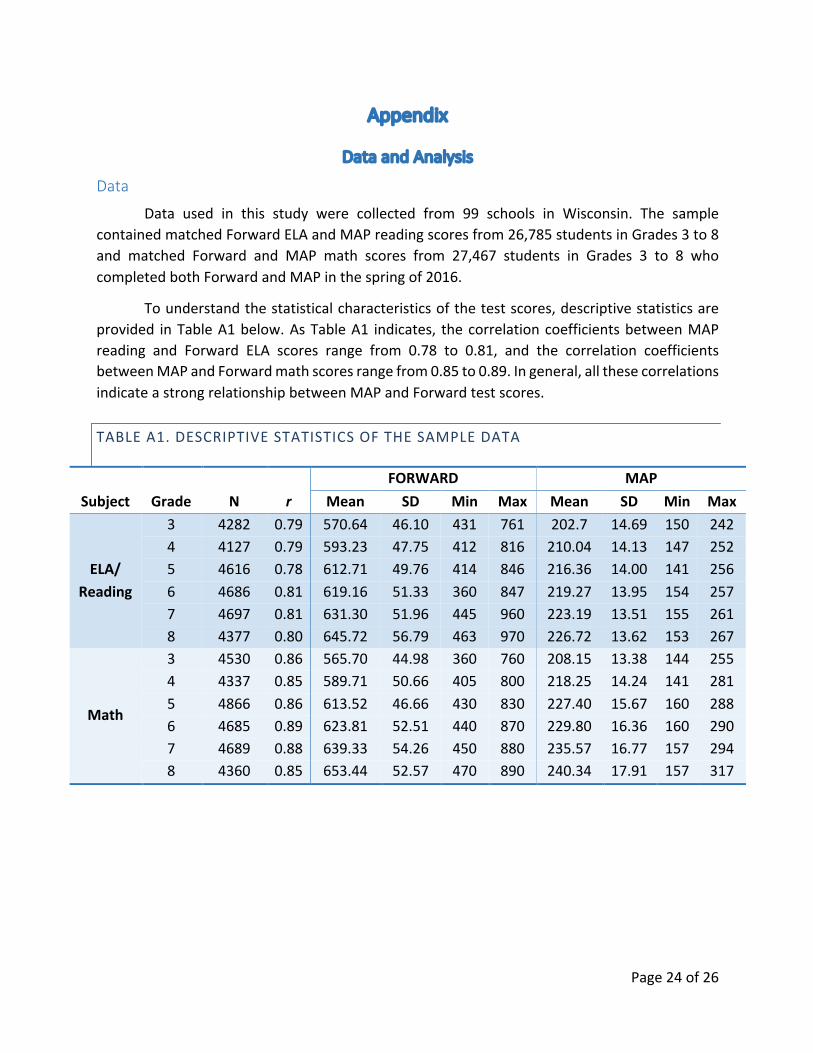
Data used in this study were collected from 99 schools in Wisconsin. The samplecontainedmatchedForwardELAandMAPreadingscoresfrom26,785studentsinGrades3to8and matched Forward and MAP math scores from 27,467 students in Grades 3 to 8 whocompletedbothForwardandMAPinthespringof2016.
Tounderstandthestatisticalcharacteristicsofthetestscores,descriptivestatisticsareprovided inTableA1below.AsTableA1 indicates, thecorrelationcoefficientsbetweenMAPreading and Forward ELA scores range from 0.78 to 0.81, and the correlation coefficientsbetweenMAPandForwardmathscoresrangefrom0.85to0.89.Ingeneral,allthesecorrelationsindicateastrongrelationshipbetweenMAPandForwardtestscores.
TABLEA1.DESCRIPTIVESTATISTICSOFTHESAMPLEDATA
FORWARD MAPSubject Grade N r Mean SD Min Max Mean SD Min Max
ELA/Reading
3 4282 0.79 570.64 46.10 431 761 202.7 14.69 150 2424 4127 0.79 593.23 47.75 412 816 210.04 14.13 147 2525 4616 0.78 612.71 49.76 414 846 216.36 14.00 141 2566 4686 0.81 619.16 51.33 360 847 219.27 13.95 154 2577 4697 0.81 631.30 51.96 445 960 223.19 13.51 155 2618 4377 0.80 645.72 56.79 463 970 226.72 13.62 153 267
Math
3 4530 0.86 565.70 44.98 360 760 208.15 13.38 144 2554 4337 0.85 589.71 50.66 405 800 218.25 14.24 141 2815 4866 0.86 613.52 46.66 430 830 227.40 15.67 160 2886 4685 0.89 623.81 52.51 440 870 229.80 16.36 160 2907 4689 0.88 639.33 54.26 450 880 235.57 16.77 157 2948 4360 0.85 653.44 52.57 470 890 240.34 17.91 157 317
Page25of26
EquipercentileLinkingProcedure
Theequipercentileprocedure (e.g.,Kolen&Brennan,2004)wasused toestablish theconcordancerelationshipbetweenForwardandMAPscoresforgrades3to8inELA/readingandmath.Thisprocedurematchesscoresonthetwoscalesthathavethesamepercentilerank(i.e.,theproportionofscoresatorbeloweachscore).
Supposeweneedtoestablishtheconcordedscoresbetweentwotests.𝑥isascoreonTest𝑋(e.g.,Forward). ItsequipercentileequivalentscoreonTest𝑌(e.g.,MAP),𝑒& 𝑥 ,canbeobtainedthroughacumulative-distribution-basedlinkingfunctiondefinedinEquation(A1):
𝑒& 𝑥 = 𝐺*+[𝑃 𝑥 ] (A1)
where𝑒& 𝑥 istheequipercentileequivalentofscoresonForwardonthescaleofMAP,𝑃 𝑥 isthepercentilerankofagivenscoreonTest𝑋.𝐺*+istheinverseofthepercentilerankfunctionforscoresonTest𝑌which indicatesthescoresonTest𝑌correspondingtoagivenpercentile.Polynomial loglinear pre-smoothing was applied to reduce irregularities of the frequencydistributionsaswellasequipercentilelinkingcurve.
ConsistencyRateofClassification
Consistencyrateofclassificationaccuracy,expressedintheformofaratebetween0and1,measures the extent towhichMAP scores (and theestimatedMAP cut scores) accuratelypredictedwhetherstudentsinthesamplewouldbeproficient(i.e.,Level3orhigher)onForwardtests.
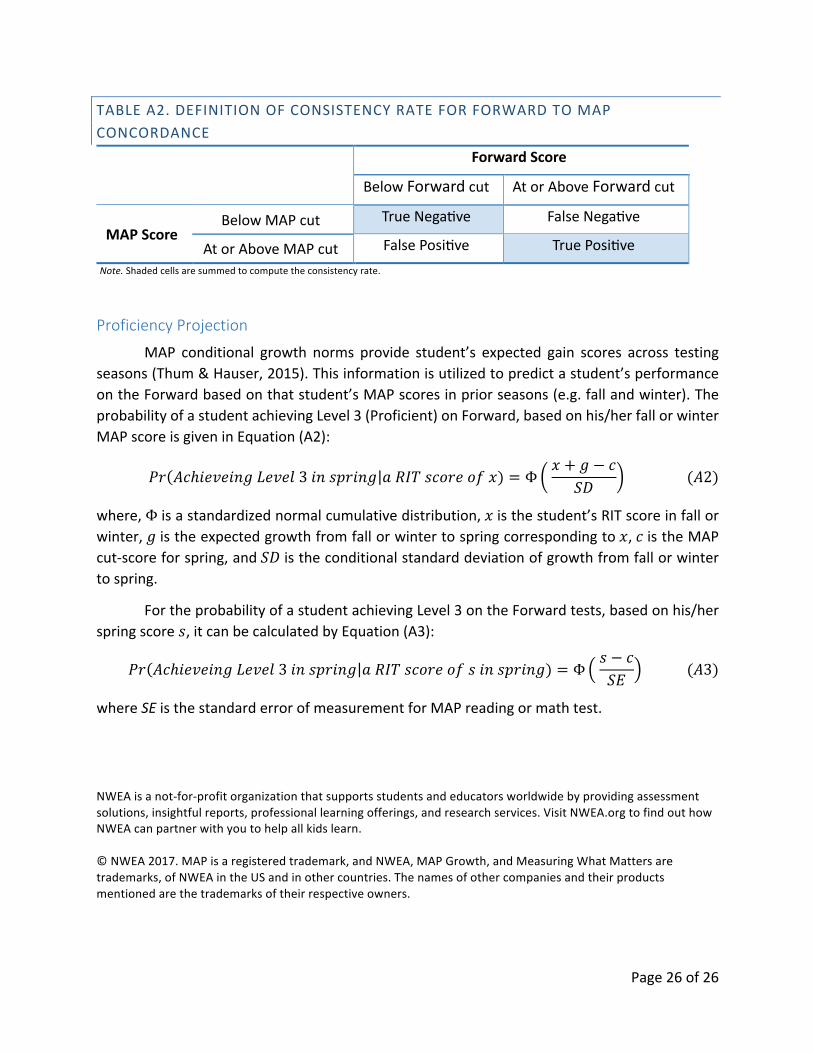
Tocalculateconsistencyrateofclassification,samplestudentsweredesignated“BelowForwardcut”or“AtoraboveForwardcut”basedontheiractualForwardscores.Similarly,theywerealsodesignatedas“BelowMAPcut”or“AtoraboveMAPcut”basedontheiractualMAPscores. A 2-way contingency tablewas then tabulated (see TableA2), classifying students as“Proficient”onthebasisofForwardcutscoreandconcordantMAPcutscore.Studentsclassifiedinthetruepositive(TP)categorywerethosepredictedtobeproficientbasedontheMAPcutscoresandwerealsoclassifiedasproficientbasedontheForwardcutscores.Studentsclassifiedinthetruenegative(TN)categorywerethosepredictedtobeBelowBasicExpectationsbasedontheMAPcutscoresandwerealsoclassifiedasBelowBasicExpectationsbasedontheForwardcut scores. Students classified in the false positive (FP) categorywere those predicted to beProficient Expectations based on the MAP cut scores but were classified as Below BasicExpectations based on the Forward cut scores. Students classified in the false negative (FN)categorywerethosepredicatedtobeBelowBasicExpectationsbasedontheMAPcutscoresbutwere classified as Proficient Expectations based on the Forward cut scores. The overallconsistencyrateofclassificationwascomputedastheproportionofcorrectclassificationsamongtheentiresampleby(TP+TN)/(TP+TN+FP+FN).
Page26of26
TABLEA2.DEFINITIONOFCONSISTENCYRATEFORFORWARDTOMAPCONCORDANCE
ForwardScore
BelowForwardcut AtorAboveForwardcut
MAPScoreBelowMAPcut TrueNegaqve FalseNegaqve
AtorAboveMAPcut FalsePosiqve TruePosiqveNote.Shadedcellsaresummedtocomputetheconsistencyrate.
ProficiencyProjection
MAP conditional growth norms provide student’s expected gain scores across testingseasons(Thum&Hauser,2015).Thisinformationisutilizedtopredictastudent’sperformanceontheForwardbasedonthatstudent’sMAPscoresinpriorseasons(e.g.fallandwinter).TheprobabilityofastudentachievingLevel3(Proficient)onForward,basedonhis/herfallorwinterMAPscoreisgiveninEquation(A2):
𝑃𝑟 𝐴𝑐ℎ𝑖𝑒𝑣𝑒𝑖𝑛𝑔𝐿𝑒𝑣𝑒𝑙3𝑖𝑛𝑠𝑝𝑟𝑖𝑛𝑔 𝑎𝑅𝐼𝑇𝑠𝑐𝑜𝑟𝑒𝑜𝑓𝑥) = Φ 𝑥 + 𝑔 − 𝑐
𝑆𝐷 (𝐴2)
where,Φisastandardizednormalcumulativedistribution,𝑥isthestudent’sRITscoreinfallorwinter,𝑔istheexpectedgrowthfromfallorwintertospringcorrespondingto𝑥,𝑐istheMAPcut-scoreforspring,and𝑆𝐷istheconditionalstandarddeviationofgrowthfromfallorwintertospring.
FortheprobabilityofastudentachievingLevel3ontheForwardtests,basedonhis/herspringscore𝑠,itcanbecalculatedbyEquation(A3):
𝑃𝑟 𝐴𝑐ℎ𝑖𝑒𝑣𝑒𝑖𝑛𝑔𝐿𝑒𝑣𝑒𝑙3𝑖𝑛𝑠𝑝𝑟𝑖𝑛𝑔 𝑎𝑅𝐼𝑇𝑠𝑐𝑜𝑟𝑒𝑜𝑓𝑠𝑖𝑛𝑠𝑝𝑟𝑖𝑛𝑔) = Φ 𝑠 − 𝑐𝑆𝐸 (𝐴3)
whereSEisthestandarderrorofmeasurementforMAPreadingormathtest.
NWEAisanot-for-profitorganizationthatsupportsstudentsandeducatorsworldwidebyprovidingassessmentsolutions,insightfulreports,professionallearningofferings,andresearchservices.VisitNWEA.orgtofindouthowNWEAcanpartnerwithyoutohelpallkidslearn.©NWEA2017.MAPisaregisteredtrademark,andNWEA,MAPGrowth,andMeasuringWhatMattersaretrademarks,ofNWEAintheUSandinothercountries.Thenamesofothercompaniesandtheirproductsmentionedarethetrademarksoftheirrespectiveowners.