Embed Size (px)
Citation preview
Journal of Financial Economics 62 (2001) 489–523
Linking pay to performanceFcompensationproposals in the S&P 500$
Angela G. Morgana, Annette B. Poulsenb,*aCollege of Business and Behavioral Science, Clemson University, Clemson, SC 29634-1323, USA
bTerry College of Business, University of Georgia, Athens, GA 30602-6253, USA
Received 29 October 1999; received in revised form 16 January 2001
Abstract
We study the proposal of manager-sponsored compensation plans linking pay toperformance by S&P 500 firms in the 1990s. We examine the market perception of theseproposals and the characteristics of the firms that propose them. Shareholders gain at
the announcement of the plans, especially when the plans are directed toward the firm’stop executives. Proposing firms are those that can most benefit from the plans, giventheir asset type and agency considerations. Firms with more potential agency costs havethe highest vote-for percentages for the plans. However, shareholders are less approving
of plans with negative features such as high dilution levels. Our work suggests thatstock-based compensation plans are helpful in improving managerial efforts to increaseshareholder wealth. r 2001 Elsevier Science S.A. All rights reserved.
JEL classificaion: G32; G34; J33
Keywords: Incentives; Executive compensation; Proxy voting
$We gratefully acknowledge the helpful comments from the referee, Shane Corwin, Kathleen
Fuller, Stuart Gillan, Richard Grayson, Marc Lipson, Jeff Netter, Bill Schwert (the editor), Mike
Stegemoller and Chris Stivers as well as seminar participants at the University of Georgia,
University of Arkansas, Bowling Green State University, Clemson University, Creighton
University, the Pennsylvania State University, Temple University and Texas Tech University.
We also acknowledge assistance from Investor Responsibility Research Center.
*Corresponding author. Tel.: 706-542-3645; fax: 706-542-9434.
E-mail address: [email protected] (A.B. Poulsen).
0304-405X/01/$ - see front matter r 2001 Elsevier Science S.A. All rights reserved.
PII: S 0 3 0 4 - 4 0 5 X ( 0 1 ) 0 0 0 8 4 - 8
1. Introduction
The separation of ownership and control in large corporations has asignificant impact on firms’ financial structure and contractual relationships.Theory argues that firms should control agency costs implicit in theserelationships to maximize shareholder wealth. An often-suggested internalsolution to the problem of inefficient or self-serving management is thedevelopment of compensation plans that tie managerial compensation directlyto corporate performance, especially through stock-price performance. Thispay-for-performance tradeoff can improve managerial performance in a moreefficient way than other costly external controls, such as the takeover process.However, the difficulty of designing compensation schemes may result inrelatively ineffective plans or plans that allow managers to benefit even withmediocre or poor firm performance.
We focus on proposals by managers of compensation plans that link pay toperformance. We examine a large sample of announcements of compensationplans in S&P 500 firms in the 1990s. The concept of tying pay to performancehas many supporters, including academic researchers, activist shareholders,investment bankers and corporate CEOs. For example, the Stern StewartRoundtable on Management Incentive Compensation and Shareholder Value,1992, offers diverse perspectives on compensation plans. However, thecomplexity of incentive contracts and the possibility that managers designthem to be overly beneficial to themselves at shareholder expense suggests thatthey are not a cure-all for agency problems. Our work helps to determinewhether managers are proposing plans that are appropriate for their firms inimproving managerial efforts to increase shareholder wealth, and helps toidentify plan features that are viewed negatively by shareholders.
We identify management proposals of pay-for-performance compensationschemes from proxy statements of the S&P 500 firms. From almost 2000 proxystatements mailed in 1992 through 1995, we identify 958 compensationproposals appearing on 810 proxy ballots. We look at both the marketperception of these proposals and the characteristics of firms that proposethem. We find positive wealth effects stemming from the announcement of theplans, especially when they target the top executives of the firm and when theyreplace existing plans. In addition, characteristics of proposing firms areconsistent with their implementation in the firms that are most likely to benefitfrom them. For example, high-investment opportunity firms, where it isespecially difficult to define appropriate future managerial actions, are morelikely to propose pay-for-performance compensation schemes. Despitenegative features in some of the plans, shareholders overwhelmingly vote forthem. The votes approving the plan are positively related to the investmentopportunities of the firm and inversely related to negative plan characteristicssuch as dilution of shareholder stakes. Overall, these results suggest that the
A.G. Morgan, A.B. Poulsen / Journal of Financial Economics 62 (2001) 489–523490
pay-for-performance plans help to reduce agency problems in the firm and thatshareholders do evaluate and react to specific plan characteristics.
In addition, proposing firms are more likely to have had strong performanceboth before and after the proposal. The positive stock price reaction at the planannouncement may indicate that the introduction of these plans providesinformation to the market about the future profitability and cash flows of thecompany. Given that managers have discretion in the timing of the plans,managers may introduce these plans when they expect them to be especiallybeneficial. Thus, any conclusions drawn from the announcement effects onshareholder wealth should be tempered by the possibility that the announce-ment also signals future strong performance.
Section 2 reviews the literature and presents our research questions. Wediscuss our data and methodology in Section 3 and our results in Section 4.Section 5 concludes the paper.
2. Literature review and research questions
Compensation provisions that reward managers for efforts that increaseshareholder wealth are a partial solution to an agency problem in firms. Bytying compensation to the profitability of the firm and the wealth of theshareholders, shareholders encourage managers to work harder and takeappropriate risks and, in general, align managerial incentives with shareholderwell-being. Baker et al. (1988) and Jensen and Murphy (1990) provide thestarting point for the recent discussion of the pay-for-performance tradeoff.They analyze the relation between CEO pay and performance, based on dataprimarily from the 1970s. They argue that CEO pay is not very sensitive toperformance, with CEOs receiving only $3.25 for every $1000 increase inshareholder wealth, and state that in ‘‘most publicly held companies, thecompensation of top executives is virtually independent of performance’’. Withmore recent compensation data (1980–1994) and more emphasis on thevaluation of stock and stock options granted to CEOs, Hall and Liebman(1998) find a much stronger relation between firm performance and executivecompensation. The authors all note, however, that it is not clear what theoptimal pay/performance tradeoff should be.
The design of the optimal compensation scheme is difficult. Choosingappropriate benchmarks and methods of compensation even in a worldwithout agency costs would be challenging. With agency costs, there are manyopportunities for CEOs and other executives to ensure that their compensationis overly generous. While earlier research, such as Brickley et al. (1985) andTehranian and Waegelein (1985), found that pay-for-compensation plans aregenerally good news for shareholders, later researchers have found that
A.G. Morgan, A.B. Poulsen / Journal of Financial Economics 62 (2001) 489–523 491
managers can and do sometimes design compensation plans at the expense ofshareholders (Core et al., 1999 and Campbell and Wasley, 1999).
Since the costs of designing and implementing pay-for-performance schemesvary with firm characteristics, we would expect to see patterns in their usagethat emphasize where they would be most beneficial.1 Smith and Watts (1992),Gaver and Gaver (1993), and Kole (1997) demonstrate that managerialcompensation is more likely to include performance features if the firm hashigh-investment or strong growth opportunities, as measured by book-to-market ratios or variables such as research-and-development intensity. Theliterature also provides evidence of the importance of other agency problemconsiderations, such as high variability in cash flows, insider or institutionalholdings, leverage, or CEO age. Lambert and Larcker (1987), for example,report that greater stock-based compensation is used when accountingmeasures are noisy and when the firm is in early stages of investment withrapid growth in assets and sales. Yermack (1995) also reports that pay is moresensitive to stock value in companies with noisy accounting data or incompanies facing cash constraints and less sensitive in companies that areregulated. He does not verify, however, the relation between book-to-marketratios or R&D intensity and pay-for-performance compensation found in someof the earlier studies.
Our research contributes to the discussion of the role of pay-for-performancecompensation plans by looking at the introduction of and revisions to theseplans proposed by managers in the 1990s. Brickley et al. (1985) and Tehranianand Waegelein (1985) studied the impact on shareholder wealth of plansintroduced in the 1970s and early 1980s, a time when the monitoring ofcorporate managers occurred mainly through outside restructuring in the formof hostile takeovers or proxy contests. Hall and Liebman (1998) have verifiedthat the use of pay for performance has dramatically increased since the periodof these earlier studies, providing many more opportunities for the use andabuse of these schemes. Our analysis focuses on this later period.
Our basic research question is to investigate whether pay-for-performancecompensation plans introduced by S&P 500 firms in the 1990s are beneficial tostockholders. We approach this question in several ways. First, we consider thestock market reaction to the announcement of these plans. A positive reactionwould suggest that shareholders believe that the plans help to providemanagers with additional incentives to improve firm performance. A positivereaction may also reflect new information that managers expect firmperformance to improve and are willing to tie their compensation to the
1An additional consideration in determining the cost of compensation plans is that managers
may not value options granted as highly as the market (and the issuing firm) would since their
portfolios are relatively undiversified. Meulbroek (2000) and Hall and Murphy (2000) consider this
point further.
A.G. Morgan, A.B. Poulsen / Journal of Financial Economics 62 (2001) 489–523492
expected performance improvement. We consider this alternative in additionalanalyses as discussed below.
Because performance plans are fairly commonplace among S&P 500 firms inthe 1990s, most of the proposals we identify are related to plan replacements oramendments. Therefore, any wealth effects we observe are primarily related tothese decisions to continue or revise performance plans rather than their initialintroduction. We assume that these incremental decisions are still of interest toshareholders and measure the wealth effects accordingly.
Second, we investigate whether pay-for-performance compensation plans aremore likely to be introduced or continued in the firms where they are mostbeneficial, that is, in firms characterized by higher potential agency problems. Iffirm characteristics did not significantly influence plan adoption, it wouldsuggest that managers are introducing the plans for reasons other than themaximization of shareholder wealth. We use regression analysis to identify firmcharacteristics associated with firms proposing or revising plans. We focus oncharacteristics such as the investment and growth opportunities and theownership structure of the firms. Because we look at proposals of performanceplans, we recognize that the non-proposing firms may already have pay-for-performance attributes in their firm. However, this possible overlap would biasagainst finding any differences between the proposing and non-proposing firms.
Our third area of investigation focuses on shareholder perception of stock-based compensation plans as a function of various plan and firm character-istics. While it is possible that incentive plans in general are beneficial toshareholders through the encouragement of better performance, there could besome plans that are better than others. Thus, we consider cross-sectionalvariation in shareholder wealth effects and shareholder voting returns. Thecomplexity of compensation plans and the uncertainty about future paymentsunder compensation plans may allow managers to propose plans that are toogenerous to themselves and that do not in fact align managerial incentives withshareholder wealth. Rappaport (1999), for example, argues that stock optionsawarded to managers in rising stock markets reward managers regardless ofthe company’s performance relative to its competitors and makes a case forimplementing stock options where the rewards are tied to a selected index thatprovides better relative information about the company’s performance. Hall(2000) provides an excellent review of plan features and how to design the bestplan given the characteristics of the firm.
The fact that institutional investors take negative stances on some proposalssuggests that not all pay-for-performance schemes are in shareholders’interests. Institutional investors seem to be particularly opposed to plans thatallow managers too much flexibility in their awards or result in excessivedilution of shareholder positions. The Stern Stewart Roundtable (1992)provides several examples of compensation schemes that simply serve toincrease managerial wealth rather than building in strong incentives for
A.G. Morgan, A.B. Poulsen / Journal of Financial Economics 62 (2001) 489–523 493
better performance. We collect dilution measures for each of the proposedplans in our study and also obtain voting recommendations for the plansfrom a proxy-voting advisory firm. We use these variables and measuresof firm characteristics as indicators of whether the plan provisions are inshareholders interests and test for evidence that shareholders are responsive toplan specifics.
Fourth, we question whether the wealth effects related to plan announce-ment provide a signal about future firm performance, whether due toinformation effects or better managerial performance due to the increasedincentives. Any positive announcement effects could result from informationreleased with the compensation plan announcement since the announcement ofa corporate event may communicate several things about the firm toshareholders. In the proxy statements and the accompanying financialstatements, managers announce pay-for-performance compensation schemesthat may further align their incentives with shareholder wealth. However, theintroduction of the plan can allow managers to signal to the market theirexpectations about future share prices. Managers may be most likely to ask forstock-based compensation when they can most benefit from it, i.e., when theyexpect stock prices to increase. Yermack (1997), for example, specificallyinvestigates the allocation of actual stock awards to see if they are timed toreflect insider information about expected stock prices. Thus, we are careful ininterpreting our results to note that any positive wealth results may also reflectnews about expected future earnings. We examine several post-performancemeasures including earnings, sales, and stock performance to test whether theannouncement of compensation plans is followed by superior post-implemen-tation performance.
3. Data and methodology
3.1. Compensation schemes
We collect 1,997 proxy statements from the S&P 500 firms submitted toshareholders from 1992 through 1995. Throughout the period of our analysis,stock-based compensation proposals were subjected to shareholder vote toallow the recipients to be exempt from Rule 16b, also known as the ‘‘short-swing sale’’ rule. Section 16 of the Securities Act of 1934 requires insiders andthose owning more than 10% of the corporation’s stock to disgorge any profitsresulting from round-trip transactions within a six-month period. Rule 16b-3allows an exception for purchases or sales associated with employee benefitplans, including stock option plans, if the shareholders of the corporation haveapproved the plan. In addition, the NYSE, American Stock Exchange and
A.G. Morgan, A.B. Poulsen / Journal of Financial Economics 62 (2001) 489–523494
NASDAQ Stock Market rules require shareholder approval of stock optionplans and many state corporation laws have similar requirements.2
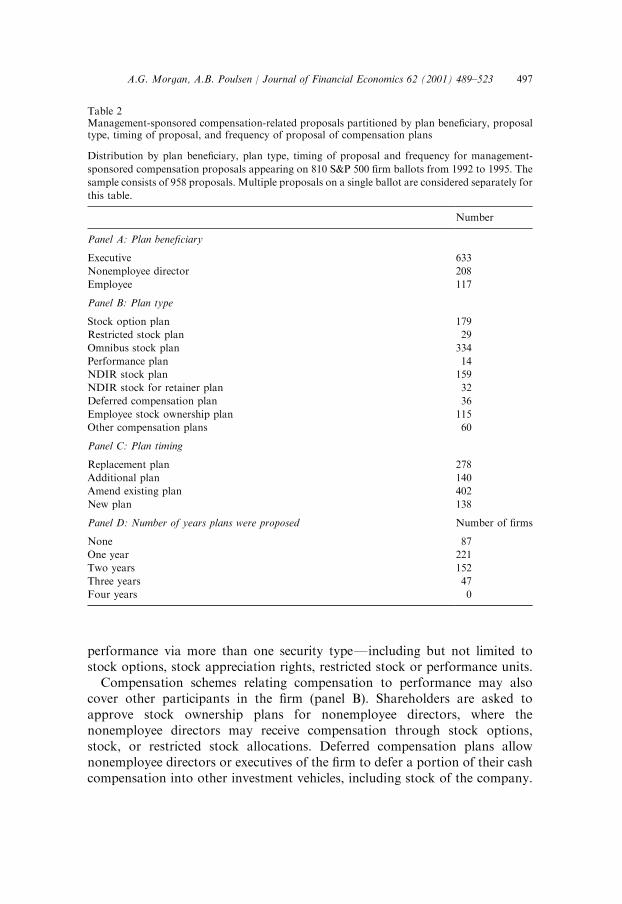
We identify 958 stock-based compensation proposals submitted by manage-ment on 810 different proxy ballots. In some cases, multiple compensationproposals appear on a single ballot; ballots have as many as eightcompensation proposals but usually we observe only a single such proposalper ballot. The proposed plans vary on several dimensions, including thesecurities affected, the plan beneficiaries and the specific features of the plan.Table 1 provides a summary of the plans, categorizing the plans on the basis ofthe type of compensation received and the recipients of the compensation.Table 2 provides a breakout of the frequency of the different plancharacteristics.
Managerial compensation is tied to performance through several possibletypes of security allocations. As reported in Table 1, top management orexecutives of the firm may benefit from stock option plans, restricted stockplans, performance plans or omnibus plans (panel A). In stock optionplans, managers receive option allocations that vest gradually overseveral years, starting generally a year after the options are received.The exercise price of the options is generally set as the market price or‘‘fair market value’’ at the time of allocation. In restricted stockplans, managers receive an allocation of shares that have restrictions withrespect to when the shares can be sold or transferred; these plans usuallyrequire that the managers hold the shares for several years and that theawards be forfeited if the managers leave the firm. Either stock option orrestricted stock plans may also use stock appreciation rights to replaceor supplement the other security.
Performance plans and omnibus plans are two other common types ofcompensation plans that are normally used for executive participants.Performance plans are more likely to tie managerial compensation toperformance through accounting measures of profitability. Rewards for greaterearnings or profitability may be made through stock allocations or cashrewards.3 We exclude performance plans that provide only cash compensation.Omnibus plans, as the name suggests, are plans that relate compensation to
2See Wagner and Wagner (1997) for a complete discussion of the law pertaining to voting on
compensation proposals. In 1996 (after the period of our analysis), the SEC removed the
requirement of shareholder approval for exemption from Section 16 for stock-based compensation,
as long as the board of directors or a committee of the board approved the plan. See Practicing Law
Institute (1997, p. 362), for additional details.3Performance plans that provide cash compensation are subject to IRS Rule 162 (m). In 1993,
the IRS enacted this change to the Internal Revenue Code of 1986 requiring that compensation in
excess of $1 million paid to the top five executives of the firm must be approved by shareholders for
the compensation to be tax deductible. In addition, the plans must tie compensation to
performance.
A.G. Morgan, A.B. Poulsen / Journal of Financial Economics 62 (2001) 489–523 495
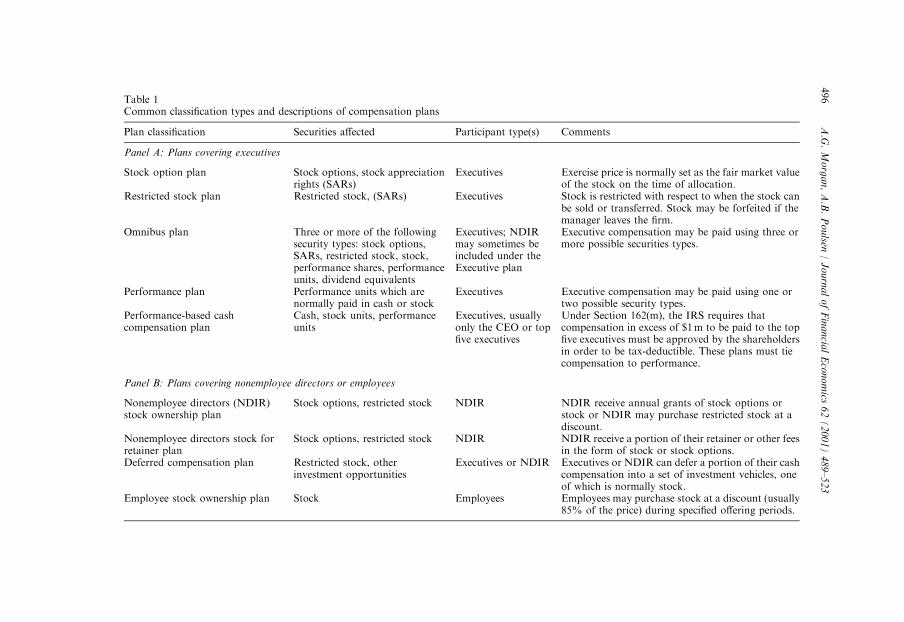
Table 1Common classification types and descriptions of compensation plans
Plan classification Securities affected Participant type(s) Comments
Panel A: Plans covering executives
Stock option plan Stock options, stock appreciationrights (SARs)
Executives Exercise price is normally set as the fair market valueof the stock on the time of allocation.
Restricted stock plan Restricted stock, (SARs) Executives Stock is restricted with respect to when the stock canbe sold or transferred. Stock may be forfeited if themanager leaves the firm.
Omnibus plan Three or more of the followingsecurity types: stock options,SARs, restricted stock, stock,performance shares, performanceunits, dividend equivalents
Executives; NDIRmay sometimes beincluded under theExecutive plan
Executive compensation may be paid using three ormore possible securities types.
Performance plan Performance units which arenormally paid in cash or stock
Executives Executive compensation may be paid using one ortwo possible security types.
Performance-based cashcompensation plan
Cash, stock units, performanceunits
Executives, usuallyonly the CEO or topfive executives
Under Section 162(m), the IRS requires thatcompensation in excess of $1m to be paid to the topfive executives must be approved by the shareholdersin order to be tax-deductible. These plans must tiecompensation to performance.
Panel B: Plans covering nonemployee directors or employees
Nonemployee directors (NDIR)stock ownership plan
Stock options, restricted stock NDIR NDIR receive annual grants of stock options orstock or NDIR may purchase restricted stock at adiscount.
Nonemployee directors stock forretainer plan
Stock options, restricted stock NDIR NDIR receive a portion of their retainer or other feesin the form of stock or stock options.
Deferred compensation plan Restricted stock, otherinvestment opportunities
Executives or NDIR Executives or NDIR can defer a portion of their cashcompensation into a set of investment vehicles, oneof which is normally stock.
Employee stock ownership plan Stock Employees Employees may purchase stock at a discount (usually85% of the price) during specified offering periods.
A.G.Morgan,A.B.Poulsen
/JournalofFinancia
lEconomics
62(2001)489–523
496
performance via more than one security typeFincluding but not limited tostock options, stock appreciation rights, restricted stock or performance units.
Compensation schemes relating compensation to performance may alsocover other participants in the firm (panel B). Shareholders are asked toapprove stock ownership plans for nonemployee directors, where thenonemployee directors may receive compensation through stock options,stock, or restricted stock allocations. Deferred compensation plans allownonemployee directors or executives of the firm to defer a portion of their cashcompensation into other investment vehicles, including stock of the company.
Table 2Management-sponsored compensation-related proposals partitioned by plan beneficiary, proposaltype, timing of proposal, and frequency of proposal of compensation plans
Distribution by plan beneficiary, plan type, timing of proposal and frequency for management-
sponsored compensation proposals appearing on 810 S&P 500 firm ballots from 1992 to 1995. The
sample consists of 958 proposals. Multiple proposals on a single ballot are considered separately for
this table.
Number
Panel A: Plan beneficiary
Executive 633
Nonemployee director 208
Employee 117
Panel B: Plan type
Stock option plan 179
Restricted stock plan 29
Omnibus stock plan 334
Performance plan 14
NDIR stock plan 159
NDIR stock for retainer plan 32
Deferred compensation plan 36
Employee stock ownership plan 115
Other compensation plans 60
Panel C: Plan timing
Replacement plan 278
Additional plan 140
Amend existing plan 402
New plan 138
Panel D: Number of years plans were proposed Number of firms
None 87
One year 221
Two years 152
Three years 47
Four years 0
A.G. Morgan, A.B. Poulsen / Journal of Financial Economics 62 (2001) 489–523 497
Shareholders also vote on the establishment of employee stock ownership plans,which allow all or most employees to purchase the stock of the company, usuallyat a discount during specified offering periods. The majority of employee plansallow employees to purchase stock at 85% of the fair market value.
The bulk of the plans in our sample (633 of 958) include the executives or topmanagers of the firm as beneficiaries (Table 2, panel A). Nonemployeedirectors are included in 208 plans and employees are covered in 117 plans.Some plans may cover more than one participant type. For example, it is notuncommon to see omnibus stock plans that provide one list of securities thatmay be granted to officers and a different list (usually non-qualified stockoptions or restricted stock) that may be granted to nonemployee directors.Omnibus plans covering both executives and nonemployee directors areclassified as executive plans for this study. The bulk of the plans in our sampleare omnibus plans (panel B, 334 plans, 34.8% of the full sample), with 18.7%(n ¼ 179) of the additional compensation plans being stock option plans and2.3% (n ¼ 29) being restricted stock plans. Nonemployee director plans andemployee stock ownership plans are 19.8% (n ¼ 190) and 12.0% (n ¼ 115),respectively, of our sample.
Compensation resolutions may replace an existing plan, add a plan, amendan existing plan or propose a new plan (panel C). Plans typically have a ten-year duration, requiring replacement at the end of that period. Plans may alsobe replaced if they run low on allotted shares for distribution. We identify 278replacement plans. We have 140 proposals that add a new compensation planto existing plans and 402 proposals that amend existing plans to increase thenumber of shares covered under the plan, extend the term of the plan, increasethe amount of grants provided to nonemployee directors or limit the amount ofawards which can be provided annually to an individual. We identify 138 plansthat seem to be totally new to the firm.
Table 2 (panel D) also reports the frequency with which the firms in oursample proposed compensation plans. Most of the firms in the sampleproposed compensation plans in one (221) or two (152) years of our sampleperiod. Eighty-seven firms never proposed compensation plans during thisfour-year period, while 47 proposed plans in three different years.
All stock-based compensation plans are not equally beneficial to share-holders. There exists the opportunity for abuse in these plans, and institutionalinvestors have incentives to spend significant time evaluating specific featuresof compensation plans and to develop standard voting policies with respect toplan provisions. Of particular concern to shareholders and governance activistsis the dilution of the outstanding common stock by the issuance of morecommon stock as a result of the exercise of the stock options. Dilution canaffect the share of the profits returned to the shareholders if shares arepurchased at the lower exercise price rather than the market price or if newlyinvested funds are not as profitable as the existing capital in the firm. In
A.G. Morgan, A.B. Poulsen / Journal of Financial Economics 62 (2001) 489–523498
addition, the relative voting strength of existing shareholders is diluted whennew shares are issued. In the case of stock-based compensation, the dilution ofthe voting rights has a dual impact since the additional shares issued lower thevoting strength of the typical shareholder while at the same time the allocationof the shares to management or nonemployee directors results in moreconcentrated voting for insiders. We use dilution as a measure of the quality ofthe plan, with the assumption that overly dilutive plans are detrimental toshareholders.4
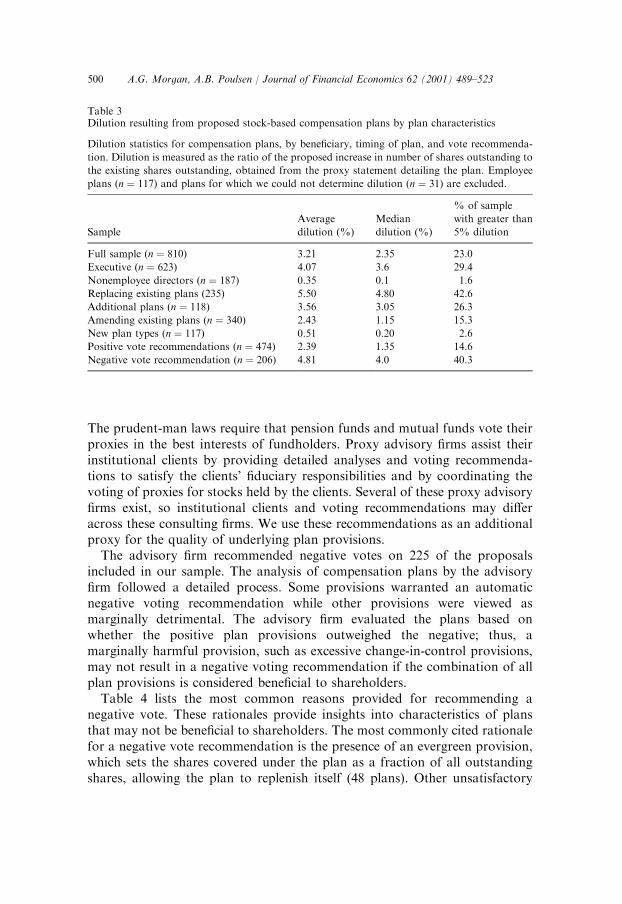
Table 3 reports dilution statistics for the proposed compensation plans inour sample, focusing on the 810 top management and nonexecutivecompensation plans with available data. Dilution is measured as the ratio ofthe proposed increase in the number of shares outstanding resulting from theproposal to the outstanding number of shares. Average dilution for the fullsample is 3.21% (median=2.35%). However, 23% of the sample has dilutiongreater than 5% of the outstanding shares. In examining dilution statistics forseveral subsamples, we find that the greatest dilution occurs in the executivecompensation proposals (with more than 29.4% of the 623 plans resulting ingreater than 5% dilution) and in those plans that replace existing plans (42.6%of the plans resulting in greater than 5% dilution). We note that 217 of the 235(or 92%) of the replacement plans are executive compensation plans,emphasizing that the greatest dilution occurs in the executive category. Werarely observe more than 5% dilution in the nonemployee director plans, withonly 1.6% of the observations falling in that category. Bethel and Gillan (2000)present data that suggest that managers try to cap dilution at less than 5% toprevent negative reactions to proposed stock-based compensation plans. Wesee somewhat similar patterns in our data, with more than 25% of theexecutive plans falling in the 3–5% dilution range, compared to only 15% inthe 1–3% range. However, more than 29% of the executive plans have 5% ormore dilution.
We also gather voting recommendations from an outside proxy-votingadvisory firm that provided these recommendations to institutional clients on afee basis.5 The recommendations were provided to us on a confidential basis.
4TIAA-CREF, an important institutional investor that has taken a watchdog position on many
corporate governance provisions, states, ‘‘Shareholder interests are vitally affected by stock-based
compensation plans. Inherently, they provide the greatest opportunities for incentives, and for
abuse.’’ TIAA-CREF has developed guidelines specifically for executive compensation in their
Policy Statement on Corporate Governance. One of the key considerations with respect to stock-
based awards is the potential dilution from the plan, with TIAA-CREF raising a red flag if the plan
allows more than 15% dilution over the duration of the plan or 2% in any one year. Other red flags
include reload options, evergreen plans, or options that allow repricing when the market price of
the stock has declined below the original exercise. (TIAA-CREF, 2000.)5While some voting advisory firms also provide their recommendations to the managers
sponsoring the proposals for a fee, this firm did not.
A.G. Morgan, A.B. Poulsen / Journal of Financial Economics 62 (2001) 489–523 499
The prudent-man laws require that pension funds and mutual funds vote theirproxies in the best interests of fundholders. Proxy advisory firms assist theirinstitutional clients by providing detailed analyses and voting recommenda-tions to satisfy the clients’ fiduciary responsibilities and by coordinating thevoting of proxies for stocks held by the clients. Several of these proxy advisoryfirms exist, so institutional clients and voting recommendations may differacross these consulting firms. We use these recommendations as an additionalproxy for the quality of underlying plan provisions.
The advisory firm recommended negative votes on 225 of the proposalsincluded in our sample. The analysis of compensation plans by the advisoryfirm followed a detailed process. Some provisions warranted an automaticnegative voting recommendation while other provisions were viewed asmarginally detrimental. The advisory firm evaluated the plans based onwhether the positive plan provisions outweighed the negative; thus, amarginally harmful provision, such as excessive change-in-control provisions,may not result in a negative voting recommendation if the combination of allplan provisions is considered beneficial to shareholders.
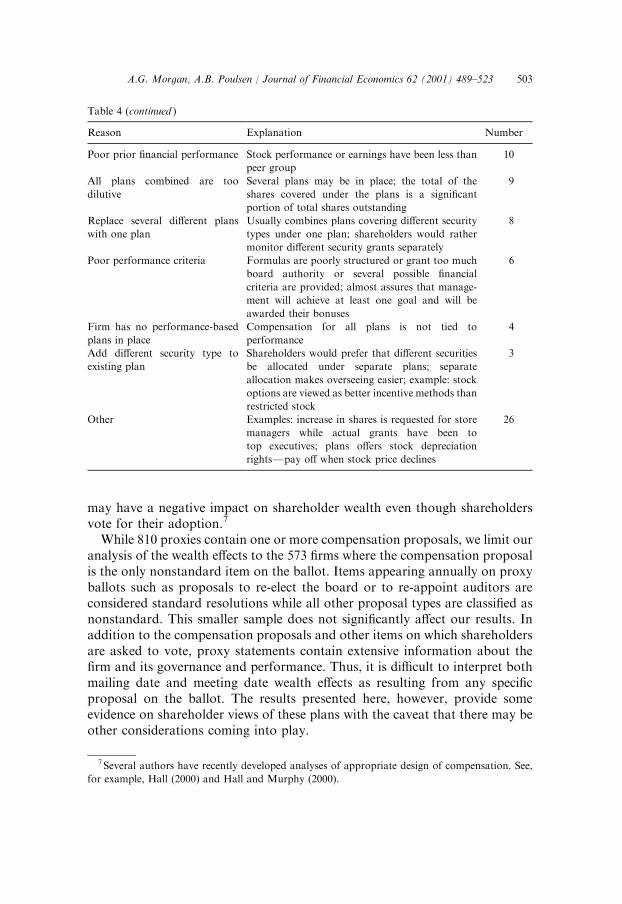
Table 4 lists the most common reasons provided for recommending anegative vote. These rationales provide insights into characteristics of plansthat may not be beneficial to shareholders. The most commonly cited rationalefor a negative vote recommendation is the presence of an evergreen provision,which sets the shares covered under the plan as a fraction of all outstandingshares, allowing the plan to replenish itself (48 plans). Other unsatisfactory
Table 3Dilution resulting from proposed stock-based compensation plans by plan characteristics
Dilution statistics for compensation plans, by beneficiary, timing of plan, and vote recommenda-
tion. Dilution is measured as the ratio of the proposed increase in number of shares outstanding to
the existing shares outstanding, obtained from the proxy statement detailing the plan. Employee
plans (n ¼ 117) and plans for which we could not determine dilution (n ¼ 31) are excluded.
Sample
Average
dilution (%)
Median
dilution (%)
% of sample
with greater than
5% dilution
Full sample (n ¼ 810) 3.21 2.35 23.0
Executive (n ¼ 623) 4.07 3.6 29.4
Nonemployee directors (n ¼ 187) 0.35 0.1 1.6
Replacing existing plans (235) 5.50 4.80 42.6
Additional plans (n ¼ 118) 3.56 3.05 26.3
Amending existing plans (n ¼ 340) 2.43 1.15 15.3
New plan types (n ¼ 117) 0.51 0.20 2.6
Positive vote recommendations (n ¼ 474) 2.39 1.35 14.6
Negative vote recommendation (n ¼ 206) 4.81 4.0 40.3
A.G. Morgan, A.B. Poulsen / Journal of Financial Economics 62 (2001) 489–523500
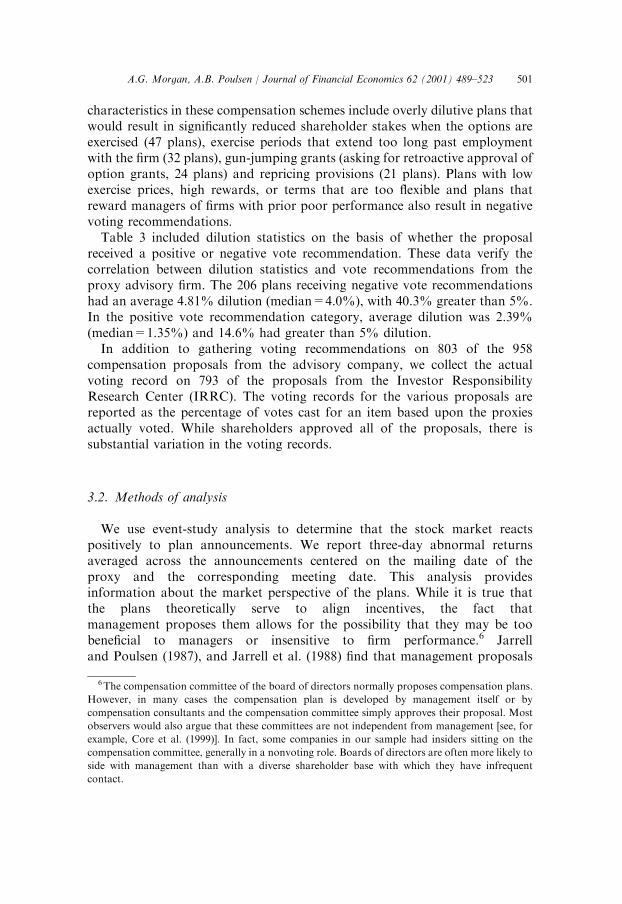
characteristics in these compensation schemes include overly dilutive plans thatwould result in significantly reduced shareholder stakes when the options areexercised (47 plans), exercise periods that extend too long past employmentwith the firm (32 plans), gun-jumping grants (asking for retroactive approval ofoption grants, 24 plans) and repricing provisions (21 plans). Plans with lowexercise prices, high rewards, or terms that are too flexible and plans thatreward managers of firms with prior poor performance also result in negativevoting recommendations.
Table 3 included dilution statistics on the basis of whether the proposalreceived a positive or negative vote recommendation. These data verify thecorrelation between dilution statistics and vote recommendations from theproxy advisory firm. The 206 plans receiving negative vote recommendationshad an average 4.81% dilution (median=4.0%), with 40.3% greater than 5%.In the positive vote recommendation category, average dilution was 2.39%(median=1.35%) and 14.6% had greater than 5% dilution.
In addition to gathering voting recommendations on 803 of the 958compensation proposals from the advisory company, we collect the actualvoting record on 793 of the proposals from the Investor ResponsibilityResearch Center (IRRC). The voting records for the various proposals arereported as the percentage of votes cast for an item based upon the proxiesactually voted. While shareholders approved all of the proposals, there issubstantial variation in the voting records.
3.2. Methods of analysis
We use event-study analysis to determine that the stock market reactspositively to plan announcements. We report three-day abnormal returnsaveraged across the announcements centered on the mailing date of theproxy and the corresponding meeting date. This analysis providesinformation about the market perspective of the plans. While it is true thatthe plans theoretically serve to align incentives, the fact thatmanagement proposes them allows for the possibility that they may be toobeneficial to managers or insensitive to firm performance.6 Jarrelland Poulsen (1987), and Jarrell et al. (1988) find that management proposals
6The compensation committee of the board of directors normally proposes compensation plans.
However, in many cases the compensation plan is developed by management itself or by
compensation consultants and the compensation committee simply approves their proposal. Most
observers would also argue that these committees are not independent from management [see, for
example, Core et al. (1999)]. In fact, some companies in our sample had insiders sitting on the
compensation committee, generally in a nonvoting role. Boards of directors are often more likely to
side with management than with a diverse shareholder base with which they have infrequent
contact.
A.G. Morgan, A.B. Poulsen / Journal of Financial Economics 62 (2001) 489–523 501
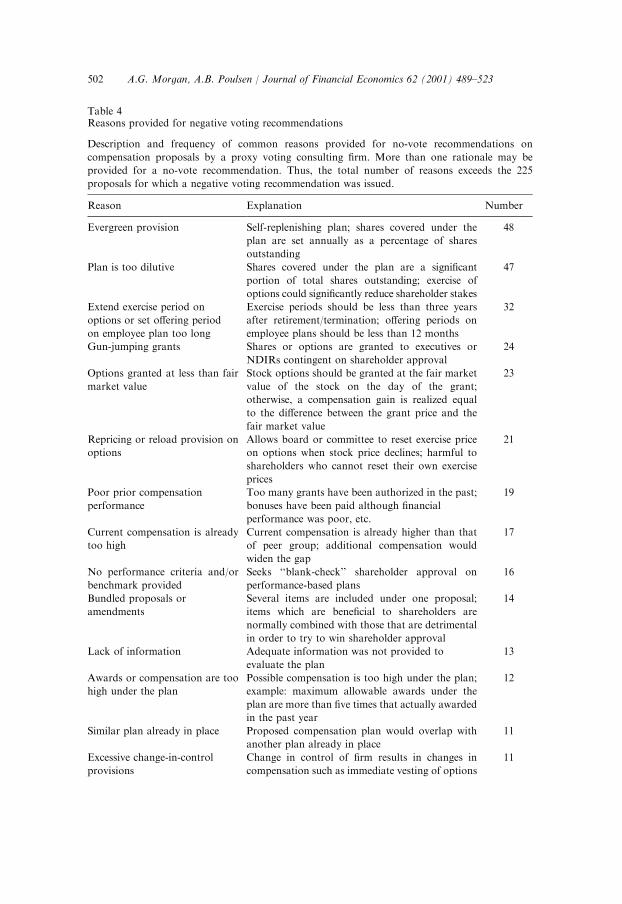
Table 4Reasons provided for negative voting recommendations
Description and frequency of common reasons provided for no-vote recommendations on
compensation proposals by a proxy voting consulting firm. More than one rationale may be
provided for a no-vote recommendation. Thus, the total number of reasons exceeds the 225
proposals for which a negative voting recommendation was issued.
Reason Explanation Number
Evergreen provision Self-replenishing plan; shares covered under the
plan are set annually as a percentage of shares
outstanding
48
Plan is too dilutive Shares covered under the plan are a significant
portion of total shares outstanding; exercise of
options could significantly reduce shareholder stakes
47
Extend exercise period on
options or set offering period
on employee plan too long
Exercise periods should be less than three years
after retirement/termination; offering periods on
employee plans should be less than 12 months
32
Gun-jumping grants Shares or options are granted to executives or
NDIRs contingent on shareholder approval
24
Options granted at less than fair
market value
Stock options should be granted at the fair market
value of the stock on the day of the grant;
otherwise, a compensation gain is realized equal
to the difference between the grant price and the
fair market value
23
Repricing or reload provision on
options
Allows board or committee to reset exercise price
on options when stock price declines; harmful to
shareholders who cannot reset their own exercise
prices
21
Poor prior compensation
performance
Too many grants have been authorized in the past;
bonuses have been paid although financial
performance was poor, etc.
19
Current compensation is already
too high
Current compensation is already higher than that
of peer group; additional compensation would
widen the gap
17
No performance criteria and/or
benchmark provided
Seeks ‘‘blank-check’’ shareholder approval on
performance-based plans
16
Bundled proposals or
amendments
Several items are included under one proposal;
items which are beneficial to shareholders are
normally combined with those that are detrimental
in order to try to win shareholder approval
14
Lack of information Adequate information was not provided to
evaluate the plan
13
Awards or compensation are too
high under the plan
Possible compensation is too high under the plan;
example: maximum allowable awards under the
plan are more than five times that actually awarded
in the past year
12
Similar plan already in place Proposed compensation plan would overlap with
another plan already in place
11
Excessive change-in-control
provisions
Change in control of firm results in changes in
compensation such as immediate vesting of options
11
A.G. Morgan, A.B. Poulsen / Journal of Financial Economics 62 (2001) 489–523502
may have a negative impact on shareholder wealth even though shareholdersvote for their adoption.7
While 810 proxies contain one or more compensation proposals, we limit ouranalysis of the wealth effects to the 573 firms where the compensation proposalis the only nonstandard item on the ballot. Items appearing annually on proxyballots such as proposals to re-elect the board or to re-appoint auditors areconsidered standard resolutions while all other proposal types are classified asnonstandard. This smaller sample does not significantly affect our results. Inaddition to the compensation proposals and other items on which shareholdersare asked to vote, proxy statements contain extensive information about thefirm and its governance and performance. Thus, it is difficult to interpret bothmailing date and meeting date wealth effects as resulting from any specificproposal on the ballot. The results presented here, however, provide someevidence on shareholder views of these plans with the caveat that there may beother considerations coming into play.
Table 4 (continued )
Reason Explanation Number
Poor prior financial performance Stock performance or earnings have been less than
peer group
10
All plans combined are too
dilutive
Several plans may be in place; the total of the
shares covered under the plans is a significant
portion of total shares outstanding
9
Replace several different plans
with one plan
Usually combines plans covering different security
types under one plan; shareholders would rather
monitor different security grants separately
8
Poor performance criteria Formulas are poorly structured or grant too much
board authority or several possible financial
criteria are provided; almost assures that manage-
ment will achieve at least one goal and will be
awarded their bonuses
6
Firm has no performance-based
plans in place
Compensation for all plans is not tied to
performance
4
Add different security type to
existing plan
Shareholders would prefer that different securities
be allocated under separate plans; separate
allocation makes overseeing easier; example: stock
options are viewed as better incentive methods than
restricted stock
3
Other Examples: increase in shares is requested for store
managers while actual grants have been to
top executives; plans offers stock depreciation
rightsFpay off when stock price declines
26
7Several authors have recently developed analyses of appropriate design of compensation. See,
for example, Hall (2000) and Hall and Murphy (2000).
A.G. Morgan, A.B. Poulsen / Journal of Financial Economics 62 (2001) 489–523 503
We first consider the shareholder wealth effects of the compensation plans.For the full sample of 573 proxy announcements for which we have data, wefind a positive wealth effect at the mailing date (cumulative abnormal return orCAR=0.38%, t ¼ 2:45) and at the meeting date (CAR=0.34%, t ¼ 2:24). Wealso consider several subgroups of plans to see if the plan beneficiary or thetiming of the plan significantly affects the market reaction.
Second, we use logistic regressions to test for firm characteristics that areassociated with the proposal of pay-for-performance compensation plans. Weinclude several variables in the regressions to measure the importance ofagency considerations, including book-to-market ratios, firm size, insiderholdings and institutional holdings. We also test several variables measuringpreceding-year share price and accounting performance that may helpdistinguish the importance of timing and signaling of performance in theintroduction of these plans. We expect that if the plans were beneficial toshareholders, their introduction or revision would be systematically related tofirm characteristics that proxy for agency considerations.
Third, we consider whether cross-sectional variation in the compensationplans and the proposing firms affect the market reaction to the plans andshareholder vote-for percentages on the plans. Presumably shareholderapproval of the plans, whether measured through the wealth effect or thevote-for percentage, will increase the more beneficial the plan is thought to be.Plan-specific variables, such as whether the proposal received a negative voterecommendation and the dilution resulting from the proposal, are included inthis analysis. In addition, we consider similar explanatory variables to thoseused in the logistic regressions.
Last, we look at firm performance before and after the announcement of thestock-based compensation plan. We examine several performance variables,including stock performance, earnings, sales, and growth in assets and sales.Performance is evaluated by comparing pre- and post-performance results forthe subset sponsoring compensation against the set of firms without theseproposals, and by comparing same-firm pre- and post-performance results forthe firms sponsoring compensation-related resolutions.
4. Results of analysis of performance compensation
4.1. Wealth effects
Table 5 reports the results from our event study analysis for severalcategories of compensation plans. We report the wealth effects based on three-day (�1 to +1) windows around the mailing date of the proxy materials andthe date of the annual meeting. We estimate wealth effects using standardmarket methodology, as developed in Brown and Warner (1980, 1985). We
A.G. Morgan, A.B. Poulsen / Journal of Financial Economics 62 (2001) 489–523504
estimate the relation between the stock return and the market for 100 daysbeginning 105 days prior to the mailing date. The estimated relation is used tomeasure abnormal returns in the event window. The t-statistics are computed
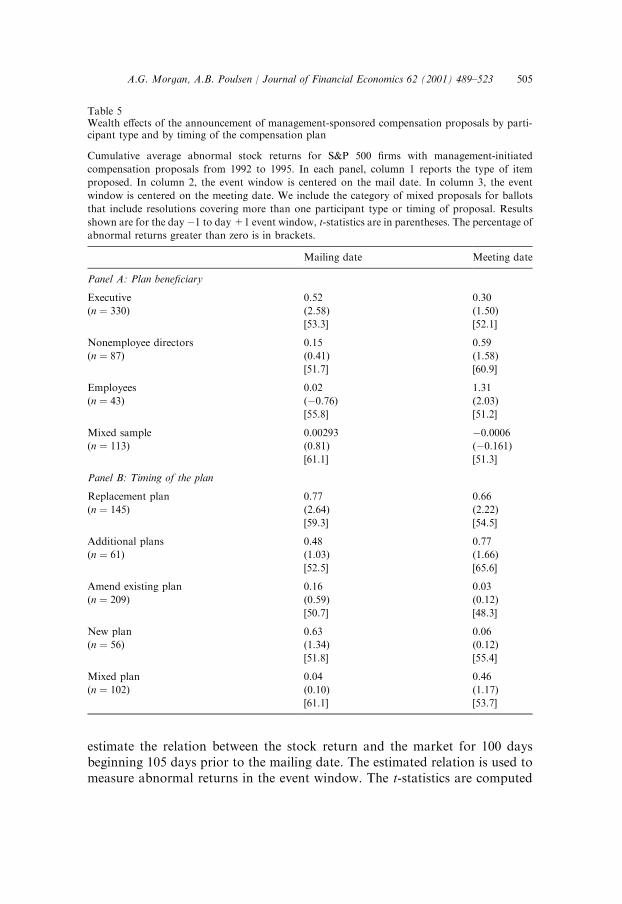
Table 5Wealth effects of the announcement of management-sponsored compensation proposals by parti-cipant type and by timing of the compensation plan
Cumulative average abnormal stock returns for S&P 500 firms with management-initiated
compensation proposals from 1992 to 1995. In each panel, column 1 reports the type of item
proposed. In column 2, the event window is centered on the mail date. In column 3, the event
window is centered on the meeting date. We include the category of mixed proposals for ballots
that include resolutions covering more than one participant type or timing of proposal. Results
shown are for the day �1 to day +1 event window, t-statistics are in parentheses. The percentage of
abnormal returns greater than zero is in brackets.
Mailing date Meeting date
Panel A: Plan beneficiary
Executive 0.52 0.30
(n ¼ 330) (2.58) (1.50)
[53.3] [52.1]
Nonemployee directors 0.15 0.59
(n ¼ 87) (0.41) (1.58)
[51.7] [60.9]
Employees 0.02 1.31
(n ¼ 43) (�0.76) (2.03)
[55.8] [51.2]
Mixed sample 0.00293 �0.0006
(n ¼ 113) (0.81) (�0.161)
[61.1] [51.3]
Panel B: Timing of the plan
Replacement plan 0.77 0.66
(n ¼ 145) (2.64) (2.22)
[59.3] [54.5]
Additional plans 0.48 0.77
(n ¼ 61) (1.03) (1.66)
[52.5] [65.6]
Amend existing plan 0.16 0.03
(n ¼ 209) (0.59) (0.12)
[50.7] [48.3]
New plan 0.63 0.06
(n ¼ 56) (1.34) (0.12)
[51.8] [55.4]
Mixed plan 0.04 0.46
(n ¼ 102) (0.10) (1.17)
[61.1] [53.7]
A.G. Morgan, A.B. Poulsen / Journal of Financial Economics 62 (2001) 489–523 505
from the standard error of the estimation period. We differentiate the wealtheffects based on the beneficiaries of the compensation package and on thetiming of the plan, i.e., the plan is a replacement plan, amends or adds to anexisting plan or is a new plan.
There are 330 ballots that contain proposals benefiting only executives or topmanagement, 87 that benefit nonemployee directors, and 43 that benefitemployees. In addition, 113 ballots contain proposals where the proposalsviewed jointly benefit more than one group. The proxy mailing dates ofproposals that target executives of the firm are associated with significantincreases in shareholder wealth, averaging 0.52% (53.3% of the CARs arepositive). The other classifications are associated with CARs that areinsignificantly different from zero on the mailing date, with the employeeplans significantly positive on the meeting date. (We discuss the meeting-datewealth effects further at the end of this section.) Given that top managers havethe most direct impact on firm activities, it is not surprising that the significantwealth effects are concentrated in the executive compensation proposals. TheseCARs support the premise that, on average, the compensation schemes areviewed positively. These results are consistent with the plans helping to furtheralign managerial incentives with shareholder wealth or that the plans providegood news about future firm performance.
An important differentiation to make in our sample is to consider whetherthe compensation resolutions propose a new plan or are simply an amendmentto or renewal of an existing plan. We identify 145 ballots with plansthat replace existing plans as they expire or as the number of unused sharesunder the plans becomes low, 61 ballots that supplement existing plans,209 ballots that amend existing plans and 56 ballots introducing newcompensation plans in firms that previously did not have performancecompensation plans (to the extent that we are able to identify existing plans).The replacement plans are associated with significantly positive CARs, 0.77%at the mailing date and 0.66% at the meeting date. However, 124 of the 145replacement plans are also executive compensation plans, suggesting that theimpact of the timing of the plan on the wealth change is intertwined with theimpact of the beneficiary of the plan. The remaining categories areinsignificantly different from zero.
The wealth effect associated with a proposal should reflect the marginalimpact of the plan. Thus, it is interesting to note that we find the largest wealtheffect associated with the replacement plans rather than the new plans, leadingus to believe that shareholders view favorably the continuation of, or changesto, existing plans that primarily benefit executives. The new plan category onthe other hand, with insignificant wealth effects, consists primarily of non-director compensation plans (45 of 56). We further consider cross-sectionalvariation in the CARs related to plan and firm characteristics in Section 4.3below.
A.G. Morgan, A.B. Poulsen / Journal of Financial Economics 62 (2001) 489–523506
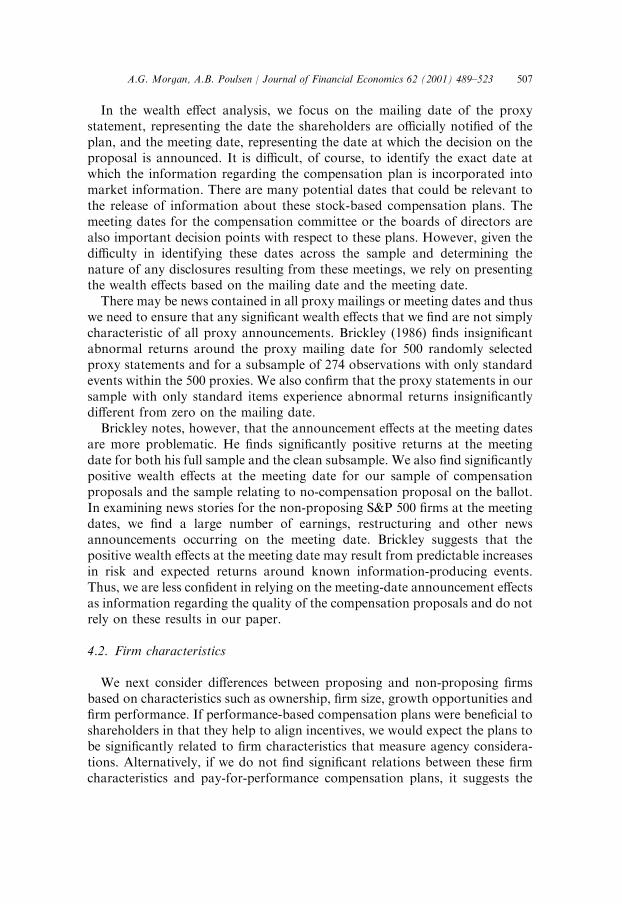
In the wealth effect analysis, we focus on the mailing date of the proxystatement, representing the date the shareholders are officially notified of theplan, and the meeting date, representing the date at which the decision on theproposal is announced. It is difficult, of course, to identify the exact date atwhich the information regarding the compensation plan is incorporated intomarket information. There are many potential dates that could be relevant tothe release of information about these stock-based compensation plans. Themeeting dates for the compensation committee or the boards of directors arealso important decision points with respect to these plans. However, given thedifficulty in identifying these dates across the sample and determining thenature of any disclosures resulting from these meetings, we rely on presentingthe wealth effects based on the mailing date and the meeting date.
There may be news contained in all proxy mailings or meeting dates and thuswe need to ensure that any significant wealth effects that we find are not simplycharacteristic of all proxy announcements. Brickley (1986) finds insignificantabnormal returns around the proxy mailing date for 500 randomly selectedproxy statements and for a subsample of 274 observations with only standardevents within the 500 proxies. We also confirm that the proxy statements in oursample with only standard items experience abnormal returns insignificantlydifferent from zero on the mailing date.
Brickley notes, however, that the announcement effects at the meeting datesare more problematic. He finds significantly positive returns at the meetingdate for both his full sample and the clean subsample. We also find significantlypositive wealth effects at the meeting date for our sample of compensationproposals and the sample relating to no-compensation proposal on the ballot.In examining news stories for the non-proposing S&P 500 firms at the meetingdates, we find a large number of earnings, restructuring and other newsannouncements occurring on the meeting date. Brickley suggests that thepositive wealth effects at the meeting date may result from predictable increasesin risk and expected returns around known information-producing events.Thus, we are less confident in relying on the meeting-date announcement effectsas information regarding the quality of the compensation proposals and do notrely on these results in our paper.
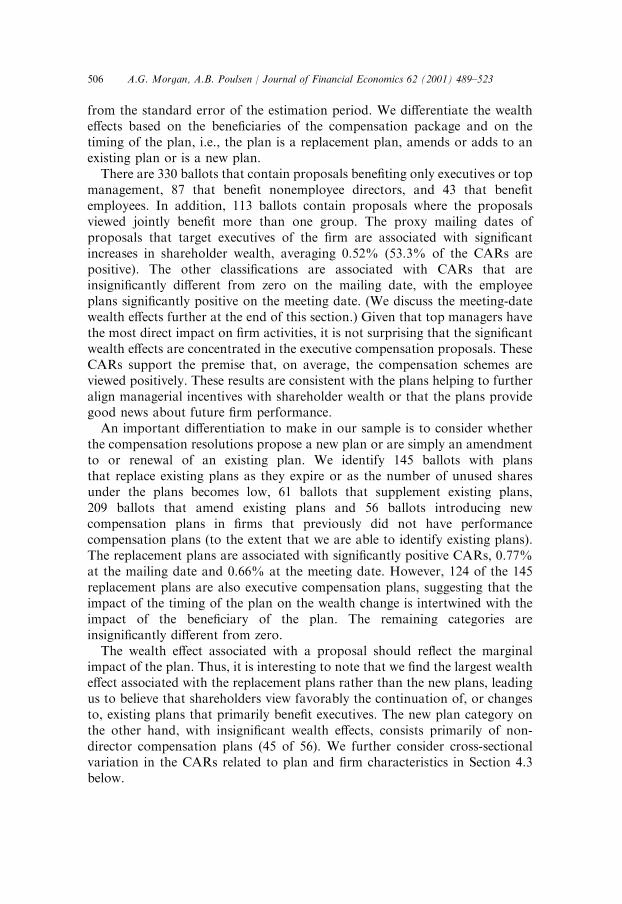
4.2. Firm characteristics
We next consider differences between proposing and non-proposing firmsbased on characteristics such as ownership, firm size, growth opportunities andfirm performance. If performance-based compensation plans were beneficial toshareholders in that they help to align incentives, we would expect the plans tobe significantly related to firm characteristics that measure agency considera-tions. Alternatively, if we do not find significant relations between these firmcharacteristics and pay-for-performance compensation plans, it suggests the
A.G. Morgan, A.B. Poulsen / Journal of Financial Economics 62 (2001) 489–523 507
importance of other considerations, such as managers adopting plans thatbenefit themselves regardless of the impact on shareholders.
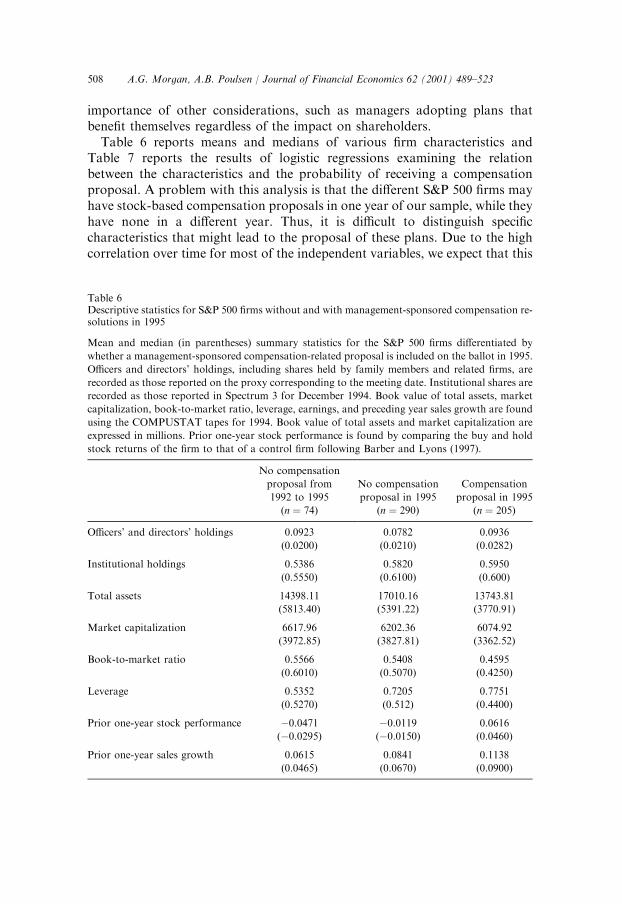
Table 6 reports means and medians of various firm characteristics andTable 7 reports the results of logistic regressions examining the relationbetween the characteristics and the probability of receiving a compensationproposal. A problem with this analysis is that the different S&P 500 firms mayhave stock-based compensation proposals in one year of our sample, while theyhave none in a different year. Thus, it is difficult to distinguish specificcharacteristics that might lead to the proposal of these plans. Due to the highcorrelation over time for most of the independent variables, we expect that this
Table 6Descriptive statistics for S&P 500 firms without and with management-sponsored compensation re-solutions in 1995
Mean and median (in parentheses) summary statistics for the S&P 500 firms differentiated by
whether a management-sponsored compensation-related proposal is included on the ballot in 1995.
Officers and directors’ holdings, including shares held by family members and related firms, are
recorded as those reported on the proxy corresponding to the meeting date. Institutional shares are
recorded as those reported in Spectrum 3 for December 1994. Book value of total assets, market
capitalization, book-to-market ratio, leverage, earnings, and preceding year sales growth are found
using the COMPUSTAT tapes for 1994. Book value of total assets and market capitalization are
expressed in millions. Prior one-year stock performance is found by comparing the buy and hold
stock returns of the firm to that of a control firm following Barber and Lyons (1997).
No compensation
proposal from
1992 to 1995
(n ¼ 74)
No compensation
proposal in 1995
(n ¼ 290)
Compensation
proposal in 1995
(n ¼ 205)
Officers’ and directors’ holdings 0.0923 0.0782 0.0936
(0.0200) (0.0210) (0.0282)
Institutional holdings 0.5386 0.5820 0.5950
(0.5550) (0.6100) (0.600)
Total assets 14398.11 17010.16 13743.81
(5813.40) (5391.22) (3770.91)
Market capitalization 6617.96 6202.36 6074.92
(3972.85) (3827.81) (3362.52)
Book-to-market ratio 0.5566 0.5408 0.4595
(0.6010) (0.5070) (0.4250)
Leverage 0.5352 0.7205 0.7751
(0.5270) (0.512) (0.4400)
Prior one-year stock performance �0.0471 �0.0119 0.0616
(�0.0295) (�0.0150) (0.0460)
Prior one-year sales growth 0.0615 0.0841 0.1138
(0.0465) (0.0670) (0.0900)
A.G. Morgan, A.B. Poulsen / Journal of Financial Economics 62 (2001) 489–523508
would weaken the ability of the logistic analysis to identify distinguishingfeatures of firms that lead to the introduction of a plan in a given year. In theresults presented in Table 6, we report averages and medians of the financialand performance variables at their levels for year-end 1994. Each observationin the logistic regression (Table 7), however, is based on data corresponding tothe year-end prior to the corresponding proxy filing.
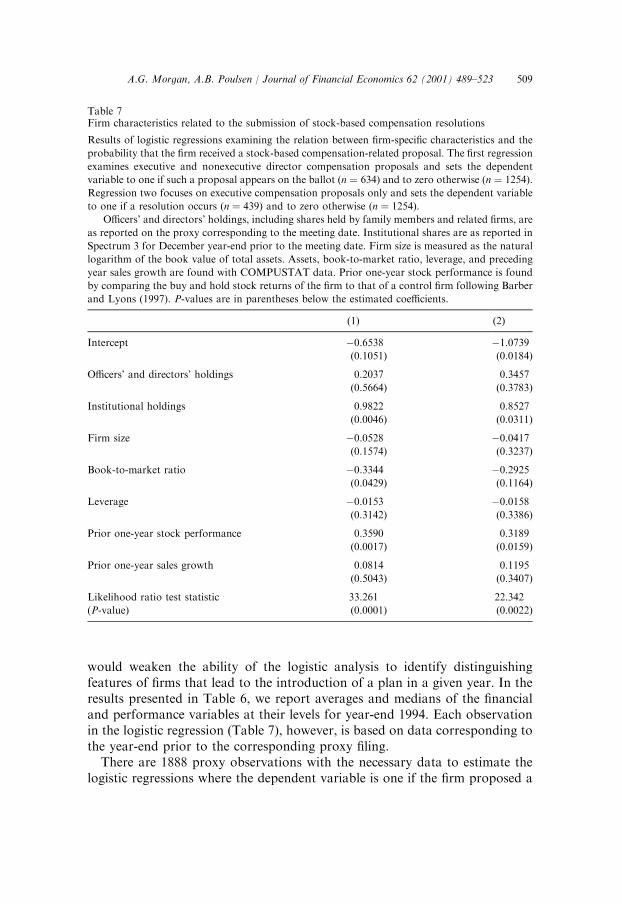
There are 1888 proxy observations with the necessary data to estimate thelogistic regressions where the dependent variable is one if the firm proposed a
Table 7Firm characteristics related to the submission of stock-based compensation resolutions
Results of logistic regressions examining the relation between firm-specific characteristics and the
probability that the firm received a stock-based compensation-related proposal. The first regression
examines executive and nonexecutive director compensation proposals and sets the dependent
variable to one if such a proposal appears on the ballot (n ¼ 634) and to zero otherwise (n ¼ 1254).
Regression two focuses on executive compensation proposals only and sets the dependent variable
to one if a resolution occurs (n ¼ 439) and to zero otherwise (n ¼ 1254).
Officers’ and directors’ holdings, including shares held by family members and related firms, are
as reported on the proxy corresponding to the meeting date. Institutional shares are as reported in
Spectrum 3 for December year-end prior to the meeting date. Firm size is measured as the natural
logarithm of the book value of total assets. Assets, book-to-market ratio, leverage, and preceding
year sales growth are found with COMPUSTAT data. Prior one-year stock performance is found
by comparing the buy and hold stock returns of the firm to that of a control firm following Barber
and Lyons (1997). P-values are in parentheses below the estimated coefficients.
(1) (2)
Intercept �0.6538 �1.0739
(0.1051) (0.0184)
Officers’ and directors’ holdings 0.2037 0.3457
(0.5664) (0.3783)
Institutional holdings 0.9822 0.8527
(0.0046) (0.0311)
Firm size �0.0528 �0.0417
(0.1574) (0.3237)
Book-to-market ratio �0.3344 �0.2925
(0.0429) (0.1164)
Leverage �0.0153 �0.0158
(0.3142) (0.3386)
Prior one-year stock performance 0.3590 0.3189
(0.0017) (0.0159)
Prior one-year sales growth 0.0814 0.1195
(0.5043) (0.3407)
Likelihood ratio test statistic 33.261 22.342
(P-value) (0.0001) (0.0022)
A.G. Morgan, A.B. Poulsen / Journal of Financial Economics 62 (2001) 489–523 509
stock-based compensation proposal on a specific proxy statement and zerootherwise. Executive or nonemployee director proposals appear on 634 of theballots. We include the ballots with other nonstandard items in the reportedregressions, explaining the increase in the number of compensation proposalsrelative to the wealth-effect estimates. There were no significant differenceswhen they were excluded. Regression one contains executive and nonexecutivedirector compensation-related resolutions; regression two excludes none-mployee director proposals (number of executive compensation plan propo-sals=439). We do not consider plans with employee beneficiaries in theanalysis due to the small number of plans and the insignificant announcementeffects related to them.
We consider three general categories of firm characteristics that might beimportant in determining whether the company would introduce a perfor-mance compensation plan: governance characteristics, financial variables, andrecent firm performance. Core et al. (1999) find evidence of the importance ofthe governance structure. In their examination of compensation plans in place,they find that the greater the agency problems within the firm, the greater thelevel of executive compensation. Our measure of officer and directors’ holdingsis gathered from the relevant proxy statement and is recorded as the percentageof total voting power held; affiliated familial or corporate holdings are includedin these numbers. The average level of officer and directors’ holdings is 9.4%(median=2.8%) in the 1995 proposing firms and 7.8% (median=2.1%) in the1995 non-proposing firms. Institutional ownership, measured as the percentheld according to the December volume of Spectrum 3 for the year precedingthe meeting date, averages close to 60% at year-end 1994 for both theproposers and the non-proposers.
The logistic regressions (Table 7) provide evidence supporting theimportance of the alignment of managerial incentives with the adoption ofcompensation plans. The probability of proposing compensation plansincreases significantly with higher institutional holdings, while insider owner-ship has an insignificant impact on proposal probability. The positivecoefficient on institutional holdings and the insignificance of the measuresof insider control suggest that the compensation schemes are consistentwith shareholder wealth maximization in that insiders are not able to imposethese plans without support from institutions. Since institutional shareholdersare more active than typical shareholders, the greater presence of these partiesfor the subset sponsoring compensation plans is consistent with the premisethat pay-for-performance compensation plans help to align managerialincentives. Also, it does not seem that insiders with relatively higher stakesin the firm are able to implement the compensation schemes more easily thanother management teams. (Kole, 1997, also found no significant difference ininsider ownership among firms with and without stock-based compensationplans.)
A.G. Morgan, A.B. Poulsen / Journal of Financial Economics 62 (2001) 489–523510
We examine the relation between several variables that describe the financialcharacteristics of the firm, including total assets, the book-to-market ratio ofthe firm, and the firm’s leverage, and the proposal of stock-based compensationplans. Firm size, whether measured as total assets or market capitalization ofthe firm, is large, as we are focusing on the S&P 500. The average value ofassets for the proposing sample is $13.7 billion (median=$3.8 billion) andmarket capitalization averages $6.1 billion (median=$3.4 billion) based onyear-end 1994 data. The non-proposers are similar; average value of assets is$17.0 billion and average market capitalization is $6.2 billion. Firm size,measured as the logarithm of total assets, is not a significant explanatoryvariable in the logistic regressions (nor is market capitalization, as determinedin regressions not included here). Kole (1997) notes that large firms are morelikely to ‘‘pioneer’’ innovative compensation schemes. She also finds, however,little evidence that firm size significantly impacts the use of pay-for-performance plans. The lack of significance for firm size in determining planintroduction in our sample may suggest that pay-for-performance is no longeran innovative firm characteristic.
Leverage of the firms, defined as the book value of debt over the book valueof equity, is not a significant explanatory variable in the logistic regression.Yermack (1995) suggests that leverage can serve as a measure of agency costsof adopting firms in that debt holders may prefer to weaken the link betweenmanagerial wealth and share price to protect their own position. He also findsno significant difference across firms, however.
The book-to-market ratio of the firm is used to measure the growthopportunities of the firm. The lower this ratio, the more growth or investmentopportunities the firm has, and the more the firm may benefit fromcompensation schemes that tie compensation to performance. Such schemesprovide managers with additional incentives in firms where such incentives areespecially valuable. While Yermack (1995) did not find that pay sensitivity washigher in firms with lower book-to-market ratios, Smith and Watts (1992),Gaver and Gaver (1993), and Kole (1997) do find that firms with greatergrowth opportunities are more likely to have stock option plans or otherperformance-based compensation schemes. The average (median) book-to-market ratio for firms in our sample is 0.46 (0.42) based on year-end 1994 datafor firms proposing in 1995 and 0.54 (0.50) for those not proposing stock-basedcompensation plans in 1995. In the regression analysis, we find significantlylower book-to-market ratios for adopting firms, consistent with the agency costexplanation that managers are more likely to be compensated with equity whenit is difficult to value future growth and to ensure that managers takeappropriate actions in the future. [We use book-to-market rather than market-to-book ratios in our study because several companies with low book valuesresulted in extremely large market-to-book ratios. This usage is consistent withSmith and Watts (1992).]
A.G. Morgan, A.B. Poulsen / Journal of Financial Economics 62 (2001) 489–523 511
The proposing and non-proposing firms also differ on performance andgrowth characteristics, as seen in the logistic regressions in Table 7. Wecompute the one-year stock-price performance and sales growth for the firmsfor the year preceding the proposal. Stock-price performance is found bycomparing the stock performance of the firm to that of a matched control firmfor the year prior to the compensation proposal, using a buy-and-hold strategy.We use the Barber and Lyons (1997) methodology to assign control firms forthe purpose of determining stock-price performance.8 Sales growth iscomputed as the percent change from the previous year. We find that theproposing firms have significantly higher one-year prior stock-price perfor-mance. However, growth in sales is not significant in explaining plan proposals.Because we are looking at the introduction, or the amendment, of managementcompensation plans, the significance of prior-year stock performance mayprovide insights about the timing of pay-for-performance compensation inaddition to being consistent with the proposal of the plans reflecting agencyconsiderations in high-growth firms. The fact that the plans follow periods ofrelatively strong performance may suggest that managers view this as a timewhen their compensation would especially benefit from the link to perfor-mance.
Overall, our results suggest that pay-for-performance compensation plansare proposed in those firms where they would be most beneficial toshareholders. Higher institutional holdings and more growth options in thefirm are associated with greater probability that compensation plans will beproposed. In addition, firms with good stock-price performance are more likelyto introduce performance compensation. These systematic relations supportthe premise that stock-based compensation plans benefit shareholders.
4.3. Cross-sectional variation in perception of performance plans
Given the substantial differences in plans and firms, we consider whethershareholder approval of the plans varies based on those differences. Weobserve variation in shareholder approval through two indicators, theshareholder wealth effect at the announcement of the performance plan, andthe percentage of votes approving the plan at the shareholder meeting. Wemeasure how these indicators vary cross-sectionally with dilution levels, votingrecommendations and other plan and firm characteristics.
In Table 8, we present summary data on the percent-for vote for theproposals based on several categories. The data are based on the 793 proposals
8Two other performance measures, cumulative abnormal returns calculated through the use of a
control firm and buy and hold returns calculated against the combined NYSE/AMEX/NASDAQ
index, are also used in this study. All three performance measures produce similar results. Thus,
only the buy and hold returns calculated using a control firm are displayed in these tables.
A.G. Morgan, A.B. Poulsen / Journal of Financial Economics 62 (2001) 489–523512
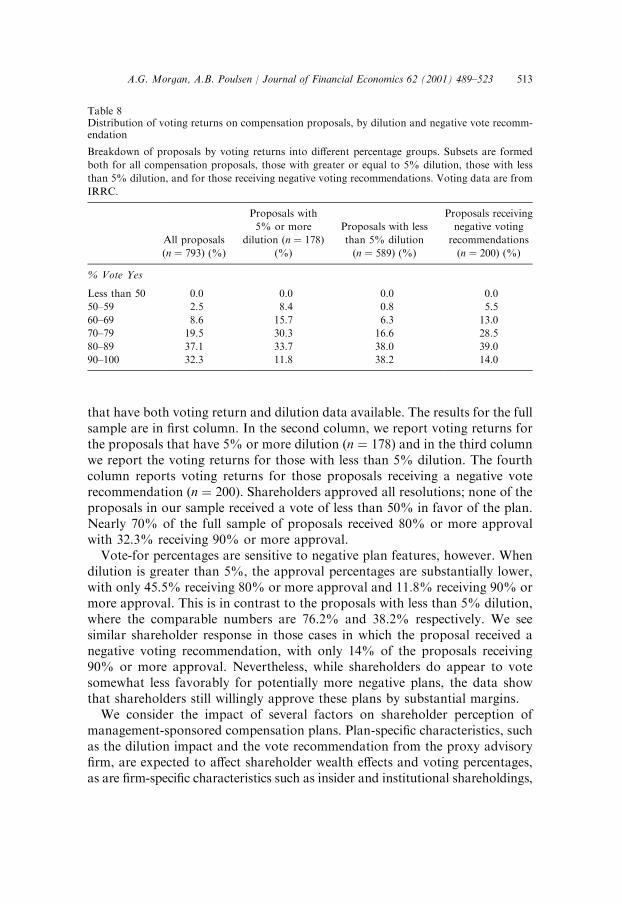
that have both voting return and dilution data available. The results for the fullsample are in first column. In the second column, we report voting returns forthe proposals that have 5% or more dilution (n ¼ 178) and in the third columnwe report the voting returns for those with less than 5% dilution. The fourthcolumn reports voting returns for those proposals receiving a negative voterecommendation (n ¼ 200). Shareholders approved all resolutions; none of theproposals in our sample received a vote of less than 50% in favor of the plan.Nearly 70% of the full sample of proposals received 80% or more approvalwith 32.3% receiving 90% or more approval.
Vote-for percentages are sensitive to negative plan features, however. Whendilution is greater than 5%, the approval percentages are substantially lower,with only 45.5% receiving 80% or more approval and 11.8% receiving 90% ormore approval. This is in contrast to the proposals with less than 5% dilution,where the comparable numbers are 76.2% and 38.2% respectively. We seesimilar shareholder response in those cases in which the proposal received anegative voting recommendation, with only 14% of the proposals receiving90% or more approval. Nevertheless, while shareholders do appear to votesomewhat less favorably for potentially more negative plans, the data showthat shareholders still willingly approve these plans by substantial margins.
We consider the impact of several factors on shareholder perception ofmanagement-sponsored compensation plans. Plan-specific characteristics, suchas the dilution impact and the vote recommendation from the proxy advisoryfirm, are expected to affect shareholder wealth effects and voting percentages,as are firm-specific characteristics such as insider and institutional shareholdings,
Table 8Distribution of voting returns on compensation proposals, by dilution and negative vote recomm-endation
Breakdown of proposals by voting returns into different percentage groups. Subsets are formed
both for all compensation proposals, those with greater or equal to 5% dilution, those with less
than 5% dilution, and for those receiving negative voting recommendations. Voting data are from
IRRC.
All proposals
(n ¼ 793) (%)
Proposals with
5% or more
dilution (n ¼ 178)
(%)
Proposals with less
than 5% dilution
(n ¼ 589) (%)
Proposals receiving
negative voting
recommendations
(n ¼ 200) (%)
% Vote Yes
Less than 50 0.0 0.0 0.0 0.0
50–59 2.5 8.4 0.8 5.5
60–69 8.6 15.7 6.3 13.0
70–79 19.5 30.3 16.6 28.5
80–89 37.1 33.7 38.0 39.0
90–100 32.3 11.8 38.2 14.0
A.G. Morgan, A.B. Poulsen / Journal of Financial Economics 62 (2001) 489–523 513
firm size, firm performance and the book-to-market ratios. InTable 9, we report wealth effects for the firms in our sample differentiated bythese characteristics. In general, we compare higher to lower levels of thedistinguishing variables, where the distinction is set at the median value, theexceptions being the dilution levels (5% or greater compared to less than 5%)and insider holdings (5% or greater compared to less than 5%). We performedsimilar analyses comparing the top quartile or the bottom quartile to theremaining observations, with no differences from the results presented here.Regression analysis of the wealth effects is unsuccessful at identifyingsignificant relations beyond confirming those reported here in the univariatetests. We test the impact of these factors on voting with regression analysis, asreported in Table 10. The dependent variable is the percent of positive votesreceived and the explanatory variables are included as their actual values ratherthan as indicator variables.9
The measures of negative plan characteristics support the hypothesis thatinstitutions and other shareholders consider the specific plan features indetermining their approval of the proposals. In Table 9, those plans with lessthan 5% dilution have positive and significant wealth effects (0.46%, t ¼ 2:70)while those plans with more than 5% dilution have wealth effects that areinsignificantly different from zero. Since the higher dilution plans areconcentrated in the executive compensation proposals, we also consider thissubset of 440 proposals. Again, those plans with less than 5% dilution areassociated with significantly positive wealth effects (0.62%), while high dilutionplans are associated with wealth results that are not significantly different fromzero. While the wealth effects are not significantly different from each other, thepattern suggests that shareholders are conscious of the dilution resulting fromthe plans and are less willing to support high levels of dilution. Importantly, byconsidering the executive plans alone, we show that shareholders considerdilution in addition to the identity of the plan beneficiary in assessing the valueof the plan.
Surprisingly, while negative vote recommendations are associated with highdilution, the wealth effects differentiated by the vote recommendations are notsignificantly different from each other, with both sets having wealth effects thatare positive and significantly different from zero.10 However, when we considerthe regressions explaining the vote-for percentages, we confirm that both
9Though we compare the wealth effects and the vote-for percentages to the same set of
explanatory variables, we do not find a significant relation between the wealth effects and the vote-
for percentages in either univariate or multivariate analysis.10We also consider whether the reasons for the negative vote recommendations have explanatory
power in determining the wealth effects related to the plan announcements. Whether it is because
the categories are limited in numbers of observations or another reason, we do not identify any
significant differences in the results beyond those already reported associated with dilution
measures.
A.G. Morgan, A.B. Poulsen / Journal of Financial Economics 62 (2001) 489–523514
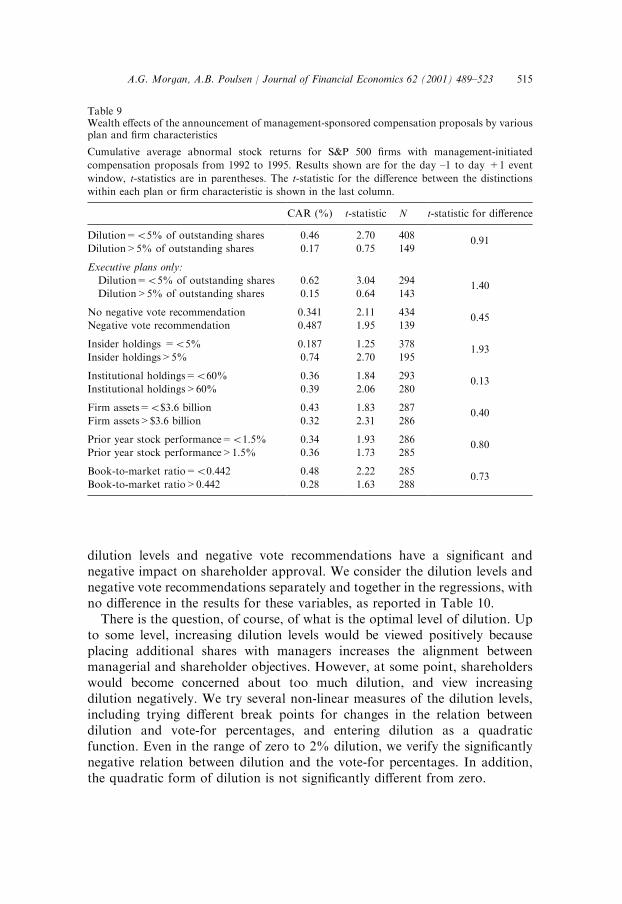
dilution levels and negative vote recommendations have a significant andnegative impact on shareholder approval. We consider the dilution levels andnegative vote recommendations separately and together in the regressions, withno difference in the results for these variables, as reported in Table 10.
There is the question, of course, of what is the optimal level of dilution. Upto some level, increasing dilution levels would be viewed positively becauseplacing additional shares with managers increases the alignment betweenmanagerial and shareholder objectives. However, at some point, shareholderswould become concerned about too much dilution, and view increasingdilution negatively. We try several non-linear measures of the dilution levels,including trying different break points for changes in the relation betweendilution and vote-for percentages, and entering dilution as a quadraticfunction. Even in the range of zero to 2% dilution, we verify the significantlynegative relation between dilution and the vote-for percentages. In addition,the quadratic form of dilution is not significantly different from zero.
Table 9Wealth effects of the announcement of management-sponsored compensation proposals by variousplan and firm characteristics
Cumulative average abnormal stock returns for S&P 500 firms with management-initiated
compensation proposals from 1992 to 1995. Results shown are for the day –1 to day +1 event
window, t-statistics are in parentheses. The t-statistic for the difference between the distinctions
within each plan or firm characteristic is shown in the last column.
CAR (%) t-statistic N t-statistic for difference
Dilution=o5% of outstanding shares 0.46 2.70 4080.91
Dilution>5% of outstanding shares 0.17 0.75 149
Executive plans only:
Dilution=o5% of outstanding shares 0.62 3.04 2941.40
Dilution>5% of outstanding shares 0.15 0.64 143
No negative vote recommendation 0.341 2.11 4340.45
Negative vote recommendation 0.487 1.95 139
Insider holdings =o5% 0.187 1.25 3781.93
Insider holdings>5% 0.74 2.70 195
Institutional holdings=o60% 0.36 1.84 2930.13
Institutional holdings>60% 0.39 2.06 280
Firm assets=o$3.6 billion 0.43 1.83 2870.40
Firm assets>$3.6 billion 0.32 2.31 286
Prior year stock performance=o1.5% 0.34 1.93 2860.80
Prior year stock performance>1.5% 0.36 1.73 285
Book-to-market ratio=o0.442 0.48 2.22 2850.73
Book-to-market ratio>0.442 0.28 1.63 288
A.G. Morgan, A.B. Poulsen / Journal of Financial Economics 62 (2001) 489–523 515
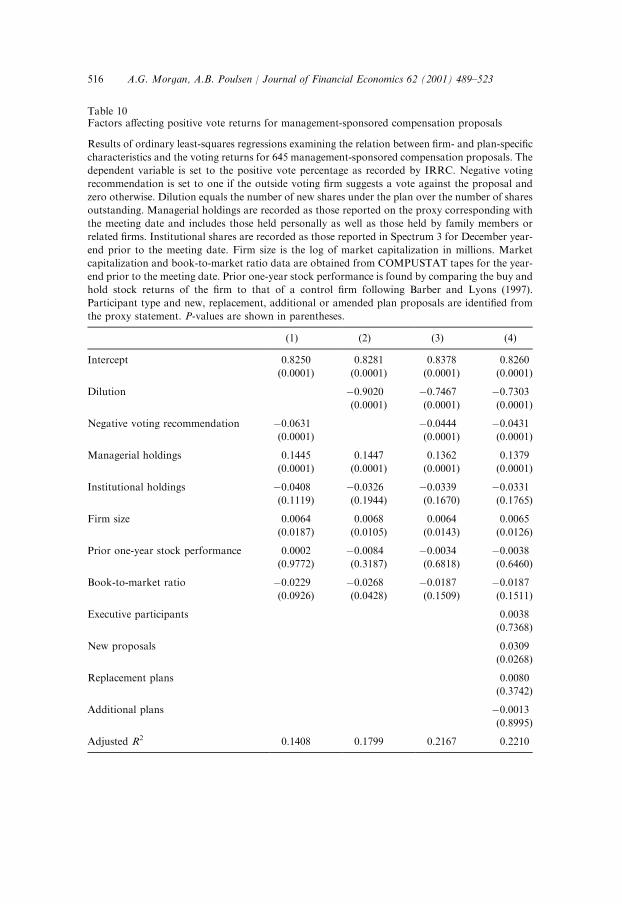
Table 10Factors affecting positive vote returns for management-sponsored compensation proposals
Results of ordinary least-squares regressions examining the relation between firm- and plan-specific
characteristics and the voting returns for 645 management-sponsored compensation proposals. The
dependent variable is set to the positive vote percentage as recorded by IRRC. Negative voting
recommendation is set to one if the outside voting firm suggests a vote against the proposal and
zero otherwise. Dilution equals the number of new shares under the plan over the number of shares
outstanding. Managerial holdings are recorded as those reported on the proxy corresponding with
the meeting date and includes those held personally as well as those held by family members or
related firms. Institutional shares are recorded as those reported in Spectrum 3 for December year-
end prior to the meeting date. Firm size is the log of market capitalization in millions. Market
capitalization and book-to-market ratio data are obtained from COMPUSTAT tapes for the year-
end prior to the meeting date. Prior one-year stock performance is found by comparing the buy and
hold stock returns of the firm to that of a control firm following Barber and Lyons (1997).
Participant type and new, replacement, additional or amended plan proposals are identified from
the proxy statement. P-values are shown in parentheses.
(1) (2) (3) (4)
Intercept ( 0.8250 ( 0.8281 ( 0.8378 ( 0.8260
�(0.0001) �(0.0001) �(0.0001) �(0.0001)
Dilution �0.9020 �0.7467 �0.7303
�(0.0001) �(0.0001) �(0.0001)
Negative voting recommendation �0.0631 �0.0444 �0.0431
�(0.0001) �(0.0001) �(0.0001)
Managerial holdings ( 0.1445 ( 0.1447 ( 0.1362 ( 0.1379
�(0.0001) �(0.0001) �(0.0001) �(0.0001)
Institutional holdings �0.0408 �0.0326 �0.0339 �0.0331
�(0.1119) �(0.1944) �(0.1670) �(0.1765)
Firm size ( 0.0064 ( 0.0068 ( 0.0064 �0.0065
�(0.0187) �(0.0105) �(0.0143) �(0.0126)
Prior one-year stock performance ( 0.0002 �0.0084 �0.0034 �0.0038
�(0.9772) �(0.3187) �(0.6818) �(0.6460)
Book-to-market ratio �0.0229 �0.0268 �0.0187 �0.0187
�(0.0926) �(0.0428) �(0.1509) �(0.1511)
Executive participants �0.0038
�(0.7368)
New proposals ( 0.0309
�(0.0268)
Replacement plans ( 0.0080
�(0.3742)
Additional plans �0.0013
�(0.8995)
Adjusted R2 ( 0.1408 ( 0.1799 ( 0.2167 ( 0.2210
A.G. Morgan, A.B. Poulsen / Journal of Financial Economics 62 (2001) 489–523516
We find that the wealth effects and vote-for percentages are also related tothe ownership structure of the firm. Not surprisingly, since officers anddirectors presumably vote for plans that increase their own compensation,proposals receive higher voting percentages when officer and director holdingsin the firm are larger.11 However, we also find that the wealth effects aresignificantly higher for firms where insider holdings are 5% or greater (0.74%vs. 0.18%). The same significant relation is observed if we compare firms with10% or greater insider holdings to those with less than 10%. These results areconsistent with shareholders believing that managers will make bettercompensation proposals when their personal stake is greater. We find littleevidence that the wealth effects or voting percentages are significantly affectedby institutional holdings, suggesting that institutional investors are notnecessarily for or against stock-based compensation proposals on an overallbasis and consider specific plan characteristics in plan evaluation.
Explanatory variables related to firm characteristics, including firm size,book-to-market ratio, and the prior year stock performance, also provide someimpact on the vote-for percentage. However, these characteristics do not seemto have significant impact on the shareholder wealth effects. We find that largerfirms have significantly greater support for their stock-based compensationproposals and the book-to-market ratio is marginally negatively related tovoting approval. These results are supportive of our earlier finding that pay-for-performance compensation schemes would be more likely to be viewedfavorably when the firm has more growth opportunities, as proxied throughfirm size and the book-to-market ratio.
In the last regression reported in Table 10, we include indicator variablesrelated to additional plan characteristics such as the plan beneficiary (theexcluded set is nonemployee director plans) and whether the plan is a new,replacement or additional plan (the excluded set is amended plans). Only thenew-plan indicator variable is significant, suggesting that new plans receive ahigher voting approval than revisions to existing pay-for-performancecompensation schemes.12
Overall, our wealth effects and voting results suggest that, although theseplans receive a large vote-for percent, the approval is significantly related toboth the negative features of the plan, as measured by the dilution resultingfrom the plan and negative vote recommendations, and the positive features of
11When we recompute the vote-for percent on the proposals excluding the holdings of the
insiders (assuming they vote for the plans), the insider-holdings variable is insignificantly different
from zero in the voting regressions.12We also consider whether the plan is the first observation for a firm in our sample or a second
or later plan in the wealth effect and voting analysis. We find no significant differences based on the
timing of the plan. Of course, we do not know whether previous plans were announced outside of
the time period of our sample. In addition, the indicator variables of whether the plans are new,
replacement, additions or amendments measure similar considerations.
A.G. Morgan, A.B. Poulsen / Journal of Financial Economics 62 (2001) 489–523 517
the plan, as measured by their appropriateness to the firm’s assets and growthcharacteristics. Even though these plans are, on average, viewed positively byshareholders as measured by wealth effects and overall approval rates, itappears that investors are providing information to firms about theacceptability of different plan features.
4.4. Post-performance
The evidence presented to this point, showing systematic relations betweenshareholder approval of the plans and firm and plan characteristics, isconsistent with the view that stock-based compensation plans further alignmanagerial incentives. There is also the possibility, however, that the planproposal is related to management’s inside information about the firm’sprospects. Management might propose pay for performance before a period ofexpected good performance, and the announcement of the plan signals themarket about management’s expectations. We specifically consider perfor-mance in this section to further understand the timing of the pay-for-performance compensation plans. We compare prior-year and post-yearperformance for proposing and non-proposing firms in Tables 11 and 12. InTable 11, we compare the sample of firms not proposing a compensation planon a specific ballot to the sample of firms that are proposing. Because eachproxy statement is considered a separate observation, firms may appear in bothsamples depending on whether they proposed a plan on any specific proxystatement. Again, we assume that any overlap between the groups would biasus against finding significant differences between proposers and non-proposers.In Table 12, we look at same-firm performance before and after theannouncement of the performance plan.
To test the relation between plan submission and post-implementationperformance, we perform univariate analyses of financial performancevariables. We report here the results from the three methods of calculatingstock performance. We calculate stock performance as (1) the buy and holdreturn differences for the firm and its control, (2) the cumulative abnormalreturn for the firm relative to its control, and (3) the buy and hold returndifference for the firm and the market index (the value-weighted, combinedNYSE/AMEX/NASDAQ index). Control firms are chosen based on size andbook-to-market ratio, as in Barber and Lyon (1997). In addition, we examineseveral performance measures based on accounting data, including earnings,sales (both deflated by assets), and the percent change in assets and in sales.These variables are found on the COMPUSTAT tapes for the year-end prior toand year-end following the meeting date.
The first column of Table 11 reports these measures of performance for firmsthat had no compensation proposal on their proxy ballot in a given year. Thesecond column reports the same data for companies with compensation
A.G. Morgan, A.B. Poulsen / Journal of Financial Economics 62 (2001) 489–523518
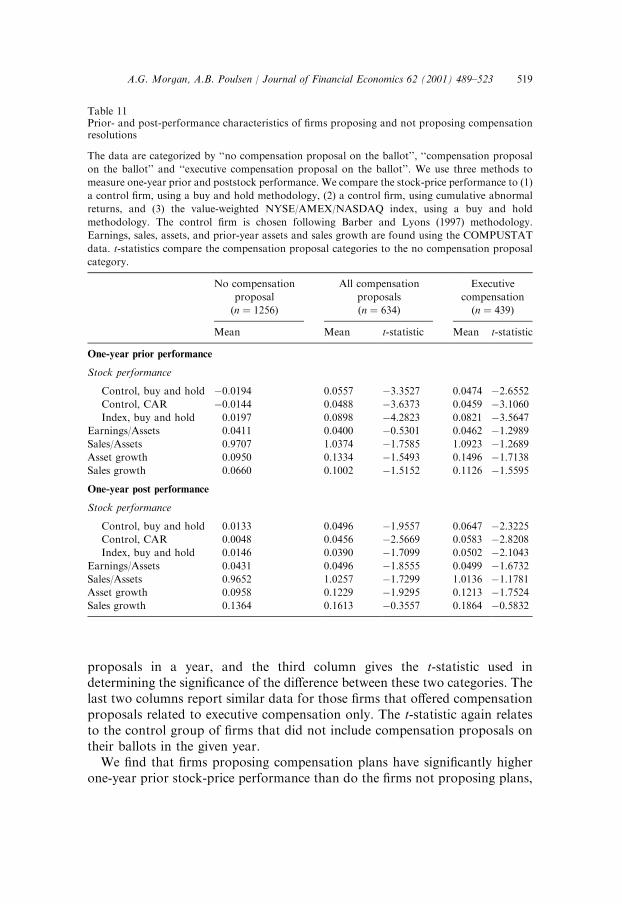
proposals in a year, and the third column gives the t-statistic used indetermining the significance of the difference between these two categories. Thelast two columns report similar data for those firms that offered compensationproposals related to executive compensation only. The t-statistic again relatesto the control group of firms that did not include compensation proposals ontheir ballots in the given year.
We find that firms proposing compensation plans have significantly higherone-year prior stock-price performance than do the firms not proposing plans,
Table 11Prior- and post-performance characteristics of firms proposing and not proposing compensationresolutions
The data are categorized by ‘‘no compensation proposal on the ballot’’, ‘‘compensation proposal
on the ballot’’ and ‘‘executive compensation proposal on the ballot’’. We use three methods to
measure one-year prior and poststock performance. We compare the stock-price performance to (1)
a control firm, using a buy and hold methodology, (2) a control firm, using cumulative abnormal
returns, and (3) the value-weighted NYSE/AMEX/NASDAQ index, using a buy and hold
methodology. The control firm is chosen following Barber and Lyons (1997) methodology.
Earnings, sales, assets, and prior-year assets and sales growth are found using the COMPUSTAT
data. t-statistics compare the compensation proposal categories to the no compensation proposal
category.
No compensation
proposal
(n ¼ 1256)
All compensation
proposals
(n ¼ 634)
Executive
compensation
(n ¼ 439)
Mean Mean t-statistic Mean t-statistic
One-year prior performance
Stock performance
Control, buy and hold �0.0194 0.0557 �3.3527 0.0474 �2.6552
Control, CAR �0.0144 0.0488 �3.6373 0.0459 �3.1060
Index, buy and hold 0.0197 0.0898 �4.2823 0.0821 �3.5647
Earnings/Assets 0.0411 0.0400 �0.5301 0.0462 �1.2989
Sales/Assets 0.9707 1.0374 �1.7585 1.0923 �1.2689
Asset growth 0.0950 0.1334 �1.5493 0.1496 �1.7138
Sales growth 0.0660 0.1002 �1.5152 0.1126 �1.5595
One-year post performance
Stock performance
Control, buy and hold 0.0133 0.0496 �1.9557 0.0647 �2.3225
Control, CAR 0.0048 0.0456 �2.5669 0.0583 �2.8208
Index, buy and hold 0.0146 0.0390 �1.7099 0.0502 �2.1043
Earnings/Assets 0.0431 0.0496 �1.8555 0.0499 �1.6732
Sales/Assets 0.9652 1.0257 �1.7299 1.0136 �1.1781
Asset growth 0.0958 0.1229 �1.9295 0.1213 �1.7524
Sales growth 0.1364 0.1613 �0.3557 0.1864 �0.5832
A.G. Morgan, A.B. Poulsen / Journal of Financial Economics 62 (2001) 489–523 519
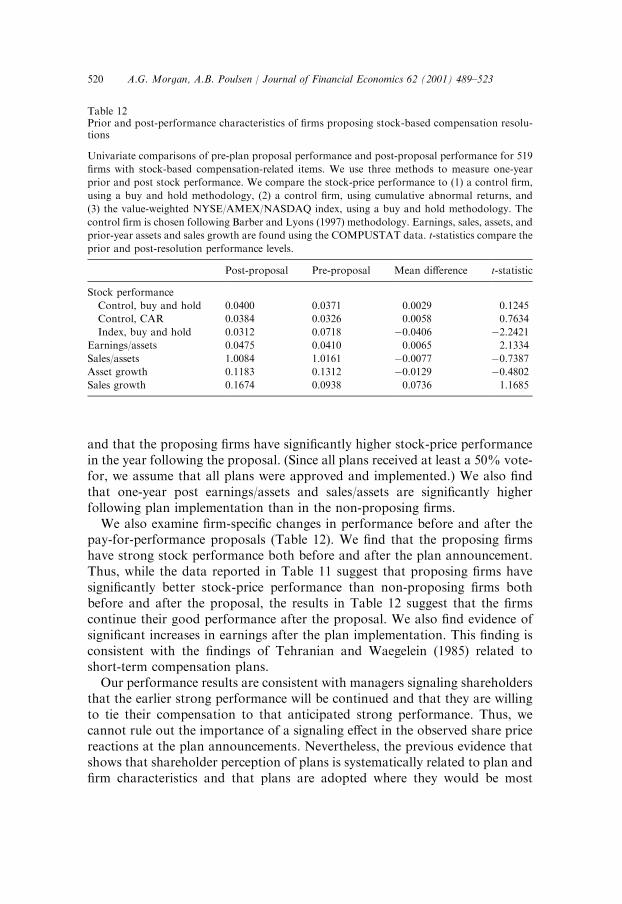
and that the proposing firms have significantly higher stock-price performancein the year following the proposal. (Since all plans received at least a 50% vote-for, we assume that all plans were approved and implemented.) We also findthat one-year post earnings/assets and sales/assets are significantly higherfollowing plan implementation than in the non-proposing firms.
We also examine firm-specific changes in performance before and after thepay-for-performance proposals (Table 12). We find that the proposing firmshave strong stock performance both before and after the plan announcement.Thus, while the data reported in Table 11 suggest that proposing firms havesignificantly better stock-price performance than non-proposing firms bothbefore and after the proposal, the results in Table 12 suggest that the firmscontinue their good performance after the proposal. We also find evidence ofsignificant increases in earnings after the plan implementation. This finding isconsistent with the findings of Tehranian and Waegelein (1985) related toshort-term compensation plans.
Our performance results are consistent with managers signaling shareholdersthat the earlier strong performance will be continued and that they are willingto tie their compensation to that anticipated strong performance. Thus, wecannot rule out the importance of a signaling effect in the observed share pricereactions at the plan announcements. Nevertheless, the previous evidence thatshows that shareholder perception of plans is systematically related to plan andfirm characteristics and that plans are adopted where they would be most
Table 12Prior and post-performance characteristics of firms proposing stock-based compensation resolu-tions
Univariate comparisons of pre-plan proposal performance and post-proposal performance for 519
firms with stock-based compensation-related items. We use three methods to measure one-year
prior and post stock performance. We compare the stock-price performance to (1) a control firm,
using a buy and hold methodology, (2) a control firm, using cumulative abnormal returns, and
(3) the value-weighted NYSE/AMEX/NASDAQ index, using a buy and hold methodology. The
control firm is chosen following Barber and Lyons (1997) methodology. Earnings, sales, assets, and
prior-year assets and sales growth are found using the COMPUSTAT data. t-statistics compare the
prior and post-resolution performance levels.
Post-proposal Pre-proposal Mean difference t-statistic
Stock performance
Control, buy and hold 0.0400 0.0371 0.0029 0.1245
Control, CAR 0.0384 0.0326 0.0058 0.7634
Index, buy and hold 0.0312 0.0718 �0.0406 �2.2421
Earnings/assets 0.0475 0.0410 0.0065 2.1334
Sales/assets 1.0084 1.0161 �0.0077 �0.7387
Asset growth 0.1183 0.1312 �0.0129 �0.4802
Sales growth 0.1674 0.0938 0.0736 1.1685
A.G. Morgan, A.B. Poulsen / Journal of Financial Economics 62 (2001) 489–523520
appropriate suggests that the signaling effect is not the only reason for thepositive reaction to plan announcement.
5. Conclusions
This study examines managerial proposals to tie compensation toperformance through incentive pay plans. From almost 2000 proxy statementsfor the S&P 500 firms from 1992 through 1995, we identify 958 compensationproposals appearing on 810 ballots. Most of these proposals target executives,although nonemployee directors and employees are also frequent beneficiaries.Our goal is to gain further insight into why managers propose pay-for-performance compensation plans and how shareholders view these plans andwhy.
We investigate several questions. First, do the wealth effects associated withthese proposals indicate that they are viewed as good news for shareholders?While agency theory frequently cites incentive compensation schemes as ameans of aligning managerial incentives with shareholder wealth, it is alsopossible that the specific plans proposed give managers too much flexibility inrewarding themselves. Overall, however, we find that the plan proposals areaccompanied by significant increases in shareholder wealth, especially forthose plans that target executives or top management. Second, we questionwhether the firms that propose compensation plans are the ones that couldmost benefit from them based on agency cost considerations. Drawing fromearlier work, we use logistic regressions to consider the differences incharacteristics between proposing and non-proposing firms. We find thatproposing firms are more likely to have lower book-to-market ratios in the yearpreceding the announcement, consistent with the importance of asset type indetermining the inclusion of pay-for-performance features. We also find thatfirms with higher institutional holdings are more likely to propose performanceplans. These results again support the premise that performance plans arebeneficial to shareholders and that they are proposed where they do themost good.
Third, we examine shareholder perception of the plans through analysis ofthe wealth effects at the announcement of the pay-for-performance compensa-tion scheme and the percentage of shares voting for the proposal. We considerwhether the items receive more support in those firms where they seem to bemost appropriate and where they have fewer negative features. We find thatshareholders have a more positive perspective on the plans in larger firms andin firms that have lower book-to-market ratios. However, negative planfeatures such as higher dilution ratios and negative vote recommendationsresult in less positive wealth effects and significantly lower approvalpercentages.
A.G. Morgan, A.B. Poulsen / Journal of Financial Economics 62 (2001) 489–523 521
Our examination of performance following plan implementation appears tosupport the premise that plans are introduced in firms with strongperformance. We find that firms proposing pay-for-performance plans havebetter stock-price performance than non-proposing firms do in the year beforeand the year after the proposal. In considering same-firm performance, we findthat the firms maintain strong stock-price performance and that accountingearnings increase significantly after plan implementation. Thus, the compensa-tion plans seem to be concentrated in strong firms that continue to performwell, rather than in firms that ‘‘turned things around’’ as a result of thecompensation schemes. While the performance results are consistent with thewealth effects being related to a signaling of expected good performance, ourother results suggest that signaling is not the only explanation for the favorableshareholder wealth effects at plan annoucements.
Overall, the evidence suggests that pay-for-performance schemes arebeneficial to shareholders. Shareholders gain at the announcement of theplans, especially when the plans are directed to pay for the top executives of thefirm and when dilution is not excessive. Proposing firms seem to be those firmsthat can most benefit from the plans, given their asset type and agencyconsiderations. In addition, firms with more potential agency costs have thehighest approval ratings for the plans that can help to mitigate those agencyproblems. The dramatic increase in the 1980s and 1990s in the sensitivity ofCEO pay for performance verified by Hall and Liebman (1998) seems topredict well for continued improvements in aligning managerial incentives withshareholder wealth.
References
Baker, G., Jensen, M., Murphy, K., 1988. Compensation and incentives: practice vs. theory.
Journal of Finance 43, 593–616.
Barber, B., Lyon, J., 1997. Detecting long-run abnormal stock returns: the empirical power and
specification of test statistics. Journal of Financial Economics 43, 341–372.
Bethel, J., Gillan, S., 2000. The impact of broker votes on shareholder voting and proposal passage.
Working paper, Babson College and TIAA-CREF Institute, 2000.
Brickley, J., Bhagat, S., Lease, R., 1985. The impact of long-range managerial compensation plans
on shareholder wealth. Journal of Accounting and Economics 7, 115–129.
Brickley, J., 1986. Interpreting common stock returns around proxy statement disclosures and
annual shareholder meetings. Journal of Financial and Quantitative Analysis 21, 343–349.
Brown, S., Warner, J., 1980. Measuring security price performance. Journal of Financial
Economics 8, 205–258.
Brown, S., Warner, J., 1985. Using daily stock returns in the case of event studies. Journal of
Financial Economics 14, 3–31.
Campbell, C., Wasley, C., 1999. Stock-based incentive contracts and managerial performance: the
case of Ralston Purina Company. Journal of Financial Economics 51, 195–217.
Core, J., Holthausen, R., Larcker, D., 1999. Corporate governance, chief executive officer
compensation, and firm performance. Journal of Financial Economics 51, 371–406.
A.G. Morgan, A.B. Poulsen / Journal of Financial Economics 62 (2001) 489–523522
Gaver, J., Gaver, K., 1993. Additional evidence on the association between the investment
opportunity set and corporate financing, dividend and compensation policies. Journal of
Accounting and Economics 16, 125–160.
Hall, B., 2000. What you need to know about stock options. Harvard Business Review 78, 121–129.
Hall, B., Liebman, J., 1998. Are CEOs really paid like bureaucrats? Quarterly Journal of
Economics 113, 653–691.
Hall, B., Murphy, K., 2000. Stock options for undiversified executives. Working paper 8052,
NBER.
Jarrell, G., Brickley, J., Netter, J., 1988. The market for corporate control: the empirical evidence
since 1980. Journal of Economic Perspectives 2, 49–68.
Jarrell, G., Poulsen, A., 1987. Shark repellents and stock prices: the effects of antitakeover
amendments since 1980. Journal of Financial Economics 19, 127–168.
Jensen, M., Murphy, K., 1990. Performance pay and top-management incentives. Journal of
Political Economy 98, 225–284.
Kole, S., 1997. The complexity of compensation contracts. Journal of Financial Economics 43,
79–104.
Lambert, R., Larcker, D., 1987. An analysis of the use of accounting and market measures of
performance in executive compensation contracts. Journal of Accounting Research 25, 85–129.
Meulbroek, L., 2000. The efficiency of equity-linked compensation: understanding the full cost of
awarding executive stock options. Working paper 00-056, Harvard Business School.
Practising Law Institute, 1997. The SEC Speaks in 1997. Practising Law Institute, New York, NY.
Rappaport, A., 1999. New thinking on how to link executive pay with performance. Harvard
Business Review 77, 91–105.
Smith, C., Watts, R., 1992. The investment opportunity set and corporate financing, dividend and
compensation policies. Journal of Financial Economics 32, 263–292.
Stern Stewart Roundtable, 1992. Management incentive compensation and shareholder value. In:
Chew Jr., D. (Ed.), Discussing the Revolution in Corporate Finance. Blackwell Business,
Malden, MA, pp. 316–336.
Tehranian, H., Waegelein, J., 1985. Market reaction to short-term executive compensation plan
adoption. Journal of Accounting and Economics 7, 131–144.
TIAA-CREF, 2000. TIAA-CREF Policy Statement on Corporate Governance, http://www4.
tiaa-cref.org/libra/governance/index.html.
Wagner, R., Wagner, C., 1997. Recent developments in executive, director, and employee stock
compensation plans: new concerns for corporate directors. Stanford Journal of Law, Business,
and Finance 3, 5–29.
Yermack, D., 1995. Do corporations award CEO stock options effectively? Journal of Financial
Economics 39, 237–269.
Yermack, D., 1997. Good timing: CEO stock option awards and company news announcements.
Journal of Finance 52, 449–476.
A.G. Morgan, A.B. Poulsen / Journal of Financial Economics 62 (2001) 489–523 523