Embed Size (px)
Citation preview

Linking Energy Efficiency to Economic
Productivity: Recommendations for Improving the
Robustness of the U.S. Economy
John A. “Skip” Laitner
July 2013
Report Number E13F
© American Council for an Energy-Efficient Economy
529 14th Street NW, Suite 600, Washington, DC 20045
Phone: (202) 507-4000 Twitter: @ACEEEDC
Facebook.com/myACEEE www.aceee.org


i
Contents
Foreword ..................................................................................................................................................... ii
Executive Summary .................................................................................................................................. iii
Current Levels of Inefficiency Constrain a More Robust Economy ..............................................iii
The Need for an Improved Tracking and Accounting of Annual Energy Flows ........................ iv
Critical Policy Steps for a More Robust Economy ............................................................................ v
Acknowledgments .................................................................................................................................... vi
1. Introduction ............................................................................................................................................ 1
2. Exploring the Long Run ........................................................................................................................ 2
3. Key Energy Concepts Necessary to Understand Productivity ........................................................ 4
3.1 It Is Exergy Not Energy that Drives Activity ............................................................................... 5
3.2 Double the Exergy to Double the Output—Less the Waste ...................................................... 6
4. Energy Efficiency and Economic Productivity .................................................................................. 6
5. Energy in the Larger Context ............................................................................................................. 20
5.1 Energy Quantities and Efficiency Opportunities ...................................................................... 20
5.2 Energy Prices, Policies, and Events ............................................................................................. 21
5.3 A Further Thought......................................................................................................................... 22
6. Recommendations for Data Analysis and Policy Implications ..................................................... 23
6.1 The Need for an Improved Energy/Exergy Accounting ......................................................... 23
6.2 Moving Ahead with More Productive Energy/Exergy Policies ............................................. 24
6.3 Suggested Next Steps in the Assessment ................................................................................... 24
References ................................................................................................................................................. 27
Appendix A: Key Population, Economic, and Energy Statistics ....................................................... 31

ii
Foreword
The evidence continues to mount. Energy efficiency is not just a way to save big money for households and business, or to achieve cost-effective and very big reductions in greenhouse gas emissions; it is also a critical resource if we are to maintain the robustness of the American economy. In short, energy (or as we shall read early in this report, more properly “exergy”) plays a more prominent role in the economic process than is generally understood. But the role of high-quality energy (exergy) as work, or as a means to enable economic activity, is badly defined and tracked within the standard national economic accounts. That becomes a two-part problem—one of quantities to deliver the right form of exergy to the right place and at the right time; and one of prices and policies that provide consumers and businesses the right signal or information about how much exergy should be used at any point in time.
This report builds on a new set of data and insights from our colleagues Dr. Robert U. (“Bob”) Ayres and Dr. Benjamin Warr. It is ACEEE’s first effort to better understand the role of exergy quantities and where the physical evidence might lead us as we promote better information, insights, and policies to bolster the vitality of the American economy. As part of this new assessment, we necessarily explore new terms and concepts—many of which are familiar to physicists and engineers, but have not generally become part of normal policy discussion. As we will read, the current system of economic accounts limits insights and understanding about: (i) the current dynamics of the productivity improvements and routine economy activity; and (ii) the mix of price signals, policies, and incentives that might redirect purposeful effort and productive investment to transform the economy into one that provides for our social and environmental well-being, and that is sustainable over the long run.
There is other work yet to be done that follows from this first effort. Among those badly needed research efforts is to examine the role of current prices and policies that have led to an underperforming American economy, and how we might provide better price and non-price policies to rebuild a more robust and resilient economy. Still, as we suggest, the evidence continues to mount. Whether the more familiar energy efficiency, or the more complete accounting of “exergy efficiency,” greater energy productivity can make an even larger contribution towards stabilizing energy prices, reducing greenhouse gas emissions, and bolstering the U.S. economy—should we choose to fully develop it. But this is hardly the last word in this investigation. The current report provides new evidence and a starting point for continued discussion. We anticipate and welcome further contributions to the effort.
iii
Executive Summary
Most observers of U.S. energy policy might think of energy efficiency as a useful investment strategy to smartly manage the growth of energy consumption. They might also see it as a cost-effective means to ease our transition into a post-carbon world. And yes, the evidence does support both of these notions. But there is also emerging evidence that demonstrates that energy—and especially the more efficient use of that energy—plays a much more critical role within the economic process than is generally understood.
Building on the work of a number of noted economists and physicists, this report explores the productive use of energy as it affects the robustness of the larger U.S. economy. It also explores the need for a more critical accounting of how work—that is, the transformation of matter into necessary goods and services—is enabled by the efficient conversion of high-quality energy called exergy. It then builds on a simple point made by management consultants Peter Drucker and W. Edwards Deming, among many others, who have said in various ways: “If you can’t measure it, you can’t manage it.” If high-quality energy or exergy flows are neither properly measured nor adequately tracked, then business and policy leaders may be misreading the real dynamics of economic activity. That, in turn, may lead to policy prescriptions that are suboptimal and that dampen the economic well-being of the United States.
CURRENT LEVELS OF INEFFICIENCY CONSTRAIN A MORE ROBUST ECONOMY
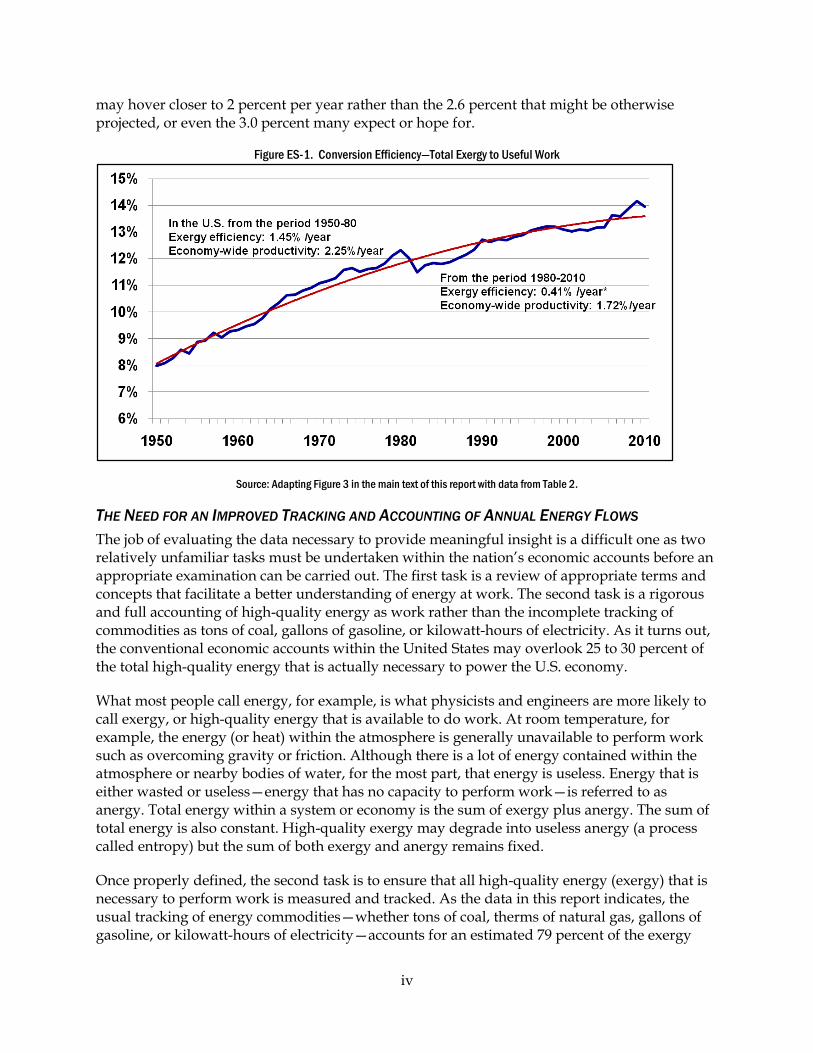
It turns out that the U.S. economy is not especially energy efficient. Of the total high-quality energy consumed to support economic activity in 2010, only 14 percent was converted into useful work. In other words, the American economy wasted 86 percent of all the energy used that year in the production of goods and services. One can easily imagine that waste of this magnitude creates an array of costs that weakens the nation’s economic and social well-being. More to the point, when properly measured the conversion efficiency has flattened in the last several years. The lagging rate of efficiency improvement may be among the critical reasons for a slumping economy. The key data are shown in Figure ES-1, on the following page.
Starting at 8 percent in 1950, the rate of exergy conversion grew four percentage points from 8 to 12 percent by 1980, averaging a 1.45 percent rate of improvement in that time. Economy-wide productivity increased an average of 2.25 percent per year during that same 30-year period. Over the next 30 years through 2010, however, the conversion efficiency grew only two percentage points or half the total in the previous three decades. The average rate of efficiency improvement fell to just 0.41 percent per year even as economy-wide productivity slumped to 1.72 percent annually.
When spread over a 30-year period, even a few tenths of a percentage point can have a very big impact on the productivity and the size of the economy. In 2010, for example, the actual size of the nation’s Gross Domestic Project (GDP) was an estimated $13,240 billion (measured in constant 2005 dollars). Had the U.S. economy maintained a productivity improvement of 2.25 rather than 1.72 percent over the period 1980 to 2010, the nation’s GDP would have grown instead to an estimated $15,510 billion (also in constant 2005 dollars). In other words, a very small change in productivity would have meant an economy that was about $2.3 trillion larger than we actually recorded in 2010. As discussed in the main text of this report, it appears the annual productivity of the economy may be weakening even further. Without investment policies that improve energy or exergy efficiency, the suggestion is that further growth in GDP
iv
may hover closer to 2 percent per year rather than the 2.6 percent that might be otherwise projected, or even the 3.0 percent many expect or hope for.
Figure ES-1. Conversion Efficiency—Total Exergy to Useful Work
Source: Adapting Figure 3 in the main text of this report with data from Table 2.
THE NEED FOR AN IMPROVED TRACKING AND ACCOUNTING OF ANNUAL ENERGY FLOWS
The job of evaluating the data necessary to provide meaningful insight is a difficult one as two relatively unfamiliar tasks must be undertaken within the nation’s economic accounts before an appropriate examination can be carried out. The first task is a review of appropriate terms and concepts that facilitate a better understanding of energy at work. The second task is a rigorous and full accounting of high-quality energy as work rather than the incomplete tracking of commodities as tons of coal, gallons of gasoline, or kilowatt-hours of electricity. As it turns out, the conventional economic accounts within the United States may overlook 25 to 30 percent of the total high-quality energy that is actually necessary to power the U.S. economy.
What most people call energy, for example, is what physicists and engineers are more likely to call exergy, or high-quality energy that is available to do work. At room temperature, for example, the energy (or heat) within the atmosphere is generally unavailable to perform work such as overcoming gravity or friction. Although there is a lot of energy contained within the atmosphere or nearby bodies of water, for the most part, that energy is useless. Energy that is either wasted or useless—energy that has no capacity to perform work—is referred to as anergy. Total energy within a system or economy is the sum of exergy plus anergy. The sum of total energy is also constant. High-quality exergy may degrade into useless anergy (a process called entropy) but the sum of both exergy and anergy remains fixed.
Once properly defined, the second task is to ensure that all high-quality energy (exergy) that is necessary to perform work is measured and tracked. As the data in this report indicates, the usual tracking of energy commodities—whether tons of coal, therms of natural gas, gallons of gasoline, or kilowatt-hours of electricity—accounts for an estimated 79 percent of the exergy
v
necessary to power the U.S. economy in 2010. Thus, the economic accounts now provide an incomplete reference to the full set of resources that enable work or economic activity.
CRITICAL POLICY STEPS FOR A MORE ROBUST ECONOMY
The ideas advanced in this report challenge the conventional accounting of energy consumption. Yet all of these insights discussed in this report would benefit from a more substantial review and a more rigorous assessment of how the current economic paradigm might be reshaped more positively through an improved grounding in the physical reality of exergy flows that animate and impact the world around us. For example, there are several specific issues, advanced here, which merit further exploration. These include better understanding of why the rate of change for exergy efficiency and the rate of change for traditional energy efficiency (energy use per dollar GDP) may at times differ from each other, sometimes markedly; and how both measures impact economic productivity. Also important is a much better understanding of how the change in exergy efficiency may be correlated to changes in prices, policies, and other to-be-determined factors.
One especially useful step would be the convening of a national workshop or conference that is specifically designed to explore the fundamental aspects of at least four different elements, examining: (i) the critical distinction between energy and exergy; (ii) the completeness of economic accounts as they track the full set of exergy resources that drive economic activity; (iii) the contribution of and distinction between both muscle power and brain power as they enable work; and finally, (iv) the difference between the formal market and the shadow economy as they impact the robustness and sustainability of economic activity.
Notwithstanding the further insights that might emerge from a national workshop or from further and more rigorous assessment of the link between exergy flows and a more robust economy, the evidence underscores one very critical idea—the U.S. economy will be better off “Thinking Big” about energy productivity. More to the point, if we miss the big gains in energy and exergy efficiency, focusing instead on investments in costlier and more hazardous new energy resources, we run the risk of a continued weakening of the economy. Yet, the combination of smart pricing and policy signals that focus on energy and exergy efficiency, rather than energy supply alone, can increase productivity of our economy in ways that enable our prosperity to continue.
vi
Acknowledgments
Funding for this report came from an anonymous ACEEE contributor to whom I am deeply grateful. At the same time, this report would not have at all been possible without the very big and long-time contributions of my colleague Bob Ayres. I owe him a debt of gratitude for both his previous and his ongoing research. But neither would this report have been written without the support, insights, and contributions of Steve Nadel. I offer my heartfelt thanks to both Bob and Steve. I also benefited from the insights that resulted from my participation in the INSEAD conference that was convened on April 10, 2013 in Fontainebleau, France as a Homage to Professor Robert U. Ayres: The Economic Growth Enigma: Money or Energy? The key speakers included Dr. Colin Campbell, Dr. Reiner Kümmel, Dr. Ernst Ulrich von Weizsäcker, and of course Bob Ayres.
I also want to also thank my reviewers Michael Canes, Ev Ehrlich, Larry Plumb, Catherine Bell, Harvey Sachs, and Bob Ayres for their solid assessments. I did not always follow their suggestions, but all of them most assuredly helped make this a much better and much stronger report. I will leave that judgment to the readers’ determination, but my thanks to all! Finally I would like to acknowledge ACEEE’s Renee Nida for her ongoing editorial support, and Patrick Kiker and Eric Schwass, both also with ACEEE, for their work publishing and promoting this report. Finally, I would also like to acknowledge more than 30 years of insights and thoughtful reflection that followed the many walks taken with Ivan Illich during my time in Berlin in 1981. His two books, Energy and Equity (1974) and Shadow Work (1981), continue to intrigue and cause me to ask more questions.

LINKING ENERGY EFFICIENCY TO ECONOMIC PRODUCTIVITY
1
1. Introduction
On any given day a consultant might use his home office to “telecommute” rather than drive to the office. At the same time, a plant foreman may power up a centrifuge to meet the day’s production schedule while a truck driver may be on her way to deliver a replacement part that will allow a manufacturer to resume production. These separate work events all share three critical ingredients. The first is someone who performs work, or directs an activity that gets the job done (labor). The second is the use of machinery or equipment that enables the production of goods and services (capital). The last is a flow of energy that animates both labor and capital so that the desired work can be carried out (energy). Most assessments of economic activity focus only on capital and labor. When energy is included it is almost always to explore the impact of future energy prices or to review the adequacy of energy supply. Energy is seldom viewed as a critical resource that enables overall economic activity.
This report explores the productive use of energy as it impacts the robustness of the larger U.S. economy. It also explores the need for a more critical accounting of how work—that is, the transformation of matter into necessary goods and services—is accomplished within a given economy. It then builds on a simple point made by management consultants Peter Drucker and W. Edwards Deming, among others, who have said in various ways: “If you can’t measure it, you can’t manage it.”1 In this case, if energy flows are neither properly measured nor adequately tracked, then business and policy leaders may be misreading the real dynamics of economic activity. Hence, their recommended policies and patterns of investment may improve neither the robustness nor the resilience of the economy. The remaining sections of this report are an effort to shape a more positive understanding about the dynamic link between greater levels of energy efficiency and a vibrant economy.
In Section 2 that immediately follows, the analysis opens with a historical review of economic growth patterns. This long-run view highlights emerging trends that suggest that a slow erosion of economic vitality may already be at work within the U.S. economy. Section 3 next provides a brief review of key energy concepts and definitions to ensure a critical understanding of how energy shapes economic activity. Among the first discussion topics is an assessment of how energy animates both capital and labor in the production of goods and services. A central theme of that discussion—building on the work of Robert Ayres and Benjamin Warr as documented in their 2009 book, The Economic Growth Engine: How Energy and Work Drive Material Prosperity—is that, yes, the availability and use of energy is a prerequisite in maintaining the material well-being of a society.2 At the same time, however, the inefficient conversion of energy into work can weaken or constrain the development of a more robust economy.
1 This quote by Peter Drucker is taken from Ocken (2008). Deming has also suggested similar perspective although both Drucker and Deming understood the need to go beyond mere measurement alone, moving toward what Deming called a System of Profound Knowledge. 2 Ayres and Warr (2009) provide an exceptional underpinning of the analysis in this report since they provide a unique 110-year database of key economic and energy (or more appropriately, as we shall see later in this discussion, exergy) variables. At the same time, there are other critical references that underpin the logic of the analysis, including most recently Kümmel (2011) and dating back to Georgescu-Roegen (1971).

LINKING ENERGY EFFICIENCY TO ECONOMIC PRODUCTIVITY © ACEEE
2
As discussed later, it turns out that the U.S. economy converted only 14 percent of the total energy consumed in 2010 into useful work. In other words, the American economy wasted 86 percent of all the energy used in the production of goods and services. One can easily imagine that waste of this magnitude creates an array of costs that can easily weaken the nation’s economic and social well-being.3 Section 4 provides initial insights into the workings of the economy and how the efficient conversion of energy into useful work can increase the productivity of the larger economy. Section 5 provides an opportunity to step back and see how underutilized gains in energy efficiency may provide a useful step forward. Finally, with the initial background and the initial insights firmly in play, Section 6 provides two major recommendations. The first is to improve the tracking and accounting of energy as work rather than (as explained later in this report) energy as merely a secondary flow of commodities to be bought and sold on the market). The second builds on the insights pulled from the analysis to suggest that, in fact, America may be better off thinking big about energy efficiency and in this way increasing the long-term likelihood of a more vibrant and resilient economy.
2. Exploring the Long Run
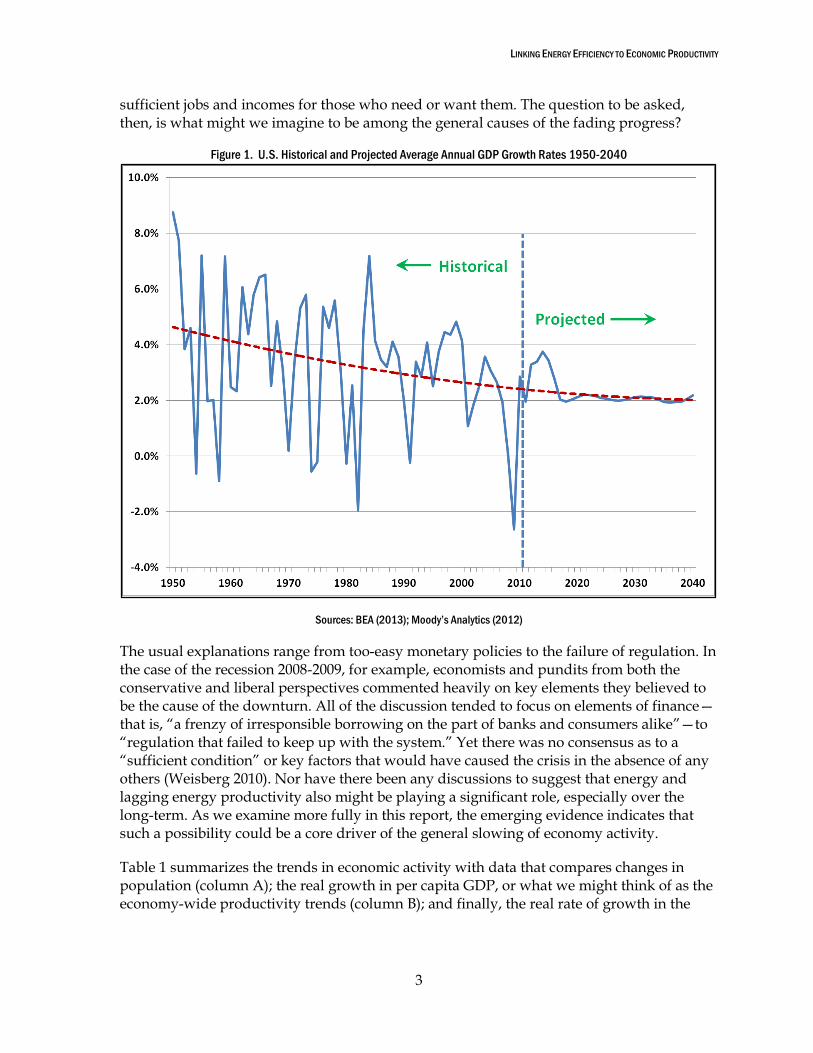
The combination of recent historical trends and future projections of the nation’s Gross Domestic Product (GDP) provide a starting point to explore the inadequacy of economic assessments that omit energy as a factor of production. For understandable reasons, the lingering effects of the recession that first appeared in December 2007, continuing through June 2009, absorb the more immediate focus of economic policy discussions. But if we step back and provide a longer historical context we might see a more worrisome picture emerge. Figure 1, on the following page, highlights the trend in annual GDP growth rates for the U.S. economy over the historical period 1950 through 2010. To this we add projected growth rates made available by Moody’s Analytics (2012) out to the year 2040.4 The solid blue line shows both the historical and the forecasted growth rates while the dashed red line is a stylized mapping of the slumping rate of growth.
The period 1950 to 1980 in Figure 1 is generally seen as a vigorous—though an already declining—expansion of the U.S. economy. As summarized in Table 1 that also follows, the annual growth rate averaged 3.6 percent in those three decades.5 The period 1980 to 2010 in Figure 1 saw a continued weakening of economic growth even if we disregard the obvious impacts of the recession in December 2007 through June 2009. Again as summarized in Table 1, the average annual growth rate fell to 2.7 percent. Perhaps of greater concern is the prospect for a continued weakening of the economy—generally through the year 2040. An economy that hovers around a 2 percent annual growth rate may not be able to provide
3 The actual data set begins with the year 1900, and while useful insights appear from the entire 110 years of data, for purposes of this report we concentrate on the more recent period of 1950 to 2010. 4 While this figure relies on projections from Moody’s analytics, the trend is seen in other forecasts—whether OECD (2013), EIA (2013b), or Woods and Poole (2013). 5 There is nothing magical about these three 30-year periods. They offer a convenient way to highlight and summarize, and therefore explain key trends. Once we understand the significant points we can review more of the year-by-year and more of the detailed data for insights to positively shape the nation’s energy and economic policies.
LINKING ENERGY EFFICIENCY TO ECONOMIC PRODUCTIVITY
3
sufficient jobs and incomes for those who need or want them. The question to be asked, then, is what might we imagine to be among the general causes of the fading progress?
Figure 1. U.S. Historical and Projected Average Annual GDP Growth Rates 1950-2040
Sources: BEA (2013); Moody’s Analytics (2012)
The usual explanations range from too-easy monetary policies to the failure of regulation. In the case of the recession 2008-2009, for example, economists and pundits from both the conservative and liberal perspectives commented heavily on key elements they believed to be the cause of the downturn. All of the discussion tended to focus on elements of finance—that is, “a frenzy of irresponsible borrowing on the part of banks and consumers alike”—to “regulation that failed to keep up with the system.” Yet there was no consensus as to a “sufficient condition” or key factors that would have caused the crisis in the absence of any others (Weisberg 2010). Nor have there been any discussions to suggest that energy and lagging energy productivity also might be playing a significant role, especially over the long-term. As we examine more fully in this report, the emerging evidence indicates that such a possibility could be a core driver of the general slowing of economy activity.
Table 1 summarizes the trends in economic activity with data that compares changes in population (column A); the real growth in per capita GDP, or what we might think of as the economy-wide productivity trends (column B); and finally, the real rate of growth in the

LINKING ENERGY EFFICIENCY TO ECONOMIC PRODUCTIVITY © ACEEE
4
nation’s GDP (column C).6 In this case, however, we are looking at three periods from 1950 to 1980 (data row 1), 1980 through 2010 (data row 2), and future projections for the period 2010 to 2040 (data row 3).
Table 1. Average Population, Productivity and GDP Growth Rates in the United States
Compound Average Growth Rate
(A)
U.S. Population
(B)
Per Capita GDP
(C)
Real GDP
(1) From 1950 to 1980 1.34% 2.25% 3.63%
(2) From 1980 to 2010 1.04% 1.72% 2.77%
(3) From 2010 to 2040 0.94% 1.31% 2.26%
Note: Derived from data in Appendix A with data from Ayres and Warr (2009), and EIA (2012a). Year-by-year data for each of these
historical parameters are shown in Appendix A. The forecast projections are drawn from Moody’s Analytics (2012), and Woods and Poole
(2013).
Of immediate interest is the apparent slump in the nation’s economic productivity (per capita GDP) shown in column B of Table 1, and finally, the impact on the nation’s economy (column C). The bad news is that the earlier period from 1950 to 1980 showed the larger improvement in columns B and C. In the last 30-year period, covering the years 1980 to 2010, however, the nation’s economic vitality shows a general weakening—especially as the rate of economy-wide overall productivity fell from 2.25 percent to 1.72 percent. As the report discusses later, a possible reason for this weakening productivity may be the result of a slowing rate of converting what we call exergy (discussed in more detail below), or a measure of potential work that might be done, into actual “useful work” so that we can cost-effectively and simultaneously increase the magnitude the nation’s larger economy productivity, and therefore, its total GDP.7 Before we explore this point more completely, we first step back and introduce several key concepts that help frame the energy link to economic productivity.8
3. Key Energy Concepts Necessary to Understand Productivity
All interactions of matter involve flow of energy. This is true whether they have to do with earthquakes, the movement of the planets, or the various biological and industrial processes at work anywhere in the world. Protoplasm, for example, is the complex, semi-fluid, translucent substance that constitutes the living matter of plant and animal cells and
6 Perhaps not immediately apparent, but the growth in GDP is a function of multiplying the rate of population growth times the rate of growth in productivity (labeled here as growth in per capita GDP). So, for example, if population growth in column A of Table 1 averages 1.04% in the period 1980 to 2010, and productivity growth averages 1.72%, then (1+0.0104) times (1+0.0172) equals 1.0277, which results in a growth of 2.77%. 7 The U.S. economy provided a GDP of $5,389 billion in 1980. It more than doubled in size, reaching a total of $13,240 billion by 2010 (with both values reported in the Appendix of this report and measured in constant 2005 dollars). Perhaps not immediately apparent, but had the U.S. economy maintained a productivity improvement of 2.25% rather than 1.72% over the period 1980 to 2010, even with a smaller population growth rate, GDP would have actually grown to an estimated $15,510 billion (also in constant dollars). In other words, a very small change in productivity would have meant an economy that was about $2.3 trillion larger than we actually recorded in 2010. 8 As my colleague Bob Ayres reminds me, the role of finance cannot be underestimated in explaining the current weakness of the economy. In addition to a lagging resource productivity, a “primary reason for the current economic malaise—a good word for it—is that the banks aren't lending to small and medium businesses, which are the job creators.” See also Ayres (2013) and Morgan (2013) for additional insights in this regard.

LINKING ENERGY EFFICIENCY TO ECONOMIC PRODUCTIVITY
5
manifests the essential life functions of a cell. It is composed of various kinds of matter, including proteins, fats, and other molecules suspended in water. And yet that tissue would be nothing but an inert lump of matter but for the energy necessary to activate and animate it. A basic equation describing the endothermic reaction to create new body tissue could include the essential molecules of carbon dioxide (CO2), water (H2O), nitrates (NO3), phosphates (PO4), and mineral nutrients. But also included in that recipe is radiant energy. And from that interaction of matter and energy we might get some amount of new tissue, oxygen (O2), and dispersed heat. Without the micro- and macronutrients, and without the energy, there would be no new tissue (Smil 1999, 42).
In much the same way as we might bring together the essential ingredients of living tissue, without the energy to animate both capital and labor there would be no economic activity. Buried within this last sentence are two additional ideas that need teasing out to more fully understand the critical role that energy plays in economic productivity. The first idea is that it is more than just energy which is necessary to animate activity or life; rather, it is a unique or special form of “high-quality energy” that enables us to get the job done. Indeed, there is energy in the air, in the oceans, and in all matter; but that very large energy resource is seldom available in a form that allows work to be done. The second idea is that if we want to double the amount of economic activity we actually need to double the necessary energy—less the huge amount of waste we now generate in maintaining that activity. We explore these two ideas next.
3.1 IT IS EXERGY NOT ENERGY THAT DRIVES ACTIVITY
The waters in the Gulf of Mexico contain sufficient heat to power the U.S. economy for about 3600 years.9 Yet, the energy within those waters is simply too diffuse, and the average temperature too low, to be available as a major source of power for the U.S. economy. What is required is a high-quality energy resource that engineers and physicists call exergy. Indeed, what most people call energy is actually the sum of exergy and anergy. Anergy is essentially the useless part of energy such as the heat from an automobile engine that might be dumped into the atmosphere. To properly understand what enables economic activity we need to understand the differences between energy, exergy, and anergy.
Whether in the form of a barrel of oil, a thousand cubic feet of natural gas, or the kilowatt-hours of solar energy that strikes every square meter of the earth each day, exergy is the valuable part of energy which can be converted into useful work. Consistent with the laws of thermodynamics, total energy (exergy plus anergy) is constant and is always neither created nor destroyed. Exergy, however, can be degraded as it is used and dissipated into anergy. Given these significant distinctions, we can begin to see that when we talk about tracking energy instead of the exergy necessary to power the economy, we are already confusing concepts and data in ways that can mislead businesses and policymakers about smart economic development solutions founded on the improved and more productive use of exergy.10
9 This estimate is from a calculation by the author, assuming an area of 615,000 square miles, an average depth of 5,298 feet, and an average temperature of 63 degrees Fahrenheit. 10 As Kümmel (2011) explains, entropy is the increase in useless anergy at the expense of useful exergy.

LINKING ENERGY EFFICIENCY TO ECONOMIC PRODUCTIVITY © ACEEE
6
3.2 DOUBLE THE EXERGY TO DOUBLE THE OUTPUT—LESS THE WASTE
It takes about one joule of exergy to lift one apple three feet up from the ground. If that work were being done by an average adult the total effort expended might require 20 joules to get the job done.11 The reason is that humans are not especially efficient at converting calories of food into actual muscle work. And if we wanted to lift not one apple but two up from the ground, that amount of work would absolutely require twice the joules. Two joules of work, however, doesn’t necessarily imply twice the total effort, or 40 joules of exertion. The reason? If we apply a lever or some other technology to aid in the lifting of the apple, if perhaps we quit fighting over the apples which dissipates exergy (but without producing a lifting of the apples), and if the person actually doing the work is in much better shape than the average person, then we can begin to see that two joules of actual work might require only two-thirds, or even one-half, the total effort to lift both apples. This idea becomes the cornerstone to understand the link between exergy and economic productivity. Reducing waste lowers the cost of effort which, in turn, makes available the greater opportunity for more useful work which can increase economic activity.
4. Energy Efficiency and Economic Productivity
From this point the question might be asked, what is the sufficient condition that might help explain the dampened productivity improvements? The linkage between productivity and exergy use is explored in the section that follows. As the newly collected data in Appendix A will suggest, the slumping rate of productivity improvement, in significant part, can be traced back to a declining rate of improvement in exergy efficiency—the rate of converting total exergy or high-quality energy into useful energy (or work).
Energy economists and policy analysts formulate many of their insights based on data collected by the Energy Information Administration (EIA). As it turns out, the energy data collected by the EIA provides us with only part of the story regarding how energy (or more correctly, exergy) works and can move the economy forward. The EIA routinely gathers annual data on the physical units as tons of coal, cords of wood, gallons of gasoline, therms of natural gas, or kilowatt-hours of electricity. All of these different energy forms have an equivalent heat value that allows us to compare a gallon of gasoline with, say, one kilowatt-hour (kWh) of electricity. In the majority of other countries of the world, these energy forms are converted using a standard energy unit called the joule. In the United States, heat equivalent is the British thermal unit (Btu). One Btu is roughly the amount of heat given off by the burning of a wooden kitchen match.12 There are about 124,238 Btus of heat equivalent in a gallon of gasoline—or the heat energy that might be provided by the complete burning of 124,238 wooden kitchen matches.
Similarly, there are approximately 3,412 Btus for every kilowatt-hour of electricity that is delivered to a home or an office building. And comparing electricity and gasoline, we might say that a gallon of gasoline is the heat equivalent of 36.4 kWh delivered to the end user. We
11 The joule is a standard unit of energy that, together with more basic concepts of energy consumption, is explored more completely in Section 4 that follows. 12 More formally, a British thermal unit is the amount of heat required to raise one pound of water one degree Fahrenheit at one atmosphere pressure. There are 1,055.056 Joules of heat in one Btu.
LINKING ENERGY EFFICIENCY TO ECONOMIC PRODUCTIVITY
7
will return to this discussion in more detail later in the section, but if we include both the delivered energy and the energy that is wasted in the generation, transmission, and distribution of that electricity, we will find that the production of electricity required an average 10,569 Btus per kWh in the United States in 2010 (EIA 2013b). In other words, the 3,412 Btus bundled in a single kWh available for use in the home or business is only 32.3 percent of the total energy needed to create and distribute that electricity. In that case, one might say that a gallon of gasoline is the heat equivalent of 11.8 kWh when compared to the energy that is necessary at the generation source.13
Notwithstanding the various methods of tracking energy consumption, the real question for us is the ability of exergy (high-quality energy) to enable work. In the more simple explanation, as already implied in the example of picking up an apple, work might be defined as lifting a weight against the force of gravity or overcoming sliding friction. Again, from an economic perspective, work is defined as the exergy that is actually used to transform matter into goods and services. For all practical purposes, useful work can be divided into three primary categories. The first category is the “muscle work” or work that might be carried out by people and animals. In 1900, for example, there were an estimated 43 million horses, mules, oxen and other (non-milk) cattle on farms (Bureau of Statistics 1901: 372). A large number of these were draft animals providing work while another share of animals supported various needs for transportation.14 This did not include urban work animals which also provided substantial labor and transportation services that, in turn, also boosted economic activity.
Today, very few animals provide work or transportation services, but the number of working people has grown. The latter now provide an estimated 250 billion hours of work each year. That large number of hours is small in terms of caloric intake, but when solar resources necessary to grow the food, coupled with the huge waste in the production and processing of food, the exergy services necessary to sustain that labor may be on the order of more than 20 quadrillion Btus of the total exergy requirements to power the economy (again, see Appendix A for more background and also Ayres and Warr 2009, Figure 3.7a).
The second category of useful work is mechanical and electric power. This work is done by a variety of steam and gas turbines, gasoline and diesel engines, and electric generators. These various engines are sometimes referred to as prime movers. The last category of work provided is some combination of low, medium, or high temperature heat that is delivered to the point of actual use in homes or industrial processes (Ayres and Warr 2009).
13 We can also compare the energy contained in food with conventional energy resources. A quarter pound cheeseburger from McDonald's, for example, contains an estimated 510 food calories, which is the equivalent of just over 2,000 Btus. Expressed as an equivalent of electricity, the cheeseburger has an energy value of 0.593 kWh, about the same as the electricity required to light a 100-watt incandescent bulb for almost 6 hours. Assuming we could efficiently convert the entire cheeseburger into electricity. 14 In 1900, horses, mules and oxen were treated as capital, not labor. In effect, they were the equivalent of what below is called “mechanical and electric power.” The critical point is that regardless of their categorization as labor or capital, their energy requirements and the work expended were not tracked in the formal accounts of energy used within the nation’s economic activity.
LINKING ENERGY EFFICIENCY TO ECONOMIC PRODUCTIVITY © ACEEE
8
As the Energy Information Administration now tracks the data for many different amounts of purchased energy (EIA 2012b, 2013a, 2013b), estimates for the year 2010 suggest the United States consumed about 98 quadrillion Btus, or quads, of total energy in that year. One quad is roughly 8 billion gallons of gasoline which is, at current levels of energy efficiency, sufficient fuel to run some 15.4 million cars for one full year of typical driving. It is also enough energy to provide the full energy needs for about 5.2 million households in a given year. Moreover, with today’s technologies and infrastructure it is enough energy to power $135 billion of annual economic activity within the United States. But this is only part of the story.
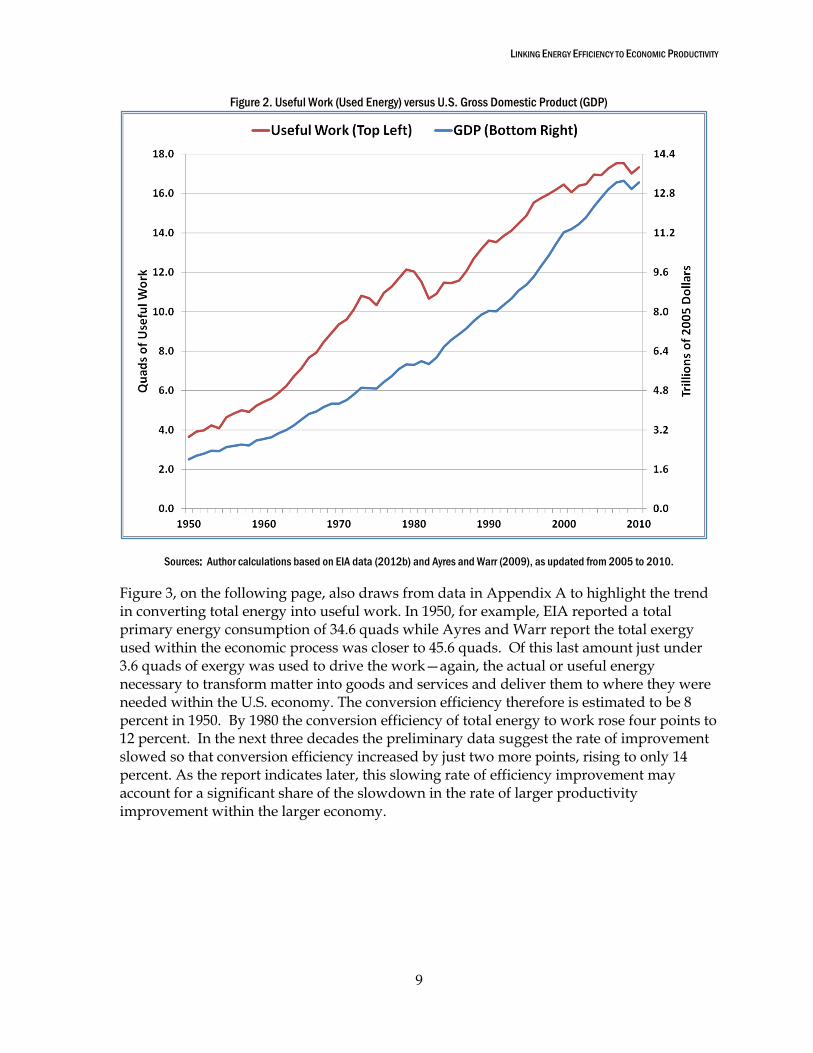
Ayres and Warr (2009) use a more complete accounting of the total high-quality energy (exergy) that is consumed to power the full economy. Their data indicate that the United States required something more in the range of 124 quads (rounded) of total exergy consumption in 2010.15 More critically, Ayres and Warr (2009) estimate that only 17 quads of that total exergy consumption were actually used and useful in the production and delivery of the typical baskets of consumer goods and services.16 As Figure 2 highlights below, it is the total raw energy converted to useful work (used energy shown in the graph) which drives economic activity as typically measured by the nation’s GDP (with relevant data for both variables shown in Appendix A of this report). As Ayres and Warr further clarify, the reason the raw energy “inputs do not explain economic growth is that their inefficient conversion leads to a large fraction of waste heat (and other wastes, like ash) that do not contribute to the economy but actually create health problems and costs of its disposal” (2009, 125).
15 As explained in Appendix A, the 26 quad difference in 2010 between the Ayres and Warr data compared to the EIA reflects a combination of chemical energy rather than heat value plus the renewable energy required to grow food less fossil fuel energy converted into chemical feedstocks. 16 In effect, Ayres and Warr compare the minimum amount of exergy necessary to provide a given service. For example, an incandescent lamp with a lighting efficiency of 8 percent combined with an electric generation efficiency of 32 percent would have a system efficiency of just 2.6 percent. A compact fluorescent lamp that improves efficiency to 40 percent might raise the overall efficiency to 13 percent.
LINKING ENERGY EFFICIENCY TO ECONOMIC PRODUCTIVITY
9
Figure 2. Useful Work (Used Energy) versus U.S. Gross Domestic Product (GDP)
Sources: Author calculations based on EIA data (2012b) and Ayres and Warr (2009), as updated from 2005 to 2010.
Figure 3, on the following page, also draws from data in Appendix A to highlight the trend in converting total energy into useful work. In 1950, for example, EIA reported a total primary energy consumption of 34.6 quads while Ayres and Warr report the total exergy used within the economic process was closer to 45.6 quads. Of this last amount just under 3.6 quads of exergy was used to drive the work—again, the actual or useful energy necessary to transform matter into goods and services and deliver them to where they were needed within the U.S. economy. The conversion efficiency therefore is estimated to be 8 percent in 1950. By 1980 the conversion efficiency of total energy to work rose four points to 12 percent. In the next three decades the preliminary data suggest the rate of improvement slowed so that conversion efficiency increased by just two more points, rising to only 14 percent. As the report indicates later, this slowing rate of efficiency improvement may account for a significant share of the slowdown in the rate of larger productivity improvement within the larger economy.

LINKING ENERGY EFFICIENCY TO ECONOMIC PRODUCTIVITY © ACEEE
10
Figure 3. Conversion Efficiency—Total Exergy to Useful Work
Sources: Author calculations based on EIA data (2011a) and Ayres and Warr (2009), as updated from 2005 to 2010.
Figure 4. Growth Rates for Exergy Efficiency and Economy-Wide Productivity
Source: Author calculations based on data in Appendix A.
Figure 4, above, provides a different perspective on the link between lagging improvements in exergy efficiency and economic productivity. Again drawing data from Appendix A, the chart shows four lines. The first two solid lines are the actual year-to-year change in exergy efficiency (blue, generally on the bottom) and economy-wide productivity (red, generally on
LINKING ENERGY EFFICIENCY TO ECONOMIC PRODUCTIVITY
11
the top). The second set of two dashed lines suggests the best fit trend lines, again for exergy efficiency (blue, bottom) and economy-wide productivity (red, top). Casual observation shows a tightly-linked, declining trend for both exergy efficiency and productivity.
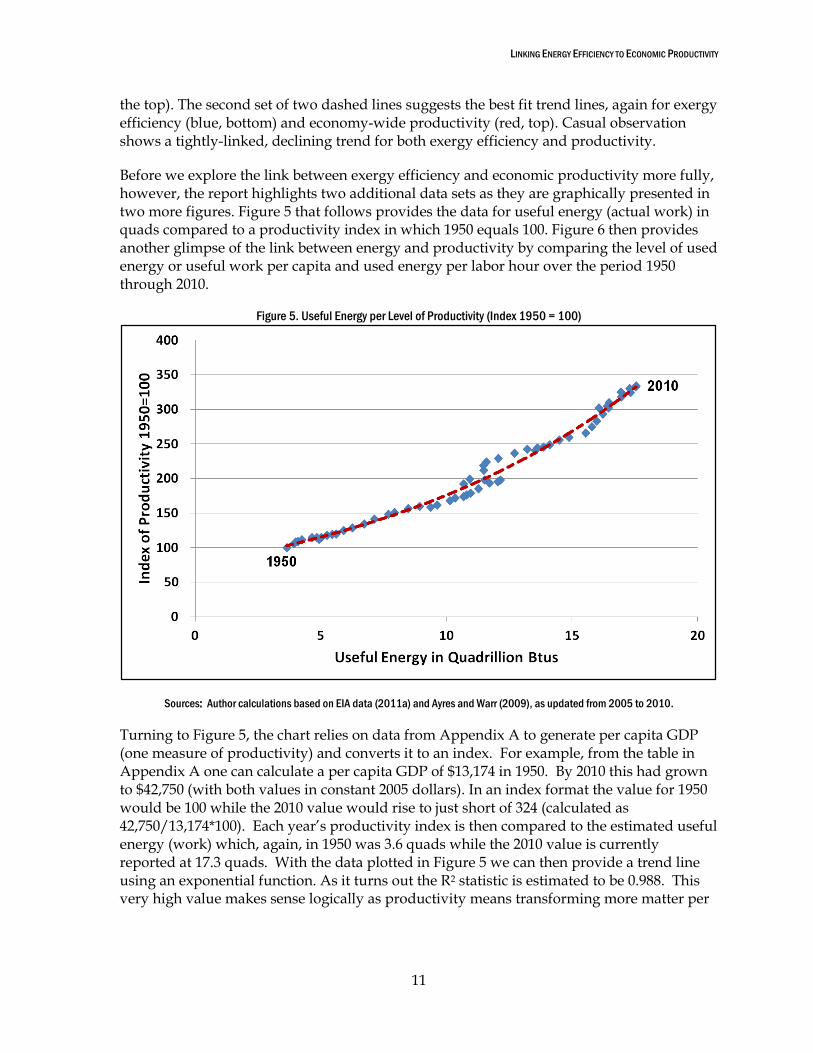
Before we explore the link between exergy efficiency and economic productivity more fully, however, the report highlights two additional data sets as they are graphically presented in two more figures. Figure 5 that follows provides the data for useful energy (actual work) in quads compared to a productivity index in which 1950 equals 100. Figure 6 then provides another glimpse of the link between energy and productivity by comparing the level of used energy or useful work per capita and used energy per labor hour over the period 1950 through 2010.
Figure 5. Useful Energy per Level of Productivity (Index 1950 = 100)
Sources: Author calculations based on EIA data (2011a) and Ayres and Warr (2009), as updated from 2005 to 2010.
Turning to Figure 5, the chart relies on data from Appendix A to generate per capita GDP (one measure of productivity) and converts it to an index. For example, from the table in Appendix A one can calculate a per capita GDP of $13,174 in 1950. By 2010 this had grown to $42,750 (with both values in constant 2005 dollars). In an index format the value for 1950 would be 100 while the 2010 value would rise to just short of 324 (calculated as 42,750/13,174*100). Each year’s productivity index is then compared to the estimated useful energy (work) which, again, in 1950 was 3.6 quads while the 2010 value is currently reported at 17.3 quads. With the data plotted in Figure 5 we can then provide a trend line using an exponential function. As it turns out the R2 statistic is estimated to be 0.988. This very high value makes sense logically as productivity means transforming more matter per
LINKING ENERGY EFFICIENCY TO ECONOMIC PRODUCTIVITY © ACEEE
12
dollar of economic activity. That, in turn, requires more used energy or useful work (as compared to total exergy consumed).17
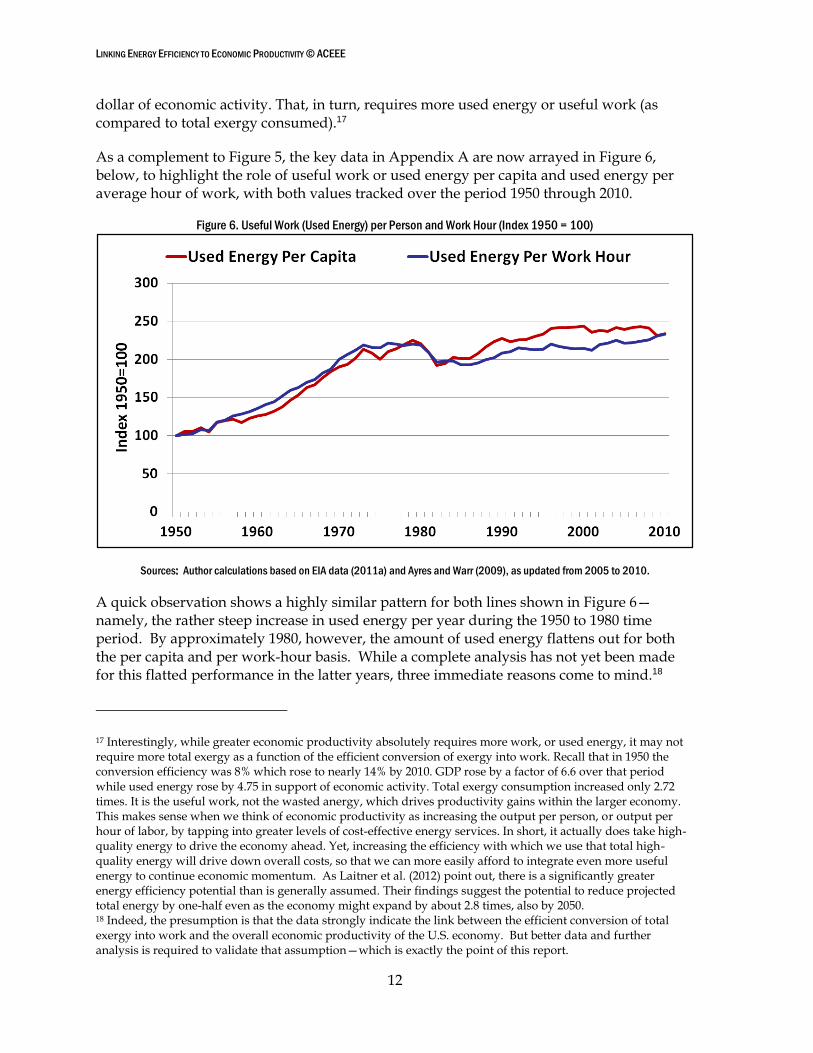
As a complement to Figure 5, the key data in Appendix A are now arrayed in Figure 6, below, to highlight the role of useful work or used energy per capita and used energy per average hour of work, with both values tracked over the period 1950 through 2010.
Figure 6. Useful Work (Used Energy) per Person and Work Hour (Index 1950 = 100)
Sources: Author calculations based on EIA data (2011a) and Ayres and Warr (2009), as updated from 2005 to 2010.
A quick observation shows a highly similar pattern for both lines shown in Figure 6—namely, the rather steep increase in used energy per year during the 1950 to 1980 time period. By approximately 1980, however, the amount of used energy flattens out for both the per capita and per work-hour basis. While a complete analysis has not yet been made for this flatted performance in the latter years, three immediate reasons come to mind.18
17 Interestingly, while greater economic productivity absolutely requires more work, or used energy, it may not require more total exergy as a function of the efficient conversion of exergy into work. Recall that in 1950 the conversion efficiency was 8% which rose to nearly 14% by 2010. GDP rose by a factor of 6.6 over that period while used energy rose by 4.75 in support of economic activity. Total exergy consumption increased only 2.72 times. It is the useful work, not the wasted anergy, which drives productivity gains within the larger economy. This makes sense when we think of economic productivity as increasing the output per person, or output per hour of labor, by tapping into greater levels of cost-effective energy services. In short, it actually does take high-quality energy to drive the economy ahead. Yet, increasing the efficiency with which we use that total high-quality energy will drive down overall costs, so that we can more easily afford to integrate even more useful energy to continue economic momentum. As Laitner et al. (2012) point out, there is a significantly greater energy efficiency potential than is generally assumed. Their findings suggest the potential to reduce projected total energy by one-half even as the economy might expand by about 2.8 times, also by 2050. 18 Indeed, the presumption is that the data strongly indicate the link between the efficient conversion of total exergy into work and the overall economic productivity of the U.S. economy. But better data and further analysis is required to validate that assumption—which is exactly the point of this report.
LINKING ENERGY EFFICIENCY TO ECONOMIC PRODUCTIVITY
13
First, following the logic of Cleveland et al. (1984), Hall et al. (1992), and more recently Stern and Cleveland (2004) and Murphy and Hall (2010), there is a noticeably diminishing return on the high-quality energy (exergy) per unit of exergy invested in the production of more high-quality energy (exergy) resources.19 Second, environmental burdens and social costs are becoming more noticeable which pull investment and high-quality energy away from the production of goods and services into various kinds of cleanup, pollution abatement activities, and unemployment expenses and health care costs. Third, and related to the second issue, is that the direct and indirect cost of inefficient exergy services, relative to other factors of production, may be rising more quickly than generally realized. This constrains the uptake and conversion of high-quality energy (or work) which holds back the ability of both labor and capital to amplify their output. The result is that the flattening uptake of used energy, either per capita or per work hour, must be affecting other aspects of the economy as well. And this is further borne out Table 2, discussed below.
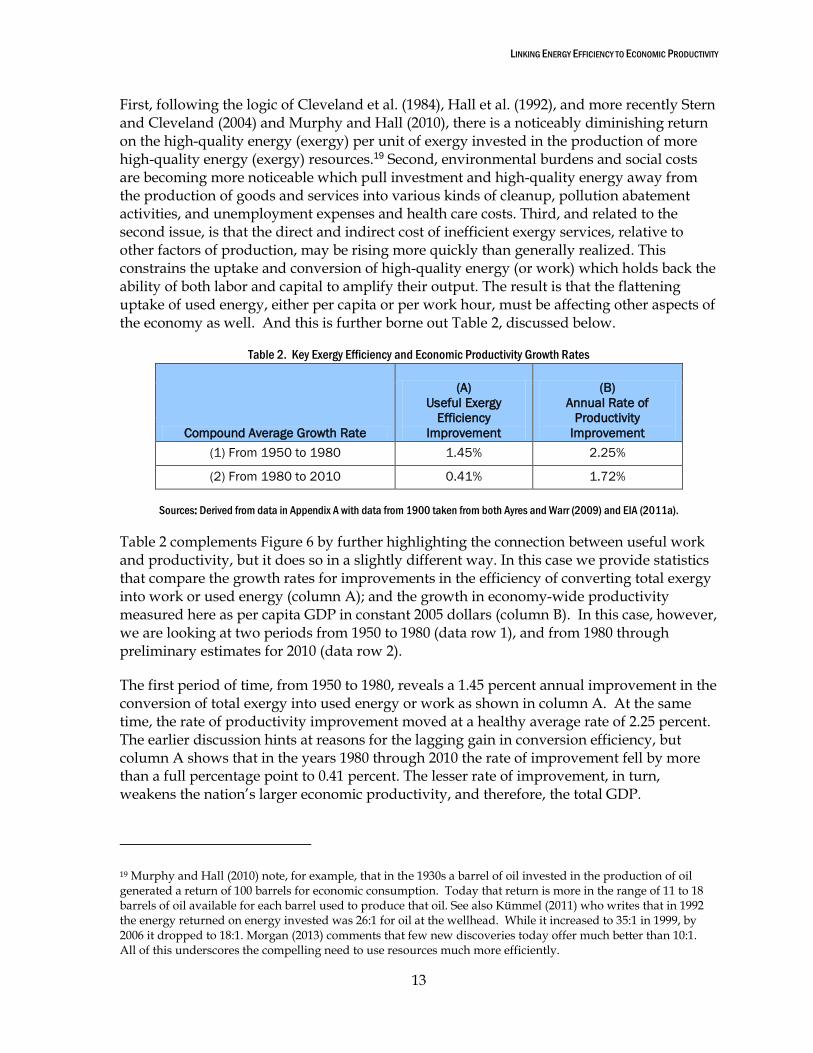
Table 2. Key Exergy Efficiency and Economic Productivity Growth Rates
Sources: Derived from data in Appendix A with data from 1900 taken from both Ayres and Warr (2009) and EIA (2011a).
Table 2 complements Figure 6 by further highlighting the connection between useful work and productivity, but it does so in a slightly different way. In this case we provide statistics that compare the growth rates for improvements in the efficiency of converting total exergy into work or used energy (column A); and the growth in economy-wide productivity measured here as per capita GDP in constant 2005 dollars (column B). In this case, however, we are looking at two periods from 1950 to 1980 (data row 1), and from 1980 through preliminary estimates for 2010 (data row 2).
The first period of time, from 1950 to 1980, reveals a 1.45 percent annual improvement in the conversion of total exergy into used energy or work as shown in column A. At the same time, the rate of productivity improvement moved at a healthy average rate of 2.25 percent. The earlier discussion hints at reasons for the lagging gain in conversion efficiency, but column A shows that in the years 1980 through 2010 the rate of improvement fell by more than a full percentage point to 0.41 percent. The lesser rate of improvement, in turn, weakens the nation’s larger economic productivity, and therefore, the total GDP.
19 Murphy and Hall (2010) note, for example, that in the 1930s a barrel of oil invested in the production of oil generated a return of 100 barrels for economic consumption. Today that return is more in the range of 11 to 18 barrels of oil available for each barrel used to produce that oil. See also Kümmel (2011) who writes that in 1992 the energy returned on energy invested was 26:1 for oil at the wellhead. While it increased to 35:1 in 1999, by 2006 it dropped to 18:1. Morgan (2013) comments that few new discoveries today offer much better than 10:1. All of this underscores the compelling need to use resources much more efficiently.
Compound Average Growth Rate
(A)
Useful Exergy
Efficiency
Improvement
(B)
Annual Rate of
Productivity
Improvement
(1) From 1950 to 1980 1.45% 2.25%
(2) From 1980 to 2010 0.41% 1.72%
LINKING ENERGY EFFICIENCY TO ECONOMIC PRODUCTIVITY © ACEEE
14
What if We Used Energy Instead of Exergy to Assess Economic Activity?
As we might first review such information, the conventional energy accounts seem to track the exergy data documented by Ayres-Warr (2009) reasonably well. For example, looking at the data in Appendix A, the Energy Information Administration (EIA) indicates that conventional energy consumption increased about 2.8 times over the period 1950 through 2010. Exergy consumption, on the other hand, increased 2.7 times. This is not a significant difference. Hence the question, why introduce what some policy analysts might think of as a new and confusing unit of measurement?
The reason is that the EIA data track only the heating values for commodities we call gallons of oil or gasoline, cubic feet of natural gas, or kilowatt-hours of electricity—whether for heat and power, or for use as chemical feedstocks as in the production of plastics and petroleum products. Those heating values don’t tell us how much actual work is being done. Because exergy tracks the conversion of high-quality energy into useful work—that is, how much shaft power, delivered lighting, or chemical energy is necessary to transform matter in the goods and services—the Ayres-Warr accounting framework gives us an improved capacity to assess how much productive work is enabled by the use of high-quality energy.
In a similar way, if we examine the nation’s decreasing energy intensity, this only tells us that we are reducing the relative amount of some set of commodities per dollar of economic activity. That does provide a useful insight, but it doesn’t tell us the level of work being done per unit of activity. Looking again at the data in Appendix A, it turns out that the reduction in the nation’s “commodity-based” energy intensity did, indeed, accelerate from -0.84 percent in the period 1950-1980 to -1.96 percent between the years 1980 to 2010. Assuming the decrease in energy intensity was cost-effective, that is good news. But the rate of growth in useful work rather than commodity consumption (both measured in quads) actually fell from 4.1 percent to 1.2 percent in those same time periods. In effect, the slower rate in the growth of useful work implies a slower growth in the rate of economic activity. This is because the rate of exergy efficiency improvement declined from 1.45 percent to just 0.41 percent, which means a weaker capacity for productive work.
This apparently anomalous movement of the two trends is driven by metrics that measure two different things—a change in commodity intensity compared to a change in work activity. We can hypothesize that, at lower annual rates of declining energy intensity (perhaps below two percent), the EIA data capture only a subset of work compared to the Ayres-Warr accounting. But as the annual reduction in energy intensity begins to approach three percent or more, by definition, more of the complete economic activity is reflected in the data. In effect, the change in commodity intensity begins to converge with exergy efficiency. Hence, the higher rates of decline in energy intensity suggested by Laitner et al. (2012), Lovins et al. (2011), and others continue to provide a useful proxy for improved economic activity even if the exergy accounting offers a more complete tracking of work within the economy. This is clearly an area that warrants further investigation, however.
LINKING ENERGY EFFICIENCY TO ECONOMIC PRODUCTIVITY
15
Presumably, then, as the rate of efficiency conversion increases, the quantity of total exergy required to power the economy will decline—even as the amount of useful energy or work continues to grow.20
In effect, the data in Figures 1 through 6, as well as Tables 1 and 2, all reveal two important aspects of U.S. economic activity. First, when one properly measures the links between useful energy (work) and economic output, it becomes clear that the overall level of exergy efficiency in the United States has been stagnating at a rather anemic 13 to 14 percent for the past 20 years or so (notably over the period 1990 through 2005 based on Ayres and Warr, with a preliminary update by the author through 2010). As suggested in the third data row of Table 1, the stagnating rate of converting total energy into future useful energy or work may constrain economic productivity through the year 2040.
Second, we conventionally measure energy efficiency as the number of Btus that EIA reports per constant dollar of GDP. In the 60 years from 1950 to 2010 this level of “energy intensity” has improved (i.e., decreased) by an average of 1.4 percent per year. If we merely kick that level of performance up to 2 percent per year through 2040 as EIA’s later Annual Energy Outlook 2013 suggests (EIA 2013b), we may continue to see a weaker economy over the next several decades. Indeed, if we are to ensure a more vibrant level of economic activity, the evidence points to a need to at least triple, quadruple, or even quintuple the productive conversion of raw energy into “useful energy,” so that a greater magnitude of cost-effective work is available to power a more robust economy (Laitner et al. 2012; Laitner 2013).
So, with this backdrop now in place, we might ask two further questions. First, how much of an impact on the economy might different rates of reduction in the nation’s energy intensity have had in the past? Second, how much of an impact might future rates of energy or exergy efficiency improvement have on overall economic activity? Consistent with a variety of past studies, the assumption is that the more aggressive rates of efficiency improvements are cost-effective (Interlaboratory Working Group 2000; InterAcademy Council 2007; APS 2008; AEF 2009; McKinsey 2009; Cambridge Systematics 2009; Lovins et al. 2011; Laitner et al. 2012). By definition, if less aggressive rates of efficiency improvements were followed it was because there were either market failures or market barriers which impeded such improvements (Brown 2001; Geller et al. 2006), or that energy prices were insufficient to stimulate the more aggressive rate of improvements (Hanemann 2010; Burtraw and Woerman 2013).
We answer the first question by exploring impacts over the years 1970-2010. This is both for analytical convenience as well as because 1970 begins the decade in which the so-called oil embargo triggered the first real wave of policy maker and business interest in energy issues,
20 Although not explored in this report, the 1980-2010 drop in the rate of exergy efficiency improvements was likely the result of: (i) relative prices that favored energy supply over efficiency gains, or that did not provide a sufficient signal to warrant new productivity gains; and (ii) market and information barriers, and other economic policies which preempted the more productive use of exergy resources (see Brown 2001 and Geller et al. 2006). Understanding what might specifically impact these different rates of improvement would be a logical next step in the progression of assessments which might clarify the critical link between exergy as a catalyst for productive work compared to energy flows that are tracked merely as a series of commodities.
LINKING ENERGY EFFICIENCY TO ECONOMIC PRODUCTIVITY © ACEEE
16
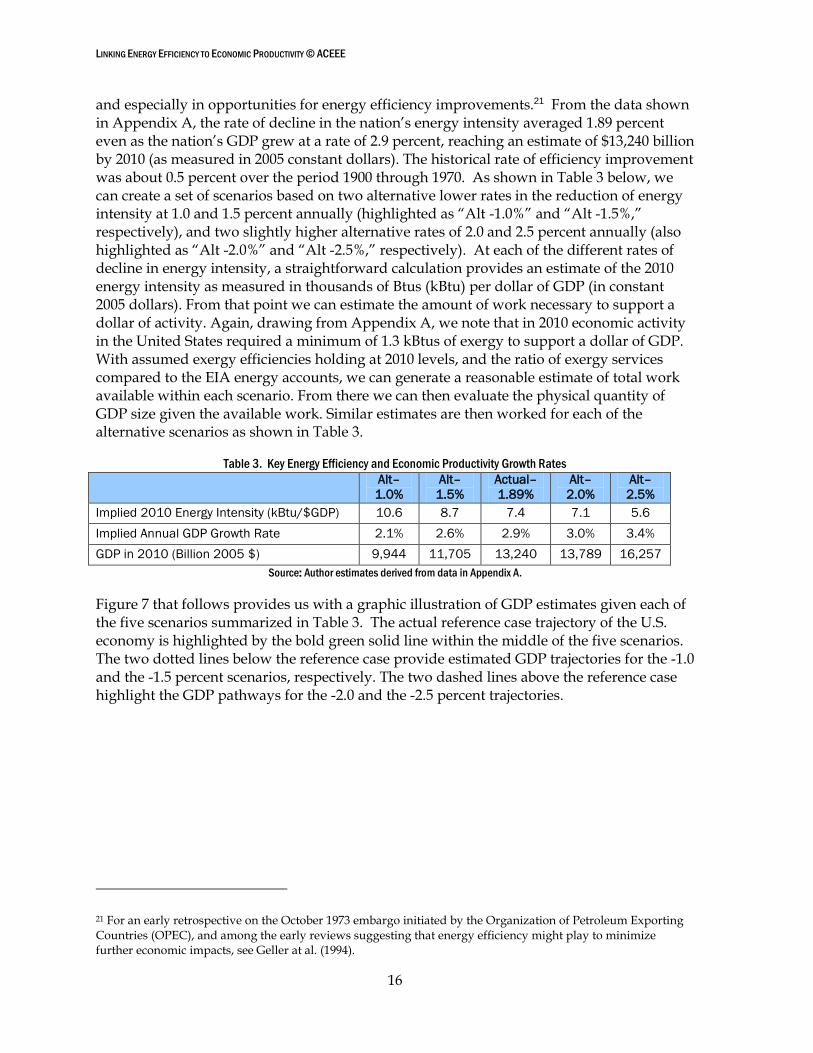
and especially in opportunities for energy efficiency improvements.21 From the data shown in Appendix A, the rate of decline in the nation’s energy intensity averaged 1.89 percent even as the nation’s GDP grew at a rate of 2.9 percent, reaching an estimate of $13,240 billion by 2010 (as measured in 2005 constant dollars). The historical rate of efficiency improvement was about 0.5 percent over the period 1900 through 1970. As shown in Table 3 below, we can create a set of scenarios based on two alternative lower rates in the reduction of energy intensity at 1.0 and 1.5 percent annually (highlighted as “Alt -1.0%” and “Alt -1.5%,” respectively), and two slightly higher alternative rates of 2.0 and 2.5 percent annually (also highlighted as “Alt -2.0%” and “Alt -2.5%,” respectively). At each of the different rates of decline in energy intensity, a straightforward calculation provides an estimate of the 2010 energy intensity as measured in thousands of Btus (kBtu) per dollar of GDP (in constant 2005 dollars). From that point we can estimate the amount of work necessary to support a dollar of activity. Again, drawing from Appendix A, we note that in 2010 economic activity in the United States required a minimum of 1.3 kBtus of exergy to support a dollar of GDP. With assumed exergy efficiencies holding at 2010 levels, and the ratio of exergy services compared to the EIA energy accounts, we can generate a reasonable estimate of total work available within each scenario. From there we can then evaluate the physical quantity of GDP size given the available work. Similar estimates are then worked for each of the alternative scenarios as shown in Table 3.
Table 3. Key Energy Efficiency and Economic Productivity Growth Rates
Alt–
1.0%
Alt–
1.5%
Actual–
1.89%
Alt–
2.0%
Alt–
2.5%
Implied 2010 Energy Intensity (kBtu/$GDP) 10.6 8.7 7.4 7.1 5.6
Implied Annual GDP Growth Rate 2.1% 2.6% 2.9% 3.0% 3.4%
GDP in 2010 (Billion 2005 $) 9,944 11,705 13,240 13,789 16,257
Source: Author estimates derived from data in Appendix A.
Figure 7 that follows provides us with a graphic illustration of GDP estimates given each of the five scenarios summarized in Table 3. The actual reference case trajectory of the U.S. economy is highlighted by the bold green solid line within the middle of the five scenarios. The two dotted lines below the reference case provide estimated GDP trajectories for the -1.0 and the -1.5 percent scenarios, respectively. The two dashed lines above the reference case highlight the GDP pathways for the -2.0 and the -2.5 percent trajectories.
21 For an early retrospective on the October 1973 embargo initiated by the Organization of Petroleum Exporting Countries (OPEC), and among the early reviews suggesting that energy efficiency might play to minimize further economic impacts, see Geller at al. (1994).

LINKING ENERGY EFFICIENCY TO ECONOMIC PRODUCTIVITY
17
Figure 7. Exploring Alternative Rates of Efficiency Improvements
Source: Author estimates drawing from data in Appendix A.
The scenarios in Table 3, and shown in Figure 7, provide a reasonable estimate of the physical capacity to support economic activity. While exergy services both activate and animate capital and labor, it still requires both price and policy signals (or lack thereof) to drive a given result. At the same time all values fall within the historical range of past trajectories and provide a useful backdrop to understand the contribution of energy efficiency to the nation’s economic well-being—whether mapped out as an annual rate of energy efficiency improvements, or as the rate of exergy efficiency and the resulting physical capacity to deliver useful work within the economic process. The bottom line remains clear—the historical rate of energy efficiency improvement has enabled the U.S. economy to move ahead. Had the U.S. economy moved above the historical 1.9 percent rate of efficiency improvement to as much as a 2.5 percent rate, the potential GDP might have grown as much as 3.4 percent annually and been perhaps $3 trillion larger than otherwise
LINKING ENERGY EFFICIENCY TO ECONOMIC PRODUCTIVITY © ACEEE
18
achieved in 2010.22 Similarly, had the rate of improvement fallen closer to 1.0 or 1.5 percent, the economy would likely be much less robust than today.23
With the retrospective look at how useful work and a greater emphasis on energy services might have either constrained or enabled a lesser or greater prosperity, we might also look to the future for possible insights in that regard as well. The projections from the Energy Information Administration are already beginning to drop with respect to early projections of the nation’s economy. In the AEO 2011, for example, the economy was projected to increase by about 2.7 percent between 2010 and 2035 (EIA 2012a, the latest year available for a forecast in 2011). The most recent projection of the AEO 2013 suggests, instead, economic activity that will weaken to 2.5 percent by 2035. This latest projection also carries forward to 2040 with the same 2.5 percent annual growth rate (EIA 2013b). But this assumes a comparable (though slightly higher) rate of conventional energy efficiency improvement (that is, a decline in the number of “commodity Btus” per dollar of economic activity). The preliminary evidence from Table 1 suggests that the GDP growth rate might be more like 2.3 percent annually through 2040.
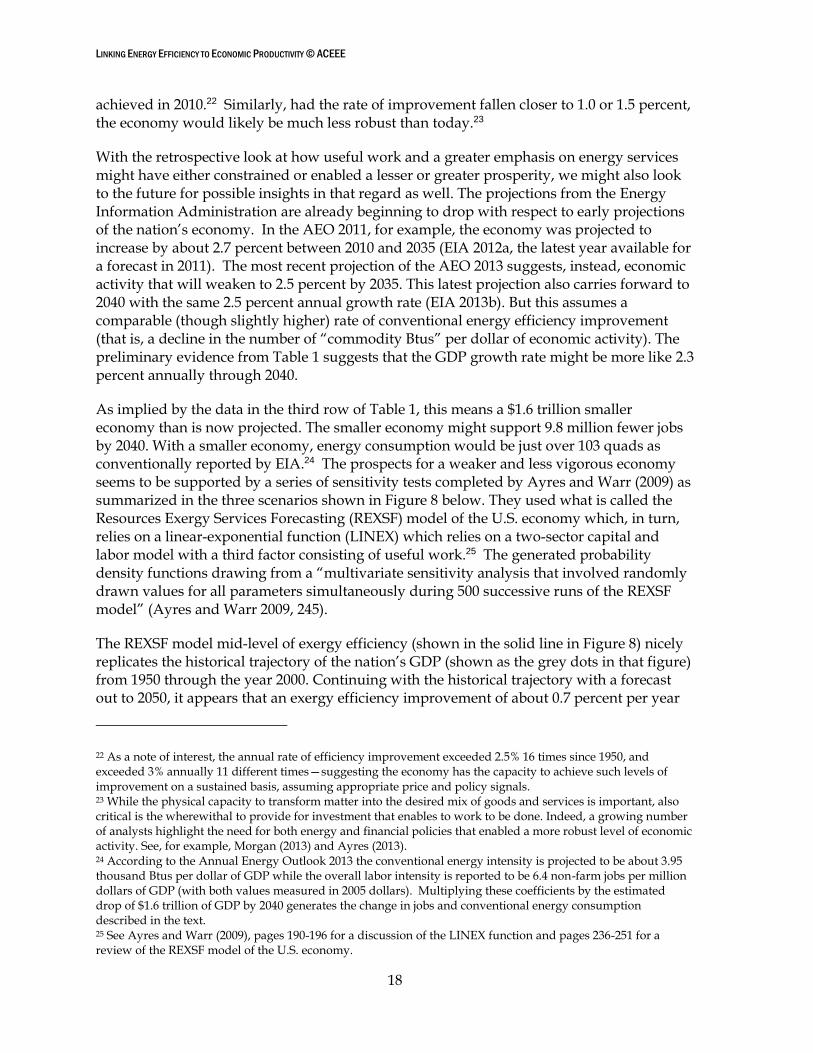
As implied by the data in the third row of Table 1, this means a $1.6 trillion smaller economy than is now projected. The smaller economy might support 9.8 million fewer jobs by 2040. With a smaller economy, energy consumption would be just over 103 quads as conventionally reported by EIA.24 The prospects for a weaker and less vigorous economy seems to be supported by a series of sensitivity tests completed by Ayres and Warr (2009) as summarized in the three scenarios shown in Figure 8 below. They used what is called the Resources Exergy Services Forecasting (REXSF) model of the U.S. economy which, in turn, relies on a linear-exponential function (LINEX) which relies on a two-sector capital and labor model with a third factor consisting of useful work.25 The generated probability density functions drawing from a “multivariate sensitivity analysis that involved randomly drawn values for all parameters simultaneously during 500 successive runs of the REXSF model” (Ayres and Warr 2009, 245).
The REXSF model mid-level of exergy efficiency (shown in the solid line in Figure 8) nicely replicates the historical trajectory of the nation’s GDP (shown as the grey dots in that figure) from 1950 through the year 2000. Continuing with the historical trajectory with a forecast out to 2050, it appears that an exergy efficiency improvement of about 0.7 percent per year
22 As a note of interest, the annual rate of efficiency improvement exceeded 2.5% 16 times since 1950, and exceeded 3% annually 11 different times—suggesting the economy has the capacity to achieve such levels of improvement on a sustained basis, assuming appropriate price and policy signals. 23 While the physical capacity to transform matter into the desired mix of goods and services is important, also critical is the wherewithal to provide for investment that enables to work to be done. Indeed, a growing number of analysts highlight the need for both energy and financial policies that enabled a more robust level of economic activity. See, for example, Morgan (2013) and Ayres (2013). 24 According to the Annual Energy Outlook 2013 the conventional energy intensity is projected to be about 3.95 thousand Btus per dollar of GDP while the overall labor intensity is reported to be 6.4 non-farm jobs per million dollars of GDP (with both values measured in 2005 dollars). Multiplying these coefficients by the estimated drop of $1.6 trillion of GDP by 2040 generates the change in jobs and conventional energy consumption described in the text. 25 See Ayres and Warr (2009), pages 190-196 for a discussion of the LINEX function and pages 236-251 for a review of the REXSF model of the U.S. economy.
LINKING ENERGY EFFICIENCY TO ECONOMIC PRODUCTIVITY
19
may support a growing GDP through about the year 2035. After that period, however, the trend may translate into a slumping economy. At the same time, recall the 30-year historical average of a 0.42 percent exergy efficiency improvement over the years 1980 to 2010 in Table 2. This lower rate of improvement forms the core of the low efficiency scenario shown in Figure 8 (the lower dotted line). If exergy efficiency continues at roughly that same historical rate, that lower degree of improvement may be insufficient to support a growing economy with a possibility of a declining size in the U.S. economy after the present period of activity. On the other hand, shifting exergy efficiency to a higher 1.2 percent rate of improvement might support a more robust 2.2 to 2.6 percent of GDP growth.
Figure 8. Historical and Forecasted GDP for Alternative Rates of U.S. Exergy Efficiency
Source: Ayres and Warr (2009), Figure 8.12
From Figure 8 it seems that pushing the right mix of investments, infrastructure improvements and systems efficiencies, as suggested by Laitner et al. (2012), could easily nudge the nation’s exergy efficiency to about 2.4 times today’s level.26 In that case, GDP would expand to as much as 3.1 percent per year, boosting economic activity to almost $5.7 trillion more than the 2.48 percent standard reference case assumptions now projected for the year 2040 (EIA 2013b). Furthermore, in this case, employment would expand by about 12 million more jobs, with a total difference of 16 million total jobs compared to the possible 2.3 percent annual growth rate. Even more interesting, total energy (exergy) use could
26 As noted in the data table for Appendix A, the current economy is about 13.9% exergy-efficient. With the appropriate investments in new technologies, systems, and infrastructure, the analysis in Laitner et al. (2012) indicates that the level of efficiency might increase to about 34% by 2040. That increase is 2.4 times the current level.
LINKING ENERGY EFFICIENCY TO ECONOMIC PRODUCTIVITY © ACEEE
20
remain essentially flat over the next 30 years—even as the development of a more robust economy is ensured.
5. Energy in the Larger Context
Most observers of U.S. energy policy might think of energy efficiency as a useful tool to smartly manage the growth of energy consumption. They might also see it as a cost-effective means to ease our transition into a post-carbon world. And yes, the evidence does support both of these notions (Laitner 2009a, 2009b). Yet, as this report references in the earlier discussion, there is also emerging evidence which demonstrates that energy efficiency—especially when understood as exergy efficiency—plays a more critical role within the economic process than is generally understood. This section explores the broader potential for the quantities of energy efficiency improvements and then provides a preliminary look at the historical evidence to understand the role of energy prices, policies and major events as they might shape greater opportunities for energy efficiency improvements.
5.1 ENERGY QUANTITIES AND EFFICIENCY OPPORTUNITIES
Building on the work of Georgescu-Roegen (1971), and very much in the tradition of Kneese et al. (1971), Hall et al. (1992), Kümmel (2011) and others, Robert U. Ayres and Benjamin Warr (2009) document the critical link in the U.S. economy between overall productivity and the declining cost of energy-related services. Indeed, their analysis compels a significantly greater attention to the significant role of energy productivity in maintaining a robust economy. In short, energy efficiency (more correctly, exergy efficiency) should be seen as a critical economic resource; and if we take seriously our responsibility to the future, the issue demands a more informed dialogue, a greater level of innovation, and a more accelerated investment and action than we previously might have envisioned.
Historical evidence indicates that exergy efficiency has already contributed greatly to the growth of our economy. Since 1970, the U.S. economy has more than tripled in size. Notably, however, roughly three-quarters of the new demand for exergy services that was necessary to support this expansion was met through significant improvements in the exergy efficiency, while only one-quarter of the new demand required the development of new energy supplies (Ehrhardt-Martinez and Laitner 2008, and updated by Laitner 2013). As such, exergy efficiency can be characterized as the farthest-reaching, least-polluting, and fastest-growing energy success story since 1970 (and before). In essence, exergy efficiency is the cost-effective investment “in the energy we don’t use to produce our nation’s goods and services.” Despite these critical contributions, however, the importance of exergy efficiency has remained largely invisible and measures of efficiency are typically absent from today’s policy models.
The good news is that the historical contributions of exergy efficiency represent only a small fraction of a much larger resource. While efficiency has provided the equivalent of ~300 billion barrels of oil equivalent for use in our economy since 1970 (with new supply kicking in perhaps less than120 billion barrels in that same period of time), studies of the potential contributions of efficiency suggests that current efficiency gains reflect only the tip of the

LINKING ENERGY EFFICIENCY TO ECONOMIC PRODUCTIVITY
21
full economic potential to meet future energy-related demands.27 Indeed, Ayres and Warr (2009), Laitner et al. (2009) and Ayres and Ayres (2010) suggest that unless the United States redirects the annual investment streams toward more efficient infrastructures, facilities, and equipment, the economy may support significantly fewer jobs in a substantially less robust economy in the next decade or two.
5.2 ENERGY PRICES, POLICIES, AND EVENTS
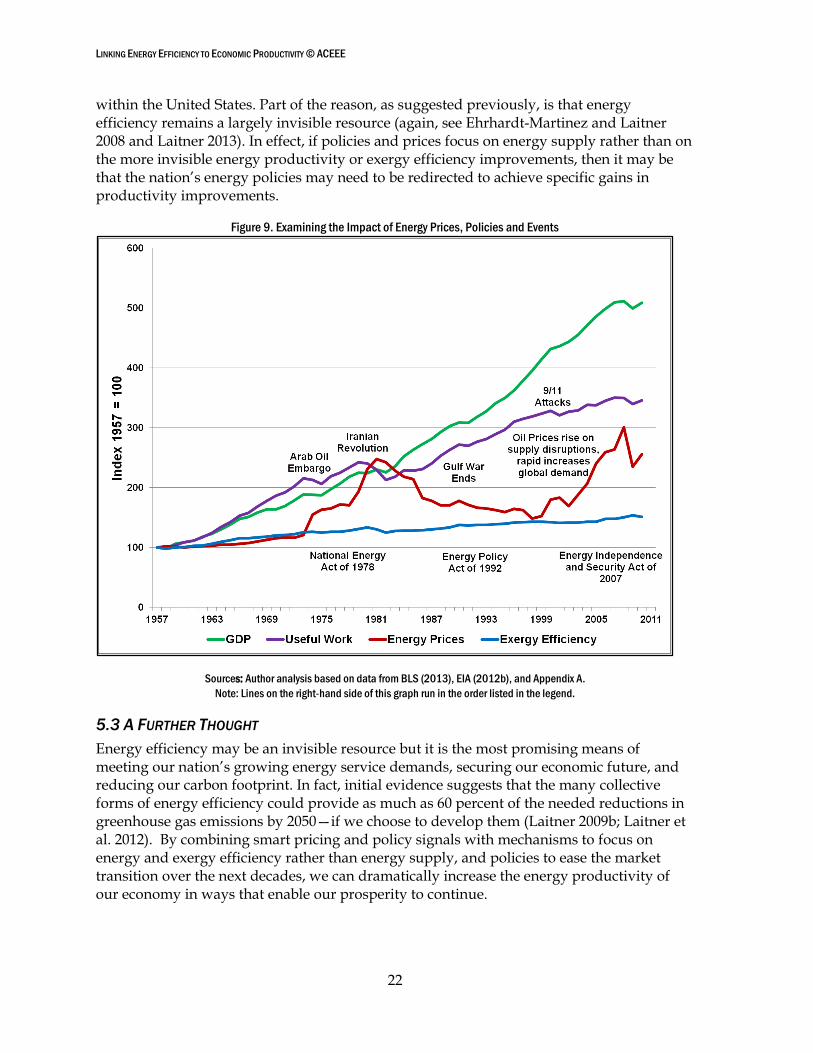
Several measures are needed to redirect current and future investments in more productive directions. In general, the effort will require that we step outside the usual economic modeling framework of only “getting the prices right,” and instead adopt an approach that also includes smart collaborations, thoughtful policies, technological innovations, and wide-spread participation so that we might dramatically expand productive investments and create large systematic exergy efficiency improvements. There are two critical aspects in this last regard. First, yes, we need a clear, persistent price and policy signal that grows over time (Burtraw and Woerman 2013). This will enable consumers, businesses and markets to better determine the optimal investment patterns that catalyze further productivity gains. Second, we require improved policies, programs, and research & development mechanisms that complement the price signal and enable the market to more easily adjust to both the price and the policy signals (Hanemann 2010; Hanson and Laitner 2004). With that perspective we can turn to Figure 9 that follows, to examine—at least in a preliminary way—the historical record of prices, policies and events.
The chart pulls in three elements over the period 1957 to 2010. The first element is an index of real energy prices, real GDP, quads of useful work, and improvements in exergy efficiency. With each index beginning at 100 in 1957, real energy prices and exergy efficiency improvements show little real change over the first 16 years.28 Both useful work and GDP increase in a steady way through 1973. At this point the second element—a set of key political events—begins to shape the trends as the 1973-1974 Arab Oil Embargo impacts the real cost of energy. Congress passed the National Energy Act in 1978. The index of real energy prices first peaked at 248 in 1981 and then dropped steadily, reaching a post-1957 low of just under 300 in 1998. This appears to be partly in response to a variety of new legislation as the Energy Policy Act of 1992, the End of the Gulf War, the Saudis abandoning their “swing producer” role and the 1997 Asian economic crisis. At the same time, a series of events as the 9/11 attacks, rising global demand for energy (especially for oil), and constrained capacity begin driving energy prices up to a new index of about 300 in 2008.
There are clearly other events, technological breakthroughs, and market innovations that are not captured in the different policies and events shown in Figure 9. But what may be especially interesting is that neither energy prices nor policies and political events appear to have impacted the increase in useful work or the rate of improvement in exergy efficiency
27 Once more we can reference Interlaboratory Working Group (2000), APS (2008), AEF (2009), Harvey (2009), InterAcademy Council (2007), Laitner (2009a, 2009c), Cambridge Systematics (2009), McKinsey (2009, 2010), Von Weizäcker et al. (2009), Lovins et al. (2011), and Laitner et al. (2012), among many other assessments. 28 The chart is driven by the energy cost survey data first available from BLS (2013) in 1957. Here, energy price refer to a hybrid Consumer Energy Price Index (BLS 2013) shaped by the real cost of energy that is, in turn, based on data from the Annual Energy Review (EIA 2012b).
LINKING ENERGY EFFICIENCY TO ECONOMIC PRODUCTIVITY © ACEEE
22
within the United States. Part of the reason, as suggested previously, is that energy efficiency remains a largely invisible resource (again, see Ehrhardt-Martinez and Laitner 2008 and Laitner 2013). In effect, if policies and prices focus on energy supply rather than on the more invisible energy productivity or exergy efficiency improvements, then it may be that the nation’s energy policies may need to be redirected to achieve specific gains in productivity improvements.
Figure 9. Examining the Impact of Energy Prices, Policies and Events
Sources: Author analysis based on data from BLS (2013), EIA (2012b), and Appendix A.
Note: Lines on the right-hand side of this graph run in the order listed in the legend.
5.3 A FURTHER THOUGHT
Energy efficiency may be an invisible resource but it is the most promising means of meeting our nation’s growing energy service demands, securing our economic future, and reducing our carbon footprint. In fact, initial evidence suggests that the many collective forms of energy efficiency could provide as much as 60 percent of the needed reductions in greenhouse gas emissions by 2050—if we choose to develop them (Laitner 2009b; Laitner et al. 2012). By combining smart pricing and policy signals with mechanisms to focus on energy and exergy efficiency rather than energy supply, and policies to ease the market transition over the next decades, we can dramatically increase the energy productivity of our economy in ways that enable our prosperity to continue.
LINKING ENERGY EFFICIENCY TO ECONOMIC PRODUCTIVITY
23
6. Recommendations for Data Analysis and Policy Implications
There is compelling evidence that the nation’s economy may be growing weaker and less resilient. The trend is seen in both Figures 1 and 8. The data reflected in Figures 2 through 7 and Tables 1 through 3 all suggest that a less robust economic activity may be attributable to a lagging improvement in exergy efficiency (the conversion of exergy into useful work) as opposed to the traditional measure of efficiency improvement which is usually defined as a decrease in the amount of total energy (exergy) needed to support a dollar of economic activity. These trends are usually not made obvious in the traditional data that are tracked, collected and maintained by federal agencies. Moreover, Figure 9 offers evidence that neither energy prices nor policies have catalyzed significant gains in energy productivity over the past 50 years or more. To that extent, then, two thoughts seem especially relevant. The first is to improve the tracking and reporting of all energy (exergy) forms as they animate capital and labor to give life to economic activity. The second suggests a significant change in the nation’s energy policies—essentially from the current supply side orientation to a focus on an energy-efficiency or energy productivity perspective—as a means to restore a greater level of robustness within the nation’s economy. In addition, there are several other additional analyses referred to in the text that we recap here to help enable next steps in this research.
6.1 THE NEED FOR AN IMPROVED ENERGY/EXERGY ACCOUNTING
The Energy Information Administration does a very good job of tracking the annual consumption of a number of energy-related commodities. This includes things as gallons of oil or gasoline, cubic feet of natural gas, or kilowatt-hours of electricity. Yet, the mere tracking of assorted energy commodities fails to inform us about the actual work that is being enabled within the American economy. Nor does it tell us how to necessarily improve the robustness of economic activity. There are two principal reasons for this.
First, and perhaps most critical, it is exergy that enables both life and economic activity. While there are many reasons to separately track energy, exergy and anergy, if we want to develop more appropriate insights into key elements that sustain a more robust and resilient economy, the ability to understand “energy as work” requires the ability to track the flows and unique contributions of exergy rather than energy. This is because exergy flows would enable us to track the conversion of high-quality energy into useful work—that is, how specific tasks such as shaft power, delivered lighting, and chemical energy are necessary to transform matter into goods and services. Hence, the Ayres-Warr (2009) accounting framework gives us a first look at how an improved capacity to assess productive work as it is enabled by the use of high-quality energy (exergy). In effect, it gives us the ability to better understand how the right insights can lead to more informed policies to sustain the productive use of economic resources. Second, the data now being tracked are incomplete. Among the missing accounts is information related to muscle power and the full array of exergy resources (including agricultural phytomass and the solar resources that enable crops and food to be grown and produced) necessary to maintain that form of activity. While capital is a critical ingredient, one might reasonably argue that it is informed and
LINKING ENERGY EFFICIENCY TO ECONOMIC PRODUCTIVITY © ACEEE
24
directed labor—empowered by exergy resources—which ultimately guides the desired economic outcomes.29
6.2 MOVING AHEAD WITH MORE PRODUCTIVE ENERGY/EXERGY POLICIES
Notwithstanding the insights which are likely to emerge from a thoughtful assessment of the key differences between the conventional tracking of energy, compared to a more proactive examination of energy versus “exergy resources,” the evidence emerges: if we want to develop a resilient and more sustainable economy over the long-term, then we must agree that energy efficiency—more properly, exergy efficiency—matters . . . big time! In short, it is not so much the availability of energy as the productive use of exergy resources that matter. As William Baumol (1989) and his colleagues suggested—and it is neither a Republican nor a Democratic ideal—“For real economic miracles one must look to productivity growth.” And in this case, we might look for productivity growth that is tied to quadrupling or quintupling our existing levels of exergy efficiency (Laitner et al. 2012)—even if it is imperfectly represented by what we have previously referred to as “energy efficiency.”
What might this all mean in terms of practical policy initiatives? We might perhaps answer that question by pointing to the recent release of the Emily Hall Tremaine Foundation’s report, Powering Up America: the Revolution Began Yesterday (2013). That assessment, building on many of the ideas which are ’conservatively’ presented here, suggests that the current revolution is “built on a foundation of cleaner fuels and increased energy productivity.” Or, as we might express that same thinking, but from more of an economic paradigm, we may well again recall the admonition that: “For real economic miracles one must look to productivity growth” (Baumol et al. 1989). In this last regard we might follow the insights from Peters and Waterman (1985), if we are in search of excellence, then we might want to pay attention to the key drivers of a more resilient economy—namely the entrepreneurial spirit that harnesses best practices which, absolutely, include the more productive use of exergy services.
6.3 SUGGESTED NEXT STEPS IN THE ASSESSMENT
The ideas advanced here challenge the conventional accounting of energy consumption. Yet, all of these insights would benefit from a more substantial review and a more rigorous assessment of how the current economic paradigm might be reshaped more positively through an improved grounding in the physical reality of exergy flows which animate and impact the world. For example, several issues were raised and discussed in a preliminary fashion in this report, but further exploration would be useful. These include better understanding why the rate of change for exergy efficiency and the rate of change for traditional energy efficiency (energy use per dollar GDP) differ from each other, sometimes markedly, and better understanding how much of the change in exergy efficiency may be correlated to changes in prices, policies, and other to be determined factors.
29 This comment, of course, omits reference to the more than occasional “Black Swan” that may impact the best intentions of informed and directed labor.

LINKING ENERGY EFFICIENCY TO ECONOMIC PRODUCTIVITY
25
In addition, another useful step might be holding a national workshop or conference that is specifically designed to explore the fundamental aspects of at least four different elements, examining: (i) the critical distinction between energy and exergy; (ii) the completeness of economic accounts as they track the full set of exergy resources which drive economic activity; (iii) the contribution of and distinction between both muscle power and brain power as they enable work; (iv) the difference between the formal market and the shadow economy as they impact the robustness and sustainability of economic activity.
Notwithstanding the further insights which might emerge from a national workshop, or a further and more rigorous assessment of the link between exergy flows and a more robust economy, the evidence underscores one very critical idea—the U.S. economy will be better off by “Thinking Big” about energy productivity. More to the point, if we miss the big gains in energy and exergy efficiency, focusing instead on investments in costlier and riskier new energy resources, we run the risk of a continued weakening of the economy. Yet, the combination of smart pricing and policy signals that focus on energy and exergy efficiency rather than energy supply alone, can increase productivity of our economy in ways that enable our prosperity to continue.

LINKING ENERGY EFFICIENCY TO ECONOMIC PRODUCTIVITY © ACEEE
26
LINKING ENERGY EFFICIENCY TO ECONOMIC PRODUCTIVITY
27
References
[AEF] Committee on America’s Energy Future. 2009. Real Prospects for Energy Efficiency in the United States. Washington, D.C.: National Academies Press.
[APS] American Physical Society. 2008. Energy Future: Think Efficiency. Washington, D.C.: American Physical Society.
Ayres, Robert U. and Benjamin Warr. 2009. The Economic Growth Engine: How Energy and Work Drive Material Prosperity. Northampton, MA: Edward Elgar Publishing, Inc.
Ayres, Robert U. and Edward H. Ayres. 2010. Crossing the Energy Divide: Moving from Fossil Fuel Dependence to a Clean-Energy Future. Upper Saddle River, N.J.: Wharton School Publishing.
Ayres, Robert U. 2013. The Bubble Economy: Is Sustainable Growth Possible? Cambridge, MA: MIT Press (forthcoming)
Baumol, William J., Sue Anne Batey Blackman, and Edward N. Wolff. 1989. Productivity and American Leadership: The Long View. Cambridge, MA: The MIT Press.
Brown, Marilyn A. 2001. “Market Failures and Barriers as a Basis for Clean Energy Policies.” Energy Policy, 29 (14): 1197–207.
[BEA] Bureau of Economic Analysis. 2013. National Economic Accounts. http://www.bea.gov/national/index.htm. Washington, DC: U.S. Department of Commerce.
[BLS] Bureau of Labor Statistics. 2013 Consumer Price Index for Energy. Washington, DC: U.S. Department of Labor.
Bureau of Statistics. 1901, Statistical Abstract of the United States: 1900. Washington, DC: U.S. Department of the Treasury.
Burtraw, Dallas and Matt Woerman. 2013. “Economic Ideas for a Complex Climate Policy Regime.” Washington, DC: Resources for the Future.
Cambridge Systematics. 2009. Moving Cooler: An Analysis of Transportation Strategies for Reducing Greenhouse Gas Emissions. Prepared for the Moving Cooler Steering Committee. Washington, D.C.: Urban Land Institute.
Cleveland, Cutler J., Robert Costanza, C.A.S. Hall, and Robert K. Kaufman. 1984. “Energy and the US Economy: A Biophysical Perspective. Science. 255, pages 890-97
Ehrhardt-Martinez, Karen and John A. “Skip” Laitner. 2008. The Size of the U.S. Energy Efficiency Market: Generating a More Complete Picture. ACEEE Report E083. Washington, DC, American Council for an Energy-Efficient Economy.
LINKING ENERGY EFFICIENCY TO ECONOMIC PRODUCTIVITY © ACEEE
28
[EIA] Energy Information Administration. 2012a. Annual Energy Outlook 2012. DOE/EIA-0383(2012). http://www.eia.gov/forecasts/aeo/er/index.cfm. Washington, D.C.: U.S. Department of Energy.
———. 2012b. Annual Energy Review 2011. DOE/EIA-0384(2012). http://www.eia.doe.gov/aer/. Washington, D.C.: U.S. Department of Energy.
———. 2013a. Short-Term Energy Outlook February 2013. http://www.eia.doe.gov/steo/. Washington, D.C.: U.S. Department of Energy.
———. 2013b. Annual Energy Outlook 2013. DOE/EIA-0383er(2013). http://www.eia.gov/forecasts/aeo/er/index.cfm. Washington, D.C.: U.S. Department of Energy.
Geller, Howard, John DeCicco, Skip Laitner and Christopher Dyson. 1994. “Twenty Years After the Embargo: U.S. Oil Import Dependence and How It Can Be Reduced.” Energy Policy.22 (6): 471-485.
Geller, Howard, Philip Harrington, Arthur H. Rosenfeld, Satoshi Tanishima, and Fridtjof Unander. 2006. “Polices for Increasing Energy Efficiency: Thirty Years of Experience in OECD Countries.” Energy Policy, 34, 556–573.
Georgescu-Roegen, Nicholas. 1971. The Entropy Law and the Economic Process. Chicago, IL: University of Chicago Press.
Hall, Charles A.S., Cutler J. Cleveland, and Robert Kaufmann. 1992. Energy & Resource Quality: The Ecology of the Economic Process. Niwot, CO: The University of Colorado Press.
Hanemann, Michael. 2010. “Cap-and-trade: a sufficient or necessary condition for emission reduction? Oxford Review of Economic Policy, Volume 26, Number 2, 2010, pp. 225–252.
Hanson, Donald A. John A. ‘‘Skip’’ Laitner. 2004. “An integrated analysis of policies that increase investments in advanced energy-efficient/low-carbon technologies.” Energy Economics 26 (2004) 739– 755.
Harvey, L.D. Danny. 2009. “Reducing Energy Use in the Buildings Sector: Measures, Costs, and Examples. Energy Efficiency. (2009) 2:139–163.
Illich, Ivan. 1974. Energy and Equity. London, England: Marion Boyars.
———. 1981. Shadow Work. London, England: Marion Boyars.
InterAcademy Council. 2007. Lighting the Way: Toward a Sustainable Energy Future. Amsterdam, The Netherlands: Royal Netherlands Academy of Arts and Sciences.
[Interlaboratory Working Group] Interlaboratory Working Group on Energy-Efficient and Low-Carbon Technologies. 2000. Scenarios for a Clean Energy Future. Prepared for U.S. Department of Energy, Office of Energy Efficiency and Renewable Energy.

LINKING ENERGY EFFICIENCY TO ECONOMIC PRODUCTIVITY
29
http://www.ornl.gov/ORNL/Energy_Eff/CEF.htm. Oak Ridge, TN: Oak Ridge National Laboratory.
Kneese, Allen V., Robert U. Ayres and Ralph C. d'Arge. 1971. Economics and the Environment: A Materials Balance Approach, Washington, DC: RFF Press.
Kümmel, Reiner. 2011 The Second Law of Economics: Energy, Entropy and the Origins of Wealth, Springer.
Laitner, John A. “Skip.” 2009a. The Positive Economics of Climate Change Policies: What the Historical Evidence Can Tell Us. ACEEE Report E095. Washington, DC, American Council for an Energy-Efficient Economy.
———. 2009b. Climate Change Policy as an Economic Redevelopment Opportunity: The Role of Productive Investments in Mitigating Greenhouse Gas Emissions. ACEEE Report E098. Washington, DC, American Council for an Energy-Efficient Economy.
———. 2009c. “Understanding the size of the energy efficiency resource: Ten policy recommendations to accelerate more productive investments.” Policy and Society 27 (2009) 351–363.
———. 2013a. Calculating the Nation’s Annual Energy Efficiency Investments. ACEEE Report E133. Washington, DC, American Council for an Energy-Efficient Economy.
Laitner, John A. “Skip,” Steven Nadel, Harvey Sachs, R. Neal Elliott, and Siddiq Khan. 2012. The Long-Term Energy Efficiency Potential: What the Evidence Suggests. ACEEE Research Report E104. Washington, DC: American Council for an Energy-Efficient Economy.
Laitner, John A. "Skip," Christopher Poland Knight, and Karen Ehrhardt-Martinez. 2009. The Climate Imperative and Innovative Behavior: Encouraging Greater Advances in the Production of Energy-Efficient Technologies and Services. Washington, DC: American Council for an Energy-Efficient Economy.
Lovins, Amory and the Rocky Mountain Institute. 2011. Reinventing Fire: Bold Business Solutions for the New Energy Era. White River Junction, VT: Chelsea Green Publishing.
[McKinsey] McKinsey & Company. 2009. Unlocking Energy Efficiency in the U.S. Economy. McKinsey & Company.
______. 2010. ”Energy Demand Scenarios.” In Energy Efficiency and the Demand for Energy Services. London, UK: Earthscan Ltd.
Moody’s Analytics. 2012. “U.S. Macro/Financial Forecast Database.” Moody’s Economy.com. May. http://www.economy.com/default.asp. September.
Morgan, Tim. 2013. Perfect storm: Energy, finance and the end of growth. London, UK: Tullett Prebon Group Ltd.
LINKING ENERGY EFFICIENCY TO ECONOMIC PRODUCTIVITY © ACEEE
30
Murphy, David J. and Charles A. S. Hall. 2010. “Year in review—EROI or energy return on (energy) invested.” Annals of the New York Academy of Sciences.
Ocken, Jessica Royer. 2008. “Enabling Analysis.” Synygy Magazine. www.synygymagazine.com.
[OECD] Organisation for Economic Co-operation and Development. 2013. Dataset: Economic Outlook No 93—June 2013—Long-term baseline projections. Paris, France. http://stats.oecd.org/OECDStat_Metadata/ShowMetadata.ashx?Dataset=EO93_LTB&ShowOnWeb=true&Lang=en.
Peters, Thomas J. and Robert H. Waterman. 1985. In Search of Excellence: Lessons from America's Best-Run Companies. Collins Business Essentials, Kindle Edition.
Smil, Vaclav. 1999. Energies: An Illustrated Guide to the Biosphere and Civilization. Cambridge, MA: The MIT Press.
Stern, David I. and Cutler J. Cleveland. 2004. “Energy and Economic Growth.” Working Papers In Economics. Troy, NY: Rensselaer Polytechnic Institute. http://www.economics.rpi.edu/workingpapers/rpi0410.pdf
Tremaine Foundation. 2013. Repowering America: The Revolution Began Yesterday. New Haven, CT: Emily Tremaine Foundation.
Von Weizäcker, Ernst, Karlson ‘Charlie’ Hargroves, Michael H. Smith, Cheryl Desha, and Peter Stasinopoulos. 2009. Factor Five: Transforming the Global Economy through 80% Improvements in Resource Productivity. London, UK: Earthscan.
Weisberg, Jacob. 2010. “What Caused the Economic Crisis?” Slate. http://www.slate.com/articles/news_and_politics/the_big_idea/2010/01/what_caused_the_economic_crisis.single.html.
Woods and Poole. “2013 Regional Projections – United States.” Washington, DC: Woods and Poole Economics, Inc.
LINKING ENERGY EFFICIENCY TO ECONOMIC PRODUCTIVITY
31
Appendix A: Key Population, Economic, and Energy Statistics
This appendix provides in table format selected population, labor, capital, and exergy/energy statistics which provide useful insights into understanding the role of exergy or high-quality energy as it has enabled work to animate economic activity. This compares to the usual tracking of energy as a commodity flow. The exergy data are initially drawn from Ayes and Warr (2009, Appendix B2) for the years 1900, and for 1950 through 2005. Earlier values for the years 1901 through 1949 are also available but are not shown here. The author has extended these values in a highly preliminary through the year 2010 to provide updated trends. The rows for those years are highlighted in light grey to distinguish them from the original data provided by Ayres and Warr.
In the original data set Ayres and Warr reported Gross Domestic Product (GDP) and Capital Stock (sometimes called Fixed Capital) in 1990 International Dollars, or the Geary-Khamis dollar. This is a unit of currency that has the same purchasing power parity that the U.S. dollar had in the United States in 1990. It is based on the concepts of purchasing power parities (PPP) and the international average prices of commodities. See, the United Nations Handbook of the International Comparison Programme (United Nations Statistics Division 1992). For purposes of this report the data were converted to constant 2005 U.S. dollars. Also the original energy units were reported in exajoules, or 1018 joules. In this report the energy data are reported in the equivalent quadrillion (1015) Btus, or simply as quads. Again, the original data reported by Ayres and Warr through 2005 are extended through 2012 using a combination of statistics from the Bureau of Economic Analysis (BEA 2013), Bureau of Labor Statistics (2013) and the Energy Information Administration (EIA 2012b, 2013a).
A total of eight time series data are reported in the table that follows. The first four economic statistics include total U.S. population (in millions of persons), Gross Domestic Product (GDP) in billions of 2005 dollars, capital stock in billions of 2005 dollars, and thousands of labor hours. The three energy and exergy variables are reported in quadrillion Btus or quads while the fourth is an efficiency measure reported as a percentage. Because these are critical data to help establish a more concrete understanding of energy as work, this appendix provides greater detail on the definition of these last four data sets:
Useful Work: This unit draws from concepts in physics more than economics. It is the minimum exergy necessary to carry out the work of transforming matter into the desired goods and services within the U.S. economy for a given year. The unit is reported in quads and includes estimates of muscle power (both human, and especially in the early part of the 20th century, animal power) and the agricultural phytomass and food necessary to sustain that muscle power. It primarily includes, however, high-quality chemical, electrical, and mechanical exergy or exergy services.
EIA Energy Commodity: This is the standard total primary energy reported by the Energy Information Administration. It generally reflects what this author calls formal energy or energy for which there are receipts (as for utility bills) or tax records (as for gasoline consumption) that are used to estimate energy consumption. The data also include estimates of energy consumed as feedstocks which are not necessary to drive work, but which are commodities that are consumed with the economy. Reported in quads, the energy commodity totals are about 75 to 80 percent
LINKING ENERGY EFFICIENCY TO ECONOMIC PRODUCTIVITY © ACEEE
32
of the exergy that is actually used (not necessarily useful) in driving or supporting economic activity.
Ayres-Warr Exergy: This unit draws from the definition of exergy which in physics refers to the potential for work, or as Ayres and Warr (2009) characterize it, “the maximum amount of work that can theoretically be recovered from a system as it approaches equilibrium with its surroundings.” While this unit is still an unfamiliar term, except to engineers, chemists or physicists, this report adopts the convention of referencing total exergy (or total raw energy), referenced here as Ayres-Warr Exergy. See also Kümmel (2011) for a further discussion. The time series data provided by Ayres and Warr (2009) in their own Appendix B includes what the authors refer to as human/animal contributions to exergy consumption as well biomass, other renewable energies, nuclear energy and the fossil fuels. It does not include feedstock consumption since we are interested in understand economic activity rather than the commodities and services that flow from that economic activity or work. Also reported in quads, in general the Ayres-Warr Exergy (again, mistakenly referred to as energy) has been about 25 to 30 percent greater than the commodity values reported by the Energy Information Administration.
Exergy Efficiency: This data is a reported calculation of the conversion of exergy consumption to useful energy or work. In effect it is a ratio of Useful Work to Ayres-Warr Exergy (both reported in Quads), reported here as a percentage.

LINKING ENERGY EFFICIENCY TO ECONOMIC PRODUCTIVITY
33
Table A-1. Key Population, Capital, and Energy Statistics
Year
(A) Population
Millions
(B) GDP
Billion 2005 $
(C) Capital Stock Billion 2005 $
(D) Labor Hours Thousands
(E) Useful Energy Quads
(F) EIA Energy
Quads
(G) Ayres-Warr
Energy-Quads
(H) Useful Energy
Efficiency 1900 76.4 431 2,009 41,624,200 0.4 9.6 14.8 2.5%
1950 152.3 2,006 7,187 122,010,000 3.6 34.6 45.6 8.0%
1951 154.9 2,161 7,480 128,936,000 3.9 37.0 48.3 8.1%
1952 157.6 2,244 7,774 130,225,000 4.0 36.7 48.2 8.3%
1953 160.2 2,347 8,106 131,695,000 4.2 37.7 49.3 8.6%
1954 163.0 2,332 8,403 127,837,000 4.1 36.6 48.3 8.4%
1955 165.9 2,500 8,759 132,056,000 4.6 40.2 52.3 8.9%
1956 168.9 2,550 9,077 134,253,000 4.8 41.8 54.2 8.9%
1957 172.0 2,601 9,387 133,038,000 5.0 41.8 54.4 9.2%
1958 174.9 2,578 9,632 128,388,000 4.9 41.6 54.4 9.0%
1959 177.8 2,763 9,970 133,073,000 5.2 43.5 56.5 9.3%
1960 180.7 2,831 10,288 134,030,000 5.4 45.1 58.4 9.3%
1961 183.7 2,897 10,600 133,119,000 5.6 45.7 59.3 9.5%
1962 186.5 3,072 10,974 136,464,000 5.9 47.8 61.7 9.5%
1963 189.2 3,207 11,383 137,552,000 6.2 49.6 63.9 9.8%
1964 191.9 3,392 11,846 141,126,000 6.7 51.8 66.4 10.1%
1965 194.3 3,610 12,373 145,977,000 7.1 54.0 68.9 10.3%
1966 196.6 3,845 12,933 151,085,000 7.7 57.0 72.3 10.6%
1967 198.7 3,943 13,452 152,752,000 7.9 58.9 74.4 10.6%
1968 200.7 4,133 14,004 155,517,000 8.5 62.4 78.3 10.8%
1969 202.7 4,262 14,552 159,301,000 8.9 65.6 81.9 10.9%
1970 205.1 4,270 15,016 156,510,000 9.4 67.8 84.4 11.1%
1971 207.7 4,413 15,514 155,821,000 9.6 69.3 86.1 11.2%
1972 209.9 4,648 16,095 160,121,000 10.1 72.7 90.0 11.3%
1973 211.9 4,917 16,745 165,239,000 10.8 75.7 93.4 11.6%
1974 213.9 4,890 17,268 165,842,000 10.7 74.0 91.7 11.6%
1975 216.0 4,880 17,675 161,091,000 10.3 72.0 89.8 11.5%
1976 218.0 5,141 18,167 165,755,000 11.0 76.0 94.3 11.6%
1977 220.2 5,378 18,762 171,589,000 11.3 78.0 96.7 11.7%
1978 222.6 5,678 19,452 179,664,000 11.7 80.0 99.0 11.8%
1979 225.1 5,855 20,151 184,524,000 12.1 80.9 100.2 12.1%
1980 227.2 5,839 20,691 184,008,000 12.0 78.1 97.7 12.3%
1981 229.5 5,987 21,215 184,394,000 11.5 76.2 95.9 12.0%
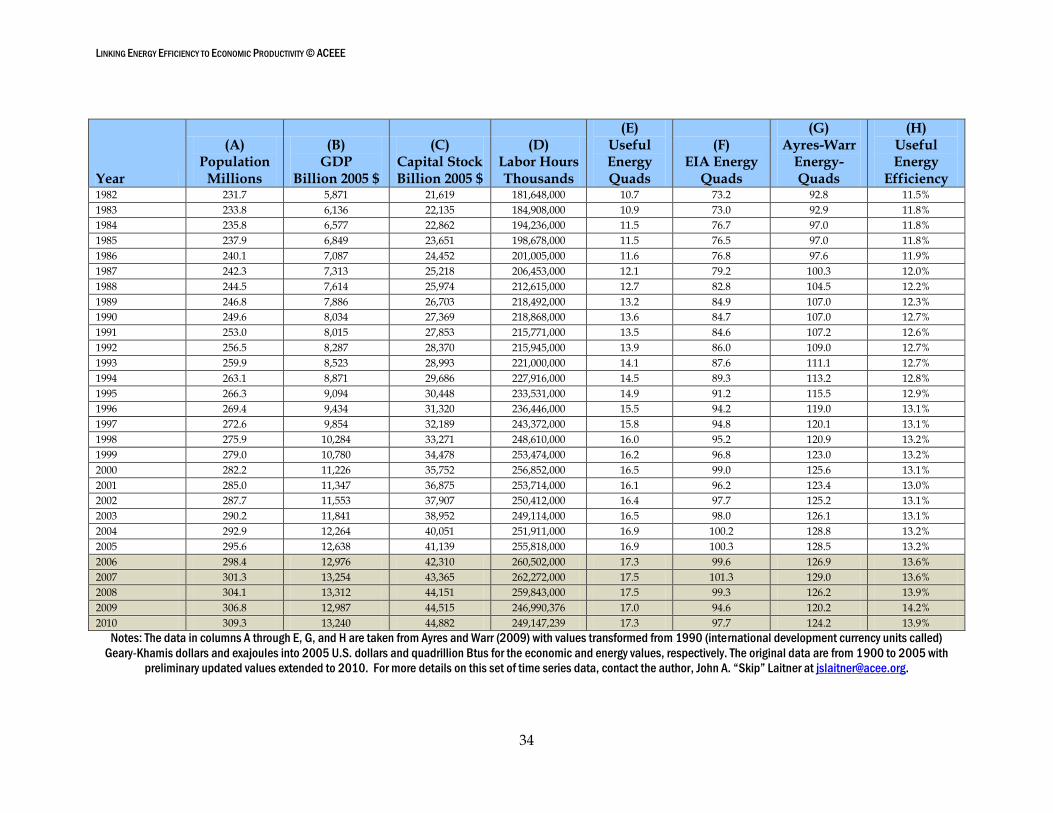
LINKING ENERGY EFFICIENCY TO ECONOMIC PRODUCTIVITY © ACEEE
34
Year
(A) Population
Millions
(B) GDP
Billion 2005 $
(C) Capital Stock Billion 2005 $
(D) Labor Hours Thousands
(E) Useful Energy Quads
(F) EIA Energy
Quads
(G) Ayres-Warr
Energy-Quads
(H) Useful Energy
Efficiency 1982 231.7 5,871 21,619 181,648,000 10.7 73.2 92.8 11.5%
1983 233.8 6,136 22,135 184,908,000 10.9 73.0 92.9 11.8%
1984 235.8 6,577 22,862 194,236,000 11.5 76.7 97.0 11.8%
1985 237.9 6,849 23,651 198,678,000 11.5 76.5 97.0 11.8%
1986 240.1 7,087 24,452 201,005,000 11.6 76.8 97.6 11.9%
1987 242.3 7,313 25,218 206,453,000 12.1 79.2 100.3 12.0%
1988 244.5 7,614 25,974 212,615,000 12.7 82.8 104.5 12.2%
1989 246.8 7,886 26,703 218,492,000 13.2 84.9 107.0 12.3%
1990 249.6 8,034 27,369 218,868,000 13.6 84.7 107.0 12.7%
1991 253.0 8,015 27,853 215,771,000 13.5 84.6 107.2 12.6%
1992 256.5 8,287 28,370 215,945,000 13.9 86.0 109.0 12.7%
1993 259.9 8,523 28,993 221,000,000 14.1 87.6 111.1 12.7%
1994 263.1 8,871 29,686 227,916,000 14.5 89.3 113.2 12.8%
1995 266.3 9,094 30,448 233,531,000 14.9 91.2 115.5 12.9%
1996 269.4 9,434 31,320 236,446,000 15.5 94.2 119.0 13.1%
1997 272.6 9,854 32,189 243,372,000 15.8 94.8 120.1 13.1%
1998 275.9 10,284 33,271 248,610,000 16.0 95.2 120.9 13.2%
1999 279.0 10,780 34,478 253,474,000 16.2 96.8 123.0 13.2%
2000 282.2 11,226 35,752 256,852,000 16.5 99.0 125.6 13.1%
2001 285.0 11,347 36,875 253,714,000 16.1 96.2 123.4 13.0%
2002 287.7 11,553 37,907 250,412,000 16.4 97.7 125.2 13.1%
2003 290.2 11,841 38,952 249,114,000 16.5 98.0 126.1 13.1%
2004 292.9 12,264 40,051 251,911,000 16.9 100.2 128.8 13.2%
2005 295.6 12,638 41,139 255,818,000 16.9 100.3 128.5 13.2%
2006 298.4 12,976 42,310 260,502,000 17.3 99.6 126.9 13.6%
2007 301.3 13,254 43,365 262,272,000 17.5 101.3 129.0 13.6%
2008 304.1 13,312 44,151 259,843,000 17.5 99.3 126.2 13.9%
2009 306.8 12,987 44,515 246,990,376 17.0 94.6 120.2 14.2%
2010 309.3 13,240 44,882 249,147,239 17.3 97.7 124.2 13.9%
Notes: The data in columns A through E, G, and H are taken from Ayres and Warr (2009) with values transformed from 1990 (international development currency units called)
Geary-Khamis dollars and exajoules into 2005 U.S. dollars and quadrillion Btus for the economic and energy values, respectively. The original data are from 1900 to 2005 with
preliminary updated values extended to 2010. For more details on this set of time series data, contact the author, John A. “Skip” Laitner at [email protected].