Embed Size (px)
Citation preview

1
Linkages with multinationals and domestic firm performance:
The role of assistance for local firms*
Holger Görga and Adnan Sericb
aKiel Institute for the World Economy, University of Kiel and Tuborg Research Centre for Globalisation and Firms at Aarhus University
bUNIDO
Abstract
This paper uses firm level data for 19 African countries to look at the link between domestic firms’ business relationship with multinationals and their performance in terms of innovation and productivity. Quite uniquely, we also evaluate the importance of support received by the domestic firm, either from the government or the multinational business partner, for this link. Overall, our data analysis shows that for the average domestic firm, supplying to a foreign multinational in the country is positively associated with product innovation. Buying from a multinational is positively associated with labour productivity. These results are independent of any type of support from the government or multinationals. By contrast, we also find that domestic firms’ process innovation activity is only positively associated with supplying a multinational if the firm also receives assistance from the government or multinational. Furthermore, we find that supplying a multinational is only positively associated with domestic firms’ productivity if the firm received technology transfer from the multinational customers.
this version: March 2015
* We are very grateful to Donnachad Krüger for excellent research assistance and seminar participants at UNIDO and the Kiel Institute, in particular Aoife Hanley, Peter Nunnenkamp, Lucia Perez Villar as well as two anonymous referees for very helpful comments on an earlier draft.

2
1 Introduction
There is considerable interest in the international trade and development literature as to whether domestic firms can benefit from the presence of foreign multinationals located in their country. The argument goes that domestic firms may “learn” (in the broadest sense) from such multinationals and subsequently improve their productivity. Such effects are commonly referred to as “productivity spillovers”. They may occur since foreign multinationals have access to superior technology which can dissipate to domestic firms (Görg and Greenaway, 2004).
While much of the early literature looked specifically for within-industry spillovers (e.g., Blomström and Persson, 1983, Liu et al., 2000), the current consensus is that vertical linkages through customer-supplier relationships with multinationals may generate larger effects (Havranek and Irsova, 2011). These links can take two forms. Either a domestic firm may supply inputs to a multinational (termed a multinational’s “backward linkage”) or a domestic firm may purchase inputs from a multinational located in the host country (a “forward linkage”).1 Many countries have actively attracted foreign direct investment (FDI) with fiscal incentives, hoping that in return domestic firms benefit from their business relationship with multinational customers or suppliers.
We contribute to this literature using unique firm level data for 19 Sub-Saharan African countries from the Africa Investor Survey 2010 administered by UNIDO. We consider a domestic firm’s performance in terms of productivity, product innovation, and process innovation, and investigate whether the firm’s customer-supplier relationship with a multinational in the country is related to these variables.2 We also examine whether this relationship (if any) is mitigated by “assistance” received by the domestic firm from either the government (through Investment Promotion Agencies) or the multinational customer/supplier.
This paper adds to this literature in a number of ways. Firstly, the lion’s share of the literature on vertical spillovers measures these using industry level proxies for vertical linkages derived from aggregate input-output tables (see, for example, Driffield et al., 2002, Javorcik, 2004, Barrios et al., 2011). Hence, they cannot pin-point which domestic firms do have linkages and which do not; they only determine the strength of an industry’s linkage. This, therefore, is unable to account for important firm level heterogeneity between firms with and without linkages. We conduct an empirical study where we have detailed information at the level of the firm on whether domestic firms engage in vertical linkages (measured in terms of percentage of output sold to and bought from multinationals, respectively) with foreign owned multinationals in the country. As far as we are aware, this is one of the first papers to consider such vertical linkages at the firm level using large scale firm level data sets.3
1 Giroud (2012), Giroud and Scott-Kennel (2009) and Morris et al. (2012) provide comprehensive conceptual frameworks within which to interpret the link between linkages and productivity spillovers. 2 This paper focuses on productivity spillovers. A small number of papers have also looked at a related issue, namely export spillovers or market-access spillovers, i.e., the question whether multinationals can foster the export activity of domestic firms (Görg and Greenaway, 2004). A detailed analysis of this is beyond the scope of the current paper. 3 Godart and Görg (2013), Javorcik and Spatareanu (2009) and Gorodnichenko et al. (2007) consider the backward linkage at the firm level, i.e., whether or not a domestic firm supplies a multinational. Their measure of backward linkage (supplies to a multinational) is similar to ours. However, they do not have firm level information on forward linkages through buying from a multinational. Amendolagine et al. (2013), using the Africa Investor Survey, analyse which factors determine the strength of a multinational firm’s backward linkage.

3
Secondly, with the help of the firm level data we focus on the exact mechanisms through which linkages may take place, and the importance for domestic firms of assistance received from either the government or the multinational customers/suppliers themselves. Hence, we can look at the importance of policy factors in determining the strength of spillovers. Specifically, we investigate whether the relationship between firm performance and the customer / supplier relation with multinationals depends on whether (i) the domestic firm received investment support services from the government, or (ii) whether they received assistance from a multinational customer in terms of workforce upgrading or technology transfer. The focus on these policy variables and their link to the strength of spillovers is another novelty of our paper. From a policy point of view, knowledge about the importance of the policy variables in determining spillovers may be important for shaping future policies towards inward FDI.
The paper proceeds as follows. In Section 2 we provide some background on FDI in Africa and evidence on spillovers. Section 3 describes the data, while the econometric analysis is contained in Sections 4 and 5. We provide some concluding comments in Section 6.
2 Background
While the African continent still attracts a relatively small share of world-wide FDI, recent developments mean that FDI is becoming more relevant for the economies. In 2009, the global share of FDI stock in Africa was a mere 2 percent with a net flow of FDI to the continent amounting to approximately 46 billion US$ per year over the period 2009 to 2011. Although still of limited size, the inflows are becoming less and less concentrated compared to the recent past, both geographically as well as sectorally. In fact, less than a decade ago the five main receiving countries accounted for approximately 90 percent of total inflows, in 2011 this percentage has fallen to approximately 50 percent with rising share of FDI aimed at non-extractive sectors such as light manufacturing and services (UNCTAD 2012). The increase in the size (and geographical scope) of the flows is also due to a significant expansion of South-South FDI, in particular intra-African FDI flows along with those from emerging economies such as China, India and other Asian countries. In 2011, for the first time greenfield FDI inflows originating from other developing economies were higher than those originating from developed economies (42,6 versus 38,9 billions of US $; UNCTAD 2012).
This significance of such FDI for generating linkages with domestic firms in Sub-Saharan Africa has been discussed in policy reports and academic publications (e.g., Hansen, 2014, Amendolagine et al., 2013, UNECA, 2013, UNCTAD, 2010).4 While it is clear from this literature that linkages are increasingly generated, comprehensive evidence from large-scale firm level data sets as to whether linkages also translate into productivity spillovers to domestic firms in African countries is still sparse. This is, not least, due to the scarcity of quality firm level data. Exceptions are studies by Bwalya (2006), who analyzes firm level panel data on manufacturing firms in Zambia and finds evidence for spillovers operating through backward linkages, but not for within-industry spillovers. Waldkirch and Ofosu (2010) use firm level for Ghana and find no evidence for positive productivity effects through inward FDI. By contrast, Görg and Strobl (2005) using matched employer-employee data for Ghana
4 There has been a large-scale joint research project on “Making the most of Commodities” which also focused on linkages generation in various sectors in Sub-saharan African countries. See, for example, Kaplan (2011) for evidence on spillovers in the extractives industries.
4
find positive productivity effect for domestic firms through movement of workers from multinationals to domestic firms.5 Boly et al. (2012), using also data from the African Investor Survey, use information on firms’ self-assessment of the impact of foreign affiliates’ presence on their overall business performance. They find, inter alia, that larger, newly established and more productive domestic firms are more likely to benefit from interactions with foreign affiliates.
In an overview paper, Morrisey (2012) reviews the situation in Sub-Saharan Africa regarding FDI and concludes that a proper industrial policy is needed to allow for FDI positive externalities to the domestic sector. He states that further development of absorptive capacity of firms through learning processes is key for the materialization of spillovers from FDI. The importance of domestic firms’ absorptive capacity for spillover benefits is also highlighted in a number of theoretical and empirical studies, see Kokko (1994), Glass and Saggi (1998), Girma (2005).
In order to build up such absorptive capacity, firms may not only need to rely on their own efforts, but they may also benefit from assistance from the outside, here in particular the government and their multinational business partner. Our empirical analysis picks up on this point and we investigate whether assistance to domestic firms that is related to the build-up of absorptive capacity has a role to play for the performance of domestic firms.
3 Description of the data
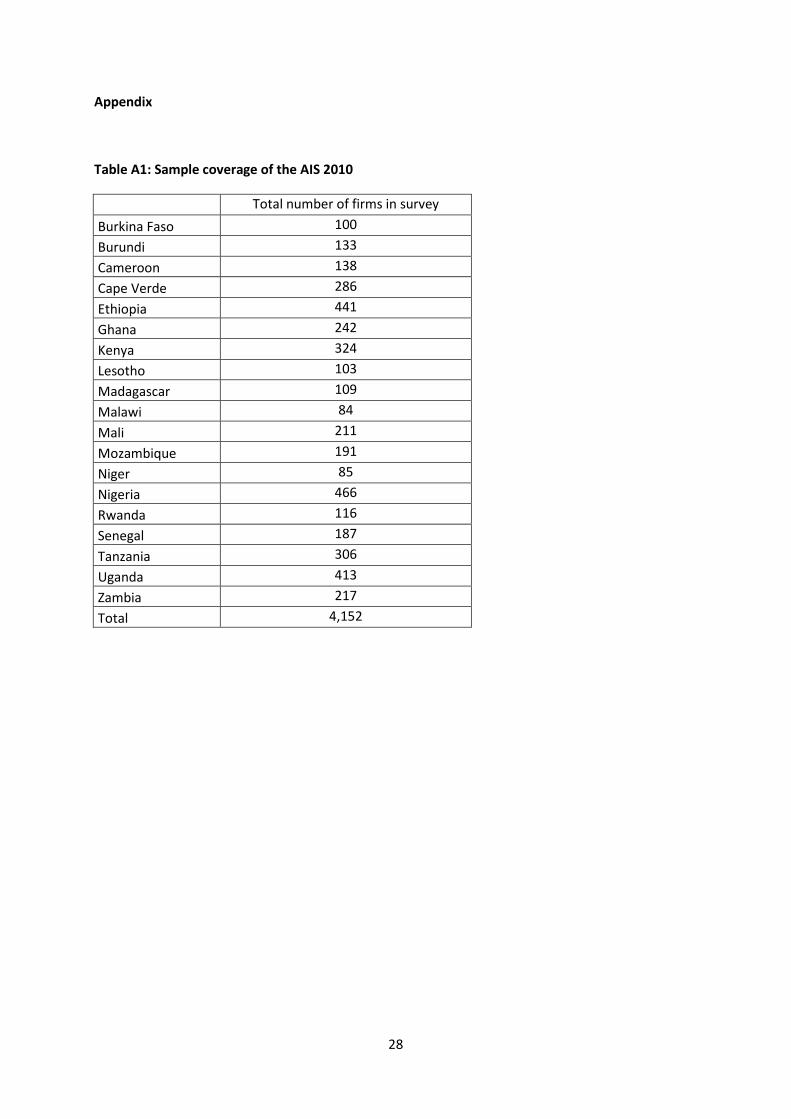
We use original firm-level data collected through the UNIDO Africa Investor Survey 2010 across 19 Sub-Saharan Africa countries.6 We use the Domestic Investor Survey data, which contain a rich set of information on a large sample of domestic firms. The collection of the dataset followed a rigorous survey methodology in terms of stratified sampling (on three dimensions: sector, size and ownership) in order to construct a sample of firms that is representative of public and private for profit firms with 10 or more employees within the countries.7 These firms were then interviewed by highly-trained enumerators using face-to-face interviews with top-level managers of foreign- and domestically-owned firms. The survey focuses on manufacturing and services sectors but also includes smaller samples of firms in agriculture, mining, utilities and construction. Table A1 in the appendix provides the number of surveyed firms by country. More details on the Africa Investor Survey 2010, the sampling procedure and quality assurance measures are provided in UNIDO (2011).
The Africa Investor Survey provides specific information on domestic firms’ customer / supplier relationships with foreign multinationals located in the host country. Specifically, the survey asks respondents “what percentage of inputs by value comes from foreign-owned companies based in the country” and “what percentage of your sales by value goes to buyers that are foreign-owned companies based in the country”. We use the responses to these two questions to gauge the extent of domestic firms’ buying and supplying activity with foreign multinationals in the country, respectively.
5 Barthel, Busse and Osei (2011) also look at characteristics and determinants of FDI into Ghana using survey data. They do not look at spillovers, however. 6 Burkina Faso, Burundi, Cameroon, Cape Verde, Ethiopia, Ghana, Kenya, Lesotho, Madagascar, Malawi, Mali, Mozambique, Niger, Nigeria, Rwanda, Senegal, Tanzania, Uganda, Zambia. 7 An oversampling of relatively large firms (> 100 employees) has been adopted.
5
The literature generally measures backward linkages of multinationals using such information on domestically purchased inputs (e.g., Godart and Görg, 2013; Alfaro and Rodriguez-Clare, 2004, Driffield and Noor, 1999) as this provides some measure of local embeddedness of multinationals. Of course, our measure is not without limitations, however, as it does not say much about the nature of the linkage. For example, we do not know what types of inputs are bought. However, it would make a difference whether a domestic firm buys simply petrol from a multinational supplier or a technologically sophisticated custom made input (see Giroud and Scott-Kennel, (2009). Also, our data do not allow us to distinguish whether the multinational customer is a large manufacturing plant or merely a small sales office, or whether the multinational may be a joint venture with a local enterprise, or a fully foreign owned firm. Finally, the nationality of the multinational is unknown so we cannot distinguish South-South from North-South FDI. Such a distinction would have been very interesting, as one may expect different potentials for spillovers from Southern vs Northern investors.8
However, the data available in the African Investor Survey are unique in that they provide detailed information on various aspects of firm performance, customer-supplier relationships, and assistance received at the level of the firm. There is one disadvantage, however. Currently, the data are only available for a cross section in 2010. Hence, while we can use the data to unearth and describe some hitherto unknown relationships, we are careful to avoid interpreting these as causal effects. Nevertheless, we feel that the relationships are sufficiently interesting and, importantly, policy relevant to justify our analysis.
In order to provide a first look at the relationship between firm performance and the business relationship with multinationals, we provide some summary statistics. Table 1 reports the share of firms that are suppliers to and/or buyers from multinationals.9 While there is substantial heterogeneity across countries, on average about 35 percent of firms fall into these categories.10 Mozambique is a clear outlier to this, where 92 percent of firms either supply or purchase from multinationals in the country. At the other end of the spectrum, we find that in countries such as Ethiopia, Lesotho, Senegal and Tanzania only less than 20 percent of domestic firms have such customer/supplier relationships with multinationals. It is also noteworthy that in Burkina Faso and Senegal there are no firms that buy from multinationals without also supplying inputs to them at the same time. In Burundi and Niger we do not have any firms at all that buy inputs from multinationals.
8 Lipsey and Sjöholm (2011) provide an overview on South-South investment characteristics for the case of several East- Asian economies. They analyze trends and differences between South- South and North- South investment regarding determinants of FDI, size and productivity of investors and for spillovers to local firms. They report that developing multinationals investing in East Asia tend to establish in more labour intensive industries and with smaller and lower productivity affiliates compared to firms from more developed economies. Also, Amighini and Sanfilippo (2013) e.g., find that South-South FDI in Africa has stronger positive effects on African economies. Unfortunately, however, our data relates to domestic firms and we do not know the nationality of the multinationals with which they have input-output linkages. 9 We define a firm as a buyer or supplier if they provide a non-zero percentage in the above mentioned questions. Note that compared to Table A1 one sees that a large number of firms did, unfortunately, not provide information on these variables. There does not appear to be any obvious systematic bias in the non-response. 10 Note that the number of domestic firms in the survey also differs substantially across countries, the lowest being in Burkina Faso and the highest in Ethiopia. It is worth pointing out the small number of firms in some countries. This does not pose a problem for our econometric analysis later on, where the individual firm is the unit of observation and we control for country specific effects using dummy variables.

6
[Table 1 here]
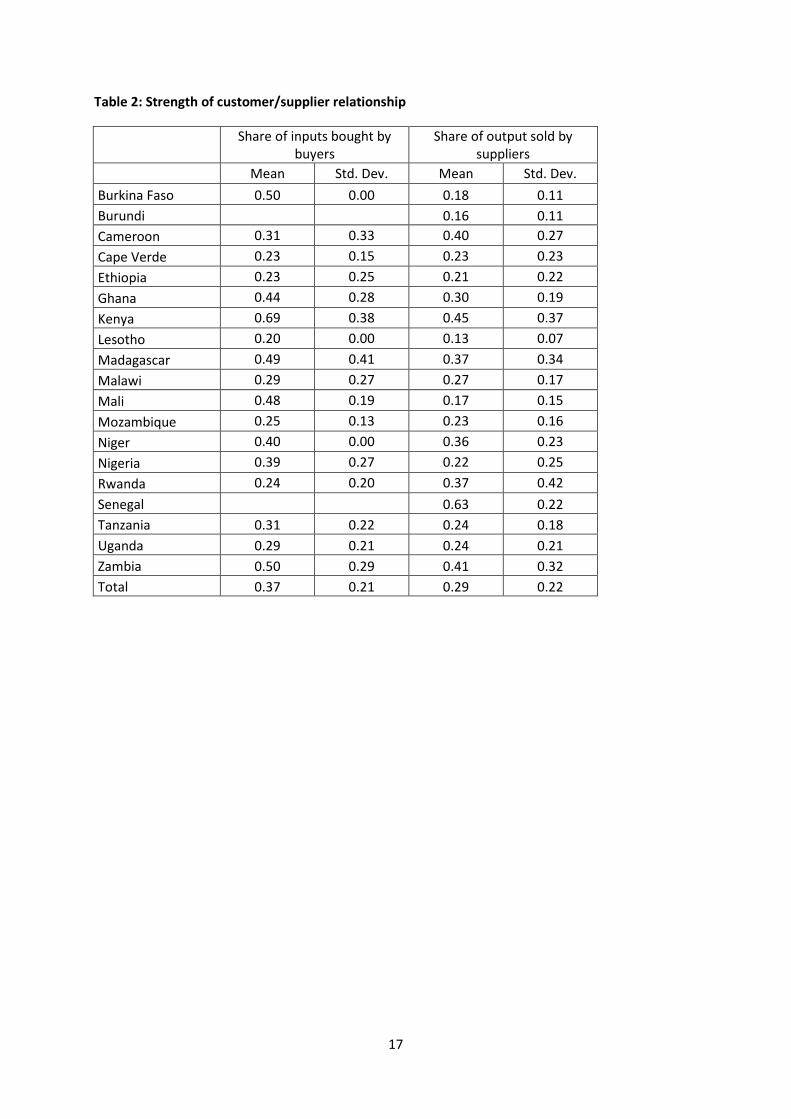
Table 2 zooms in on those firms that have business relationships with multinationals. It shows the share of output sold to multinationals and the share of inputs bought from multinationals, respectively, for domestic firms that have such customer-supplier relationships. On average, suppliers sell 30 percent of their output to multinational customers. For those domestic firms that buy inputs from multinationals, we find that they purchase on average 37 percent of their total inputs from them. Again, however, there are substantial cross-country differences in these shares.
[Table 2 here]
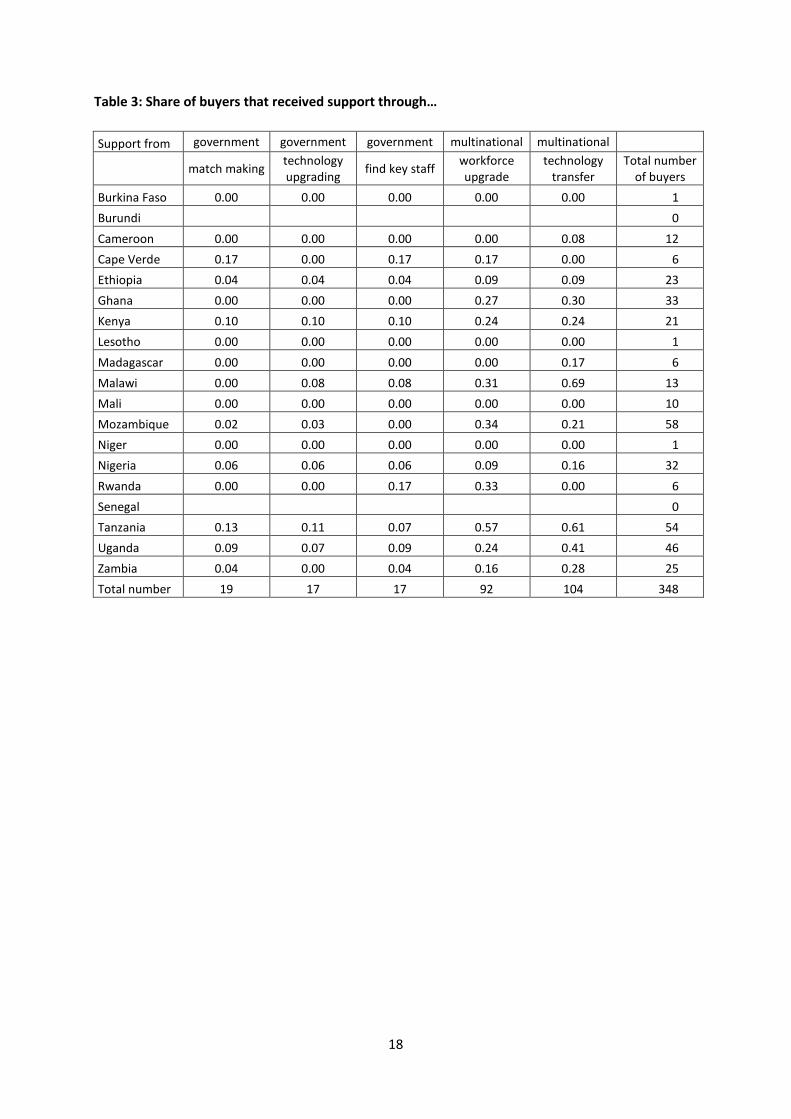
One of the aims of this paper is to establish whether government support, or assistance received by multinationals, has any impact on the benefits from supplying a multinational, or on buying inputs from them. We consider three types of government support, namely, for “match making”, i.e., searching for suitable customers or suppliers, “technology upgrading” or “finding key staff”. The data set also provides information on assistance received from multinational customers.11 Specifically, we know whether a firm received assistance in terms of workforce upgrading, or technology transfer from the multinational.
In Table 3 we show the share of domestic buyers who report having received any such assistance from either the government or foreign multinationals. As can be seen, the share of firms receiving government support is quite low, with less than 20 domestic buyers in our data. In fact, in many countries in our data set buyers did not receive such support at all. The picture is brighter when considering assistance received from multinationals. Around 100 firms report to have received such help from multinationals, either in the firm of help with workforce upgrading, or technology transfer.
[Table 3 here]
Table 4 looks at similar numbers for domestic suppliers to multinationals. Again, there is a clear bias towards receiving help from multinationals rather than relying on government support. Over 150 suppliers report to have received technology transfer from multinationals, and about 140 firms received assistance in upgrading the workforce. Only around 20 firms received government support for match making, technology upgrading or finding skilled workers.
[Table 4 here]
4 Supplying, buying, and firm performance
We now turn to look at the relationship between a domestic firms’ performance and its business relationship with foreign multinationals. To do so, we examine specifically three aspects of firm performance, namely, its propensity to engage in product innovation, process innovation and the level of labour productivity. These three variables thus capture important proxies for a domestic firm’s technological performance. The two innovation variables are defined as dummy variables
11 Unfortunately, we do not have any information on help from a multinational supplier, hence, we cannot take this into account.

7
equal to one if the firm, respectively, introduced new products or new production processes. Labour productivity is measured as sales per employee.12
In Table 5 we compare the average performance indicators across firms that have a customer/supplier relationship with a multinational and those that do not. As can be seen, firms that do not engage in such relationships have unequivocally lower levels of labour productivity compared to firms that either buy from or sell to multinationals. However, only firms that sell inputs to multinationals tend to be, on average, more likely to engage in product or process innovation. Firms that buy from multinationals are not different from firms with no relationship with multinationals when it comes to those two innovation variables.
These apparent performance advantages for suppliers are in line with two, not mutually exclusive, explanations. One is that the supplier relationship with a multinational allows the firm to improve its performance, due to performance requirements set by multinationals combined with possible technology transfer and assistance. In other words, domestic firms learn from multinationals. This is the idea of the backward linkage effect as in Javorcik (2004) or Moran (2006). Another explanation is that multinationals pick only the best performing domestic firms as their suppliers, i.e., there is a selection effect as described in Javorcik and Spatareanu (2009). It is likely that our result is due to a combination of these two effects. Unfortunately, with the cross section data at hand we cannot dig much deeper into this learning vs. selection question.
[Table 5 here]
These summary statistics are simple averages and confound firm, industry and country effects. In order to get a more precise estimate of the performance advantage for suppliers and buyers we now turn to estimating variants of the following equation
Yi = β1 SUPPLYi + β2 BUYi + β3 Xi + dc + dj + εi (1)
where the dependent variable, Yi is alternatively defined as a dummy variable equal to one if the firm introduced new products, a dummy equal to one if the firm introduced new production processes, or labour productivity.
The two independent variables of most interest are the indicators of the customer-supplier relationships with multinationals. The first variable, SUPPLY, is the percentage of output that is sold to multinationals. This is, thus, a firm level indicator of the strength of the backward linkages between multinationals and the domestic firm, similar to Godart and Görg (2013). BUY is the percentage of inputs purchased from multinationals, which provides us with a firm level indicator of the forward linkage between multinationals and the domestic firm.
The vector X includes a number of firm level controls, namely, (log) firm size and age, exporter dummy, and a dummy equal to one if the firm has positive expenditure on R&D.13 Finally, dc and dj are full sets of country and industry dummies, respectively.
Table 6 presents the baseline estimation results of equation (1). The model is estimated using OLS.14 Column (1) provides the estimates for the equation with the product innovation dummy as
12 Sales are reported in local currency and are then converted into US dollars. 13 Defining the R&D variable in terms of R&D expenditure relative to sales does not change results.

8
dependent variable, column (2) relates to the process innovation dummy, and column (3) has log output per worker on the left hand side.
[Table 6 here]
The estimation results show that all control variables have positive signs. This implies that firms tend to be more innovative or more productive the larger or older they are, if they export, or if they spend on own R&D activity. This is much in line with empirical work on aspects of firm heterogeneity, as one would expect (e.g., Aw et al., 2007; Wagner, 2007; Girma et al. 2008).
We also find that firms tend to be more likely to introduce new products or processes the more they supply to multinationals in their country. This positive correlation is in line with an interpretation whereby a beneficial backward linkage effect, i.e., domestic firms supplying multinationals, is an important determinant of firms’ innovative activity. However, given the nature of our data, it may also point towards a positive selection effect, i.e., multinationals choose highly innovative firms as their suppliers. Given the nature of our data, we cannot conclusively discriminate between these two effects. However, it is noteworthy that we do not find any statistically significant association between supplies to multinationals and labour productivity. This may suggest that selection is not important, as there is no contemporaneous association between supplying and productivity performance. One has to keep in mind, however, that we have cross sectional data. Hence, any positive productivity effects through learning may still occur in the future.
When considering buying from multinationals (the forward linkage), we only find a positive association with labour productivity of the domestic buyer. We do not find any such relationship when considering product or process innovation. Indeed, for process innovation we find a negative relationship, i.e., the more a domestic firm buys from multinationals, the less likely it is to introduce new production processes. As selection is arguably less of an issue for buyers (multinationals are unlikely to choose their customers based on performance criteria) the relationship with productivity may be suggestive of a positive forward linkage effect. The linkage has a direct impact on productivity and does not, however, seem to improve firms’ innovation performance. This may indicate that firms use the superior inputs purchased from multinationals to implement more efficiently the current production process, rather than install new processes.
Thus far we have attempted to establish a relationship between innovation / productivity capabilities of domestic firms and their customer / supplier relationships with multinationals located in the domestic economy. However, domestic firms may also benefit from relationships with other firms located abroad, as these would also allow access to foreign technology. This technology can be imported through intermediate products purchased abroad (Halpern et al., 2005). In order to investigate this possibility, and to see whether it may have an impact on our conclusions thus far, we present in Table 7 an extension of our empirical model where we include on the right hand side two variables measuring the degree of supplying to, or buying from, foreign firms located abroad. These variables are defined similarly to the supply and buy variables used thus far.
14 For the case of the dependent variables being dummies (new product, new process) we also estimated the model using probit techniques. This estimation provides qualitatively and quantitatively very similar results, hence, we show OLS estimates here. Probit estimations are available from the authors upon request.

9
Importantly, including these two variables does not change our result on the importance of supplying to multinationals in the host country. Interestingly, buying from suppliers abroad returns a strongly significant and positive coefficient in all three regressions. This may indicate the importance of imported technology from abroad for firm performance (as in Kasahara and Lapham, 2013), though it is also consistent with the view that only highly productive firms import, as they are able to overcome the sunk costs associated with trade.
[Table 7 here]
5 With a little help?
After establishing the basic direct correlations between the customer / supplier relationships and domestic firms’ performance we now move on to investigate whether assistance by either the government (through investment support services) or the multinational company may have a role to play in this context. We expand the empirical model to see whether the coefficient estimates for β1 and β2 also depend on some mitigating variables. Specifically, we investigate two classes of variables, namely, assistance received from the host country government through investment support services, and the nature of the interaction between the multinational buyer and the domestic firm.
To do so, we expand the baseline empirical model in equation (1) with some interactions
Yi = β1 SUPPLYi + β2 BUYi + β3 SUPPORTi * SUPPLYi + β4 SUPPORTi * BUYi + β5 Xi + dc + dj + εi (2)
where SUPPORT is an indicator variable that takes on the value one if, alternatively, the firm received investment support services for (i) “match making between suppliers and buyers”, (ii) “assistance in upgrading of technology”, (iii) “finding key staff”, or if the firm reports that multinational buyers help the firm with (iv) “upgrading the quality of the workforce” or (v) “technology transfer”. The investment support services can be seen as policies that focus on either generating linkages or improving absorptive capacity of firms.15 The activities of multinational buyers are focused on assisting firms with assimilating technology, i.e., related to absorptive capacity.
We firstly consider whether help received from the multinational buyer instead of the government has a role to play. To do so, we use information from the Investor Survey, where firms are asked whether multinational buyers help domestic firms to improve their operations. We focus on two particular aspects of such potential assistance, namely, “help to upgrade the workforce” or help through technology transfer. Again, we generate dummies equal to one if firms reported to have experienced such help. We then interact these dummies with the SUPPLY and BUY variables in the model. Results for the two indicators are reported in Tables 8 and 9.
The results in Table 8, where we consider the impact of assistance in terms of upgrading workforce, are similar to those found above. The coefficients on the buyer and supplier variables are not impacted upon by such help when looking at product innovation or labour productivity as dependent
15 This is, of course, only a very small subset of policies that governments may use to foster linkages and spillovers. Kokko and Blomström (2003) discuss the use of incentives in this context, UNCTAD (2010) discusses various policy approaches. Görg et al. (2011) investigate the role of financial incentives for generating linkages.

10
variable. However, for process innovation we find that supplying to a multinational is only positively related to this variable when firms receive help from the multinational.
[Table 8 here]
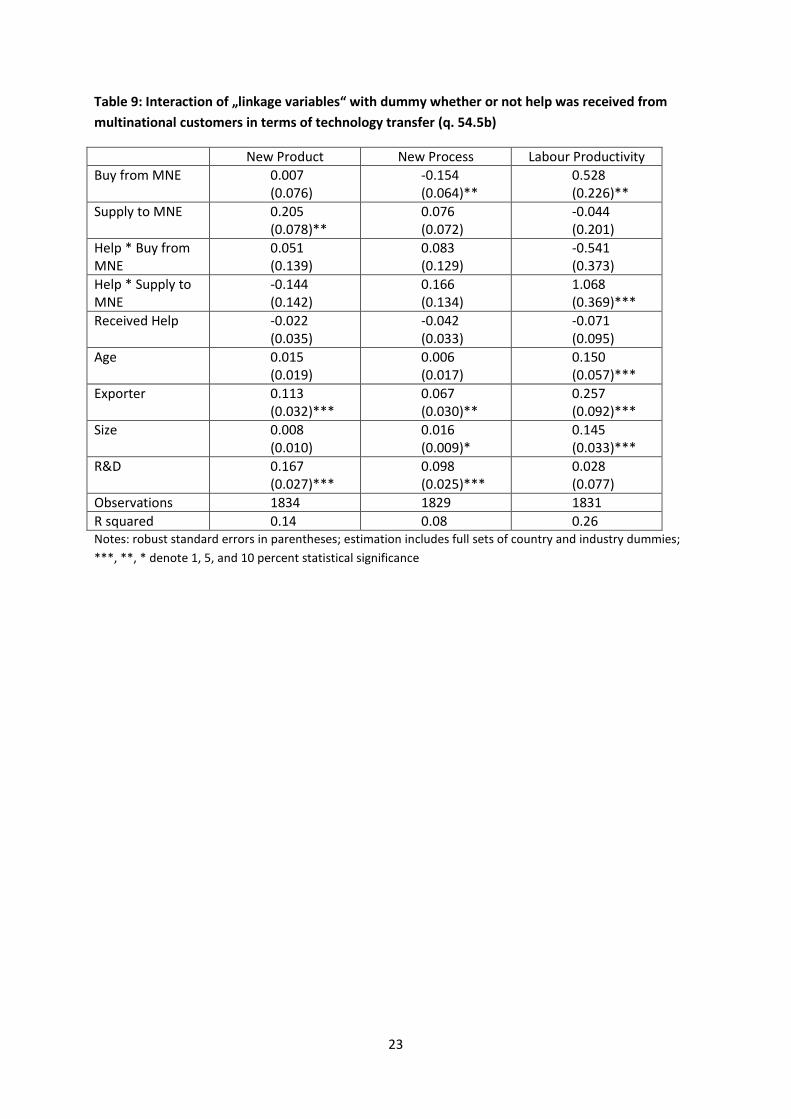
Table 9 then considers help through technology transfer from a multinational customer. An interesting result emerges in this table: While product and process innovation are not impacted upon by technology transfer, we find that labour productivity in a firm is positively associated with supplying to a multinational only if the firm receives technology transfer from the multinational buyer. This is much in line with anecdotal and case study evidence on backward linkages between multinationals and domestic firms (e.g., Moran, 2006), which shows that multinationals actively assist their domestic suppliers in implementing new technology. It may also indicate that technology transfer from multinationals does not immediately lead to process upgrading in the domestic firm. Rather, our evidence is consistent with a view that technology transfer leads, in the short run, to a more productive use of existing resources and technology. Of course, in the longer term this may then also lead to process and ultimately product innovation; however, this is an aspect we cannot investigate with our cross section data.
[Table 9 here]
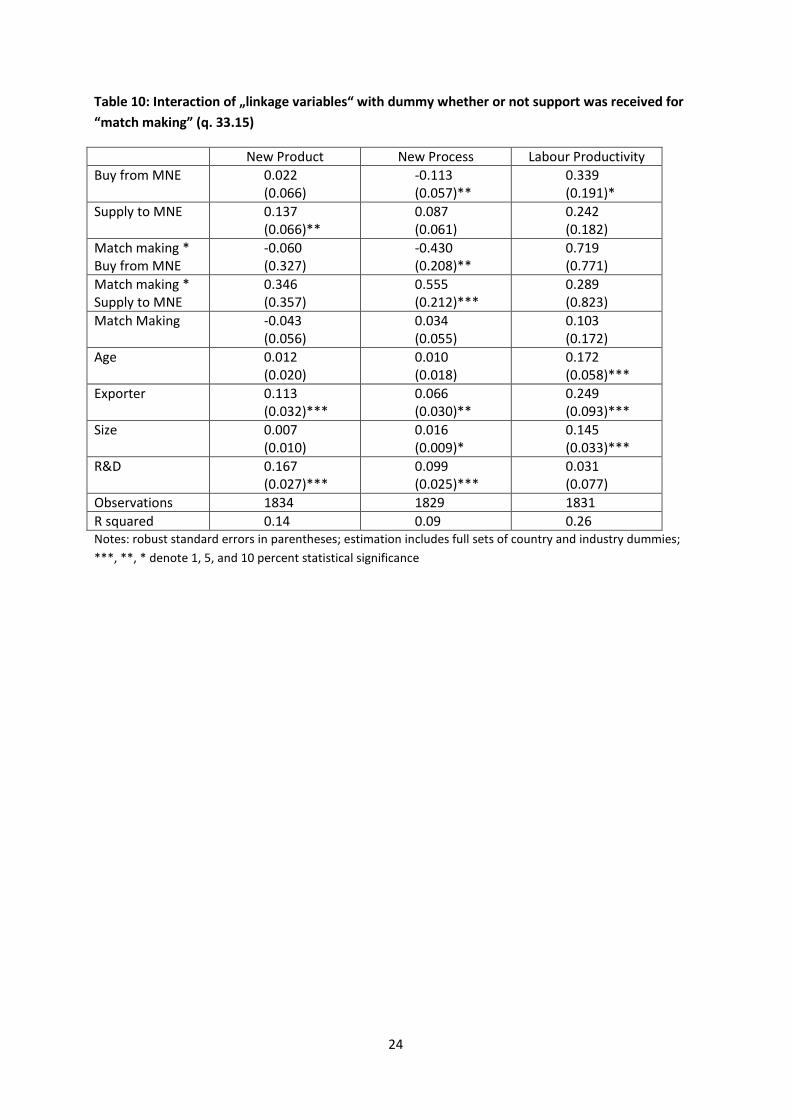
We then switch focus on look at assistance received from government. Table 10 considers support for “match making” from the government. This type of support is aimed at making it easier (that is, less costly) for domestic firms to establish contact with multinational buyers or suppliers. Given that this reduces the effort a domestic firm has to spend on establishing a good quality business relationship, this support may be expected to enhance the benefits for domestic firms. However, looking at the estimates in Table 10 we only find weak evidence that such match making is important for the customer / supplier relationship. We see that supplying to multinationals is positively associated with product innovation, and this relationship does not depend on match making. Match making also does not play a role for the relationship between supplying, buying, and labour productivity. However, for process innovation we only find a positive association between supplying to a multinational and process innovation if the domestic firm received support for match making, i.e., for finding a customer.
[Table 10 here]
Table 11 considers government help for “finding key staff”. This aims at another aspect of absorptive capacity, namely a firm’s stock of highly qualified workers. Again, the result is comparable to what we found before. Supplying a multinational is only positively associated with process innovation if the domestic firm receives assistance for searching for staff. The relationship between the supplier / buyer variables and product innovation or labour productivity does not depend on assistance from the government.
[Table 11 here]
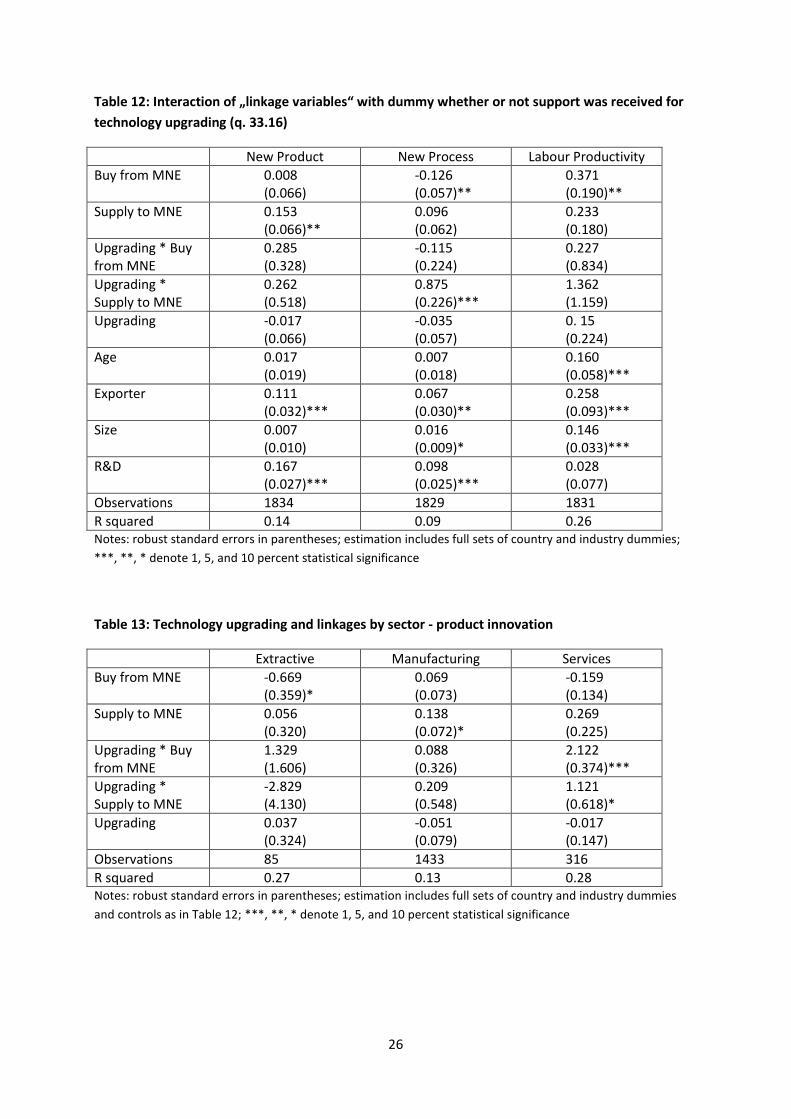
In Table 12, we look at the role of government support for technology upgrading. Such support aims at directly improving a domestic firms’ absorptive capacity, hence we should expect a positive impact on the benefits from the business relationship with multinationals. However, results are quite similar to those in Table 4. Government support only plays a role for the relationship between the customer

11
/ supplier relation and process innovation. Supplying a multinational is only positively associated with process upgrading if the domestic firm receives government assistance for technology upgrading. In other words, a possible positive impact from the multinational customer to the supplier, through possible access to superior technology in the foreign firm, can only be translated into more process innovation if the firm also receives assistance from the government to do so. We also note, however, that this government support on its own is not directly related with either of the two innovation variables, or labour productivity.
[Table 12 here]
The data used in this analysis covers activities in the whole economy. We now turn to investigating whether there are any differences in effects across the broadly defined three categories primary, manufacturing and services.16 To illustrate the nature of the differences and in order to save space we only look at government support for technology upgrading, expanding on Table 12. We estimate the models separately for the three sectors with the three alternative dependent variables. Results are Tables 13 – 15 for product innovation, process upgrading and labour productivity respectively.
We find that our results are mainly driven by manufacturing and services sectors, which may be partly explained by the low number of observations in the primary sector. Even between the two sectors, however, we find interesting differences. For new product development (Table 13) we find that the pattern in manufacturing is the same as for the overall result in Table 12. Interestingly, however, we find that both interaction terms are positive and statistically significant in the services sector. In other words, firms in the services sector benefit from government assistance towards strengthening their ability to benefit from spillovers from multinationals. The results for new process development (Table 14) are roughly similar between services and manufacturing and in line with Table 12.
In terms of labour productivity (Table 15) we again find interesting differences. Firstly we find that the result in Table 12 that buying from multinationals is positively associated with productivity only holds in the services sector. For supplying multinationals, we now find that this is positively correlated with productivity in the manufacturing sector, while it is negatively related in the services sector. In other words, there is evidence for positive backward linkages between multinationals and domestic firms in the manufacturing sector (which is the sector that most earlier studies have focused on) while there appear to be negative spillovers from multinationals’ backward linkages in services.17 As in Table 12, we do not find any evidence that government assistance mitigates these spillovers.
[Tables 13 to 15 here]
6 Summary and Conclusions
This paper analyses unique firm level data for 19 African countries to look at the link between domestic firms’ business relationship with multinationals and their performance in terms of
16 These are defined as follows: Primary ISIC codes 1 – 9, Manufacturing 10 – 33, Services 33 – 96. 17 Such negative spillovers may be due to multinational customers having strong bargaining power which may drive down prices for local suppliers, see Driffield et al. (2002).

12
innovation and productivity. Quite uniquely, we are also able to evaluate the importance of support received by the domestic firm, either from the government or the multinational business partner, for this link.
Overall, our data analysis shows that for the average domestic firm, supplying to a foreign multinational in the country (the backward linkage) is positively associated with product innovation. Buying from a multinational (the forward linkage) is positively associated with labour productivity. These results are not impacted upon by any type of government support, or help received from multinationals. This type of support has an important role to play as well, however. In our estimations we find that domestic firms’ process innovation activity is only positively associated with supplying a multinational if the firm also receives assistance for match making, technology upgrading, or searching for staff from the government, or help with workforce upgrading from their multinational customer. Furthermore, we find that supplying a multinational is only positively associated with domestic firms’ productivity if the firm received technology transfer from the multinational customers. There are also some differences according to sectors in these effects.
Overall, our results are in line with positive spillovers through backward linkages by multinationals, and to a lesser extent also through forward linkages, for domestic firms in African countries. Thus our findings are in line with previous evidence provided by Bwalya (2006) using firm level data for Zambia, Görg and Strobl (2005) for Ghana and Boly et al. (2012) using also data from the African Investor Survey. In particular our finding, that labour productivity is positively associated with a backward linkage if the firm receives technology transfer from the multinational, is also much in line with case study evidence by Moran (2006) showing that multinationals actively transfer technology to their local suppliers, thus allowing them to increase productivity. In contrast to most earlier studies which only measure linkages at the industry level (such as Driffield et al., 2002, Javorcik, 2004, Barrios et al., 2011) we can, therefore, pin-point direct effects of linkages at the level of the domestic supplier / customer, and we can evaluate the importance of assistance received by these firms.
The use of cross section data does, however, imply that we cannot conclusively distinguish such positive spillover effects from pure selection, whereby multinationals pick well performing domestic suppliers. However, the fact that our evidence on assistance received by domestic firms shows the importance of the same mechanisms as in the case study evidence is reassuring and arguably strengthens our case for an interpretation of our results as spillovers. Also, Javorcik and Spatareanu (2009) in their analysis of panel data for Czech suppliers find evidence for both spillovers and selection, while Godart and Görg (2013), once controlling for selection, also find positive spillover effects from supplying multinationals. Hence, based on this previous evidence, we may also conjecture that at least part of the positive correlations we unearth are due to spillovers.
Our results have important policy implications. Firstly, they show that FDI can bring benefits to domestic firms also in Sub-Saharan Africa, a region that has, for a long time, grappled with low FDI inflows and poor performance of domestic firms. Our evidence, while certainly not conclusive, may provide some first evidence pointing towards the “new wave of FDI”, which also involves substantial South-South FDI, having the potential to impact positively on domestic firms. Secondly, our data analysis shows that support received by domestic firms, either from the government through investment support services or from the multinational business partner may influence positively the potential benefits for domestic firms. These are mechanisms that can, at least to some extent, also
13
be influenced by policies, either through direct support efforts on the part of the government, or by providing incentives for multinationals to provide assistance. As our data show, the current level of such support is still quite low, hence there is substantial room for improvement.
References
Alfaro, L. and A. Rodríguez-Clare, 2004, “Multinationals and linkages: an empirical investigation”, Economia, Spring 2004
Amendolagine, V., Boly A., Coniglio N.D., Prota F., Seric A., 2013, FDI and Local Linkages in Developing Countries: Evidence from Sub-Saharan Africa, World Development, forthcoming.
Amighini, A. and M. Sanfilippo, 2013, Impact of South-South FDI and trade on the export upgrading of African economies, EUI Working Paper RSCAS 2013/47, European University Institute.
Aw, B., M. Roberts and T. Winston (2007). The complementary role of exports and R&D investments as sources of productivity growth. The World Economy 30 (1): 83-104
Barrios, S., Görg, H., Strobl, E., 2011, Spillovers through backward linkages from multinationals: Measurement matters!. European Economic Review, 55(6), 862-875
Barthel, F., Busse, M., Osei, R., 2011, The characteristics and determinants of FDI in Ghana, European Journal of Development Research, 23, 389-408
Blomström, M. and A. Kokko, 2003, The economics of foreign direct investment incentives, NBER Working Paper 9489
Blomström, Magnus, and Håkan Persson. 1983. “Foreign Investment and Spillover Efficiency in an Underdeveloped Economy: Evidence from the Mexican Manufacturing Industry.” World Development 11(6): 493–501.
Boly A., Coniglio N.D., Prota F., Seric A., 2012, Which Domestic Firms Benefit from FDI? Evidence from Selected African Countries, Working Paper, UNIDO
Bustos, P. (2011), Trade Liberalization, Exports and Technology Upgrading: Evidence on the Impact of MERCOSUR on Argentinean Firms, American Economic Review, 101, 304-340
Bwalya, S. M. (2006), Foreign direct investment and technology spillovers: Evidence from panel data analysis of manufacturing firms in Zambia, Journal of Development Economics, 81, 514–526.
Driffield, Nigel, Max Munday, and Annette Roberts. 2002. “Foreign Direct Investment, Transactions Linkages, and the Performance of the Domestic Sector.” International Journal of the Economics of Business 9(3): 335–51.
Driffield, N.L. and Abd Halim Mohd Noor (2000) ‘Foreign direct investment and local input linkages in Malaysia.’ Transnational Corporations, Vol. 8(3) pp. 1-25
Giroud, A. (2012), "Mind the gap: How linkages strengthen understanding of spillovers," The European Journal of Development Research, 24 (1), 20-25

14
Giroud, A. and J. Scott-Kennel (2009), MNE linkages in international business: A framework for analysis, International Business Review 18, 555–566
Girma, S., 2005. Technology Transfer from Acquisition FDI and the Absorptive Capacity of Domestic Firms: An Empirical Investigation, Open Economies Review, 16(2), 175-187
Girma, S., H. Görg and A. Hanley (2008), R&D and exporting: A comparison of British and Irish firms, Review of World Economics, 144(4), 749-772
Glass, Amy, and Kamal Saggi. 1998. “International Technology Transfer and the Technology Gap.” Journal of Development Economics 55(2): 369–98.
Godart, O., Görg, H. (2013), Suppliers of Multinationals and the Forced Linkage Effect: Evidence from Firm Level Data. Journal of Economic Behavior & Organization, 94, 393-404
Görg, H., Greenaway, D., 2004. Much Ado about Nothing? Do Domestic Firms Really Benefit from Foreign Direct Investment?, World Bank Research Observer 19, 171-197.
Görg, H. and E. Strobl, 2005, Spillovers from foreign firms through worker mobility: an empirical investigation, Scandinavian Journal of Economics, 107, 693-709
Görg, H., A. Hanley and E. Strobl, 2011, Creating backward linkages from multinationals: Is there a role for financial incentives, Review of International Economics, 19, 245-259
Gorodnichenko, Y., Svejnar, J., Terrell, K., 2007. When does FDI have positive spillovers? Evidence from 17 Emerging Market Economies. IZA Discussion Paper 3079.
Halpern, L., M. Koren and A. Szeidl (2005), Imports and productivity, CEPR Discussion Paper 5139
Hansen, M.W., 2014, From enclave to linkage economies? A review of the literature on linkages between extractive multinational corporations and local industry in Africa, DIIS Working Paper 2014:02
Havranek, T. and Z. Irsova, 2011, Estimating vertical spillovers from FDI: Why results vary and what the true effect is, Journal of International Economics, 85, 234–244.
Javorcik, Beata S. (2004), “Does Foreign Direct Investment Increase the Productivity of Domestic Firms? In Search of Spillovers through Backward Linkages”, American Economic Review, 94(3).
Javorcik, B., Spatareanu, M., 2009. Tough Love: Do Czech Suppliers Learn from their Relationships with Multinationals. Scandinavian Journal of Economics, 111, 811-33.
Kaplan, D., 2011, South African mining equipment and related services: Growth, constraints and policy, MMCP Discussion Paper No. 5
Kasahara, H. and B. Lapham, 2013, Productivity and the decision to import and export: Theory and evidence, Journal of International Economics, 89, 297-316
Kokko, Ari. 1994. “Technology, Market Characteristics, and Spillovers.” Journal of Development Economics 43(2): 279–93.

15
Lipsey, Robert E. & Sjöholm, Fredrik, 2011. "South–South FDI and Development in East Asia," Asian Development Review, 28(2), 11-31
Liu, Xiaming, Pamela Siler, Chengqi Wang, and Yingqi Wei. 2000. “Productivity Spillovers from Foreign Direct Investment: Evidence from UK Industry Level Panel Data.” Journal of International Business Studies 31(3): 407–25.
Moran, T., 2006. Harnessing foreign direct investment for development: Policies for developed and developing countries, Washington DC: Center for Global Development.
Morris, M., R. Kaplinsky and D. Kaplan, 2012, ‘‘One thing leads to another’’ — Commodities, linkages and industrial development”, Resources Policy, 37, 408-416
Morrissey O. (2012), FDI in Sub-Saharan-Africa: Few Linkages, Fewer Spillovers, European Journal of Development Research, 24, pp. 26-31.
UNCTAD, 2010, Creating Business Linkages: A Policy Perspective, New York and Geneva, United Nations
UNCTAD (2012), World Investment Report 2012: Toward a New Generation of Investment Policies, United Nations, New York and Geneva
UNECA, 2013, Making the Most of Africa’s Commodities: Industrializing for Growth, Jobs and Economic Transformation, Addis Ababa, UN Economic Commission for Africa
UNIDO, 2011, Africa Investor Report 2011, UNIDO, Vienna.
Wagner, J. (2007). Exports and productivity: a survey of the evidence from firm-level data. The World Economy 30 (1): 60-82.
Waldkirch, A. and A. Ofosu, 2010, Foreign presence, spillovers, and productivity: Evidence from Ghana, World Development, 38, 1114-1126

16
Tables
Table 1: Share of suppliers / buyers per country
None Supplier Buyer Both Total number of firms
Burkina Faso 0.50 0.25 0.00 0.25 4 Burundi 0.56 0.44 0.00 0.00 9 Cameroon 0.44 0.35 0.11 0.11 57 Cape Verde 0.66 0.27 0.02 0.05 83 Ethiopia 0.81 0.12 0.05 0.02 316 Ghana 0.70 0.09 0.13 0.09 151 Kenya 0.67 0.18 0.08 0.06 144 Lesotho 0.81 0.16 0.03 0.00 31 Madagascar 0.69 0.19 0.06 0.06 48 Malawi 0.67 0.02 0.17 0.14 42 Mali 0.75 0.09 0.05 0.11 65 Mozambique 0.08 0.24 0.02 0.65 86 Niger 0.67 0.28 0.00 0.06 18 Nigeria 0.79 0.06 0.09 0.06 218 Rwanda 0.75 0.14 0.05 0.05 57 Senegal 0.84 0.16 0.00 0.00 37 Tanzania 0.58 0.14 0.10 0.18 193 Uganda 0.46 0.30 0.05 0.19 191 Zambia 0.48 0.21 0.12 0.19 81 Total 0.65 0.16 0.07 0.12 1,831
17
Table 2: Strength of customer/supplier relationship
Share of inputs bought by buyers
Share of output sold by suppliers
Mean Std. Dev. Mean Std. Dev.
Burkina Faso 0.50 0.00 0.18 0.11 Burundi
0.16 0.11
Cameroon 0.31 0.33 0.40 0.27 Cape Verde 0.23 0.15 0.23 0.23 Ethiopia 0.23 0.25 0.21 0.22 Ghana 0.44 0.28 0.30 0.19 Kenya 0.69 0.38 0.45 0.37 Lesotho 0.20 0.00 0.13 0.07 Madagascar 0.49 0.41 0.37 0.34 Malawi 0.29 0.27 0.27 0.17 Mali 0.48 0.19 0.17 0.15 Mozambique 0.25 0.13 0.23 0.16 Niger 0.40 0.00 0.36 0.23 Nigeria 0.39 0.27 0.22 0.25 Rwanda 0.24 0.20 0.37 0.42 Senegal
0.63 0.22
Tanzania 0.31 0.22 0.24 0.18 Uganda 0.29 0.21 0.24 0.21 Zambia 0.50 0.29 0.41 0.32 Total 0.37 0.21 0.29 0.22
18
Table 3: Share of buyers that received support through…
Support from government government government multinational multinational
match making technology upgrading find key staff workforce
upgrade technology
transfer Total number
of buyers Burkina Faso 0.00 0.00 0.00 0.00 0.00 1 Burundi
0
Cameroon 0.00 0.00 0.00 0.00 0.08 12 Cape Verde 0.17 0.00 0.17 0.17 0.00 6 Ethiopia 0.04 0.04 0.04 0.09 0.09 23 Ghana 0.00 0.00 0.00 0.27 0.30 33 Kenya 0.10 0.10 0.10 0.24 0.24 21 Lesotho 0.00 0.00 0.00 0.00 0.00 1 Madagascar 0.00 0.00 0.00 0.00 0.17 6 Malawi 0.00 0.08 0.08 0.31 0.69 13 Mali 0.00 0.00 0.00 0.00 0.00 10 Mozambique 0.02 0.03 0.00 0.34 0.21 58 Niger 0.00 0.00 0.00 0.00 0.00 1 Nigeria 0.06 0.06 0.06 0.09 0.16 32 Rwanda 0.00 0.00 0.17 0.33 0.00 6 Senegal
0
Tanzania 0.13 0.11 0.07 0.57 0.61 54 Uganda 0.09 0.07 0.09 0.24 0.41 46 Zambia 0.04 0.00 0.04 0.16 0.28 25 Total number 19 17 17 92 104 348

19
Table 4: Share of suppliers that received support through…
Support from government government government multinational multinational
match making technology upgrading find key staff workforce
upgrade technology
transfer Total number
of buyers Burkina Faso 0.00 0.00 0.00 0.00 0.00 2 Burundi 0.00 0.00 0.00 0.00 0.25 4 Cameroon 0.00 0.00 0.00 0.04 0.00 26 Cape Verde 0.04 0.04 0.04 0.19 0.19 26 Ethiopia 0.02 0.02 0.00 0.14 0.18 44 Ghana 0.04 0.04 0.04 0.26 0.37 27 Kenya 0.06 0.06 0.03 0.26 0.37 35 Lesotho 0.20 0.00 0.20 0.20 0.00 5 Madagascar 0.08 0.00 0.00 0.00 0.08 12 Malawi 0.00 0.00 0.00 0.43 0.71 7 Mali 0.00 0.00 0.00 0.00 0.00 13 Mozambique 0.01 0.01 0.01 0.34 0.21 77 Niger 0.00 0.00 0.00 0.00 0.00 6 Nigeria 0.00 0.00 0.00 0.15 0.19 26 Rwanda 0.09 0.09 0.09 0.18 0.09 11 Senegal 0.00 0.00 0.00 0.00 0.00 6 Tanzania 0.15 0.10 0.10 0.65 0.68 62 Uganda 0.03 0.02 0.03 0.31 0.38 94 Zambia 0.03 0.00 0.03 0.19 0.41 32 Total number 22 15 16 139 156 515
Table 5: Firm performance by supplier/buyer status
Buyers Suppliers None
mean std. dev. mean std. dev. mean std. dev.
product innovation 0.31 0.463 0.349 0.477 0.306 0.461 process innovation 0.196 0.397 0.238 0.426 0.207 0.406 labour productivity 9.862 1.446 9.823 1.383 9.449 0.512 Note: labour productivity is log sales (measured in US Dollars) per worker.

20
Table 6: Baseline regression – amount supplied and purchased
New Product New Process Labour Productivity Buy from MNE 0.018
(0.065) -0.134 (0.016)**
0.378 (0.186)**
Supply to MNE 0.156 (0.065)**
0.117 (0.061)*
0.258 (0.177)
Age 0.015 (0.019)
0.007 (0.017)
0.151 (0.057)***
exporter 0.112 (0.032)***
0.066 (0.030)**
0.262 (0.092)***
Size 0.007 (0.010)
0.015 (0.009)*
0.146 (0.032)***
R&D 0.165 (0.027)***
0.099 (0.025)***
0.029 (0.077)
Observations 1834 1829 1831 R squared 0.14 0.08 0.26 Notes: robust standard errors in parentheses; estimation includes full sets of country and industry dummies; ***, **, * denote 1, 5, and 10 percent statistical significance

21
Table 7: Model extension including imports and exports of intermediates
New Product New Process Labour Productivity Buy from MNE 0.036
(0.065) -0.120 (0.057)**
0.381 (0.193)**
Supply to MNE 0.163 (0.066)**
0.107 (0.063)*
0.170 (0.179)
Buy abroad 0.103 (0.037)***
0.090 (0.034)**
0.445 (0.106)***
Supply abroad -0.057 (0.066)
0.020 (0.063)
0.360 (0.183)**
Age 0.023 (0.019)
0.017 (0.017)
0.167 (0.058)***
exporter 0.128 (0.036)***
0.067 (0.033)**
0.171 (0.105)**
Size 0.002 (0.010)
0.009 (0.010)
0.122 (0.033)***
R&D 0.161 (0.027)***
0.095 (0.026)***
0.024 (0.078)
Observations 1795 1790 1792 R squared 0.15 0.08 0.26 Notes: robust standard errors in parentheses; estimation includes full sets of country and industry dummies; ***, **, * denote 1, 5, and 10 percent statistical significance

22
Table 8: Interaction of „linkage variables“ with dummy whether or not help was received from multinational customers in terms of upgrading the workforce (q. 54.4b)
New Product New Process Labour Productivity Buy from MNE 0.037
(0.074) -0.115 (0.063)*
0.456 (0.218)**
Supply to MNE 0.167 (0.076)**
0.048 (0.069)
0.172 (0.203)
Help * Buy from MNE
-0.089 (0.153)
-0.068 (0.130)
-0.321 (0.388)
Help * Supply to MNE
-0.050 (0.145)
0.366 (0.148)**
0.489 (0.392)
Received Help 0.008 (0.039)
-0.073 (0.034)**
-0.111 (0.102)
Age 0.015 (0.019)
0.006 (0.017)
0.151 (0.057)***
Exporter 0.112 (0.032)***
0.068 (0.030)**
0.265 (0.092)***
Size 0.007 (0.010)
0.016 (0.009)*
0.147 (0.033)***
R&D 0.166 (0.027)***
0.099 (0.025)***
0.029 (0.077)
Observations 1834 1829 1831 R squared 0.14 0.09 0.26 Notes: robust standard errors in parentheses; estimation includes full sets of country and industry dummies; ***, **, * denote 1, 5, and 10 percent statistical significance
23
Table 9: Interaction of „linkage variables“ with dummy whether or not help was received from multinational customers in terms of technology transfer (q. 54.5b)
New Product New Process Labour Productivity Buy from MNE 0.007
(0.076) -0.154 (0.064)**
0.528 (0.226)**
Supply to MNE 0.205 (0.078)**
0.076 (0.072)
-0.044 (0.201)
Help * Buy from MNE
0.051 (0.139)
0.083 (0.129)
-0.541 (0.373)
Help * Supply to MNE
-0.144 (0.142)
0.166 (0.134)
1.068 (0.369)***
Received Help -0.022 (0.035)
-0.042 (0.033)
-0.071 (0.095)
Age 0.015 (0.019)
0.006 (0.017)
0.150 (0.057)***
Exporter 0.113 (0.032)***
0.067 (0.030)**
0.257 (0.092)***
Size 0.008 (0.010)
0.016 (0.009)*
0.145 (0.033)***
R&D 0.167 (0.027)***
0.098 (0.025)***
0.028 (0.077)
Observations 1834 1829 1831 R squared 0.14 0.08 0.26 Notes: robust standard errors in parentheses; estimation includes full sets of country and industry dummies; ***, **, * denote 1, 5, and 10 percent statistical significance
24
Table 10: Interaction of „linkage variables“ with dummy whether or not support was received for “match making” (q. 33.15)
New Product New Process Labour Productivity Buy from MNE 0.022
(0.066) -0.113 (0.057)**
0.339 (0.191)*
Supply to MNE 0.137 (0.066)**
0.087 (0.061)
0.242 (0.182)
Match making * Buy from MNE
-0.060 (0.327)
-0.430 (0.208)**
0.719 (0.771)
Match making * Supply to MNE
0.346 (0.357)
0.555 (0.212)***
0.289 (0.823)
Match Making -0.043 (0.056)
0.034 (0.055)
0.103 (0.172)
Age 0.012 (0.020)
0.010 (0.018)
0.172 (0.058)***
Exporter 0.113 (0.032)***
0.066 (0.030)**
0.249 (0.093)***
Size 0.007 (0.010)
0.016 (0.009)*
0.145 (0.033)***
R&D 0.167 (0.027)***
0.099 (0.025)***
0.031 (0.077)
Observations 1834 1829 1831 R squared 0.14 0.09 0.26 Notes: robust standard errors in parentheses; estimation includes full sets of country and industry dummies; ***, **, * denote 1, 5, and 10 percent statistical significance

25
Table 11: Interaction of „linkage variables“ with dummy whether or not support was received for “finding key staff” (q. 33.12)
New Product New Process Labour Productivity Buy from MNE 0.007
(0.066) -0.125 (0.057)**
0.375 (0.189)**
Supply to MNE 0.152 (0.066)**
0.098 (0.062)
0.236 (0.180)
Key Staff * Buy from MNE
0.304 (0.323)
-0.158 (0.225)
0.072 (0.754)
Key Staff * Supply to MNE
0.260 (0.487)
0.821 (0.211)***
1.296 (1.039)
Key Staff -0.040 (0.060)
-0.011 (0.056)
0.144 (0.174)
Age 0.015 (0.020)
0.008 (0.018)
0.171 (0.058)***
Exporter 0.112 (0.032)***
0.067 (0.030)**
0.252 (0.093)***
Size 0.007 (0.010)
0.016 (0.009)*
0.145 (0.033)***
R&D 0.167 (0.027)***
0.098 (0.025)***
0.027 (0.077)
Observations 1834 1829 1831 R squared 0.14 0.09 0.26 Notes: robust standard errors in parentheses; estimation includes full sets of country and industry dummies; ***, **, * denote 1, 5, and 10 percent statistical significance
26
Table 12: Interaction of „linkage variables“ with dummy whether or not support was received for technology upgrading (q. 33.16)
New Product New Process Labour Productivity Buy from MNE 0.008
(0.066) -0.126 (0.057)**
0.371 (0.190)**
Supply to MNE 0.153 (0.066)**
0.096 (0.062)
0.233 (0.180)
Upgrading * Buy from MNE
0.285 (0.328)
-0.115 (0.224)
0.227 (0.834)
Upgrading * Supply to MNE
0.262 (0.518)
0.875 (0.226)***
1.362 (1.159)
Upgrading -0.017 (0.066)
-0.035 (0.057)
0. 15 (0.224)
Age 0.017 (0.019)
0.007 (0.018)
0.160 (0.058)***
Exporter 0.111 (0.032)***
0.067 (0.030)**
0.258 (0.093)***
Size 0.007 (0.010)
0.016 (0.009)*
0.146 (0.033)***
R&D 0.167 (0.027)***
0.098 (0.025)***
0.028 (0.077)
Observations 1834 1829 1831 R squared 0.14 0.09 0.26 Notes: robust standard errors in parentheses; estimation includes full sets of country and industry dummies; ***, **, * denote 1, 5, and 10 percent statistical significance
Table 13: Technology upgrading and linkages by sector - product innovation
Extractive Manufacturing Services Buy from MNE -0.669
(0.359)* 0.069 (0.073)
-0.159 (0.134)
Supply to MNE 0.056 (0.320)
0.138 (0.072)*
0.269 (0.225)
Upgrading * Buy from MNE
1.329 (1.606)
0.088 (0.326)
2.122 (0.374)***
Upgrading * Supply to MNE
-2.829 (4.130)
0.209 (0.548)
1.121 (0.618)*
Upgrading 0.037 (0.324)
-0.051 (0.079)
-0.017 (0.147)
Observations 85 1433 316 R squared 0.27 0.13 0.28 Notes: robust standard errors in parentheses; estimation includes full sets of country and industry dummies and controls as in Table 12; ***, **, * denote 1, 5, and 10 percent statistical significance

27
Table 14: Technology upgrading and linkages by sector - new process innovation
Extractive Manufacturing Services Buy from MNE -0.378
(0.259) -0.087 (0.065)
-0.236 (0.134)*
Supply to MNE 0.045 (0.193)
0.105 (0.069)
0.034 (0.207)
Upgrading * Buy from MNE
2.367 (1.255)*
-0.011 (0.281)
-0.097 (0.444)
Upgrading * Supply to MNE
5.202 (3.175)
0.873 (0.202)***
1.704 (0.771)**
Upgrading 0.371 (0.252)
-0.089 (0.065)
-0.076 (0.061)
Observations 85 1426 318 R squared 0.31 0.09 0.16 Notes: robust standard errors in parentheses; estimation includes full sets of country and industry dummies and controls as in Table 12; ***, **, * denote 1, 5, and 10 percent statistical significance
Table 15: Technology upgrading and linkages by sector – labour productivity
Extractive Manufacturing Services Buy from MNE -1.441
(1.2144) 0.330 (0.204)
1.172 (0.505)**
Supply to MNE -0.918 (1.019)
0.521 (0.189)***
-2.012 (0.´524)***
Upgrading * Buy from MNE
3.307 (3.693)*
-0.305 (0.819)
-2.761 (2.410)
Upgrading * Supply to MNE
12.009 (7.229)
0.431 (1.158)
2.974 (2.903)
Upgrading -0.510 (0.420)
0.069 (0.2274)
-0.280 (0.597)
Observations 86 1428 317 R squared 0.29 0.26 0.37 Notes: robust standard errors in parentheses; estimation includes full sets of country and industry dummies and controls as in Table 12; ***, **, * denote 1, 5, and 10 percent statistical significance
28
Appendix
Table A1: Sample coverage of the AIS 2010
Total number of firms in survey
Burkina Faso 100 Burundi 133 Cameroon 138 Cape Verde 286 Ethiopia 441 Ghana 242 Kenya 324 Lesotho 103 Madagascar 109 Malawi 84 Mali 211 Mozambique 191 Niger 85 Nigeria 466 Rwanda 116 Senegal 187 Tanzania 306 Uganda 413 Zambia 217 Total 4,152