Embed Size (px)
Citation preview

1
Linkages of Fisheries Sectors to Hawaii’s Economy
& Economic Impacts
of Longline Fishing Regulations Junning Cai1, PingSun Leung1, Minling Pan2, Sam Pooley2
1College of Tropical Agriculture & Human Resources, UHM2Pacific Islands Fisheries Science Center, NMFS

Objectives
2
• Linkage analysis:Input-purchasing and output-sellingrelationship between Hawaii’s fisheries and non-fisheries sectors
• Impact analysisLinkage impacts of Hawaii longline fishing regulations

3
Linkage Analysis
Methodology

Hawaii’s 1992 Input-Output Model
4
Sectors Longline boats
Small boats
Charter boats
R&E boats
Agri-culture
Manufac-turing Trade Service PCE
Other Final
Demand
Total output
Longline boats 0 0 0 0 0 3 13 6 4 17 44
Small boats 0 0 0 0 0 3 2 1 5 2 14
Charter boats 0 0 0 0 0 0 0 0 4 11 16
R&E boats 0 0 0 0 0 2 1 0 21 0 24
Agriculture 0 0 0 0 76 298 9 117 58 211 769
Manufacturing 10 5 3 13 43 489 938 682 753 4,850 7,785
Trade 4 1 3 4 39 541 1,054 1,123 3,909 5,947 12,625
Services 2 1 3 2 32 414 1,158 3,286 9,444 11,795 26,136
Labor income 21 6 6 0 323 2,653 4,869 12,297 0 0 20,176
Other value added 2 1 1 0 146 715 2,927 6,592 0 0 10,385
Imports 5 1 0 5 109 2,667 1,653 2,032 4,304 4,322 15,097
Total input 44 14 16 24 769 7,785 12,625 26,136 18,502 27,156 93,072

Leontief Input-Output Model
5
⎟⎟⎟⎟⎟
⎠
⎞
⎜⎜⎜⎜⎜
⎝
⎛
++++=
++++=++++=
nnnnnnn
nn
nn
FXaXaXaX
FXaXaXaXFXaXaXaX
...
......
2211
222221212
112121111
M⎟⎟⎟⎟⎟
⎠
⎞
⎜⎜⎜⎜⎜
⎝
⎛
+
⎟⎟⎟⎟⎟
⎠
⎞
⎜⎜⎜⎜⎜
⎝
⎛
⎟⎟⎟⎟⎟
⎠
⎞
⎜⎜⎜⎜⎜
⎝
⎛
=
⎟⎟⎟⎟⎟
⎠
⎞
⎜⎜⎜⎜⎜
⎝
⎛
nnnnnn
n
n
n F
FF
X
XX
aaa
aaaaaa
X
XX
MMMM2
1
2
1
21
22221
11211
2
1
...
......
FAXX += FAIX 1)( −−=
Leontief inverse
L++++=− − 321 AAAIA)(I

Ghosh Input-Output Model
6
⎟⎟⎟⎟⎟
⎠
⎞
⎜⎜⎜⎜⎜
⎝
⎛
++++=
++++=++++=
nnnnnnn
nn
nn
WXbXbXbX
WXbXbXbXWXbXbXbX
...
......
2211
222221122
112211111
M
( ) ( ) ( )n
nnnn
n
n
nn WWW
bbb
bbbbbb
XXXXXX ...
...
......
...... 21
21
22221
11211
2121 +
⎟⎟⎟⎟⎟
⎠
⎞
⎜⎜⎜⎜⎜
⎝
⎛
=M
''' WBXX +=
1)('' −−= BIWX
Ghosh inverse
L++++=− − 321 BBBIB)(I

Input-Output Linkages
7
• Backward linkage– Input-purchasing perspective– Upstream sectors– Quantity model
• Forward linkage– Output-selling perspective– Downstream sectors– Price model
• Total linkage (?)

Linkage Measures
8
• Backward linkage– Leontief column sums (traditional demand-driven measure)– Absolute backward linkage (Dietzenbacher & van der Linden, 1997)– Pure backward linkage (Sonis et al., 1995)– Leontief supply-driven multiplier (Leung and Pooley, 2002; Cai and
Leung, 2004)
• Forward linkage– Leontief row sums– Ghosh row sums (traditional primary-input driven)– Absolute forward linkage (Dietzenbacher & van der Linden, 1997)– Pure forward linkage (Sonis et al., 1995)– Leontief supply-driven multiplier (Leung and Pooley, 2002; Cai and
Leung, 2004)
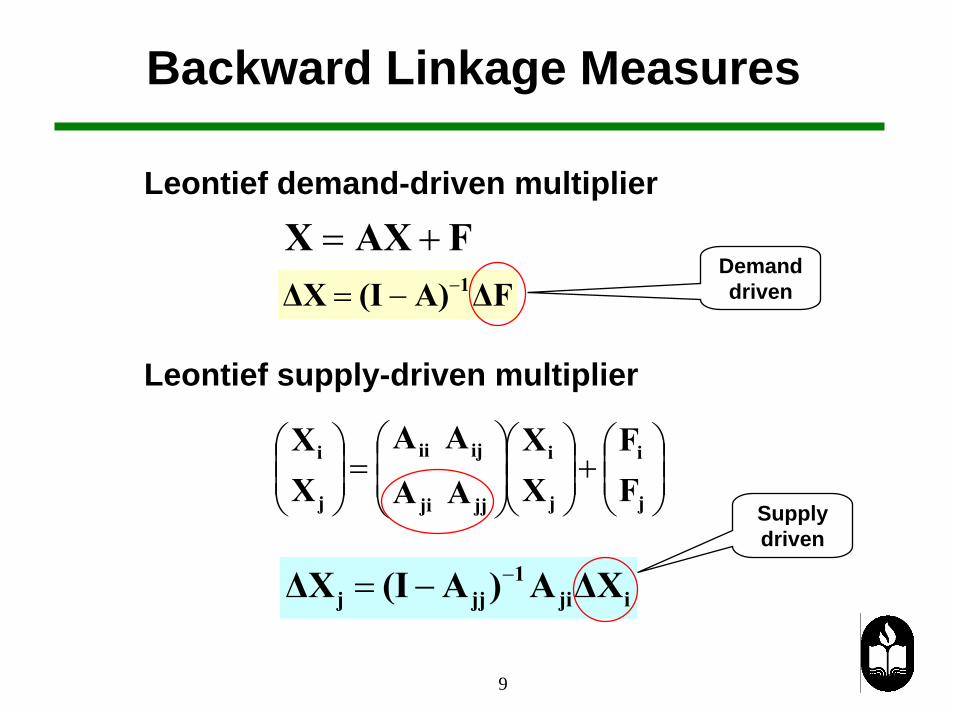
Backward Linkage Measures
9
Leontief demand-driven multiplier
FAXX +=
⎟⎟⎠
⎞⎜⎜⎝
⎛+⎟⎟⎠
⎞⎜⎜⎝
⎛⎟⎟⎠
⎞⎜⎜⎝
⎛=⎟⎟
⎠
⎞⎜⎜⎝
⎛
j
i
j
i
jjji
ijii
j
i
FF
XX
AA
AAXX
iji1
jjj ∆XA)A(I∆X −−=
Leontief supply-driven multiplier
∆FA)(I∆X 1−−=Demand driven
Supply driven
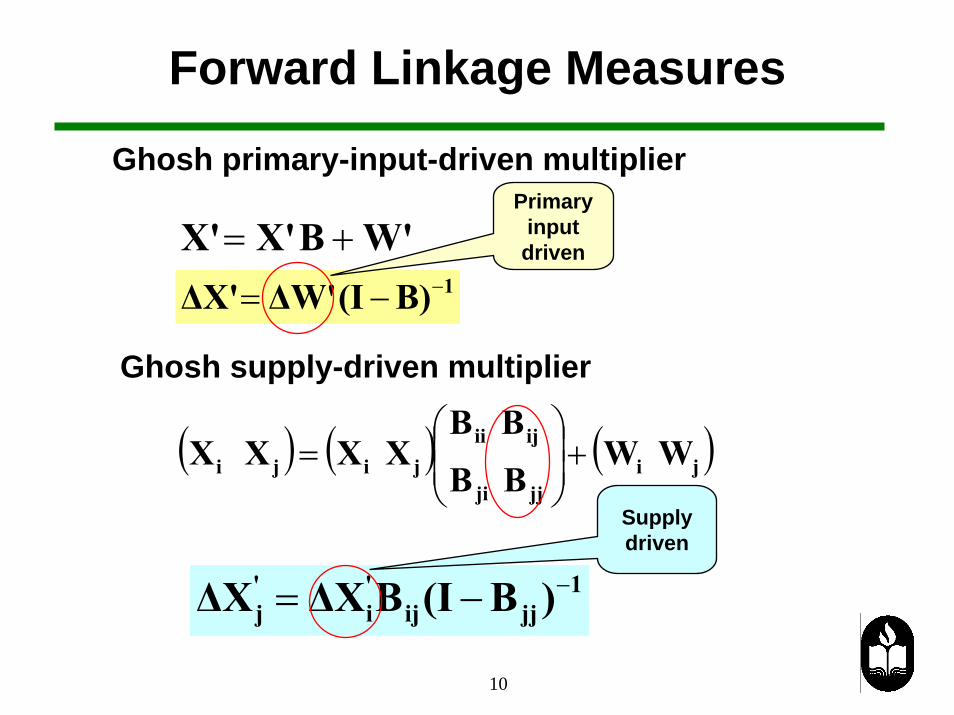
Forward Linkage Measures
10
Ghosh primary-input-driven multiplier
W'BX'X' +=
( ) ( ) ( )jijjji
ijiijiji WW
BB
BBXXXX +⎟
⎟⎠
⎞⎜⎜⎝
⎛=
Ghosh supply-driven multiplier
1jjij
'i
'j )B(IB∆X∆X −−=
1B)(I∆W'∆X' −−=
Primary input driven
Supply driven

Linkage Measures and Indices
11
Backward linkage measure Forward linkage measure
1jjij )B(IB −−=iGSDji
1jj A)A(I −−=iLSD
Backward linkage index Forward linkage index
/nLSDLSD
LSDBL
jji
ii
⎟⎟⎠
⎞⎜⎜⎝
⎛+
=
∑ /nGSDGSD
GSDFL
jji
ii
⎟⎟⎠
⎞⎜⎜⎝
⎛+
=
∑

Hawaii’s Fisheries Sectors (1997)
12
SectorsOutput
($ million)
Valueadded
($ million)
Wage Income
($ million)
Proprietor Income
($ million)
Wage Jobs
Proprietorjobs
Tuna longline 27.37 16.46 7.30 2.49 215 191
Swordfish longline 22.67 11.24 4.15 1.45 116 102
Small commercial boats 11.70 6.55 0.29 5.40 10 507
Charter boats 14.17 8.39 4.67 1.42 175 67
Expense boats 3.94 -0.32 0.00 -0.78 0 1,008
Recreation boats 10.30 0.00 0.00 0.00 0 0
Total fishing industry 90 42 16 10 516 1,875
Total Hawaii economy 58,660 38,537 21,626 2,088 615,545 126,686
Source: Hawaii 1997 input-output table (SMS, 2004)

13
Linkage Analysis
Results
14
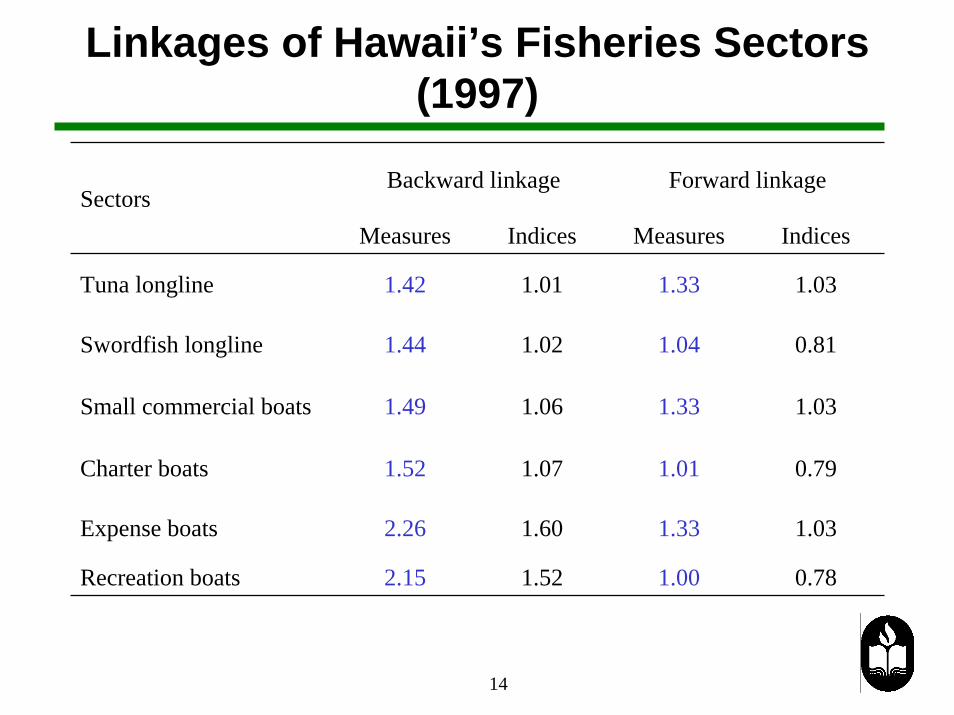
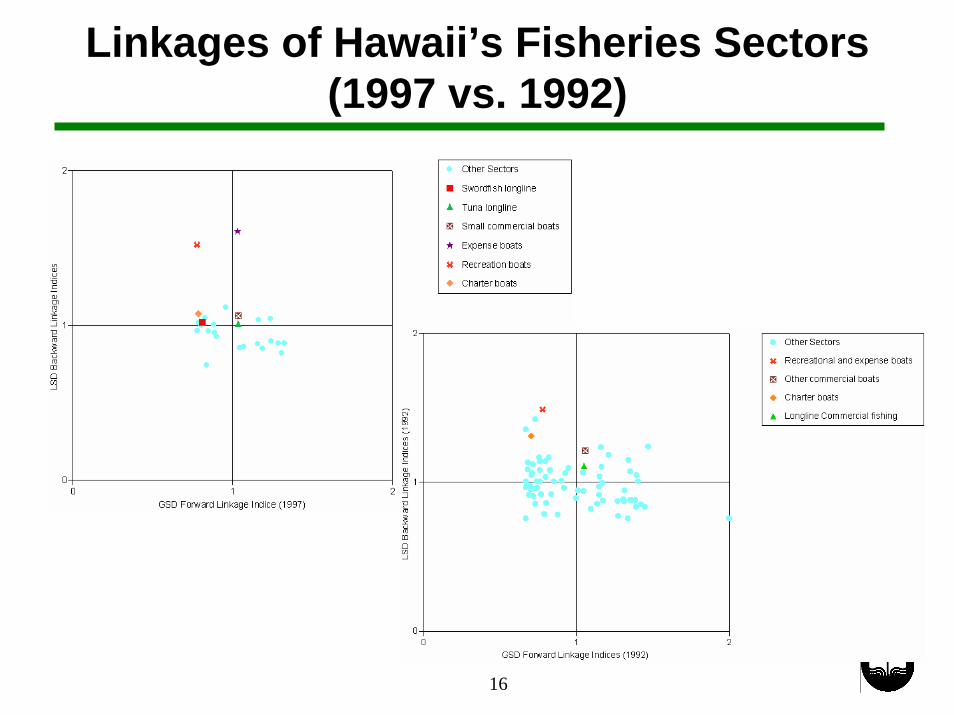
Linkages of Hawaii’s Fisheries Sectors (1997)
Backward linkage Forward linkage
Measures Indices Measures Indices
Tuna longline 1.42 1.01 1.33 1.03
Swordfish longline 1.44 1.02 1.04 0.81
Small commercial boats 1.49 1.06 1.33 1.03
Charter boats 1.52 1.07 1.01 0.79
Expense boats 2.26 1.60 1.33 1.03
Recreation boats 2.15 1.52 1.00 0.78
Sectors
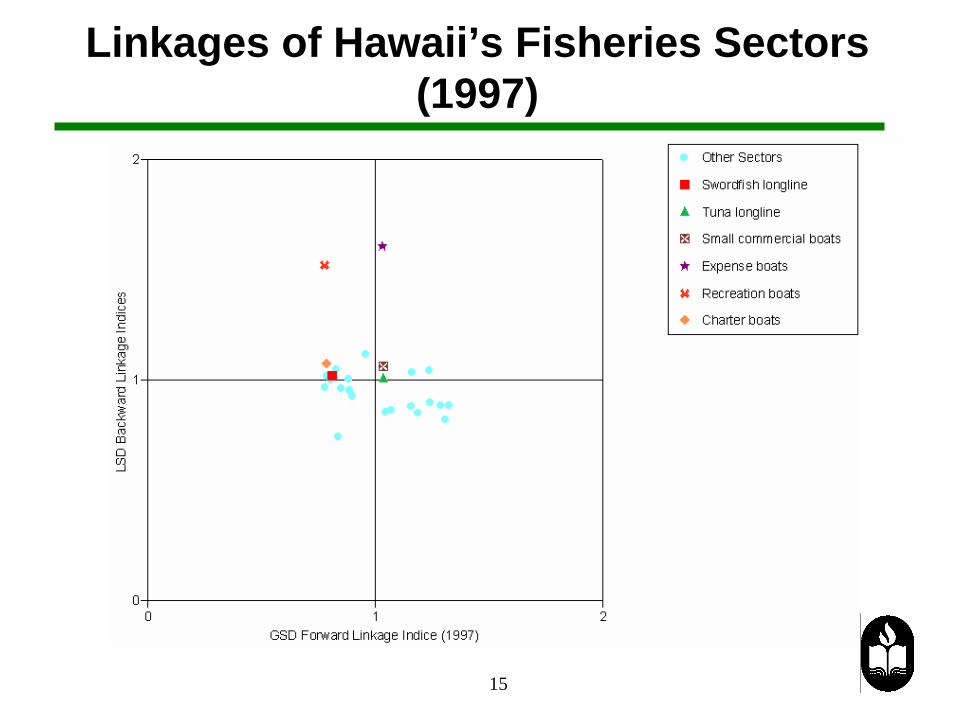
15
Linkages of Hawaii’s Fisheries Sectors (1997)
16
Linkages of Hawaii’s Fisheries Sectors (1997 vs. 1992)

17
Impact Analysis
Background and Methodology
Impacts of Hawaii’s Longline Regulations
18
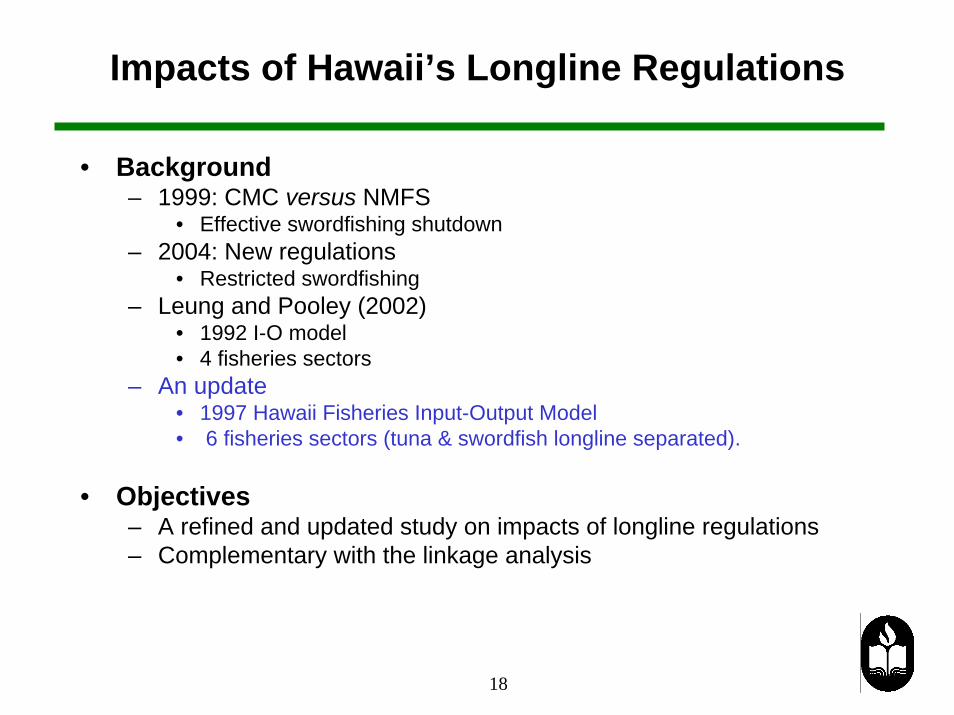
• Background– 1999: CMC versus NMFS
• Effective swordfishing shutdown – 2004: New regulations
• Restricted swordfishing– Leung and Pooley (2002)
• 1992 I-O model• 4 fisheries sectors
– An update • 1997 Hawaii Fisheries Input-Output Model• 6 fisheries sectors (tuna & swordfish longline separated).
• Objectives– A refined and updated study on impacts of longline regulations– Complementary with the linkage analysis
19
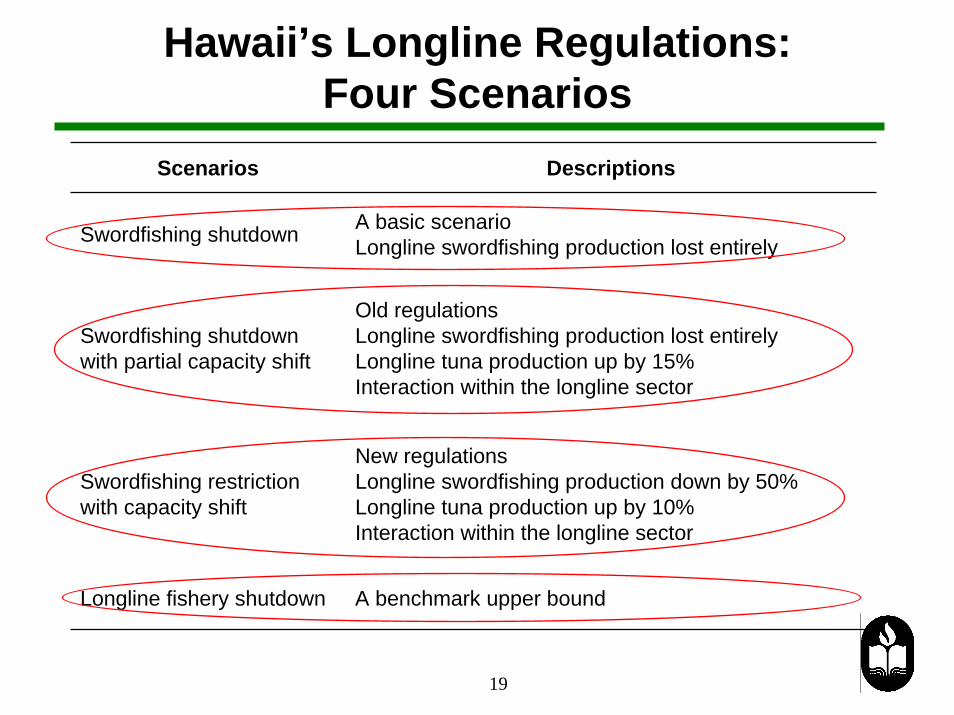
Hawaii’s Longline Regulations: Four Scenarios
Scenarios Descriptions
Swordfishing shutdown A basic scenarioLongline swordfishing production lost entirely
Swordfishing shutdown with partial capacity shift
Old regulationsLongline swordfishing production lost entirelyLongline tuna production up by 15%Interaction within the longline sector
Swordfishing restriction with capacity shift
New regulationsLongline swordfishing production down by 50%Longline tuna production up by 10%Interaction within the longline sector
Longline fishery shutdown A benchmark upper bound

20
Impact Analysis
Results

Impacts of Hawaii Longline Regulations
21
Scenarios Impacts Output ($ million )
Value-added
($ million)
Wage income
($ million)
Proprietor's income
($ million)
State taxes($ million)
Wage jobs
Proprietor's jobs
Self impact -22.67 -11.24 -4.15 -1.45 -0.67 -116 -102
Backward-linkage impact -9.93 -5.68 -3.03 -0.29 -0.67 -89 -25 Swordfishing shutdown
Forward-linkage impact -0.86 -0.45 -0.29 -0.01 -0.05 -14 0
Self impact -18.56 -8.77 -3.05 -1.08 -0.53 -83 -74
Backward-linkage impact -8.20 -4.69 -2.49 -0.24 -0.56 -72 -20
Swordfishing shutdown
with partial capacity shift Forward-linkage impact 0.49 0.24 0.16 0.01 0.02 9 0
Self impact -8.60 -3.98 -1.34 -0.48 -0.24 -36 -32
Backward-linkage impact -3.81 -2.18 -1.16 -0.11 -0.26 -33 -9
Swordfishing restriction
with capacity shift Forward-linkage impact 0.47 0.23 0.15 0.01 0.02 8 0
Self impact -50.04 -27.71 -11.45 -3.94 -1.64 -331 -293
Backward-linkage impact -21.44 -12.30 -6.64 -0.67 -1.41 -200 -58 Longline fishery
shutdown Forward-linkage impact -9.85 -5.05 -3.25 -0.15 -0.54 -167 -6

Detailed Impacts of Hawaii Longline Regulations
22
Affected Sectors Output(Million $)
Value-added(Million $)
W age income(Million $)
Proprietor's income
(Million $)
Total income(Million $) W age jobs Proprietor's
jobs Total jobs State taxes(Million $)
Small commercial boats 0.00 0.00 0.00 0.00 0.00 0 0 0 0.00Expense boats 0.00 0.00 0.00 0.00 0.00 0 0 0 0.00Recreation boats 0.00 0.00 0.00 0.00 0.00 0 0 0 0.00Charter boats 0.00 0.00 0.00 0.00 0.00 0 0 0 0.00Agriculture -0.06 -0.04 -0.02 0.00 -0.02 -1 -1 -2 0.00Mining and construction -0.06 -0.03 -0.02 0.00 -0.02 0 0 -1 0.00Food processing -0.23 -0.08 -0.04 0.00 -0.04 -1 0 -2 0.00Other manufacturing -2.00 -0.48 -0.27 -0.04 -0.31 -7 -2 -9 -0.02Transportation -0.44 -0.22 -0.13 0.00 -0.13 -3 0 -3 -0.01Information -0.18 -0.11 -0.05 0.00 -0.05 -1 0 -1 -0.01Utilities -0.10 -0.05 -0.02 0.00 -0.02 0 0 0 -0.01W holesale trade -3.77 -2.70 -1.46 -0.05 -1.51 -38 -7 -45 -0.46Retail trade -0.20 -0.13 -0.08 -0.01 -0.09 -3 -1 -4 -0.03Finance and insurance -0.50 -0.30 -0.14 -0.01 -0.15 -3 -1 -4 -0.02Real estate and rentals -0.54 -0.41 -0.03 -0.02 -0.05 -1 -1 -2 -0.02Professional services -0.20 -0.13 -0.08 -0.04 -0.12 -2 -2 -3 -0.01Business services -0.33 -0.24 -0.15 -0.03 -0.18 -7 -2 -8 -0.02Educational services -0.01 0.00 0.00 0.00 0.00 0 0 0 0.00Health services 0.00 0.00 0.00 0.00 0.00 0 0 0 0.00Arts and entertainment 0.00 0.00 0.00 0.00 0.00 0 0 0 0.00Hotels -0.01 0.00 0.00 0.00 0.00 0 0 0 0.00Eating and drinking -0.02 -0.01 -0.01 0.00 -0.01 0 0 0 0.00Other services -1.14 -0.61 -0.43 -0.08 -0.52 -18 -8 -26 -0.05Government -0.14 -0.13 -0.11 0.00 -0.11 -3 0 -3 -0.01
Total backw ardlinkage impacts -9.93 -5.68 -3.03 -0.29 -3.33 -89 -25 -114 -0.67
Table A.1: Backw ard-linkage Impacts of Sw ordfishing Shutdow n

Detailed Impacts of Hawaii Longline Regulations
23
Affected Sectors Output(M illion $)
Value-added(Million $)
W age income(Million $)
Proprietor's income
(Million $)
Total income(Million $) W age jobs Proprietor's
jobs Total jobs State taxes(Million $)
Small commercial boats 0.00 0.00 0.00 0.00 0.00 0 0 0 0.00Expense boats 0.00 0.00 0.00 0.00 0.00 0 0 0 0.00Recreation boats 0.00 0.00 0.00 0.00 0.00 0 0 0 0.00Charter boats 0.00 0.00 0.00 0.00 0.00 0 0 0 0.00Agriculture 0.00 0.00 0.00 0.00 0.00 0 0 0 0.00Mining and construction 0.00 0.00 0.00 0.00 0.00 0 0 0 0.00Food processing 0.10 0.03 0.02 0.00 0.02 1 0 1 0.00Other manufacturing 0.00 0.00 0.00 0.00 0.00 0 0 0 0.00Transportation 0.01 0.00 0.00 0.00 0.00 0 0 0 0.00Information 0.00 0.00 0.00 0.00 0.00 0 0 0 0.00Utilities 0.00 0.00 0.00 0.00 0.00 0 0 0 0.00W holesale trade 0.00 0.00 0.00 0.00 0.00 0 0 0 0.00Retail trade 0.00 0.00 0.00 0.00 0.00 0 0 0 0.00Finance and insurance 0.00 0.00 0.00 0.00 0.00 0 0 0 0.00Real estate and rentals 0.00 0.00 0.00 0.00 0.00 0 0 0 0.00Professional services 0.00 0.00 0.00 0.00 0.00 0 0 0 0.00Business services 0.00 0.00 0.00 0.00 0.00 0 0 0 0.00Educational services 0.00 0.00 0.00 0.00 0.00 0 0 0 0.00Health services 0.00 0.00 0.00 0.00 0.00 0 0 0 0.00Arts and entertainment 0.00 0.00 0.00 0.00 0.00 0 0 0 0.00Hotels -0.02 -0.01 -0.01 0.00 -0.01 0 0 0 0.00Eating and drinking 0.38 0.20 0.14 0.01 0.14 8 0 9 0.02Other services 0.00 0.00 0.00 0.00 0.00 0 0 0 0.00Government 0.00 0.00 0.00 0.00 0.00 0 0 0 0.00
Total Forw ardlinkage impacts 0.49 0.24 0.16 0.01 0.16 9 0 9 0.02
Table A.4: Forw ard-linkage Im pacts of Sw ordfishing Shutdow n w ith Partial Capacity Shift

24
Supply-Driven: A Powerful and Flexible Approach
• Shocks– Regulations– Oil prices– Other supply-side shocks
• Interactions– Between swordfish and tuna longline– Between longline and other fisheries sectors (Pradhan et al. 2003;
Sharma et al., 2003)– Other non-input-output linkages
• Impacts– Quantity– Price
• Extensions– More refined input-output models – Social Accounting Matrices (SAM)– Computable Equilibrium Models (CGE)
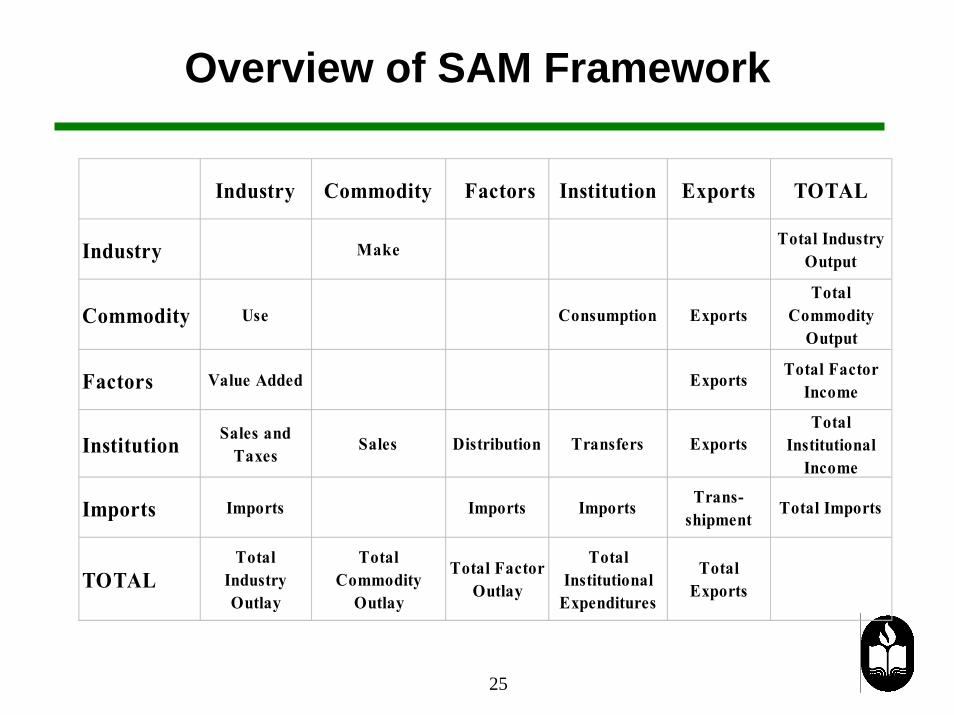
Overview of SAM Framework
25
Industry Commodity Factors Institution Exports TOTAL
Industry Make Total Industry Output
Commodity Use Consumption ExportsTotal
Commodity Output
Factors Value Added Exports Total Factor Income
Institution Sales and Taxes
Sales Distribution Transfers ExportsTotal
Institutional Income
Imports Imports Imports Imports Trans-shipment
Total Imports
TOTALTotal
Industry Outlay
Total Commodity
Outlay
Total Factor Outlay
Total Institutional
Expenditures
Total Exports

26
Thank You

Presentation Outline
27
• Linkage analysis– Input-output framework: a brief introduction
• Leontief I-O model• Ghosh I-O model
– Input-output linkages: basic concepts • Backward linkage• Forward linkage• Total linkage?
– Linkage measures: revisit and suggested alternative• Demand driven• Supply/output driven
– Linkages of Hawaii fisheries sectors
• Impact analysis– Longline regulations: background– Economic impacts of longline regulations: Leung and Pooley (2002)– Economic impacts of longline regulations: an update (more I-O
information and newer regulations)