Embed Size (px)
Citation preview

Planning Report 11-1
The Theory and Practiceof Public-Sector R&DEconomic ImpactAnalysis
Albert N. LinkDepartment of Economics
University of North Carolinaat Greensboro
John T. ScottDepartment of Economics
Dartmouth College
January 2012

The Theory and Practice of Public-Sector R&D
Economic Impact Analysis
Albert N. Link Department of Economics
University of North Carolina at Greensboro
John T. Scott Department of Economics
Dartmouth College
January 2012


Contents
Executive Summary i
I. Introduction 1
II. Economics Foundation for an Impact Analysis 4
Counterfactual Methodology 6
Spillover Methodology 7
Impact Analysis in Practice 8
III. NIST R&D Economic Impact Analyses 9
Overview of NIST Impact Analyses 9
Status-Quo Technology 14
Complete Replacement of Infrastructure Technology 14
A Summarizing Restatement 15
Mixed Case Counterfactual Analysis 15
Data about Economic Impacts 16
Outcome Metrics 23
IV. Other Techniques Relevant to an Economic Impact Analysis 30
Econometric Models 30
Productivity Models 33
Benchmarking Analysis 33
Innovation Surveys 34
Expert Panels and Peer Reviews 35
Network Analysis 36
V. Conclusions 38
Appendix 45
References 81


Executive Summary
This Planning Report summarizes NIST’s previous economic impact analyses and
provides guidelines for NIST’s management for planning, conducting, and interpreting
NIST’s future economic impact analyses that (1) document the economic contribution of
NIST’s investments in infrastructure technology (infratechnology) and (2) inform
management about the effectiveness of past projects and guide strategic planning.
Motivating this Planning Report is the general expectation and challenge for public
institutions to be accountable for their use of public resources. Economic impact analysis is
one way that public institutions can quantify the social contribution of their activity. Impact
analysis can also provide important lessons to management about the effectiveness of
previous resource allocation decisions, and it can provide guidelines for future strategic
planning.
Economic impact analysis addresses the central question: How do the social benefits
associated with a publicly supported R&D program compare to society’s costs to undertake
the program? The traditional economics methodology for analyzing public-sector R&D
programs estimates economic social rates of return by adding the public and the private
investments through time to determine social investment costs, and then the stream of new
economic surplus generated from those investments is the benefit. The streams of investment
outlays through time—the costs—generate streams of economic surplus through time—the
benefits. Once identified and measured, these streams of costs and benefits are used to
calculate rates of return, benefit-to-cost ratios, and other related metrics that are described in
this Planning Report.
To consider the net benefits of the public sector undertaking the research as opposed to
the private sector, an alternative methodology is often appropriate. This Planning Report
explains the appropriate approach—termed the “counterfactual methodology.”
Counterfactual rates of return and benefit-to-cost ratios can be calculated to answer the
fundamental evaluation question: Are the public investments a more efficient way of
generating the technology than private sector investments would have been? Seventeen (17)
NIST economic impact analyses are discussed in the context of the traditional methodology
and the complementary approach of the counterfactual methodology that allows comparing
the relative efficiencies of public performance (typically as a public-private partnership) and
private performance of the infratechnology project.
The economic impact analyses consider NIST’s investments in research to develop
infratechnology. Tassey (2007, p. 112) observes: “Infratechnologies leverage the
ii
development and efficient use of technology at all three major stages of economic activity:
R&D, manufacturing, and commercialization.” Measurement and test methods are examples
of infratechnology. They are required for the efficient conduct of R&D, control of
production, and many market transactions. Infratechnologies also are the basis for technical
and functional interfaces among the products that constitute a system or tiers in a supply
chain. Further, product acceptance testing protocols and standards assure consumers that
technology-based products perform as specified.
Infratechnologies have characteristics of both private and public goods and are therefore
referred to as “quasi-public” goods. This term means that both industry and government will
invest in their development and use. In particular, infratechnologies have economic value
only if they are uniformly and widely used, often as standards. As such, the private sector
will underinvest in infratechnologies because of its inability to appropriate fully the benefits
from such investments. Thus, a theoretical basis for NIST’s role in the provision of
infratechnologies is based on the economic concept of market failure.
This Planning Report discusses each of the 17 NIST economic impact analyses in the
context of the stages of economic activity—R&D, production, or commercialization—
benefiting from the infrastructure technology research studied in each analysis. The analyses
find that there are typically benefits for private-sector conduct of R&D because R&D is more
difficult without state-of-the-art infratechnologies, such as measurement and test methods
and critically evaluated scientific data. There are benefits for production because data,
measurement methods, process control models, etc. contribute to better process control.
Also, there are benefits for commercialization because products are of higher quality
(yielding more value to consumers) and the infratechnologies lower transaction costs through
product acceptance testing standards (lower overall acquisition costs for consumers and
accelerate market penetration).
In addition to discussing the findings in the 17 analyses about the benefits for the three
stages of activity, the report explains how the benefits of NIST’s infratechnology investments
occur throughout the supply chains in industry, from the producers of materials through the
producers of intermediate products to the final consumers of the product or service. The 17
analyses are also discussed in the context of where in the relevant supply chains the benefits
were realized and the extent to which those benefits could be estimated quantitatively and
incorporated into the evaluation metrics presented in each analysis.
Typically, the first level of beneficiaries will be firms at the early tiers in a supply chain.
The benefit here could be improved performance of an instrument that is calibrated using the
standards and calibration services developed at NIST, or it could be a reference material used
in the calibration that is traceable to NIST standards. Beneficiaries at the middle tiers could

iii
be manufacturers or service providers that use the inputs purchased from the upstream firms
to more efficiently manufacture a product that will be sold to OEMs or service providers at
the end of the supply chain. Such firms, for example, might use an instrument that measures
the wavelength of light to manufacture components that will be used in fiber optics
communications systems assembled and sold by the final tiers. Other end users might benefit
from a reference material traceable to NIST standards to measure the sulfur content of a fuel
that will be used in the production of energy. At the very end of supply chains are customers
who use the services of a fiber optics communication system or those who use the energy
produced with fuel with content meeting specifications traceable to NIST standards.
The review of the 17 economic impact analyses provides many examples of the scope of
data available to estimate the benefits of NIST’s infratechnology investments for the three
stages of economic activity: R&D, production, and commercialization, and for the levels of
the supply chain. However, the analyses are typically unable to quantify benefits for all three
stages of activity and for all tiers of the relevant supply chains, even when the scope of the
benefits includes all three stages of activity and extends throughout the supply chain. The
analyses then acknowledge the limitations and observe that the evaluation metrics are
conservative in the sense that they will systematically underestimate the true benefits of
NIST’s infratechnology investments.
Further, these analyses largely focused on estimates of cost avoidance resulting from
more efficient R&D, production, and market transactions. Other categories of benefits, such
as R&D cycle time reduction, quality impacts and market share growth, are more difficult to
attribute to any single factor, making the portion of the impact attributable to NIST more
difficult. In such cases, the qualitative impacts are noted and described.
The quantitative data about benefits and costs are summarized with outcome metrics.
The metrics used in the NIST economic impact analyses are explained in this Planning
Report; they are the internal rate of return (IRR), the benefit-to-cost ratio (B/C), and net
present value (NPV).
In addition to economics-based traditional and counterfactual methodologies used to
develop the metrics in NIST’s economic impact analyses, other complementary techniques
relevant to economic impact analysis include econometric models, productivity models,
benchmarking analysis, innovation surveys, expert panels and peer review, and network
analysis. This Planning Report describes these complementary techniques and discusses
them in the context of economic impact analysis.
From the review of the 17 NIST economic impact analyses, this Planning Report
develops recommendations and methodology lessons as guidelines for future economic

iv
impact analyses. The lessons learned and recommendations are discussed in detail and
illustrated with examples within the Planning Report, but are listed briefly here:
• The timing of an economic impact analysis is important—sufficient time must have
passed for the effects of the infratechnology to be observed but the time during which the
greatest effects of the infratechnology were realized must not be so far in the past that
gathering good information about the benefits is not possible.
• Benefit data for most economic impact analyses come from detailed interviews or
surveys, but possibilities for using published data (in conjunction with or in place of
gathering new survey data) should be considered and used when appropriate information
is available.
• When benefit data are gathered by survey, the study team should be given access to
the addresses and other contact information for the entities surveyed. Without such
access, low response rates result because the research team cannot contact the potential
respondents directly and explain the importance of participation.
• Before an infratechnology investment is undertaken, NIST should be sure that a
significant underinvestment gap exists and it should understand what other stakeholders
or economic agents might be involved in the gap’s removal.
• NIST project managers should maintain key contacts with the users of their projects’
outputs at all stages of the supply chain and communicate with those contacts about the
types of data that will be needed to estimate benefits. Ideally such data would be
routinely gathered in real time on an ongoing basis. The availability of such data would
allow periodic evaluations documenting impacts thus facilitating NIST’s ability to make
possible adjustments that would better serve industry’s needs and also allowing NIST to
provide quality information about performance to support the mandate of the
Government Performance and Results Act (GPRA).
• When NIST is considering a new program, its managers should work with industry
contacts to develop understanding of the nature of the market failure to which the public
provision of infratechnology investment is responding. Developing that understanding
will inform the direction of the infratechnology investment in a way that increases its
beneficial economic impact.
• When NIST initiates a new program, the program directors and project managers
should be trained to gather in real time impact information useful for evaluating their
projects. A project manager’s key contacts in industry throughout the relevant supply
chain can also provide access to greater numbers of industrial respondents to surveys
about the economic impact of the project. With larger numbers of respondents to provide
v
estimates of benefits of particular types when surveys of industry are administered, it will
be possible to produce formal statistical confidence intervals for the estimated benefits.
• Other techniques that are relevant for an economic impact analysis can be used to
complement the approach used in the 17 NIST economic impact analyses reviewed in
this Planning Report.
At a general level, this Planning Report’s review in the context of the theory of economic
impact analyses suggests several questions for discussion when planning for future analyses
of economic impact. The questions are discussed within this Planning Report, and they
include the following issues:
• Should NIST standardize the supply chain used in the economic analyses? This
Planning Report suggests no; instead, the place to begin is with the abstract, general
understanding of how the economic impact of NIST’s infrastructure technologies occurs
throughout the supply chain. Then, with that model in mind, the project leaders deciding
on infratechnology investments or the study team planning an economic impact analysis
can focus on the actual supply chain where benefits are realized.
• Should NIST replace the current approach that is often driven by the availability of
data for assessment of benefits with a more standardized application of the cost/benefit
methodology? As a practical matter, this Planning Report concludes no; but future
economic impact analyses should continue to identify, as the past analyses have done,
qualitatively all of the benefits and costs, ensuring that the metrics presented are
conservative and explaining why that is so. The current approach can only be
characterized as data driven in the sense that all data that can be reliably collected and
reasonably quantified are included in the calculations of metrics, but the analyses are not
data driven in that they try to identify qualitatively all of the benefits and costs. Thus, the
quantitative metrics are data driven (as of course must be the case), but the overall
evaluation is not. The result is that estimated cost-benefit ratios can differ for reasons
other than differential impacts between research programs, and for that reason it is crucial
that each analysis continue to identify all effects qualitatively and state clearly what is
missing from the estimated evaluation metrics and emphasize that readers should not
simply compare benefit-to-cost ratios or other metrics across the analyses. Instead, the
conservative metrics along with a good understanding of what is missing from the
metrics must be kept in mind when comparing the economic impacts reported in the
analyses. While some analyses are able to quantify impact for a single tier of the supply
chain, others quantify benefits for three tiers. Some analyses are able to extrapolate

vi
benefits to draw conclusions regarding impacts at the industry level while others are able
only to characterize the direct impacts on survey respondents. Some analyses are able to
quantify future benefits while others must restrict the analysis to quantification of past
benefits even if the NIST technical outputs remain state-of-the-art. The end point for
benefits to be realized in the future must of course be determined by a conservative
estimate of the future impact horizon, and the likely proportion of future benefits that is
conservative may be very different across analyses given the information available.
To summarize, by following the recommendations about gathering benefit and cost data
to assess the net economic impact of an infratechnology project on all affected parts of the
supply chain, NIST will have, to the extent practicable, identified the type of data that it
needs to evaluate the project. As review of the previous economic impact analyses shows,
the type of data will often differ by project and by the tier of the supply chain affected.
Benefits extending into the future are even more difficult for industry’s beneficiaries to
estimate, but if the recommendation for ongoing, real-time gathering of benefit and cost data
are followed, a better understanding of the benefits and costs and the expected commercial
lifetime will be possible than for the extant analyses. The expected commercial lifetimes
vary across the different infrastructure technologies because the pace of technological change
varies widely across different industries and even within industries across different types of
infratechnology applications. Real-time and ongoing data collection will also make possible
more accurate extrapolations of benefits from the respondents to the industry-wide level.
The previous economic impact analyses have differed in the extent to which they extrapolate
simply because it is not always possible to develop a good understanding of how
representative an individual respondent is of the entire industry. The real-time and ongoing
maintenance of industry contacts and data collection will, because such benefits are often
more difficult to quantify, also enable more analyses that measure the economic impact of
basic measurement research (as contrasted with the evaluation of the calibration services that
take such science as given).

The Theory and Practice of Public-Sector R&D
Economic Impact Analysis
I. Introduction
This Planning Report summarizes NIST’s previous economic impact analyses and
provides, through insight gleaned from these previous efforts, guidelines for NIST’s
management for planning, conducting, and interpreting future analyses. Motivating this
Planning Report is the general expectation and challenge for public institutions to be
accountable for their use of public resources.1 Economic impact analysis is one way that
public institutions can quantify the social contribution of their activity. Impact analysis can
also provide important lessons to management about the effectiveness of previous resource
allocation decisions, and it can provide guidelines for future strategic planning.
To place R&D impact analysis in a broader perspective, we begin with a brief discussion
of R&D evaluations. An evaluation of public-sector R&D programs is based on the criterion
of efficiency.2 The central question asked in an R&D evaluation is: How efficient are all
1 The concept of fiscal accountability in the United States is rooted in the fundamental principles of representation of the people, by the people. Following Link and Scott (1998, 2011), issues of fiscal accountability can be traced at least to as far back as President Woodrow Wilson’s reforms, and in particular to the Budget and Accounting Act of 1921. This Act of June 10, 1921 not only required the President to transmit to Congress a detailed budget on the first day of each regular session, but also it established the General Accounting Office (GAO) to settle and adjust all accounts of the government. More recently, the Government Performance and Results Act (GPRA) of 1993 stated that: “Congressional policymaking, spending decisions and program oversight are seriously handicapped by insufficient attention to program performance and results.” GPRA mandated that the head of each government agency submit to the Director of the Office of Management and Budget (OMB): “… a strategic plan for program activities. … [The plan] shall contain … a description of the program evaluations used in establishing or revising general goals and objectives, with a schedule for future program evaluations.” GPRA was at the time of its passage: “… the most significant advance in bringing accountability to government programs. … Unfortunately, the implementation of this law has fallen short of its authors’ hopes. Agency plans are plagued by performance measures that are meaningless, vague, too numerous, and often compiled by people who have no direct connection with budget decisions” (President’s 2004 Budget, pp. 48-49). In response, President George W. Bush’s 2004 budget presented a new assessment, not evaluation, tool: the Program Assessment Rating Tool (PART). There have also been policy discussions to replace PART with a new performance improvement and analysis framework called Putting Performance First (Orszag 2009a). 2 Many point in the United States to President George H. W. Bush’s 1990 U.S. Technology Policy as our nation’s first formal domestic technology policy statement, although, as Kahin and Hill (2010) point out, U.S. innovation policies trace as far back as President George Washington’s 1790 address to Congress. However, U.S. Technology Policy, like its predecessors, has failed to articulate a foundation for government’s role in supporting innovation and technology. Rather, it has implicitly assumed that government has a role, and then sets forth the general statement (Executive Office of the President 1990, p. 2): “The goal of U.S. technology policy is to make the best use of technology in achieving the national goals of improved quality of life for all Americans, continued economic growth, and national security.” President William Clinton took a major step

2
attributes of a public-sector R&D program including the program’s management, its
strategic planning, and its investment strategy.3
One part of an R&D program evaluation is an economic impact analysis. The central
question asked in an economic impact analysis is: How do the social benefits associated with
the publicly supported R&D program compare to society’s costs to undertake the program?4
Public interest in program evaluation is visible to the policy community as well as to the
general public. For example, on October 7, 2009, Peter Orszag, then Director of OMB, sent
a memorandum to the heads of executive departments and agencies related to increased
emphasis on program evaluations. Therein he wrote:
Rigorous, independent program evaluations can be a key resource in
determining whether government programs are achieving their intended
outcomes … . Evaluations can help policymakers and agency managers
strengthen the design and operation of programs. Ultimately, evaluations can
help the [Obama] Administration determine how to spend taxpayer dollars
effectively and efficiently… (Orszag 2009b).
Following this memorandum, on June 1, 2010 the Science and Technology for America’s
Reinvestment: Measuring the Effect of Research on Innovation, Competitiveness and
Science (STAR METRICS) initiative was announced. It is a multi-agency effort led by the
National Institutes of Health (NIH), the National Science Foundation (NSF), and the White
forward from this 1990 policy statement in his 1994 Economic Report of the President by articulating first principles about why government should be involved in the technological process (Council of Economic Advisers 1994, p. 191): “The goal of technology policy is not to substitute the government’s judgment for that of private industry in deciding which potential ‘winners’ to back. Rather, the point is to correct market failure… .” Relatedly, Martin and Scott (2000, p. 438) observed: “Limited appropriability, financial market failure, external benefits to the production of knowledge, and other factors suggest that strict reliance on a market system will result in underinvestment in innovation, relative to the socially desirable level. This creates a prima facie case in favor of public intervention to promote innovative activity.” For a detailed discussion about the economic justification for government’s role in the innovation process see Link and Scott (2005, 2011). 3 NIST defines an evaluation in this broad manner. What NIST refers to as an economic impact analysis is to many, including Link and Scott (1998, 2011) and the references therein, an economic impact evaluation. However, the NIST terminology is maintained throughout this Planning Report. 4 It is important to distinguish between assessment and impact analysis, although the terms are frequently used interchangeably. A distinction is offered herein, as discussed below, to define the boundaries of this Planning Report, although (for example in the titles of the economic impact analyses reviewed in Table 1) the distinction is not made uniformly throughout this report. Policy assessment is based primarily on the criterion of effectiveness, not efficiency, and the question asked is: Has the R&D program met its stated goals and objectives, and have its designated outputs been achieved? Also, regarding effectiveness versus efficiency, some areas of government, notably regulation, have the explicit requirement to demonstrate efficiency.

3
House Office of Science and Technology Policy (OSTP) to help the federal government
document the value of its investments in R&D.
Our focus in this Planning Report is on impact analyses of NIST activities, retrospective
analyses in particular. Although some of the NIST impact analyses reviewed below are
partially prospective in nature (i.e., meaning that the time series of estimated expected
benefits and costs extends into the future because the useful commercial lifetime of the
technology studied extends beyond the date of the analysis), the analyses are still
retrospective in the sense that they examine NIST programs from an historical investment
perspective. However, we do discuss briefly prospective analyses in the concluding section
of this report.
The remainder of this Planning Report is outlined as follows. We motivate the scope of
this report in Section II with an overview of the theoretical and conceptual foundations for an
economic impact analysis. Although academic in nature, there is both a management and
strategic planning value to understanding the economic foundations upon which program
evaluations and economic impact analyses are based. We stress these economic foundations
for at least two reasons. First, individuals from a number of different disciplines are involved
in the conduct of program evaluations and economic impact assessments. As such,
discipline-specific terminologies for similar concepts are pervasive. And second, even
within a given discipline terminologies are misused because the evaluation questions are
frequently misstated.
In Section III, we discuss 17 laboratory-based economic impact analyses, 17 of which
were sponsored by the Program Office, and 1 that was sponsored by the Advanced
Technology Program (ATP) at NIST. A detailed summary of each analysis is in the
Appendix to this report.
In Section IV, other widely used approaches for conducting an economic impact analysis
are presented and illustrated with examples. The purpose of this discussion is to provide a
general overview of other complementary approaches that NIST management might consider
during the strategic planning phase that precedes the formulation and implementation of an
economic impact analysis methodology.
Finally, in Section V, we offer guidelines about the conduct of future NIST economic
impact analyses, especially guidelines related to real-time data collection by the laboratories
to support any upcoming analysis.

4
II. Economics Foundation for an Impact Analysis5
In spite of efforts in the United States over the past decade to implement
standardized methodologies for assessing the economic impact of government
research programs, no generally accepted approach yet exists.
—Tassey (2003, p. 1)
Often overlooked, as agencies attempt to meet Government Performance and Results Act
(GPRA) reporting requirements in a cost efficient manner, is that there is an analytical and
theoretical foundation or established methodology for conducting an impact analysis. This
foundation, which has long been germane to the economics literature, is gaining prominence
in the policy evaluation arena.6
Griliches (1958) pioneered the application of fundamental economic insight to the
development of estimates of private and social rates of return to public investments in R&D.7
Streams of investment outlays through time—the costs—generate streams of economic
surplus through time—the benefits. Once identified and measured, these streams of costs
and benefits are used to calculate rates of return, benefit-to-cost ratios, and other related
metrics.8
In the simplest Griliches model, public-sector innovations are conceptualized as reducing
the cost of producing a good sold in a competitive market at constant long-run unit cost, as
shown in Figure 1. For any period, there is a demand curve for the good and, in the simplest
model, a horizontal supply curve. Innovation lowers the unit cost of production (hence
lowering the horizontal supply curve, increasing supply, and thereby, at the new lower
equilibrium price, resulting in greater consumer surplus (the difference between the price
consumers would have been willing to pay and the actual price they paid, summed over all
purchases).9
5 This section draws directly from Link and Scott (2011), which is based in part on Link and Scott (1998). Both sources refer to the following discussion under the rubric of an economic evaluation as noted in footnote 3 above. 6 It is important to emphasize the difference between the terms methodology and method. The terms are often used interchangeably, although it is incorrect to do so. A methodology is the theoretical foundation or practices within a discipline that determines or guides how to engage in an inquiry; a method is a tool or technique used to implement the inquiry. 7 The Mansfield et al. (1977) seminal article applied the Griliches’ methodology to private sector innovations, and it expanded the methodology to accommodate imperfect competition in certain circumstances. 8 These metrics are discussed in Section III. 9 Additionally, for market settings more complicated than the simplest model, the Griliches model accounts for producer surplus, measured as the difference between the price the producers receive per unit and the actual marginal cost, summed over the output sold, minus any fixed costs. Social benefits are then the streams of new

5
The Griliches model for characterizing the benefits from a public-sector innovation has
long been the traditional economics methodology for analyzing public-sector R&D
programs. The Griliches model for calculating economic social rates of return adds the
public and the private investments through time to determine social investment costs, and
then the stream of new economic surplus generated from those investments is the benefit.
Thus, the evaluation question that can be answered from such an analysis is: What is the
social rate of return to the innovation, and how does it compare to the private rate of return?
Figure 1
Gain in Economic Surplus from Process Innovation in a Competitive Market
in the Case of Long-Run Constant Unit Costs
Source, Link and Scott (2011).
This might not be the most appropriate question to ask from a public accountability
perspective. Tassey (1997) developed the concept of using private and social hurdle rates to
identify appropriate targets for government intervention. The fact that the social rate of
return is greater than the private rate of return could validate the role of government in
innovation if the private sector would not have undertaken the research; but the question
consumer and producer surpluses—economic value above and beyond the opportunity costs of the resources used to create value, while private benefits for a firm that invests in innovation are the portions of the streams of producer surplus appropriated by the investor. Not all of the appropriated producer surplus is necessarily newbecause the surplus gained by one producer might be cannibalized from the pre-innovation surplus of another producer or from pre-innovation consumer surplus. Social and private costs will, in general, also be divergent.

6
above ignores, for example, consideration of the cost effectiveness of the public sector
undertaking the research as opposed to the private sector, and thus an alternative
methodology might be more appropriate. Two alternative methodologies are discussed
below, the counterfactual methodology and the spillover methodology, although the
counterfactual methodology is the focus of the remainder of this Planning Report.
Counterfactual Methodology
The Griliches methodology assumes as the counterfactual situation the status-quo
technology (and hence the status-quo demands and costs) that existed without the public
R&D investments and the new technology (and hence new demands and costs) that resulted.
However, with reference to what Link and Scott (1998, 2011), building on Tassey (1997),
term a “counterfactual analysis,” under a counterfactual economic impact analysis
methodology, a different counterfactual scenario should be considered when publicly funded,
publicly performed investments are evaluated because typically the private sector would in
some way have tried to replace the public investments and the technologies they produced.
Link and Scott (1998) set out for the first time the distinctions between such a
“counterfactual analysis” and the traditional analysis of economic surplus in the economics
literature.10 As explained there, in the extreme case that the public R&D output could be
replaced with private R&D output of equal quality, holding constant the very stream of
economic surplus that the Griliches model seeks to measure, and making no attempt to
measure that stream, one should ask the counterfactual question: What would the private
sector have had to invest to achieve those benefits in the absence of the public sector’s
investments?
In the less extreme case, where barriers to technology and market failures (discussed
below) prevent the private sector from replacing the public R&D output with private R&D
output of equal quality, the counterfactual question is: What would the private sector have
invested in the attempt to replace the output of the public sector’s investments and what
would be the value lost because of the shortfall in the quality of the private sector’s
replacement R&D output?
The answer to the counterfactual question gives the benefits of the public’s
investments—namely, the costs avoided by the private sector.11 With those benefits—
10 See specifically pages 12-16 in Link and Scott (1998). 11 Observe that this does not assume that the private sector would make the same level of investment, and it does not assume that the resulting R&D output would be of equal quality. The costs avoided are the costs that the private sector would have spent on developing replacement technology and the loss in value because the replacement technology was not of equal quality to the technology developed with the public R&D. Observe that if the barriers to technology and market failure are sufficiently severe that the private sector would not have

7
obtained in practice through extensive interviews with administrators, federal research
scientists, and those in the private sector who would have to duplicate the research in the
absence of public performance—counterfactual rates of return and benefit-to-cost ratios can
be calculated to answer the fundamental evaluation question: Are the public investments a
more efficient way of generating the technology than private sector investments would have
been?
The answer to this question is more in line with the public accountability issues implicit
in GPRA, and certainly is more in line with the thinking of public sector stakeholders—or so
we believe—who may doubt the appropriateness of government’s having a role in the
innovation process in the first place.
Spillover Methodology
There are important projects where economic performance can be improved with public
funding of privately performed research. Another useful methodology that has been used to
evaluate such privately performed R&D that is subsidized by public funds is what Tassey
(1997), and later Link and Scott (2011), termed the “spillover analysis.” It is not the
approach used in the impact analyses discussed in Section III because they are all evaluating
publicly performed R&D rather than R&D that is privately performed but publicly financed.
The idea that public subsidy of privately performed R&D is justified by the positive
externality associated with the spillover of knowledge generated by R&D investment is an
old one, but the development of an implementable, interview-based, multiple-equation
method for identifying social and private rates of return for publicly-subsidized and privately
performed R&D—with an application to projects subsidized with ATP awards—is the
unique contribution of Link and Scott (2001).
Under what Link and Scott (2011), building on Tassey (1997), refer to as the “spillover
economic impact analysis methodology,” the question asked is one that facilitates an
economic understanding of whether the public sector should be underwriting the private-
sector firms’ research, namely: What is the social rate of return from the program (including
spillovers) compared to the private rate of return? Or: What proportion of the total profit
stream generated by the private firm’s R&D and innovation does the private firm expect to
capture; and hence, what proportion is not appropriated but is instead captured by other
firms that imitate the innovation or use knowledge generated by the R&D to produce
competing products for the social good?
attempted to replace the public R&D investment at all, then the counterfactual is the status-quo-ante technology and there are no private sector replacement costs and only the lost value from the shortfall in quality of the technology used with the public investment—exactly the counterfactual of the traditional analysis.

8
The part of the stream of expected profits captured by the innovative firm along with its
costs determine its private return, while the entire stream is the lower bound on the social rate
of return (that would be compared to the social hurdle rate—the opportunity costs of the
public’s investment funds). In essence, this methodology weighs the private return,
estimated through extensive interviews with firms receiving public support regarding their
expectations of future patterns of events and future abilities to appropriate the value of R&D-
based knowledge, against private investments. The social rate of return weighs the social
returns against the social investments. The application of the spillover methodology to the
evaluation of publicly funded, privately performed research is appropriate because the output
of the research is only partially appropriable by the private firm with the rest spilling over to
society. The extent of the spillover of such knowledge with public good characteristics and
its effect on private-sector rate-of-return estimates relative to a “hurdle rate” determines
whether or not the public sector should fund the research.
Impact Analysis in Practice
While there is a rich economics-based theoretical foundation for impact analyses, there
are pragmatic issues at play when applying the appropriate methodology. As the review of
NIST impact analyses in Section III demonstrates, and as Tassey (2003, p. 15) perceptively
noted, in practice the benefits estimated in an economic impact analysis of a specific R&D
program or project is “frequently determined by data availability… .” Because of data
limitations, the economic impact analyses for NIST’s laboratories, and also for the Advanced
Technology Program (ATP) at NIST, have often been able to estimate only a very small
subset of the benefits identified when applying the counterfactual methodology appropriate
for analyzing publicly financed and publicly performed R&D and collecting data relevant to
quantifying the economic impacts of its investments in infrastructure technology (i.e.,
infratechnology) research.
In Section III, we discuss 17 NIST retrospective economic impact analyses, making the
point about data limitations in the context of discussing the proper scope of economic impact
analyses and the actual examples of the subsets of estimated benefits from NIST’s R&D to
generate infrastructure technology.

9
III. NIST R&D Economic Impact Analyses
Overview of NIST Economic Impact Analyses
Much of NIST’s research focuses on infrastructure technology, or infratechnology.
According to Tassey (2007, p. 112): “Infratechnologies leverage the development and
efficient use of technology at all three major stages of economic activity: R&D,
manufacturing, and commercialization.” Measurement and test methods are examples of
infratechnologies. They are required for the efficient conduct of R&D, control of production,
and many market transactions. Infratechnologies also are the basis for technical and
functional interfaces among the products that constitute a system or tiers in a supply chain.
Finally, product acceptance testing protocols and standards assure consumers that
technology-based products perform as specified.12
This focus of NIST’s research has both an institutional basis as well as an economics
basis. The concept of government’s involvement in standards traces to the Articles of
Confederation signed on July 9, 1778—“Congress assembled, shall also have the sole and
exclusive right and power of … fixing the standard of weights and measures throughout the
United States”—and this responsibility was reiterated in Article 1 of the Constitution of the
United States. More to the point, the Omnibus Trade and Competitiveness Act of 1988
stated:
The National Institute of Standards and Technology [shall] enhance the
competitiveness of American industry while maintaining its traditional
function as lead national laboratory for providing the measurement,
calibrations, and quality assurance techniques which underpin United States
commerce, technological progress, improved product reliability and
manufacturing processes, and public safety … .
From an economic perspective, infratechnologies have both public- and private-good
characteristics; thus, they are often referred to as quasi-public goods and are jointly supplied
by the public and private sectors. Infratechnologies have economic value only if they are
uniformly and widely used. As such, the private sector will underinvest in infratechnologies
because of its inability to appropriate fully the benefits from such investments. Thus, a
12 This description of infratechnologies draws on Tassey (2007). He notes (pp. 112-113): “… if you cannot measure, you cannot do R&D; if you cannot test, you cannot control the production process for yield and quality; if you cannot pass a variety of complex data from machine to machine and from company to company, you cannot control cost or schedule; and if you cannot provide a customer with standardized test data for a product, you cannot assure that buyer that performance specifications have been met.”

10
theoretical basis for NIST’s role in the provision of infratechnologies is based on the
economic concept of market failure.
Market failure refers to the fact that the market—including both R&D-investing
producers of a technology and the users of the technology—underinvests, from society’s
perspective, in a particular technology or technology application. Such underinvestment
occurs because conditions or barriers exist that prevent organizations from undertaking or
fully appropriating the benefits created by their investments.13
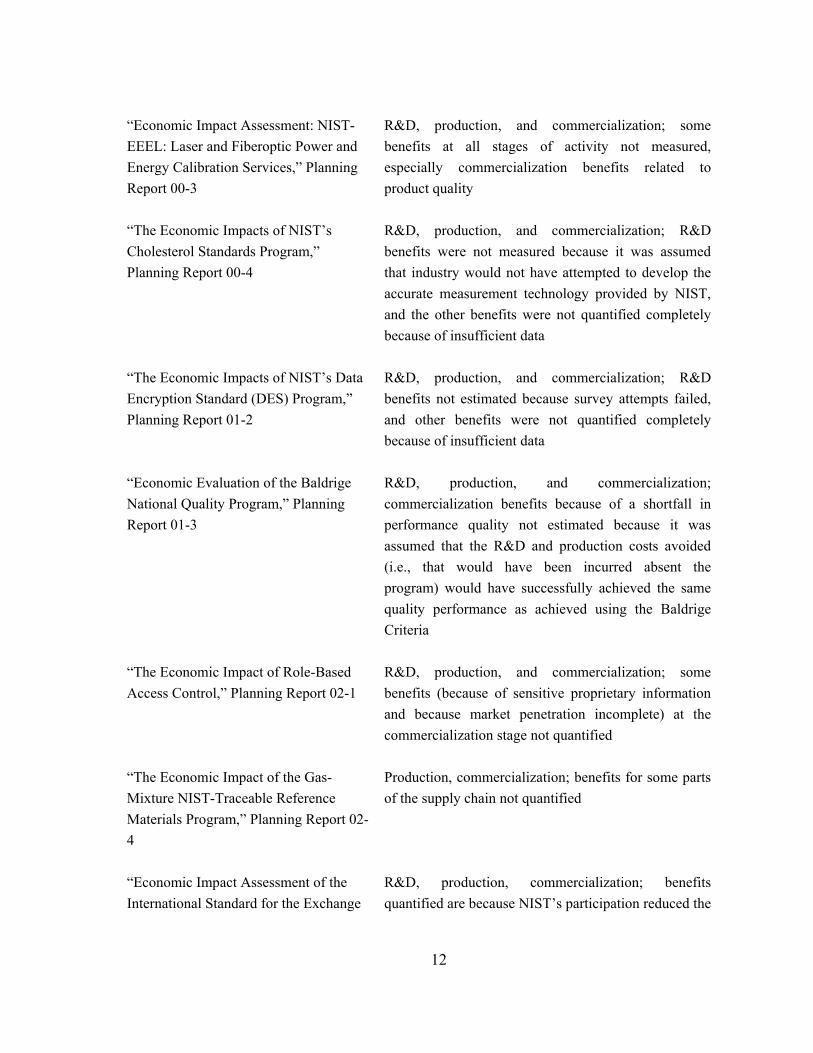
Table 1 lists 17 NIST-sponsored R&D laboratory and program impact analyses that are
based on a counterfactual methodology, described in Section II, for quantifying benefit
information.14 Also listed in the table is the stage or stages of economic activity benefiting
from the infrastructure technology research studied in each analysis: R&D, production, and
commercialization.
There are typically benefits for R&D because NIST is doing the infrastructure technology
R&D and because R&D is more difficult without good measurement. There are benefits for
production because there is better process control. Also, there are benefits for
commercialization because products are of higher quality (yielding more value to consumers
or more efficient operation for producers using intermediate goods benefiting from the
infratechnologies) and of known, consistent quality (reducing the transactions costs
13 The causes for an underinvestment in R&D or in technology are discussed in detail in Tassey (2007) and Link and Scott (2011). Link and Scott (2011) discuss eight factors or barriers to technology that lead to technological market failure. (1) High technical risk means the outcomes of the firm’s R&D might not be technically sufficient to meet its needs. This might cause market failure, given that when the firm is successful, the private returns fall short of the social returns. An underinvestment in R&D will result. (2) High technical risk can be related to high commercial or market risk, when the requisite R&D is highly capital intensive. Such investments could require too much capital for a firm to fund the outlay; thus, the firm will not make the investment, even though it would be better off if it had been able to finance the investment, and so would society. (3) Many R&D projects are characterized by a lengthy time interval until a commercial product reaches the market. The time expected to complete the R&D, and the time until commercialization of the R&D results, are long; thus, the realization of a cash flow is distant and in conjunction with differing private and social discount rates can result in market failure. (4) It is not uncommon for the scope of potential markets to be broader than the scope of the individual firm’s market strategies, so the firm will not perceive economic benefits from all potential market applications of the technology. (5) The evolving nature of markets requires investment in combinations of technologies that, if they existed, would reside in different industries that are not integrated. Because such conditions often transcend the R&D strategy of individual firms, such investments are not likely to be pursued. (6) The nature of the technology may make difficult the assignment of intellectual property rights. (7) Industry structure can raise the cost of market entry for applications of the technology. (8) Situations can exist where the complexity of a technology makes agreement with respect to product performance between buyers and sellers costly. Infrastructure technology investments by NIST can allow many such barriers to be overcome—reducing costs of entry or costs of agreement about performance so that the benefits outweigh NIST’s costs. Stated alternatively in the language of the “counterfactual method” described in Section II, the social cost for the investments in infratechnologies are lower with NIST and industry working together in public-private partnership than with the private sector attempting to accomplish the same ends without NIST. 14 These analyses were sponsored by the Program Office at NIST except for one that was sponsored by ATP. For additional impact assessments sponsored by ATP see, http://www.atp.nist.gov/eao/eao_pubs.htm.

11
associated with commercialization). Table A1 in the Appendix to this Planning Report
provides a detailed summary of each of the 17 R&D laboratory and program impact analyses.
As Table A1 explains, although typically there are benefits at the three stages of economic
activity, the analysess will often evaluate some of those benefits qualitatively only, or at
times not at all. Table 1 provides a summary view of the stages focused on in the analyses,
and distinguishes quantitative evaluations from those that are qualitative only.
Table 1
NIST R&D Program Economic Impact Analyses
Economic Impact Analysis Stage of Economic Activity
“Economic Assessment of the NIST
Thermocouple Calibration Program,”
Planning Report 97-1
R&D, production, and commercialization;
commercialization for users of thermocouples
evaluated qualitatively only
“Economic Evaluation of
Radiopharmaceutical Research at NIST,”
Planning Report 97-2
R&D, production, and commercialization; some
benefits for each stage of activity not quantified or
quantified partially
“Economic Assessment of the NIST
Alternative Refrigerants Research
Program,” Planning Report 98-1
R&D, production, and commercialization;
commercialization benefits, including the value of
better quality products, largely unquantified
“Economic Assessment of the NIST
Ceramic Phase Diagram Program,”
Planning Report 98-3
R&D primarily, but also production (detecting and
diagnosing abnormalities in production), and
commercialization (because delays in the introduction
of new materials were avoided); commercialization
benefits of faster development of new products not
quantified, and benefits for some segments of the
ceramics industry not quantified
“Benefit Analysis of IGBT Power
Device Simulation Modeling,” Planning
Report 99-3
R&D, production, and commercialization; production
benefits for applications manufacturers and
commercialization benefits of product quality for end
users evaluated qualitatively only
“Economic Impact of Standard
Reference Materials for Sulfur in Fossil
Fuels,” Planning Report 00-1
R&D, production, and commercialization; R&D
benefits evaluated qualitatively only
12
“Economic Impact Assessment: NIST-
EEEL: Laser and Fiberoptic Power and
Energy Calibration Services,” Planning
Report 00-3
R&D, production, and commercialization; some
benefits at all stages of activity not measured,
especially commercialization benefits related to
product quality
“The Economic Impacts of NIST’s
Cholesterol Standards Program,”
Planning Report 00-4
R&D, production, and commercialization; R&D
benefits were not measured because it was assumed
that industry would not have attempted to develop the
accurate measurement technology provided by NIST,
and the other benefits were not quantified completely
because of insufficient data
“The Economic Impacts of NIST’s Data
Encryption Standard (DES) Program,”
Planning Report 01-2
R&D, production, and commercialization; R&D
benefits not estimated because survey attempts failed,
and other benefits were not quantified completely
because of insufficient data
“Economic Evaluation of the Baldrige
National Quality Program,” Planning
Report 01-3
R&D, production, and commercialization;
commercialization benefits because of a shortfall in
performance quality not estimated because it was
assumed that the R&D and production costs avoided
(i.e., that would have been incurred absent the
program) would have successfully achieved the same
quality performance as achieved using the Baldrige
Criteria
“The Economic Impact of Role-Based
Access Control,” Planning Report 02-1
R&D, production, and commercialization; some
benefits (because of sensitive proprietary information
and because market penetration incomplete) at the
commercialization stage not quantified
“The Economic Impact of the Gas-
Mixture NIST-Traceable Reference
Materials Program,” Planning Report 02-
4
Production, commercialization; benefits for some parts
of the supply chain not quantified
“Economic Impact Assessment of the
International Standard for the Exchange
R&D, production, commercialization; benefits
quantified are because NIST’s participation reduced the

13
of Project Model Data (STEP) in
Transportation Equipment Industries,”
Planning Report 02-5
development time but not quantified are benefits
because NIST’s participation resulted in higher quality
of the infratechnology
“Evaluation of ATP’s Intramural
Research Awards Program,” NIST GCR
04-866
R&D, production, commercialization; some benefits
from higher quality products not quantified
“Economic Analysis of NIST’s
Investments in Superfilling Research,”
Planning Report 08-1
R&D, production, commercialization; only the benefits
of reduced R&D costs were quantified
“Economic Analysis of NIST’s Low-k
Materials Characterization Research,”
Planning Report 08-2
R&D, production, commercialization; only the R&D
benefits were quantified
“Retrospective Economic Impact
Assessment of the NIST Combinatorial
Methods,” Planning Report 09-1
R&D; commercialization benefits (resulting from the
more efficient product R&D enabled by the
infratechnology) for the users of the higher quality
products not quantified
Note: Planning Reports are available at http://www.nist.gov/director/planning/impact_assessment.cfm. NIST GCR 04-866 is available at the preceding location under “Advanced Technology Program” and at http://www.atp.nist.gov/eao/eao_pubs.htm.
As previously stated, each of the economic impact analyses in Table 1 is grounded in the
counterfactual methodology of what would have happened in the absence of NIST. Then, in
the first instance, the benefits from NIST’s program under consideration are the costs
avoided (i.e., the avoided costs of activities to replace NIST’s program) by industry. The
counterfactual methodology is typically one in which firms incur costs in their attempts to
replace the NIST infrastructure technology that is no longer available in the counterfactual
situation. The benefits from NIST’s infratechnology are the costs avoided by industry—
costs that would be incurred had industry tried to replace NIST’s services in the
counterfactual situation without NIST’s program, provided in cooperative, public-private
partnership between industry and NIST. Those costs would include not only the costs of
activities to replace NIST’s services, but also the lost economic value if the quality of
industry’s counterfactual alternative to the absence of NIST’s services fell short of the
quality of the NIST services being replaced. Such shortfalls in value are expected because
the infratechnologies are quasi-public goods—they are provided through the public-private
partnership of NIST and industry—and the ideal case typically entails a combined investment

14
by NIST and industry. For that reason, the social costs of the NIST programs evaluated with
economic impact analyses include not only NIST’s costs, but the costs incurred by industry
in its support of the NIST infratechnology programs.
It is this mixed case, where the private sector to some extent attempts to replace NIST’s
technology but does so incompletely, that is typically observed in the 17 economic impact
analyses listed in Table 1. However, before reviewing the actual economic impact analyses,
it will be important to set out clearly the two extreme and hypothetical, yet conceptually very
important, special cases—the use of the status-quo technology and the complete replacement
case.
Status-Quo Technology
In those cases where industry, because of severe barriers to technology development,
would not have even attempted to replace NIST’s program but instead simply worked with
the technology available, the analysis is essentially the same as the traditional evaluation of
social rate of return to public R&D investments in Griliches (1958). The counterfactual in
the traditional method is the status quo without the innovation for which social rate of return
is being evaluated. Thus, for Griliches’ classic paper, the counterfactual is the old
technology and associated unit cost of production before the innovation lowered unit cost.
Complete Replacement of Infrastructure Technology
In the case where industry does undertake to replace NIST’s program, incurring the costs
to replace it and doing so completely, the benefits of NIST’s program are simply the costs
avoided because industry did not have to incur the costs of establishing and operating the
program in the private sector; there is no shortfall in the value generated with the
replacement technology. Then, a benefit-to-cost ratio (discussed below) greater than 1.0
implies that the NIST program provided the infrastructure technology more efficiently than
the private sector could have done. The costs to replace NIST’s program are avoided by
industry, and these avoided costs are the benefits from NIST’s program. With a benefit-to-
cost ratio greater than 1.0, those costs and hence the benefits exceed the total of NIST’s and
industry’s costs for the NIST infrastructure technology program. Thus, in the extreme case
of complete replacement of NIST’s program by industry and the achievement of the same
stream of economic surplus therefrom, the evaluation metrics compare the investment costs
industry avoided (the benefits of NIST’s program in the complete replacement scenario) with
society’s (NIST’s and industry’s) actual investment costs.
15
A Summarizing Restatement
At the extreme of the case of zero replacement by industry of NIST’s infratechnology
investments, the shortfall in value in the counterfactual situation absent NIST’s program is
complete, and the evaluation metrics compare the stream of economic surplus—the benefits
from having NIST’s program rather than the status-quo-ante technology—with the
investment costs of NIST’s program. The later case where the shortfall in value is assumed
to be complete may be the appropriate counterfactual scenario when barriers to technology
development and use are especially severe and the discussions with industry support the
belief that market failure would have prevented the private sector from investing in socially
variable infrastructure technology that NIST could provide in cooperation with industry.
However, barriers to technology may not preclude private-sector provision of the
infratechnology, and in that case the counterfactual will have as benefits of NIST’s program
the replacement costs avoided by industry. When those replacement costs exceed the costs
of NIST’s program, then the benefit-to-cost ratio will exceed 1.0, net present value will be
positive, and the social rate of return will exceed the opportunity costs of the public’s funds
(i.e., society’s hurdle rate).15
One could argue that in Griliches’ classic article, the counterfactual used for evaluating
the public’s investment in developing hybrid corn was not the right one for providing an
analysis of economic impact. In particular, if large manufacturers of farm supplies including
seeds would, in the absence of the government R&D program, have undertaken their own
development programs, the relevant counterfactual would not be the technology of the status
quo ante, but instead the situation where the stream of economic surplus generated by hybrid
corn was captured by private investment. Then, for the evaluation of the public R&D, the
benefits to weigh against the government’s investment costs would have been not the stream
of economic surplus from hybrid corn but instead the costs avoided by the private sector
because it did not have to do the investment. The government’s program would be judged a
success if it performed the research at a lower cost than the private sector’s cost in the
counterfactual situation.
Mixed Case Counterfactual Analysis
A review of the analyses in Table 1 (see also Table A1 in the Appendix) shows the
typical case is the mixed case where in the counterfactual situation the private sector to some
extent attempts to replace the technology of NIST’s program but does so incompletely. The
prevalence of the mixed case is not surprising given that the NIST programs are providing
15 This argument is developed in greater detail in Link and Scott (2011).

16
quasi-public goods in the context of public-private partnership to develop and apply
infratechnologies. Although the economic impact analyses in these tables span 22 years, and
although they were conducted by different academics and contractors with varying
backgrounds and skill sets, some generalities about the scope of the economic impact
analyses and the availability of data can be gleaned.
Reviewing the projects in Table 1 suggests a generic set of data and associated evaluation
approaches when NIST is conducting an impact analysis, or when doing economic
evaluations more generally. For those managing NIST laboratory projects, the taxonomies of
data and approaches, revealed by a review of the 17 analyses listed in Table 1, are described
here. From the descriptions here (and in Table A1 in the Appendix), managers can identify
data available for their projects that could be routinely collected on an ongoing basis and then
periodically used for impact analysis.
Data about Economic Impacts
The first observation about data to measure economic impacts is that those impacts will
be observed in the supply chains with benefits attributable to the infratechnologies provided
by NIST. The scope of an impact analysis, in terms of the data about impacts that it should
set out to observe, will depend on the structure of the supply chain. That point can be
explained with two extreme, hypothetical examples.
First, consider a case where the infratechnology is embodied in an upstream
manufacturer’s product and then used in the supply chain’s downstream markets. Suppose
that the upstream firm is a perfectly price-discriminating monopolist (i.e., it can collect all of
the area under its demand curve) selling to a perfectly competitive downstream market that
buys the monopolist’s product and embodies it in the product it produces and then sells to the
next stage of the supply chain. Assume moreover all markets further downstream in the
supply stream are also perfectly competitive. In this special case, collecting data about the
infratechnology’s effect on the first beneficiary in the supply chain will be sufficient to
establish the benefits. In particular, one would gather data related to the outward shift in its
demand curve because of the higher quality, and/or the downward shift in its average costs
allowed by the NIST program’s infratechnology, or about the private sector replacement
costs to replicate NIST’s technology and then if there is a shortfall in quality gathering the
data about the lost outward shift in demand and/or downward shift in costs.
Second, at the other extreme, imagine a case where the NIST program’s developed
infratechnology is used in a supply chain that is perfectly competitive at all stages of the
supply chain. In that case, the social value of NIST’s infratechnology can be captured by
gathering data from the retail market for the product produced in the supply chain. In

17
particular, one would gather data about the outward shift in the retail market’s demand curve
and/or about the downward shift in average costs or about the private sector’s replacement
costs to replicate the NIST program’s infratechnology, and then, if there is a shortfall in
quality, gathering the data about the lost outward shift in demand and/or downward shift in
costs.
Typically, the market structures of the supply chains benefiting from NIST’s programs
will not be either of these extreme cases, and consequently benefits occur and theoretically
must be estimated through data collection and analysis at all levels of the supply chain.
However, the analyses in Table 1 reveal a limited ability of the evaluation teams to
collect data of the theoretically desired scope.16 More often than not, the analyses use only a
small part of the supply chain from which to gather benefit data, even when it is clear that the
scope of the benefits extended throughout many parts of the supply chain. The analyses then
acknowledge this limitation and observe that the evaluation metrics are conservative in the
sense that they will systematically underestimate the true benefits of NIST’s infratechnology
investments.
To improve the ability to document benefits throughout the supply chain, it is
recommended that, to the extent practicable, NIST project managers maintain key contacts
with the users of their projects’ outputs at all stages of the supply chain and let those contacts
know the types of data that will be needed to estimate benefits. However, experience has
shown that tiers in a supply chain beyond those with which NIST has had direct contact (and
therefore where the beneficiaries recognize that NIST has made significant contributions) do
not have an incentive to cooperate and, in fact, do not.17
It is recommended that NIST project managers establish direct contact with those further
down the supply chain who benefit from the NIST infratechnologies, explain those
downstream benefits that are expected, and then request feedback about the extent to which
those benefits are actually realized. In other words, with an educational outreach effort by
NIST to those in tiers of a supply chain where traditionally there have not been direct
contacts with NIST, the incentives to cooperate will be cultivated and NIST programs will be
better attuned to industry’s needs. Ideally, benefit data would be routinely gathered in real
time on an ongoing basis. The availability of such data would allow periodic evaluations
16 This statement is not intended as a criticism of the evaluators’ abilities or due diligence. Rather, it underscores the difficulty in collecting retrospective data subject to resource constraints. 17 Even when it is possible to interview the beneficiaries in a downstream tier of the supply chain, they are often unable to quantify the benefits they receive from NIST’s program. For example, in the analysis (Planning Report 97-1) of NIST’s Thermocouple Calibration Program, benefits for domestic users were not quantified because they are more indirect and difficult to quantify than the benefits for the wire suppliers (providing materials for thermocouple assemblies) and thermocouple suppliers.

18
documenting impacts thus facilitating NIST’s ability to make possible adjustments that
would better serve industry’s needs and also allowing NIST to provide quality information
about performance to support the mandate of the GPRA.
Numbers of Respondents and Statistical Confidence Intervals
Although several of the analyses in Table 1 provide upper and lower bounds for their
estimated benefits, none of the analyses provides formal statistical confidence intervals for
the estimates. In many cases a reason for this is that the numbers of respondents are two few
to develop any formal statistics. For example, Table A1 provides the numbers of respondents
providing information for the NIST economic impact analyses, and those numbers are far
below what would be used in statistical analysis.18 However, if project managers follow the
recommendations for maintaining in real time key contacts throughout the supply chains
benefiting from NIST projects and communicating regularly about the types of data that will
be needed for evaluations, there will be many more respondents and the very real problem of
small numbers of expert opinions about key benefits can, in some cases, be mitigated
dramatically. With larger numbers of respondents providing estimates of benefits of
particular types, it will at times be practical to produce formal statistical confidence intervals
for the estimated benefits.19
Types of Impact Data
The analyses in Table 1 rely on many types of impact data that NIST project managers
could request in real time from the key contacts throughout the supply chains benefitting
from their projects’ outputs. It is useful to discuss these examples in groups for a generic
supply chain benefiting from NIST’s infrastructure technology investments.
The analyses in Table 1 illustrate a range of different supply chains, but for illustrative
purposes the generic supply chain will have the first level of beneficiaries being firms
upstream that manufacture an input used downstream in the supply chain. The input
produced by the first tier of beneficiaries could be an instrument that must be calibrated using
the standards and calibration services developed at NIST, or it could be a reference material
of field quality that is traceable to NIST standards. An example of a first tier of beneficiaries
would be the suppliers of power meters and 249 nm excimer lasers used for photolithography
18 Even when all of the beneficiaries are interviewed, the numbers are often quite small. For example, in the analysis of the radiopharmaceutical research program at NIST (Planning Report 97-2), there are only seven respondents even though those seven respondents were 100 percent of the U.S. manufacturers participating in the program. 19 One detailed example of the use of formal statistical confidence intervals in a journal article based on a NIST-sponsored analysis is Leech and Scott (2008).

19
allowing economic fabrication of miniaturized integrated circuits (see Table A1 and the
discussion of Planning Report 00-3). Another example would be the manufacturers of
cholesterol measurement systems that are calibrated using NIST’s cholesterol SRMs (see
Table A1 and the discussion of Planning Report 00-4).
The second tier of beneficiaries could be downstream manufacturers or service providers
that must use the inputs purchased from the upstream firms to efficiently produce a product
that will be sold to manufacturers or service providers further downstream in the supply
chain. The second tier of firms, for example, might use an instrument that measures the
wavelength of light to manufacture components that will be used in fiber optics
communications systems.
For example, (Table A1 in Planning Report 00-3) NIST standards and calibration
services allow accurate calibration of instruments used in the manufacturing of specialized
optical sources and detectors used in high performance communications systems. The NIST
standards allow the manufacturers to characterize the frequency response of high-speed
detectors that are essential to enabling many downstream areas of the telecommunications
industry, including high-speed internet access. Or, as in Table A-1’s discussion of SRMs for
sulfur in fossil fuels (Planning Report 00-1), the second tier of firms might use a reference
material traceable to NIST standards to measure the sulfur content of a fuel that will be used
in the production of energy. The goods produced by the second tier of firms benefiting from
NIST’s infrastructure technology are then used by firms further downstream; in the
examples, those firms would be the providers of fiber-optic communications systems or the
producers of energy.
Those firms in the third tier of the supply chain benefit from having inputs—the fiber-
optic components or the fuel—with specifications traceable to NIST standards. Then, for the
generic supply chain, the fourth tier will be the end users who also are beneficiaries of
NIST’s infratechnology. In the examples here, the end users would be the customers who
use the services of a fiber optics communication system or those who use the energy
produced with fuel with content meeting specifications traceable to NIST standards.
Table 2 provides examples of the types of data used in the analyses in Table 1 to estimate
benefits of NIST’s infratechnology investments for the various levels of the typical supply
chain described in the preceding paragraph. Excepting the special cases discussed earlier in
the text, benefits occur and are ideally measured at all levels of the supply chain. One should
note that the examples given for each tier in the generic supply chain are all taken from the
actual benefits documented in the analyses summarized in Table 1 (as can be seen by reading
the detailed descriptions of the analyses in Table A1); however, in many cases a particular
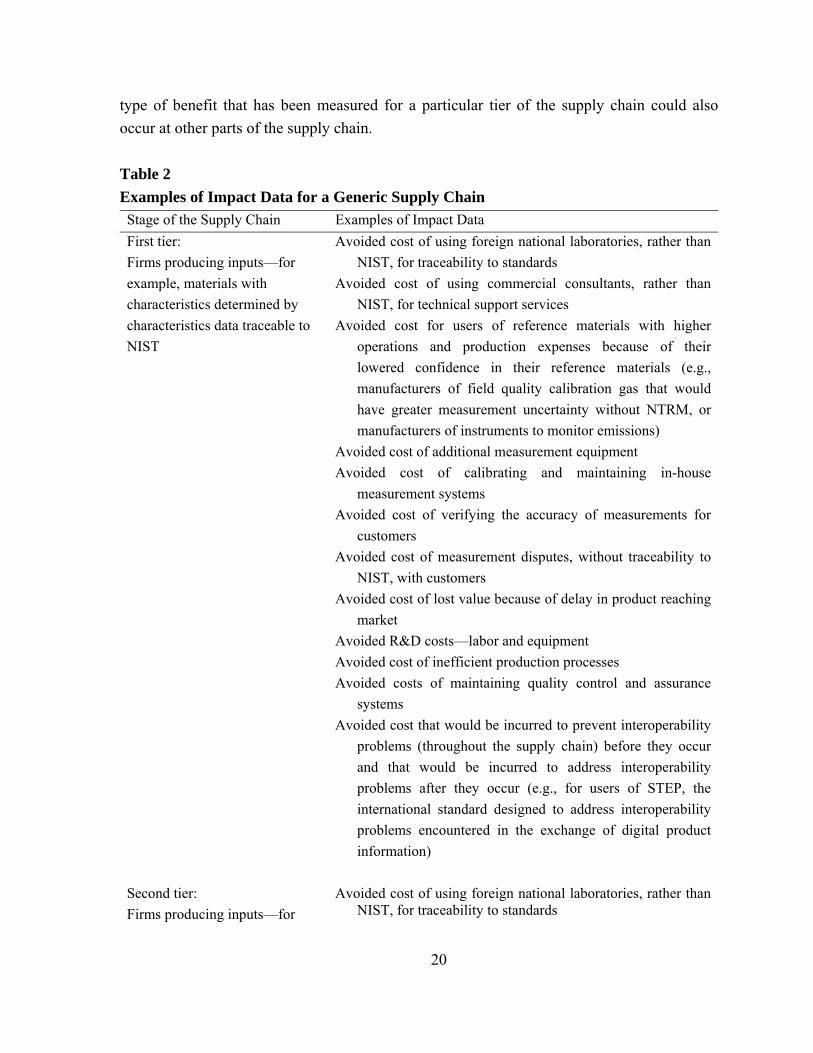
20
type of benefit that has been measured for a particular tier of the supply chain could also
occur at other parts of the supply chain.
Table 2
Examples of Impact Data for a Generic Supply Chain
Stage of the Supply Chain Examples of Impact Data
First tier:
Firms producing inputs—for
example, materials with
characteristics determined by
characteristics data traceable to
NIST
Avoided cost of using foreign national laboratories, rather than
NIST, for traceability to standards
Avoided cost of using commercial consultants, rather than
NIST, for technical support services
Avoided cost for users of reference materials with higher
operations and production expenses because of their
lowered confidence in their reference materials (e.g.,
manufacturers of field quality calibration gas that would
have greater measurement uncertainty without NTRM, or
manufacturers of instruments to monitor emissions)
Avoided cost of additional measurement equipment
Avoided cost of calibrating and maintaining in-house
measurement systems
Avoided cost of verifying the accuracy of measurements for
customers
Avoided cost of measurement disputes, without traceability to
NIST, with customers
Avoided cost of lost value because of delay in product reaching
market
Avoided R&D costs—labor and equipment
Avoided cost of inefficient production processes
Avoided costs of maintaining quality control and assurance
systems
Avoided cost that would be incurred to prevent interoperability
problems (throughout the supply chain) before they occur
and that would be incurred to address interoperability
problems after they occur (e.g., for users of STEP, the
international standard designed to address interoperability
problems encountered in the exchange of digital product
information)
Second tier:
Firms producing inputs—for
Avoided cost of using foreign national laboratories, rather than NIST, for traceability to standards

21
example, components,
production equipment or other
inputs with specifications
traceable to NIST standards
Avoided cost of using commercial consultants, rather than NIST, for technical support services
Avoided cost for users of reference materials with higher operations and production expenses because of their lowered confidence in their reference materials, instruments, and system components (e.g., manufacturers of systems for monitoring and controlling emissions)
Avoided cost of additional measurement equipment Avoided cost of calibrating and maintaining in-house
measurement systems Avoided cost of verifying the accuracy of measurements for
customers Avoided cost of measurement disputes, without traceability to
NIST, with suppliers or customers Avoided costs of implementation (risks and adoption costs) and
interoperability across systems (e.g., software developers using infratechnologies supporting RBAC)
Avoided cost of lost value because of delay in product reaching market
Avoided R&D costs—labor and equipment Avoided cost of inefficient production processes Avoided costs of maintaining quality control and assurance
systems Avoided cost that would be incurred to prevent interoperability
problems (throughout the supply chain) before they occur and that would be incurred to address interoperability problems after they occur (e.g. for users of STEP, the international standard designed to address interoperability problems encountered in the exchange of digital product information)
Third tier:
End User firms—for example,
firms (such as OEMs) producing
systems or outputs (autos, TVs,
computers) with specifications
traceable to NIST standards
Avoided cost of measurement disputes, without traceability to NIST, with suppliers or customers
Avoided cost for end users that would have higher operations, maintenance and production expenses because of their lowered confidence in the accuracy of measurement technology (e.g., manufacturers using systems for monitoring and controlling their emissions)
Avoided cost of additional measurement equipment Avoided cost of calibrating and maintaining in-house
measurement systems Avoided cost of verifying the accuracy of measurements for
customers Avoided cost of lost value because of delay in product reaching
market Avoided R&D costs—labor and equipment Avoided cost of inefficient production processes Avoided cost of regulatory compliance for traceability to
absolute standards (e.g., emissions control)

22
Avoided costs of maintaining quality control and assurance systems (e.g., clinical laboratories performing cholesterol tests)
Avoided costs of implementation (risks and adoption costs) and interoperability across systems (e.g., end users of infratechnologies supporting RBAC)
Avoided cost that would be incurred to prevent interoperability problems (throughout the supply chain) before they occur and that would be incurred to address interoperability problems after they occur (e.g., for users of STEP, the international standard designed to address interoperability problems encountered in the exchange of digital product information)
Avoided loss in quality (product features, performance, reliability) of products as reflected in customers’ decreased willingness to pay for the products [Note that care must be taken to avoid double-counting of this decreased willingness to pay; ideally the deterioration in quality at all levels of the supply chain and associated loss in customers willingness to pay can be captured at the penultimate tier of the supply chain, with the cumulative effects of deterioration in quality throughout the supply chain reflected in the demand curve for the products of the end user firms by the decreased willingness to pay for their final product sold to the final consumers. At times the loss in value from quality deterioration may be captured in the downward shift of the demand curve for an upstream stage of the supply chain, but it must not then be also measured in the downstream markets.]
Fourth tier:
Customers of end user firms—
for example, consumers using
the final goods and services
provided by the third tier firms
Avoided cost of measurement disputes, without traceability to NIST, with suppliers
Avoided costs of maintenance and repair (e.g., the users of refrigeration equipment with improperly functioning alternative refrigerants)
Avoided costs of damage from, or costs of repeating, final consumption that had poor results because of inaccurate measurement (e.g., the patients at the end of the supply chain in the radiopharmaceuticals analysis; or, e.g., regarding costs of damage from poor measurement, the environmental damage without SRMs for the sulfur content of fossil fuels)
One can observe that the examples given in Table 2 include many different types of
benefits from NIST’s programs. These are benefits that could be quantified and collected in
real time and used by NIST for more effective management. The types of benefits include
avoiding costs that would be incurred by the firm in the counterfactual scenario without

23
NIST’s investments: investment, operating, and maintenance costs to develop, use, and
maintain infrastructure technology and provide infratechnology services such as standard
reference materials (SRMs) and calibrations services and traceability to national standards.
Benefits to the firm also include avoiding increased time to market in the absence of NIST’s
programs, avoiding the loss of valuable knowledge that would not have been developed
without NIST’s infratechnologies increasing the performance of R&D investments (such
knowledge is reflected in part in knowledge metrics such as patents and publications).
Benefits include avoiding a loss in quality of products and services—avoiding a loss in the
firm’s performance in the absence of NIST’s investments. Benefits include avoiding costly
increases in time to meeting third party regulations or simply more difficulty in detecting
whether or not the regulations are being met and that difficulty requires costly
countermeasures to ensure that in fact the regulations are met.
Outcome Metrics
The outcome metrics traditionally used in the NIST retrospective economic impact
analyses in Table 1 are the internal rate of return (IRR), the benefit-to-cost ratio (B/C), and
net present value (NPV).20
Internal Rate of Return
The internal rate of return (IRR)—a real rate of return in the context of constant-dollar
cash flows—is the value of the discount rate, i, that equates the net present value (NPV) of
the stream of net benefits associated with a research project to zero. The time series runs
from the beginning of the research project, t = 0, through a terminal point, t = n.
Mathematically:
(1) NPV = [(B0 – C0) / (1 + i)0] + … + [(Bn – Cn) / (1 + i)n] = 0
where, (Bt – Ct) represents the net benefits associated with the project in year t, and n
represents the number of time periods—years in the case studies below—being considered in
the evaluation.
For unique solutions for i, from equation (1), the IRR can be compared to a value, r, that
represents the opportunity cost of funds invested by the technology-based public institution.
20 Tassey (2003) refers to these metrics as corporate finance measures; they have traditionally been discussed in corporate finance textbooks’ development of a firm’s capital budgeting decision.

24
Thus, if the opportunity cost of funds is less than the internal rate of return, the project was
worthwhile from an ex post social perspective.21
Benefit-to-Cost Ratio
The ratio B/C is the ratio of the present value of all measured benefits to the present value
of all measured costs. Both benefits and costs are referenced to the initial time period, t = 0,
when the project began as:
(2) B/C = [∑t=0 to t=n Bt / (1 + r)t] / [∑t=0 to t=n Ct / (1 + r)t]
A benefit-to-cost ratio of 1 is said to indicate a project that breaks-even. Any project with
B/C > 1 is a relatively successful project as defined in terms of benefits exceeding costs.
Fundamental to implementing the ratio of benefits-to-costs is a value for the discount
rate, r. While the discount rate representing the opportunity cost for public funds could differ
across a portfolio of public investments, the calculated metrics in the analyses in Table 1
follow the guidelines set forth by the OMB (1992) in Circular A-94: “Constant-dollar
benefit-cost analyses of proposed investments and regulations should report net present value
and other outcomes determined using the Office of Management and Budget (OMB)
recommended real discount rate of 7 percent.” The analyses summarized in Table A1 are
evaluating investment decisions—the allocation of capital across alternative investment
options, and so the OMB-mandated 7 percent real discount rate has been used.22
21 For the archetypal illustrative case to explain the concept of internal rate of return, the net cash flows of benefits minus the costs begin as negative and then become positive, with just a single reversal in the sign for the series of flows. There is then at most a single real solution for the internal rate of return. Of course, for actual investment projects there can be multiple reversals in the signs for the net cash flows, and then using the internal rate of return concept for a cost-benefit analysis requires some additional work with the time series of benefits and costs. For an actual example with an explanation of how to treat the issue, see Link and Scott (1998, p. 46). 22 Commenting on the 7 percent real discount rate, OMB (2003, p. 33) observed: “The 7 percent [real] rate is an estimate of the average before-tax rate of return to private capital in the U.S. economy. It is a broad measure that reflects the returns to real estate and small business capital as well as corporate capital. It approximates the opportunity cost of capital, and it is the appropriate discount rate whenever the main effect of a regulation is to displace or alter the use of capital in the private sector. OMB revised Circular A-94 in 1992 after extensive internal review and public comment.” Further, OMB (2003, p. 33) observed: “The pre-tax rates of return better measure society’s gains from investment. Since the rates of return on capital are higher in some sectors of the economy than others, the government needs to be sensitive to possible impacts of regulatory policy on capital allocation.” However, OMB (2003, p. 33) observed: “The effects of regulation do not always fall exclusively or primarily on the allocation of capital. When regulation primarily and directly affects private consumption (e.g., through higher consumer prices for goods and services), a lower discount rate is appropriate.” Hence, if one were evaluating a policy where, instead of alternative uses of investment capital in

25
Net Present Value
OMB circular A-94 states (OMB 1992, p. 3):
The standard criterion for deciding whether a government program can be
justified on economic principles is net present value—the discounted
monetized value of expected net benefits (i.e., benefits minus costs). Net
present value is computed by assigning monetary values to benefits and costs,
discounting future benefits and costs using an appropriate discount rate, and
subtracting the sum total of discounted costs from the sum total of discounted
benefits.
The information developed to determine the benefit-to-cost ratio can be used to determine
NPV as:
(3) NPVinitial year = B ‒ C
public R&D investment decisions, the issue evaluated were a regulatory policy (e.g., for health care) that would directly and primarily affect the stream of real income to consumers (e.g., alternative health plans with streams of different magnitudes and different timings), then the OMB has directed (OMB, 2003, pp. 33-34) that “for regulatory analysis” (p. 34), rather than an evaluation of an investment, the real discount rate of 3 percent should be used and then compared to the results using the 7 percent real discount rate. OMB explains that for consumers’ decisions, 3 percent better approximates their real rate of time preference. OMB (2003, p. 33) explicitly stated that the 7 percent real required rate of return that is based on the average rate of return to private capital investment is “a default position;” yet, the market failure story recognizes that for investments (not just “regulatory policy”) the social rate of return and the private rate of return can (and are expected to) diverge, with the social required rate of return being less than the private hurdle rate. As it turns out, in practice, a 7 percent social hurdle rate for public investments is not inconsistent with that logic because the 7 percent is based on the average. However, for the R&D investment projects we have evaluated in case studies, the firms report higher private hurdle rates. OMB appears to be taking the least controversial approach by using for the social hurdle rate for investments an average return for private capital investments and by advising consideration of the variance in private returns in different activities. Clearly, as we have noted, there is no reason society should be constrained in its assessments of value by prices determined in markets where there are market failures and the prices give the wrong signals. Hence, the private rate of return on investment should not be expected to equal the social opportunity cost of investment funds; the private rates of return may be based on prices that do not reflect social value. We know that with positive externalities such as non-appropriated spillovers that benefit those who did not invest, social rates of return can be high when private rates of return are low. Moreover, the private rate of return can be high even when the social rate of return is low or even negative. For example, in the context of R&D investment, the results of a privately profitable R&D investment may simply cannibalize previously existing economic surplus causing the investment to have a negative social rate of return for a period of time. OMB’s approach is a solution in the absence of a practical way to determine what the theoretical social hurdle rate should be in any given situation.

26
where, as in the calculation of B/C, B refers to the present value of all measured benefits and
C refers to the present value of all measured costs, and where present value refers to the
initial year or time period in which the project began, t = 0 in terms of the B/C formula in
equation (2). Note that NPV allows, in principle, one means of ranking several projects ex
post, providing investment sizes are similar.
It could be argued that for the purpose of public consumption of the finding from an
economic impact analysis, NPV should be calculated as the difference between the present
value of benefits and the present value of costs where both present values are referenced not
to an initial period but rather to the time period that corresponds to when the analysis is
conducted, t = n. The reason for this alternative approach (i.e., alternative point of time
reference to that implied by equation (3)) is that the use of NPV in a retrospective economic
impact analysis is different from its conventional use as described in corporate finance
textbooks. In the latter case, the objective is to compare alternative investments subject to a
budget constraint. All estimates are in current dollars, as the “present” is the time of
decision. In the case of a retrospective analysis, and all of the analyses in Table A1 are
retrospective in scope, the analysis takes place some considerable amount of time after the
project was initiated (the “present” time in the corporate finance use of this metric). Because
the results of retrospective analyses are read by policy makers and other stakeholders some
time—in most cases, many years—after the project was initiated, these stakeholders will
compare results in a “current-dollar” context. Hence, if this metric is to be used, it should be
referenced to the time of the analysis to allow stakeholders to compare the results with
current investment options. In other words, the following formula for NPV should be
considered:
(4) NPVyear of the analysis = [∑t=0 to t=n Bt × (1 + r)n-t] ‒ [∑t=0 to t=n Ct × (1 + r) n-t]
= (NPVinitial year) × (1 + r)n
After the experience with the investment, a positive NPVinitial year shows that at the outset
of the investment, the value of the stream of benefits exceeded the value of the stream of
costs by the amount NPVinitial year. The intuitive story for NPVyear of the analysis is that at the time
the investment is put in place, its stream of benefits could, theoretically, be sold for the
stream’s present value, and then a portion of the proceeds equal to the present value of the
costs could be invested to release the stream of costs needed for the project, leaving the
NPVinitial year as an excess of value above and beyond costs. That value could at that time
have been invested, and then the resulting value from the project by the time of the analysis
would have been NPVyear of the analysis.

27
Table 3
NIST R&D Program Impact Analyses and Measured Economic Impact
Economic Impact Analysis Stage of Economic Activity Benefit-to-
Cost Ratio*
“Economic Assessment of the NIST
Thermocouple Calibration Program,”
Planning Report 97-1
R&D, production, and commercialization;
commercialization for users of
thermocouples evaluated qualitatively
only
3-to-1
“Economic Evaluation of
Radiopharmaceutical Research at
NIST,” Planning Report 97-2
R&D, production, and commercialization;
some benefits for each stage of activity
not quantified or quantified partially
97-to-1
“Economic Assessment of the NIST
Alternative Refrigerants Research
Program,” Planning Report 98-1
R&D, production, and commercialization;
commercialization benefits, including the
value of better quality products, largely
unquantified
4-to-1
“Economic Assessment of the NIST
Ceramic Phase Diagram Program,”
Planning Report 98-3
R&D primarily, but also production
(detecting and diagnosing abnormalities
in production), and commercialization
(because delays in the introduction of new
materials were avoided);
commercialization benefits of faster
development of new products not
quantified, and benefits for some
segments of the ceramics industry not
quantified
10-to-1
“Benefit Analysis of IGBT Power
Device Simulation Modeling,”
Planning Report 99-3
R&D, production, and commercialization;
production benefits for applications
manufacturers and commercialization
benefits of product quality for end users
evaluated qualitatively only
23-to-1
“Economic Impact of Standard
Reference Materials for Sulfur in
Fossil Fuels,” Planning Report 00-1
R&D, production, and commercialization;
R&D benefits evaluated qualitatively only
113-to-1

28
“Economic Impact Assessment:
NIST-EEEL: Laser and Fiberoptic
Power and Energy Calibration
Services,” Planning Report 00-3
R&D, production, and commercialization;
some benefits at all stages of activity not
measured, especially commercialization
benefits related to product quality
11.3-to-1
“The Economic Impacts of NIST’s
Cholesterol Standards Program,”
Planning Report 00-4
R&D, production, and commercialization;
R&D benefits were not measured because
it was assumed that industry would not
have attempted to develop the accurate
measurement technology provided by
NIST, and the other benefits were not
quantified completely because of
insufficient data
4.5-to-1
“The Economic Impacts of NIST’s
Data Encryption Standard (DES)
Program,” Planning Report 01-2
R&D, production, and commercialization;
R&D benefits not estimated because
survey attempts failed, and other benefits
were not quantified completely because of
insufficient data
145-to-1
“Economic Evaluation of the
Baldrige National Quality Program,”
Planning Report 01-3
R&D, production, and commercialization;
commercialization benefits because of a
shortfall in performance quality not
estimated because it was assumed that the
R&D and production costs avoided—i.e.
that would have been incurred absent the
program—would have successfully
achieved the same quality performance as
achieved using the Baldrige Criteria
207-to-1
“The Economic Impact of Role-
Based Access Control,” Planning
Report 02-1
R&D, production, and commercialization;
some benefits (because of sensitive
proprietary information and because
market penetration incomplete) at the
commercialization stage not quantified
109-to-1
“The Economic Impact of the Gas-
Mixture NIST-Traceable Reference
Production, commercialization ; benefits
for some parts of the supply chain not
21-to-1

29
Materials Program,” Planning Report
02-4
quantified
“Economic Impact Assessment of
the International Standard for the
Exchange of Project Model Data
(STEP) in Transportation Equipment
Industries,” Planning Report 02-5
R&D, production, commercialization;
benefits quantified are because NIST’s
participation reduced the development
time but not quantified are benefits
because NIST’s participation resulted in
higher quality of the infratechnology
8-to-1
“Evaluation of ATP’s Intramural
Research Awards Program,” NIST
GCR 04-866
Wavelength References for
Optical Fiber Communications:
SRM 2517a
Injectable Composite Bone
Grafts
Internet Commerce for
Manufacturing
Polymer Composite Dielectrics
for Integrated Thin-Film
Capacitors
R&D, production, commercialization;
some benefits from higher quality
products not quantified
267-to-1
5400-to-1
33-to-1
7-to-1
“Economic Analysis of NIST’s
Investments in Superfilling
Research,” Planning Report 08-1
R&D, production, commercialization;
only the benefits of reduced R&D costs
were quantified
6-to-1
“Economic Analysis of NIST’s Low-
k Materials Characterization
Research,” Planning Report 08-2
R&D, production, commercialization;
only the R&D benefits were quantified
9-to-1
“Retrospective Economic Impact
Assessment of the NIST
R&D; commercialization benefits
(resulting from the more efficient product
9-to-1

30
Combinatorial Methods,” Planning
Report 09-1
R&D enabled by the infratechnology) for
the users of the higher quality products
not quantified
* Several other outcome metrics are in each Planning Report.
IV. Other Techniques Relevant to an Economic Impact Analysis While the economics-based methodologies discussed above provide analyses that are
theoretically sound and more commonly used with reference to R&D- and technology-based
programs, especially for analyses of R&D programs funded by U.S. agencies, other
retrospective techniques, some of which are also economics-based or can be used to evaluate
an economics-based measure of performance, have been used to assess or to support
economic impact analyses of public-sector R&D programs. Following Polt and Rojo (2002),
these other techniques include econometric models, productivity models, benchmarking
analysis, innovation surveys, expert panels and peer review, and network analysis.23 Each of
these other techniques is discussed below. In the concluding section of this Planning Report
we suggest that, when possible, these techniques be considered as tools to complement the
economics-based methodologies discussed in Section II.
Econometric Models
An ideal analytical approach [for a retrospective evaluation] is the
construction of a time series of economic activity of affected industries that
includes a period before government intervention. At some point in the time
series, a government funded project … occurs and the subsequent portion of
the time series reflects the technical and economic impacts of the intervention.
—Tassey (2003, p. 15)
Econometric models (more specifically models that are estimated using econometric
methods) quantify the level of a predefined performance variable before and after the public-
sector R&D program being considered had an effect.24 The time series data that are used in
these models relate to policy-relevant economic units such as a sector, an industry, a firm, an
organization or institution, or an individual. Generally, the data, when available, pertain to
individual firms’ performance before and after the public-sector R&D program.
23 These techniques are widely cited by the European Commission (Polt and Rojo 2002) as methodologies. In our opinion they are a potpourri of methodologies, methods, and data collection tools rather than all being methodologies, and they vary greatly in their relation to the theory of value and opportunity costs that underlies economics-based methodologies. All of these techniques are discussed because of their general visibility. 24 As Jaffe (2002) explains, identifying the effect of the public program is difficult.

31
Define a performance variable for the ith firm as Pi. Consider two series of data. The
first is a time series of data on the observed performance of k firms, i = 1 to i = k, before and
after the effect from the public-sector R&D program. After the public-sector R&D program
is operating, each of the k firms will be affected but not necessarily in the same degree. If
performance data are available from time periods t = 0 to t = n, and if the public-sector R&D
program became effective at time period t = t*, then the relevant comparison is between the
performance of the k firms before the R&D program, Pi, for t = 0 to t = t*‒1, and their performance
after the R&D program, Pi, for t = t* to t = n.
The second series of data could be on the performance of affected and non-affected firms
(i.e., matched pairs of firms) after the public-sector program was initiated at t*. If
performance data are only available from time t = t* to t = n for k affected firms, Pi, i = 1 to i = k;
and for m non-affected firms, Pj, j = 1 to j = m; then, for each matched pair of firms, the relevant
comparison is over time between Pi and its matched Pj.25 The counterfactual situation, that is
the situation without the public-sector R&D program, is the performance of the m non-
affected firms.
In the case of the first series of data that quantifies pre- and post-R&D program
performance, pooled cross-sectional and time series data could be used to estimate a model
that takes the general form:
(5) Pi,t = a0 + a1 RDt* + control variables + ε
where Pi,t represents the relevant performance variable of the ith firm at time t; RD represents
the public-sector R&D program being evaluated that was initiated or became effective at
time t*—RD takes on a value of 0 for the time period before t* and a value of 1 at t* and
afterwards;26 and ε is a normally distributed random error term.
Estimated regression parameters from equation (5) allow one to interpret the economic
impact of the public-sector R&D program. For example, the estimated coefficient on RD in
equation (5) quantifies the impact of the R&D program on the average performance of the
sample of k firms. If the estimated value of a1 is positive and statistically significant, then
the public-sector R&D program had a measurable positive impact on firm performance, all
other factors held constant. If the public program is hypothesized to change the extent to
which various control variables affect performance, then interaction terms would be added to
25 There are many issues related to how one defines a matched firm (e.g., size, level of own R&D, industry, etc.), but that discussion is beyond the scope of this Planning Report. 26 The specification in equation (5) is simplified for purposes of an introductory explanation because it assumes the R&D program’s impact occurred at time t* and that impact remained constant through subsequent time periods. More sophisticated variations of equation (5) are possible.

32
the specification with each interaction multiplying RD with a control variable for which
impact would be affected. For example, the public R&D program might have not only an
“intercept effect” but also have a “slope effect” for a variable such as the firm’s own R&D
investment which could be more effective given the public R&D investments.
In the case of the matched pairs of firms in which the counterfactual situation is
approximated by the performance of firms not affected by the target R&D program, cross-
sectional time series data could be used to estimate a model that takes the general form:
(6) Pt = b0 + b1 E + control variables + ε
The variable E divides the sample of firms into those affected by the R&D program and
those matched pairs that are not affected—E takes on a value of 0 for the m non-affected
matched firms and a value of 1 for the k affected matched firms. If the estimated value of b1
is positive and statistically significant, then the R&D program had a measurable positive
impact on firm performance relative to the performance of “similar” firms not affected by the
program, other things held constant.27
There are a number of important data issues related to the use of the econometric models
discussed above, and one of those issues relates to how the performance variable, P, is
measured. If P is measured in terms of the stated goals of the public-sector R&D program,
then the use of econometric models might be an appropriate tool for an economic assessment.
If, however, there are spillovers and they are the focus of the public R&D program, then
measuring firm performance, P, rather than a broader measure of performance will not work
for an evaluation of the public R&D.
To illustrate, one notable economic assessment analysis by Busom (2000) is based on a
model that is, in concept, equivalent to that in equation (6) above. He examined a sample of
154 Spanish firms that conducted R&D in 1988. About 45 percent of the firms received
public support of their R&D through an agency of the Spanish Ministry, and a stated goal of
this public-support program was to leverage private R&D. Other factors held constant,
Busom found that participation in the public program did increase private R&D effort.28
27 Again, if the program is hypothesized to affect the impacts of control variables (i.e., if it will have “slope effects” as well as “intercept effects”), then interaction terms that multiply E with each affected control variable would be entered in the specification. 28 This finding could be interpreted as showing that public R&D complements private R&D rather than substitutes for it (i.e., crowds it out). See David, Hall, and Toole (2000) and the references therein.

33
Productivity Models
Productivity models are a special case of a performance model (i.e., P in the previous
section) that has been estimated using econometric tools. The special case is highlighted
here because many of the innovation-based policy responses to the productivity slowdown in
the early- and then again in the late-1970s were based on what economists frequently call
production function analysis. A production function is a mathematical representation of the
relationship between a firm’s (or other unit of analysis) output and the inputs that generate
that output. For example, it is generally assumed that a firm’s flow of labor (L), its stock of
physical plant and equipment or capital (K), and its stock of technical knowledge (T) are
relevant inputs in the production of a firm’s output (Q) as:
(7) Q = F (L, K, T)
Under a set of stylistic assumptions, such as the functional form for F(•) and the
relationship between T and the firm’s investments in R&D, an econometric model can be
derived from which one can estimate the rate of return to the firm’s investments in R&D.
An estimate of the rate of return to investments in R&D could be useful for an economic
impact analysis if the model is estimated before and after an R&D program.29 Generally,
however, such productivity models have not been used for this purpose but rather for
justification of future public-sector R&D programs to support firm-level investments in
R&D.
Benchmarking Analysis
Benchmarking analysis involves the comparison of the performance of firms affected by
a public-sector R&D program relative to a theoretical objective or goal, to the best practice of
all of the firms being studied, or to some other exemplary standard. For example, if the
performance of k firms affected by the public-sector R&D program is denoted as Pi, i = 1 to i = k,
and if the theoretical objective or goal of the program is for firm performance to reach the
level P*,30 then the relevant comparison is the performance of each of the k firms to the
benchmark P*, that is the relevant comparison is between P* and Pi, i = 1 to i = k.
Because benchmarking analysis is designed not only for impact analysis, but also for
improved program management, k firm-specific indices can be calculated as (P* ‒ Pi) and
then each index can be compared to a set of firm characteristics. In other words, one could
29 Hall et al. (2010) provide an excellent review of the academic literature on such productivity models. 30 P* could also be the performance level of the most efficient firm in the sample, the average performance of all firms in the sample, or some other performance index related to best practices.

34
quantify the characteristics of firms that are related to their performance being “closer” (i.e.,
(P* ‒ Pi) > 0 but relatively small in value) or “farther away” (i.e., (P* ‒ Pi) > 0 but relatively
large in value) from the theoretical objective or goal of the program.
As an example, the interaction between public sector R&D (mostly within universities)
and firm performance has been called by Polt et al. (2001) a dimension of “industry-science
relations (ISR).” In the 1990s throughout Europe two paradoxical trends were being
observed, high performance in science and deteriorating industrial competitiveness. In
response to this widely observed “European paradox,” the European Commission, DG
Enterprise, and the Austrian Federal Ministry of Economy and Labor commissioned a
benchmark analysis of ISR in eight EU countries (Austria, Belgium, Finland, Germany,
Ireland, Italy, Sweden, and the UK) and the United States and Japan. Examining multiple
indicators on ISR, such as university-industry research collaboration, faculty consulting with
industry, patent applications, and new business start-ups related to public research, Polt et al.
(2001) analyzed factors that determined the highest level of university performance in each
dimension of ISR. In other words, the performance of ISR across universities within each
country was benchmarked against the most efficiently performing country in each dimension
(e.g., the most efficient countries in terms of new business start-ups related to public research
are those that support campus-based infrastructures to provide management and financial
support for start-ups).
Innovation Surveys
Innovation surveys, although referred to by Polt and Rojo (2002) and others (e.g., Licht
and Sirilli 2002) as an evaluation methodology, are in our opinion a data collection tool that
can be used for both an economic assessment and an economic impact analysis. Large
publicly administered innovation surveys are an effective means to collect data related to
various aspects of the innovation process from a national perspective.31 The surveyed units
are generally firms or enterprises, but aggregation to an industry or national level is not
uncommon.
European countries have sponsored broader and more detailed innovation surveys than
has the United States. Noteworthy are the Community Innovation Surveys (CIS) throughout
the European Union. The surveys began in 1992 and have continued more or less on a bi-
annual basis. A hallmark of the CIS efforts is their breadth of coverage of multiple
dimensions of the innovation process (e.g., sources of information that firms use to enhance
their innovation strategy) and their documentation of a variety of government innovation
31 Such publicly administered surveys also have economic value in the sense that they are within the public domain (controlled for confidentiality issues); and thus, analyses based on the collected data can be replicated.

35
policy schemes (Licht and Sirilli 2002). The National Science Foundation’s Survey of
Industrial Research and Development pales in comparison to the CIS efforts in terms of its
ability to collect information to quantify multiple R&D spending dimensions of the
innovation process.
Information collected through the CIS efforts lends itself to the estimation of econometric
models like those in equations (5), (6), and (7) above. Information collected through NSF’s
R&D survey could be used in econometric models like those in equations (5), (6), and (7),
subject to accessibility to firm responses, but only when other external information is
imposed on the model (e.g., time series R&D data from the NSF survey can be used in a
model like that in equation (5) to test for changes in R&D spending pre- and post-policy
periods).
Expert Panels and Peer Reviews
Following the United Nation’s definition (2005, p. 17):
Peer review can be described as the systematic examination and assessment of
the performance of an entity by counterpart entities, with the ultimate goal of
helping the reviewed entity improve its policy making, adopt best practices,
and comply with established standards and principles.
The peer review process is widely used to assess the quality of scientific endeavors
ranging from manuscripts submitted for publication in a scholarly journal to the social impact
of a public sector program’s research programs (e.g., the Department of Energy (1982,
1991); Office of Naval Research (1989)). To generalize, experts are asked to review public
sector research projects on a number of dimensions. In the case of the Department of Energy
(1982) evaluation of basic energy sciences projects, several evaluation factors were
considered ranging from the scientific merit of the research to the expected impact of the
research on the energy mission of the agency.
Ormala (1994), for example, notes that evaluation panels are used widely throughout
Europe for public sector policy and program evaluation, especially those related to public
sector R&D evaluation. One especially noteworthy effort was, according to Ormala, the
Commission of the European Communities evaluation of the first European Community
R&D Framework Program.32
32 The Framework Program was initially designed to assist small- and medium-sized enterprises; technology-based enterprises in particular, compete in globalized markets.

36
The National Academy of Sciences (1999, p. 38) recommended that federal agencies, in
compliance with GPRA, should rely on expert review to assess the quality of basic research
that they fund:
Federal agencies should use expert review to assess the quality of research
they support, the relevance of that research to their mission, and the leadership
of the research.
The Academy (1999, p. 39) was also of the opinion:
The most effective way to evaluate research programs is by expert review.
The most commonly used form of expert review of quality is peer review.
This operates on the premise that the people best qualified to judge the quality
of research are experts in the field of research.
Network Analysis
The structure of relationships among firms and institutions can be characterized, often
visually,33 by a network that consists of nodes and ties. Nodes are the firms and institutions.
Network analysis has not frequently been used as a tool for an economic impact analysis
of public sector R&D, but the concepts that underlie network analysis, that is spillovers of
information through relationships (personal or institutional), could be used. Consider the
simple visual representation of a network in Figure 2. Six nodes are shown, but the node
labeled as “NIST” is the focal node. NIST in the figure is tied to four firms directly—labeled
as A, B, C, D—each of which has a social relationship with personnel in one of the
laboratories at NIST, and through that relationship there is the exchange of research
knowledge of a public good or quasi-public good nature. The dotted line between firm A and
firm C illustrates that the two firms are socially tied, through, for example, participation in a
standards setting committee.
In most of the internal NIST R&D program impact analyses summarized in Table 1,
scientists within the analysis’s sponsoring laboratory identified firms, like firms A, B, C, D,
and E in Figure 2, as points of contact. Discussions with informed individuals within such
firms allowed the principle investigators of the analyses to glean information about the
performance of the firm as a result of its interaction (personal and knowledge-based) with
NIST and its research program.
33 See, for example, Freeman (2000) for a discussion of how social networks are visualized.

37
Network analysis might be a useful tool for identifying what we call imbedded
technology flows. Rather than mapping personal interactions among NIST and other firms,
mapping firm citations to NIST research or NIST citations to firms’ research could define a
network of technology flows that would characterize the breadth of impact of NIST’s
research and in addition would define which firm to consider for impact information in
analyses like those summarized in Table 1.34
There are, however, some policy-relevant examples of the use of network analysis.
Bührer (2002), as one example, describes the use of network analysis as a tool for illustrating
and assessing how the Federal Ministry for Education and Research’s public support of
clinical research at eight German universities has met its objective of interdisciplinary
communication and cooperation. Simply, the more ties there are among the eight universities
(the nodes) and among users of the hospitals’ research, the more likely that the objectives of
the publicly supported research are being met.
Figure 2
A NIST-Centered Social Network
B
NIST A
D
C
E
34 See Link and Scott (2002) for an analysis of patent citations and technology licensing agreements. See also Narin (1996).

38
V. Conclusions
Although prospective analyses are beyond the scope of this planning report, thinking
about them adds useful perspective to the discussion of retrospective analyses. There are
examples of economic impact analyses in Table 1 where the time series of expected benefits
and costs are extended into the future because the NIST infrastructure technology being
evaluated had a commercial lifetime extending beyond the date of the analysis. Nonetheless,
those analyses are retrospective because they evaluate NIST programs that started in the past;
the programs are expected to generate benefits into the future; prospective analyses would
entail evaluations of potential public investment in new projects. In thinking about altogether new technology programs and projects, according to Martin
(1995, pp. 139-140):
It is widely agreed that new technologies … will have a revolutionary impact
on the economy and society over the coming years. … [Government is thus
under pressure to answer the question:] how can one identify the most
promising research areas and the emerging technologies on which to
concentrate resources and, hence, derive the fullest socio-economic benefits?
… Foresight represents one response to these pressures. [Foresight] is the
process involved in systematically attempting to look into the longer-term
future of science, technology, the economy and society with the aim of
identifying the areas of strategic research and the emerging generic
technologies likely to yield the greatest economic and social benefits.
Technology assessment/economic impact, in contrast, is a process to project the
economic impacts associated with the allocation of resources toward new science and
technology.
Foresight differs from technology assessment/evaluation in at least one important
dimension. Foresight is a management tool, not an assessment or evaluation tool, method, or
methodology.35 In contrast, technology assessment/evaluation is a policy tool used to
35 The importance of foresight as a strategic management tool is not independent of government’s role in the innovation process, which is based on the economic concept of market failure. Market failure refers to the market—including both the R&D-investing producers of a technology and the users of the technology—underinvesting, from society’s standpoint, in a particular technology or technology application. Such underinvestment occurs because conditions exist that prevent organizations from fully realizing or appropriating the benefits created by their investments. To elaborate on the concept of market failure, consider a marketable technology to be produced through an R&D process where conditions prevent the R&D-investing firm from
39
approximate the economic impacts associated with science and technology resource
allocations.36
In the United States, technology assessment as a policy tool gained visibility through the
Congressional Office of Technology Assessment (1974 – 1995).37 Technology
assessment/evaluation is a tool that could effectively be used for prospective economic
impact analyses, but prospective analyses have not been conducted to any great extent, and
are conspicuously absent from the NIST analyses summarized in Table 1.38
Because the policy tool of technology assessment/evaluation examines resource
allocations to science and technology, a key question for such evaluations of economic
impact, whether retrospective or prospective, is: Why should government rather than the
private sector fund and perform the activity being evaluated? The analyses reviewed in
Table 1 answer this fundamental question in a variety of ways depending on the context of
each particular analysis, but the short answer is “market failure.” Each of the analyses in
Table 1, based on discussions with industry experts, found significant sources of market
failure underlying the need for the publicly financed and publicly performed infratechnology
investment being evaluated.
Whether economic impact analyses are retrospective or prospective, identification of the
market failure that provides the reason for public investment plays an integral role in the
analyses themselves because understanding the market failure helps to formulate the crucial
counterfactual scenario that must be clearly stated if benefits from the public investment are
to be identified. Are barriers to technology so severe that the private sector would not even
attempt to replicate the public investment (extant investment for a retrospective analysis and
fully appropriating the benefits from technological advancement. Other firms in the market, or in related markets, will realize some of the benefits (economic profits—revenues in excess of the opportunity costs of the resources used by these other firms) from the innovation, and of course consumers will typically place a higher value on a product than the price paid for it. The R&D-investing firm will then calculate, because of such conditions, that the marginal benefits it can receive from a unit investment in such R&D will be less than could be earned in the absence of the conditions reducing the appropriated benefits of R&D below their potential, namely the full social benefits. Thus, the R&D-investing firm might underinvest in R&D, relative to what it would have chosen as its investment in the absence of the conditions. There are a number of factors that can explain why a firm will perceive that its expected private rate of return will fall below its hurdle rate, even when the social rate of return exceeds the social hurdle rate. See Link and Scott (2011) for a more detailed explanation, and see footnote 13 for enumeration and brief discussion of eight factors that constitute barriers to innovation and technolology. The eight factors lead to a private underinvestment in R&D. 36 The importance of technology assessment/evaluation as a policy tool is not independent of identifying which of the barriers to innovation and technology brought about the market failure and then understanding the extent to which allocated resources will overcome those barriers. 37 Schot and Rip (1997) offer examples of technology assessment used in the Netherlands. 38 An exception is Leech and Scott (2008) that provides an economics-based prospective analysis to look ahead to the expected impact of intelligent machine technology and to explain that new public infratechnology investments would increase that future impact.

40
proposed investment in a prospective analysis)? In that case, the counterfactual scenario is
the status-quo-ante technology absent the public investment, and a “traditional” economic
impact analysis in the sense of Griliches (1958) is appropriate.
Or, would the private sector, absent the public investment and despite barriers to
technology, undertake investment to provide a substitute for the infratechnology generated
with the public investment? In that case, what Link and Scott (2011) call “counterfactual
analysis” is the appropriate approach for an economic impact analysis, with the benefits of
the public’s investment being the costs avoided by the private sector—the investment costs
the private sector would have incurred to replicate the public infratechnology and any
shortfall in the value of the counterfactual privately developed infratechnology from the
value of the technology developed publicly (often by means of the cooperative efforts of
NIST and industry in public-private partnership) .
As explained earlier, the “counterfactual analysis” is equivalent to the “traditional”
approach when that approach is appropriate for the evaluation of publicly financed and
performed R&D—i.e., when barriers imply the private sector would not attempt to provide
the infratechnology. Thus, the “counterfactual analysis” actually covers both approaches.
As the discussion in Sections II and III explain and as the overviews of the economic impact
analyses in Table A1 illustrate, in practice both approaches are useful—both the traditional
approach, with its counterfactual of the status-quo-ante technology, and the approach for
which the counterfactual scenario entails private investment to provide the infratechnology
that the public program provides.
To conclude, key recommendations made earlier in the report are brought together here
with a list of methodology lessons learned that are identified in the discussions of the
economic impact analyses in Table A1.39 Together the recommendations and methodology
lessons are a list of guidelines for economic impact analyses.
The timing of an economic impact analysis is important—sufficient time must have
passed for the effects of the infratechnology to be observed. For example, the analysis of the
Thermocouple Calibration Program, Planning Report 97-1, was premature. The analysis was
supposed to estimate the benefits of a new international standard for calibration data. But, the
international body did not understand that industry was committed and happy with the
existing standard; i.e., industry did not yet need to shift to the new standard. Similarly, in the
analysis of role-based access control, Planning Report 02-1 the analysis was premature
because there had not yet been sufficient market penetration of the infratechnology being
evaluated.
39 We thank Gregory Tassey for helping us draw out the methodological lessons from our review of the economic impact analyses in Table A1.

41
The timing of an economic impact analysis is important—the time during which the
greatest effects of the infratechnology were realized must not be so far in the past that
gathering good information about the benefits is not possible. An analysis can be done too
late; in contrast to the thermocouple analysis, that of NIST’s Cholesterol Standards Program,
Planning Report 00-4, was done too late because as a practical matter it is not typically
possible to gather the quantitative information about benefits in a period about which the
institutional memory of respondents—even if appropriate respondents can be found—has
faded.
Benefit data for most economic impact analyses came from detailed interviews or
surveys, but possibilities for using published data (in conjunction with or in place of
gathering new survey data) should be considered and used when appropriate information is
available as in the analysis of NIST’s Data Encryption Standard (DES) Program, Planning
Report 01-2.
When benefit data are gathered by survey, the study team should be given access to the
addresses and other contact information for the entities surveyed. For example, in the
analysis of the Baldrige National Quality Program, Planning Report 01-3, the American
Society for Quality (ASQ) sent the survey to its members, but the study team did not have
access to the e-mail list of the recipients of the survey. The predictable result was the low
response rate because although the ASQ could follow up with a mass e-mail to its members,
the opportunity for the study team to implore each member to participate was absent.
Before an infratechnology investment is undertaken, NIST should be sure that a
significant underinvestment gap exists. The relatively small reduction in R&D costs found in
the analysis of NIST’s investments in superfilling research, Planning Report 08-1, suggests
as a methodological lesson that when deciding to undertake an investment project, project
managers should be sure that a significant underinvestment gap exists.
NIST project managers can maintain key contacts with the users of their projects’ outputs
at all stages of the supply chain and communicate with those contacts about the types of data
that will be needed to estimate benefits. Ideally such data would be routinely gathered in real
time on an ongoing basis. The availability of such data would allow periodic evaluations
documenting impacts thus facilitating NIST’s ability to make possible adjustments that
would better serve industry’s needs and also allowing NIST to provide quality information
about performance to support the mandate of the GPRA.
When NIST initiates a new program and also in real-time as program directors and
project managers gather information useful for evaluating their projects, they also can work
with their industry contacts to develop understanding of the nature of the market failure to
which the public provision of infratechnology investment is responding. Developing that

42
understanding will inform the direction of the infratechnology investment in a way that
increases its beneficial economic impact.
A project manager’s key contacts in industry throughout the relevant supply chain can
also provide access to greater numbers of industrial respondents to surveys about the
economic impact of the project. For some of the surveys discussed in the overviews of the
economic impact analyses reviewed in Table A1, there were very small numbers of
respondents who could provide expert opinions about key benefits. Key contacts could be
asked on an ongoing basis about other industrial users of the infrastructure technology, and
project managers could maintain lists of industrial users in real time and on an ongoing basis.
With larger numbers of respondents to provide estimates of benefits of particular types when
surveys of industry are administered, it will be possible to produce formal statistical
confidence intervals for the estimated benefits.
The other techniques, discussed in Section IV, relevant for an economic impact analysis
can be used to complement the approach of the economic impact analyses that has been
discussed in Section III.
At a general level, the review of the analyses in Table A1 in the context of the theory of
economic impact analyses suggests several questions that project managers could discuss
when planning for future analyses of economic impact.40
Should NIST standardize the supply chain used in the economic impact analyses? In our
opinion, the answer is no. Instead, the place to begin is with the abstract, general
understanding of how the economic impact of NIST’s infrastructure technologies occurs
throughout the idealized supply chain based on the four tier model identified in our report.
Then, with that idealized model in mind, the project leaders deciding on infratechnology
investments or the study team planning an economic impact analysis can develop the actual
supply chain where benefits are realized.
Should NIST replace the current approach that is often driven by the availability of data
for assessment of benefits with a more standardized application of the cost/benefit
methodology? As a practical matter, the answer in our opinion is no, but future economic
impact analyses should continue to identify, as the past analyses have done, qualitatively all
of the benefits and costs, ensuring that the metrics presented are conservative and explaining
why that is so. The current approach can only be characterized as data driven in the sense
that all data that can be reliably collected and reasonably quantified is included in the
calculations of metrics, but the analyses are not data driven in that they try to identify
qualitatively all of the benefits and costs. Thus, the quantitative metrics are data driven (as of
40 We thank Gary Anderson; we have developed these questions from his comments on an earlier draft of this report.

43
course must be the case), but the overall evaluation is not. The result is that estimated cost-
benefit ratios can differ for reasons other than differential impacts between research
programs, and for that reason it is crucial that each analysis continue to identify all effects
qualitatively and state clearly what is missing from the estimated evaluation metrics and
emphasize that readers should not simply compare benefit-to-cost ratios or other metrics
across the analyses. Instead, the conservative metrics along with a good understanding of
what is missing from the metrics must be in mind when comparing the economic impacts of
the analyses. While some analyses are able to quantify impact for a single tier of the supply
chain, others quantify benefits for three tiers. Some analyses are able to extrapolate benefits
to draw conclusions regarding impacts at the industry level while others are able only to
characterize the direct impacts on survey respondents. Some analyses are able to quantify
future benefits while others must restrict the analysis to quantification of past benefits even if
the NIST technical outputs remain state-of-the-art. The end point for benefits to be realized
in the future must of course be determined by a conservative estimate of the future impact
horizon, and the likely proportion of future benefits that is conservative may be very different
across analyses given the information available.
Summarizing, by following the recommendations about gathering benefit and cost data
for the economic impact of an infratechnology project on all affected parts of the supply
chain, NIST will have, to the extent practicable, the type of data that it needs to evaluate the
project. As a review of the previous economic impact analyses shows, the type of data will
often differ by project and by the tier of the supply chain affected. In our experience,
benefits extending into the future are even more difficult for industry’s beneficiaries to
estimate, but if the recommendation for ongoing, real-time gathering of benefit and cost data
are followed, a better fix on the benefits and costs and the expected commercial lifetime will
be available than has been available for the extant analyses. The expected commercial
lifetimes vary across the different infrastructure technologies because the pace of
technological change varies widely across different industries and even within industries
across different types of infratechnology applications. Real-time and ongoing data collection
will also make possible more accurate extrapolations of benefits from the respondents to the
industry-wide level. The previous economic impact analyses have differed in the extent to
which they extrapolate simply because it is not always possible to develop a good
understanding of how representative an individual respondent is of the entire industry. The
real-time and ongoing maintenance of industry contacts and data collection will, because
such benefits are often more difficult to quantify, also enable more analyses that measure the
economic impact of basic measurement research (as contrasted with the evaluation of the
calibration services that take such science as given) such as in the evaluation of the

44
investment in developing the basic science of wavelength references for optical fiber
communications in the analysis of ATP’s Intramural Research Awards Program (in NIST
GCR 04-866). As the analysis shows, the industrial benefits from developing basic
measurement science can be immensely important for innovation and the productive
evolution of technology.

45
Appendix
Summary of Internal NIST R&D Program Impact Analyses
(1) “Economic Assessment of the NIST Thermocouple Calibration Program,” Planning
Report 97-1
The NIST Thermocouple Calibration Program (TCP) is a part of the NIST Chemical Science and
Technology Laboratory (CSTL). Thermocouples are electronic sensors for measuring temperature
for use in a wide variety of applications—including medical procedures, scientific research,
automated manufacturing processes (such in the food industry or in semiconductor manufacturing),
military/aerospace, and in power generation—where temperature is an important parameter in a
measurement or control system. The supply chain using NIST’s TCP includes thermocouple
suppliers that purchase wire from the suppliers of wire used to fabricate and assemble
thermocouple products. Assembled thermocouples are sold to the users of thermocouples.
The NIST TCP generates technical knowledge to improve the calibration accuracy and
efficiency of thermocouple measurements made in industry. This analysis focused on three TCP
technical outputs: (1) reference functions and tables for thermocouples, (2) primary calibration
services for traceability of standards used in thermocouple measurements, and (3) technical support
to industry in solving technical problems—support is provided via telephone, during visits by
industry representatives to the Thermometry Group’s laboratory, in published papers, and with
tutorials on thermocouple calibration at conferences and seminars. All tiers of the supply chain
benefit from the TCP outputs.
From the technical outputs of the NIST TCP, thermocouple users and suppliers derive three
main types of benefits. (1) There are efficiencies in developing and disseminating the technical
knowledge needed for performing thermocouple calibration tests—the TCP infratechnology
necessary for calibrating thermocouples has avoided duplicative research by individual companies
and industrial consortia. (2) There are transactions cost savings between users and producers.
There are two market interfaces where transaction costs are reduced: first, the interaction of
thermocouple material (wire) suppliers and thermocouple producers, and second the thermocouple
producers and device manufacturers engaged in thermocouple commerce.
The industrial agreement about the standards established through NIST’s impartiality and high
quality outputs has avoided time spent in resolving disputes between firms at different stages in the
supply chain. (3) There is improved competitiveness for domestic users of thermocouples through
enhanced product performance and process efficiency—accurate temperature measurements

46
traceable to NIST standards has improved the marketability (compatibility with international
product standards) and production efficiency (e.g., process yields) and product features (e.g.,
performance and reliability) of users’ products. In this case study, the first two types of benefits
were estimated while the third type of benefit was not quantified because although the economic
magnitude of the improved competitiveness for users is significantly greater than the first two
benefit types, it was too difficult to quantify given the absence of the type of ongoing real-time
collection of data about benefits by the users that has been recommended in the discussion of
Section III. In addition to the operational lesson about the need for ongoing collection of benefit
data, this analysis illustrates a methodological lesson about the timing of an economic impact
analysis. In this case, the timing was premature. The analysis was supposed to estimate the benefits
of a new international standard for calibration data. But, the international body did not understand
that industry was committed and happy with the existing standard; that is, industry did not yet need
to shift to the new standard.
The hypothetical, counterfactual experiment underlying the estimation of benefits from NIST’s
TCP assumes that the first-level economic benefits associated with the NIST TCP can be
approximated in terms of the additional costs that industry would incur in the absence of NIST’s
services. The benefits are the costs avoided by industry due to the existence of the NIST TCP. To
estimate those benefits, industry was surveyed during 1996 and asked about the costs that were
avoided that year because of NIST TCP products and services.
A telephone survey of 10 thermocouple users gathered qualitative insight about their
calibration practices and their perception of the value received from the NIST TCP. The 10
respondents included representatives from the utility, military/aerospace, food and beverage,
aluminum, and commercial electronics industries. Thermocouple users in these industries require
highly accurate measurements of temperature and are well informed about the impact of
thermocouple calibration practices on downstream products or processes. The survey of users
preceded the survey of thermocouple suppliers and enhanced the quality of the supplier survey;
however, data obtained in the user survey was not quantified and was not used in the evaluation
metrics. Benefits for domestic users were not quantified because they are more indirect and
difficult to quantify than the benefits for the wire suppliers and thermocouple suppliers.
A sample of 7 wire (or material) suppliers that represented almost 100 percent of the domestic
industry and a sample of 12 thermocouple suppliers that represented over 90 percent of the
domestic market were surveyed.
Opinions of the 7 wire suppliers were mixed regarding their company’s reaction to the
hypothetical counterfactual scenario of NIST ceasing to provide primary calibration services. A
majority thought that their company would rely on foreign laboratories for similar calibration
services provided by the NIST TCP. Some believed that over time an industry consensus on
measurement methods would develop through a private laboratory or industry association; the
emerging entity would then assume NIST’s current role in providing primary calibration services.
Respondents believed that interactions with a foreign laboratory would incur additional, permanent

47
transaction costs under the counterfactual experiment. Based on previous interactions with foreign
laboratories, these costs would be associated with both the administrative “red tape” and
inaccessibility to scientists in the foreign laboratories. Although the quality and price of the
calibration services from those laboratories are deemed comparable to NIST, the red tape and the
delays in receiving services would be significant. Respondents projecting that an industry
consensus on calibration requirements would develop over time anticipated a mean time of five
years would be required with the expenditure of significant resources with a larger number of
measurement disputes between their company and their customers. Consequently, additional
personnel would be needed during this five-year time interval until the domestic industry reached
consensus about acceptable calibration measurements. Examples of the expected types of
additional administrative costs included auditing, changes in calibration procedures, and overseas
travel. Respondents approximated, in current dollars at the time of the survey, the additional
person years of effort required to cope with the additional transactions costs expected in the
absence of NIST TCP and also the costs of a fully-burdened person year of labor within their
company. From the responses was calculated the total for all respondents of the additional costs in
1996, in dollars of that year, that would be needed to address all transaction costs issues, absent the
NIST TCP. In addition to calibration services, the NIST TCP also provides telephone technical
support to industry. Absent NIST’s services, wire suppliers reported they would purchase similar
expertise from consultants, and the total annual cost for all wire suppliers for these substitute
benefits was estimated from the respondents’ reports about the frequency with which they used
NIST’s service, the cost (i.e., pull cost) to acquire and use that form of NIST information. In sum,
the collective opinion of the 7 wire suppliers, that effectively represent the entire domestic
industry, was used to estimate the addition to annual costs needed to continue operating at the same
level of measurement accuracy if NIST’s TCP ceased to provide calibration services.
Similar hypothetical cost data were collected from twelve thermocouple suppliers. Regarding
an alternative measurement source in the absence of NIST’s calibration services, only two
respondents thought that their company would rely on foreign laboratories for calibrations. The
other 10 respondents believed that an industry consensus would eventually emerge, and similar to
the mean reply from the wire suppliers, the mean length of time for achieving industry consensus
was estimated to be five years. The total additional cost of doing calibrations without NIST’s
services and or reaching consensus about measurements during the adjustment interval for all firms
in the survey was estimated. Also, the total additional cost for market alternatives to the technical
support received from NIST was estimated. In sum, the interviews with the 12 thermocouple
suppliers, that effectively represent the domestic industry on a market share basis, were used to
estimate the addition to annual costs for this segment of the industry to continue operating at the
same level of measurement accuracy in the counterfactual situation where the NIST TCP ceased to
provide calibration services
Viewing the wire suppliers and thermocouple suppliers together as the first-level industry
beneficiaries of NIST TCP, the economic benefits associated with these services were estimated by

48
the additional costs that the thermocouple industry would incur, as described in the preceding two
paragraphs, in the absence of such services.
The time series of NIST TCP costs used to evaluate the return to the program began in 1990
and ran through 1996, the time of the analysis, and then was forecast through 2001 using the rate of
increase anticipated for the increase in labor costs at NIST. The time series began in 1990 because
that was the year of the update of the international agreements on the scale of temperature for use
in science and industry, and the 1996 technical state of thermocouple calibration measurement is
based on the development of reference tables beginning in 1990. NIST TCP costs were for the
development of the new reference tables and functions, maintenance and upgrade of test methods
and test equipment, and calibration services. Although pre-1990 NIST expenditures have certainly
enriched the broadly-defined state of current technical knowledge for thermocouple calibrations,
the analysis concluded that the most relevant aspect of this knowledge is linked to conducting and
applying post-1990 research. Hence, 1990 was selected as a logical starting point for the
comparison of NIST’s costs to net industry benefits.
The time series of industry benefits from NIST TCP’s products and services is begun in 1997
and projected through 2001. The five years of benefits are based on the counterfactual scenario in
which NIST TCP stopped operation at the end of 1996, and then the annual benefits for 1996
estimated from the surveys of the wire and thermocouple producers were projected in constant
1996 dollars for the next five years with annual increases based on the projected increases in fully
burdened labor costs. The five-year period of benefits represents the average amount of time that
respondents projected for the thermocouple industry to reach a consensus on an alternative to
NIST’s calibration services in the hypothetical, counterfactual scenario.
The evaluation metrics calculated for the social value of NIST TCP’s investments are
conservative because some respondents believed that the additional transactions costs would exist
forever if companies relied on foreign laboratories and also the additional costs of market-based
consulting substitutes would continue into the future. The metrics are also conservative because
the value of improved performance by the users of thermocouples was not quantified. Thus, the
evaluation metrics are very conservative (i.e., biased downward).
(2) “Economic Evaluation of Radiopharmaceutical Research at NIST,” Planning
Report 97-2
The Radioactivity Group of the Ionizing Radiation Division of the Physics Laboratory at NIST
produces radiopharmaceutical standard reference materials (SRMs) through a Cooperative
Research and Development Agreement (CRADA) with the Nuclear Energy Institute (NEI) and
sells the SRMs to the members of the NEI/NIST Radioactivity Measurement Assurance Program
(MAP) and to the public. The analysis focuses on selected broad-based economic impacts of the
program’s research activities.
49
There is an economic cost to imprecise measurement of radiopharmaceuticals. Too little
radiation and a procedure may have to be redone; too much radiation and injury or death could
result. The nuclear pharmacist must deliver as close to the prescribed dosage as possible.
At each step in the distribution chain—the preparation of radiopharmaceuticals by the
manufacturer, the dispensing by the radiopharmacist of individual doses for patents at the clinic or
hospital, and the administering by the nuclear medicine technician of the radiopharmaceutical to
the patient—good measurement and quality assurance must be maintained because any errors
introduced earlier in the distribution chain are quickly multiplied before the drug is given to the
patient.
Data were collected with semi-structured, interactive telephone interviews with all seven U.S.
manufacturing companies then participating in the NEI/NIST Radioactivity MAP.
The respondents reported that absent NIST’s Radioactivity Group’s involvement in SRMs, it
would take between 5 and 10 years for an industry group or association to form and become
accepted as a de facto standards setting body. That was the counterfactual scenario absent NIST’s
radiopharmaceutical infratechnology research and services which underlie the efforts of the
standards setting bodies; the manufacturers reported that foreign national laboratories for SRMs
had never been considered. The total (summed over the seven companies) expected transaction
costs during the 5 to 10 year transition period represented additional labor costs—expected to be
required on the part of manufacturers to resolve measurement disputes between manufacturers and
their customers—and also the associated additional measurement equipment needed by
manufacturers. The expressed expectation was that these costs would increase between 4 percent
and 10 percent per year until a steady state situation was reached. Moreover, during the 5 to 10
year transition period, the level of accuracy at the manufacturing stage would decrease from the
current ±3% to between ±5% and ±10% because of the lack of accurate reference materials and
measurement methods. At the hospital, the accuracy of dosages would fall from the current ±10%
to at least ±15%.
In addition to the reduced transactions costs between radiopharmaceutical manufactures and
their customers, the increased accuracy of diagnostic procedures was estimated to have saved re-
doing 1% of all procedures at an average cost of $500 to $750 per procedure. Increased accuracy
of therapeutic procedures was estimated to have saved re-doing 3% of all procedures at an average
cost of $1,500 to $2,500 per procedure.
The long-term economic costs, although probably substantial, of health implications (such as
organ damage) of too high a dosage could not be estimated.
For the counterfactual experiment, the analysis posits that NIST research was not available as
of 1997. Then, using the opinions of the radiopharmaceutical manufacturers, for 5 to 10 years
industry would have incurred costs and decreased accuracy. But, to be conservative, just the
shorter, 5 year period is assumed. Current economic benefits are traceable to research begun 4 to 6
years earlier according to NIST’s experts, and to be conservative the cost data were observed
beginning in 1990. Thus, the NIST cost data include capital, labor, and materials expenses from

50
1990 through 1996, and also NIST’s costs of operating the program from 1997 through 2001 were
estimated and added to the cost time series. The NIST costs related to the production of
radiopharmaceutical SRMs are compared to the estimates of the economic benefits received by
SRM users where those benefits are estimated by the additional costs that the radiopharmaceutical
manufacturers and patients would incur in the absence of NIST’s research. The benefits estimated
for the manufacturers and the diagnostic and therapeutic procedures are observed for only the
period 1997-2001 and compared to NIST’s costs from 1990 through 2001.
The metrics understate the social value of NIST’s contribution to radiopharmaceutical services
because they were calculated under a conservative set of assumptions and because some benefits
are unmeasured. When experts expressed an opinion in terms of a range of values, the most
conservative end point of the range was used. Also, to be conservative, any benefits during the
period of NIST’s initial investments—in the infratechnology used from 1997 through 2001—from
1990 through 1996 were not measured even though NIST’s costs for its radiopharmaceutical
program were measured. Also, there are certainly costs associated with both underdose and
overdose mis-administrations that go beyond the direct cost of re-administering an underdose. The
benefits associated with these cost savings were not estimated.
(3) “Economic Assessment of the NIST Alternative Refrigerants Research Program,”
Planning Report 98-1
The formal alternative refrigerants program at NIST began in 1987. It created economic benefits
by reducing the cost of industry’s transition, mandated by global agreement in the Montreal
Protocol of 1987, from using chlorofluorocarbon (CFC)-based refrigerants to using alternative
refrigerants that would not deplete the earth’s ozone layer. With NIST’s research, the transition
from CFCs to alternative refrigerants was more timely and efficient. Without NIST, the transition
would have been more costly and less effective—less quality for the replacement technologies and
the replacement would have been delayed.
NIST provided industry with a common source of data and methods for evaluating the
properties of alternative refrigerants. Without NIST, each company would have made different
choices about refrigerants creating substantial additional costs for maintenance and repair firms.
NIST’s research became the industry standard, in the public domain and accessed by a wide range
of users. NIST’s dissemination of reliable data and evaluation methodologies reduced transactions
costs in industry.
Information about the benefits of NIST’s alternative refrigerants program was gathered from
the five major U.S manufacturers of alternative refrigerants representing about 90% of the industry,
and the six major U.S. users of refrigerants—manufacturers of commercial and industrial
refrigeration and air-conditioning equipment—representing over 70% of the industry.
Economic benefits were approximated by additional costs the refrigerants manufacturing

51
industry would have incurred in the absence of NIST’s alternative refrigerants program. The
quantified costs avoided were largely the costs of additional research scientists and engineers to
provide the materials characterization and analysis needed by their alternative refrigerants
programs in-house or in research consortia. Also estimated, but less important, were costs for
additional equipment needed for doing the research in the absence of NIST.
The industry benefits measured occurred over the period from 1989 through 1996, and those
quantified benefits were compared with the costs, beginning in 1987, of NIST’s alternative
refrigerant program—costs that included not only NIST-financed research expenditures but also
research expenditures financed by other agencies. Pull costs for industry were negligible.
The estimated social rate of return for NIST’s alternative refrigerants program was substantial,
but clearly it was an underestimate because the analysis identified several benefits from the
program that were not quantified. Not quantified were the transactions cost savings for firms
designing refrigerant equipment. Absent NIST, there would have been less comprehensive, less
accurate, and more heterogeneous properties data from individual chemical manufacturers selling
alternative refrigerants to equipment designers and manufacturers. Transactions costs of resolving
disputes about chemical properties were avoided but not fully measured. Moreover, given the
deadlines for CFC replacement imposed by international agreements, absent NIST’s program, less
well researched and less optimal refrigerants would have been adopted with the result that
equipment using the inferior chemicals would have been less efficient. The amount of
standardization would have been less absent NIST, and uncertainty about refrigerant properties
would have been greater, lessening the confidence in the new products developed by refrigerant
manufacturers and users.
(4) “Economic Assessment of the NIST Ceramic Phase Diagram Program,” Planning
Report 98-3
NIST’s Ceramic Phase Diagram Program provides critically-evaluated phase equilibria
diagrams used in the development and use of ceramic materials. Without the diagrams the ceramic
component suppliers would be less efficient in gathering the information about chemical systems
relevant to ceramic materials research and engineering. There would be greater costs for internal
R&D, duplicative R&D costs in the design of new materials, and delays in innovating ceramic
materials.
Ceramists in the four major market segments of advanced ceramic materials differ in their
reliance on phase diagrams for product development activities. In order of reliance, the ceramics
market segments are structural, electronics, environmental, and coatings. The advanced structural
ceramics industry was the focus for collecting benefit data. Firms in this industry group use phase
diagrams from the Ceramic Phase Diagram Program and especially volumes of diagrams that were
generated since 1985. These particular volumes became the outputs to be evaluated for economic

52
impact.
A sample of 22 advanced structural ceramics firms accounting for about 50 percent of the sales
in the structural ceramics industry were surveyed in interactive telephone interviews. The
respondents provided an estimate of the additional annual cost for labor and equipment that each
company would incur in steady state in order to adjust to the counterfactual situation in which the
evaluated ceramic phase diagrams provided by NIST did not exist. The estimated sum of the
additional annual costs for the 22 respondents was extrapolated to the structural ceramics industry
as a whole.
The primary benefits of the evaluated phase diagrams provided by the ceramic phase diagram
program were the avoidance of R&D costs in the development of new ceramic materials and, to a
lesser extent, explaining abnormalities that might arise in the production of ceramic materials.
These additional costs would have been incurred in internal experimentation R&D and duplicative
research costs required to avoid design and product failures, over-design and waste, and inefficient
materials processing, and avoid delays in new applications of ceramic materials.
NIST’s costs for the Phase Diagram Program were measured over the period from 1985
through 1996 when the volumes of evaluated phase diagrams, primarily used by the structural
ceramics industry at the time of the analysis, were produced. Estimates of annual industry benefits
covered 1997 through 2001 and were based on the steady state annual estimate of the cost savings
for 1997 and then increased for each of the following four years by the annual rate of inflation. The
five-year time frame for the benefits was a conservative application of the respondents’
observations that their companies’ product mixes had tended to change over the course of about
five to ten years.
The estimated evaluation metrics were conservative because many benefits were unmeasured
including benefits for companies other than those in the target group of advanced structural
ceramics manufacturers. Firms in other segments of the ceramics industry as well as downstream
systems manufacturers benefit from the measured NIST investments in the ceramic phase diagram
program. Further, although industry realized benefits from NIST’s investments over the period
from 1985 through 1996, to be conservative the time series of benefits that was compared with
NIST’s costs was assumed to begin with the steady-state benefits estimated for 1997. The
omission of the pre-1997 benefits gives a downward bias to the evaluation metrics. Also causing
the metrics to have a conservative downward bias is the time series of cost incurred by NIST
because the expenditures related to advanced ceramics could not be separated from the total
program expenditures including costs of outputs beyond the scope of the analysis.
Also, respondents reported that absent the evaluated phase diagrams from NIST’s program,
there would have been delays of six months or more in the introduction of new ceramic materials.
Thus, even with the additional industry costs—the avoidance of which was documented as benefits
of the ceramic phase diagram program, there would have been a shortfall in the quality of the
counterfactual response to replace NIST’s program. An unmeasured benefit of NIST’s investments
is the benefit for industry of avoiding that infrastructure-quality shortfall and the lost social value

53
from delayed innovation. Also, despite the additional costs in industry in the absence of NIST’s
program, the alternative solutions to the evaluated phase diagrams from NIST would have resulted
in greater uncertainty about the performance of those final products with the result that new
products would have taken about six months longer to reach the market.
(5) “Benefit Analysis of IGBT Power Device Simulation Modeling,” Planning Report
99-3
NIST’s Electronic and Electrical Engineering Laboratory (EEEL) supports the development of
mathematical models for several classes of semiconductor devices. In 1985 EEEL initiated a
project to support and promote semiconductor power-device modeling. This analysis focuses on
NIST’s development of mathematical models for the design of insulated-gate bipolar transistor
(IGBT) semiconductor power devices. Applications of such devices were in subsystems such as
those used by the automotive and lighting industries. NIST/EEEL’s IGBT mathematical modeling
program—referred to as the NIST IGBT modeling program—has led to significant economic
benefits for software companies, IGBT device manufacturers, and applications manufacturers that
manufacture products that employ IGBTs. The economic benefits include improvements in R&D
efficiency, decreases in transaction costs, decreases in production costs, and improvements in
product quality.
In the absence of NIST’s activities to develop and promote the use of simulation modeling of
IGBTs, industry experts stated that the availability of IGBT simulation modeling software would
have been delayed, would have been more costly to develop, and would not have been as accurate.
Software companies did not have the technology base to develop, verify, and implement the
required mathematical algorithms, and applications manufacturers that have the required technical
expertise are not able to appropriate the returns to such R&D activities.
The data to estimate economic impact were developed from surveys of software manufacturers,
IGBT device manufacturers, and applications manufacturers (in the automotive and motor control,
power control, and lighting industries—the major application groups using IGBTs in their electrical
systems) as well as from secondary data sources. No consumers of end products embodying IGBT
devices were surveyed. Scoping interviews with engineers, upper management, and academics as
well as the technical interviews, typically with design and modeling engineers, were used to
develop the estimates of benefits.
The net benefits of IGBT simulation software are based on the counterfactual scenario of IGBT
simulation modeling capabilities not being available. NIST’s impact on the IGBT simulation net
benefits are estimated by the benefits that would not have occurred in the absence of the NIST
simulation modeling program. Industry respondents stated that the IGBT mathematical models
would not have been as accurate and would not have been available as quickly without NIST’s
contributions.

54
NIST’s IGBT modeling program generated different benefits to each member of the supply
chain. R&D efficiency (lower costs of incorporating math simulation models of IGBTs into
product design software) was improved for software companies and applications manufacturers.
Transactions costs were avoided for device manufacturers and final-product manufacturers
(OEMs). An example would be an electronic ignition system for an automobile. (The device
manufacturers use NIST’s models to develop product datasheets for the IGBT devices they
manufacture. The datasheets provide performance information to OEMs and support the
comparison of competing IGBT devices.) Production costs were lower for applications
manufacturers, and product quality was higher for end users. The analysis, however, was able to
quantify only the benefits for OEMs’ R&D efficiency and device manufacturer’s transactions costs.
These quantified benefits were estimated for the period from 1990 through 2003. The remaining
benefits were evaluated qualitatively because industry could not reliably give quantitative estimates
for the benefits although they acknowledged such benefits.
NIST program expenditures related to the development and promotion of simulation modeling
for IGBT power devices began in 1985, and they were projected to continue through the year 2000
at current expenditure levels. Labor costs accounted for the largest share of program costs.
The evaluation metrics are conservative because, among other things, the quantitative analysis
does not include benefits from reduced production costs and improved product quality and
performance of final products using IGBTs, although the analysis does provide a qualitative
analysis of these benefit categories.
(6) “Economic Impact of Standard Reference Materials for Sulfur in Fossil Fuels,”
Planning Report 00-1
This analysis evaluates NIST’s SRM program for measuring the sulfur content of fossil fuels. The
program uses a definitive method— the isotope dilution thermal ionization mass spectrometry
(IDMS) method—developed at NIST that virtually eliminates bias and significantly reduces the
uncertainty of the SRMs. Without NIST’s SRM program, sulfur measurement in industry would be
subject to greater bias and uncertainty. SRMs help industry verify the accuracy of measurement
methods and calibrate measurement systems, greatly improving measurement accuracy by reducing
the uncertainty of measurement.
Sulfur content affects the quality of products and processes that use fossil fuels; sulfur content
of gasoline and diesel fuel harms the performance of low-emissions vehicles; sulfur content
reduces the efficiency of petroleum processing and affects the quality of other petroleum products.
Metal processing and glass processing are harmed by sulfur content in the fuel oils used for the
processing. The sulfur content of coke used in steel production affects the quality of the steel.
Combustion of fuels containing sulfur as an impurity produces sulfur dioxide which is harmful
when inhaled and also causes acid rain, and better measurement lowers sulfur emissions to the

55
environment. Therefore, more accurate measurement of sulfur content has many benefits. The
products and services of the measurement industry (e.g., testing laboratories and analytical
equipment manufacturers) are improved. Moreover, the tendency to overdesign products to allow
for measurement uncertainty and thereby assure compliance with regulations is significantly
reduced, significantly reducing product cost. There are fewer disputes between sellers and
purchasers (e.g. coal companies and electric utilities) of fossil fuels and between consumers of fuel
and measuring/monitoring device manufacturers.
Although many industries use measurements of sulfur content, the analysis focused on sectors
that are the primary users of SRMs for their in-house sulfur measurement activities. Thirty eight
interviews were conducted with technical experts at 24 companies, and secondary sources were
used to complement the data gathered in the interviews. Interviews were conducted with
companies in the sulfur measurement industry—instrument manufacturers, reference materials
manufacturers, independent testing laboratories; the fossil fuel extraction, processing, and
transportation industry—coal companies, petroleum companies; and the fossil fuel combustion
industry—electricity generation firms, steel companies, regulatory agencies.
The analysis quantifies part of the economic benefits from NIST’s sulfur SRMs. Quantified
benefits include improvement in product quality, production efficiency, reductions in transaction
costs, and reduction in sulfur dioxide emissions to the environment. Not quantified, but
qualitatively described are the benefits of NIST SRMs for research and development programs.
The counterfactual scenario is that, in the absence of NIST, the level of uncertainty associated with
measuring sulfur in fossil fuels would today be similar to what it was prior to the introduction of
IDMS in the early 1980s. Based on this counterfactual assumption, the impact of NIST SRMs is
stated in terms of a change in the standard error of American Society for Testing and Materials
(ASTM) sulfur measurement tests. Using the ratio of the old standard error to the new standard
error and taking into account the percentage of measurement error associated with sampling, the
factor by which NIST SRMs improved measurement accuracy was estimated and used to establish
economic impacts. Thus, the counterfactual here corresponds to the assumption—confirmed by
interviews with the manufacturers of certified reference materials—that because of the complexity
of the IDMS method and the skill and equipment required to apply it, it is unlikely that any other
laboratories would have pursued the method in the absence of NIST.
The analysis assumes that the impact associated with NIST’s SRMs developed using the IDMS
method began in 1986, when NIST began selling the SRMs, and would continue at least through
2003. Not all benefit categories realized benefits beginning in 1986. For example, the reduction in
measurement uncertainty from using the SRMs first affected petroleum production in the mid-
1990s when California began regulating the sulfur content of gasoline and diesel fuels.
The key benefits hypothesized were: (1) SRMs improve the quality of the products of the
sulfur measurement industry. This quality improvement leads to a shift in demand and an increase
in customers’ willingness to pay for these products and services. (2) SRMs reduce the cost of R&D
in the sulfur measurement industry and in the fuel industry by supporting accurate, reliable sulfur

56
measurement. (3) SRMs reduce the cost of fossil fuel transactions because measurements are
accepted as reliable and fewer transactions are disputed because of measurement error. (4) SRMs
improve the efficiency of a number of production operations, including fuel blending,
desulfurization, and equipment operations because the reliability of the measurement allows users
to reduce the “buffer” (overdesign) they employ to ensure compliance with technical specifications.
(5) SRMs reduce the fines paid by industry due to environmental noncompliance because industry
and the regulatory community have accurate and reliable sulfur content information. (6) SRMs
reduce the total amount of sulfur entering the environment by providing industry greater control
over the sulfur content of its fuels and by allowing compliance officials greater authority in
enforcing the regulation limits.
Metrics are calculated from the time series of benefits to society from NIST SRMs and the time
series of costs—NIST’s expenditures. The time series begins in 1984 when the NIST Analytical
Chemistry Division received an internal standards development award to support research in new
methods to certify SRMs. Benefits are first realized in 1986 because this was the first year the
IDMS method was used in certifying sulfur SRMs and costs are projected through 2003 because
industry representatives indicated that the IDMS method would remain the state-of-the-art
technology in the near future. Of the hypotheses about benefits, the analysis was able to quantify
partially the benefits for four hypotheses—improved product quality, reduced transactions costs,
improved production efficiency, and benefits to the environment. Reduced R&D costs were
discussed qualitatively but not quantified, and the change in regulatory penalties was a transfer and
not a net benefit to society. In addition, industries’ avoided expenditures on certified reference
materials are included in the total benefit estimates. The majority of the economic benefits
quantified were associated with using SRMs in the production processes in petroleum refineries
and in coal companies. Improved sulfur measurement allows these industries to reduce the amount
of desulfurization they conduct on fuels and thereby reduced costs substantially.
(7) “Economic Impact Assessment: NIST-EEEL: Laser and Fiberoptic Power and
Energy Calibration Services,” Planning Report 00-3
NIST's program in laser power and energy measurement provides standards and calibrations
services that make laser power/energy measurements practical and efficient for a number of
industries. Four case studies are used to examine economic outcomes associated with selected
outputs from NIST's program.
First, an overall evaluation of NIST's annual laser power primary standards and calibration
services was developed through interviews with a sample of firms that obtain calibrations directly
from NIST. The services are used for measurement of power or energy of laser light sources for a
broad range of industrial applications, for measuring power emerging from optical fibers used in
fiberoptic communications, and for measuring the frequency response of high-speed detectors.

57
Collectively, these infratechnologies enable greater information carrying capacity in high
performance communications systems at a lower price.
In the counterfactual absence of NIST's outputs, the survey respondents would have incurred
additional costs for verifying measurement accuracy for their customers, calibrating and
maintaining in-house measurement standards, and obtaining calibration services from foreign
laboratories to enable U.S. exports and support general production. The benefits of NIST’s
services—the foregoing costs avoided—were estimated for 1999 and compared with NIST’s costs
of providing the services in 1999 to obtain an annual benefit-to-cost ratio. The evaluation metric
was conservative because even if they incurred the estimated costs to provide alternative standards
and calibration services in the counterfactual absence of NIST’s services, U.S. firms reported the
quality of the alternative approaches would not equal the quality of NIST’s standards and services.
As a result they would lose sales and market share to foreign firms, and the cost of such losses was
not quantified. Also biasing downward the evaluation metric were unmeasured benefits of avoided
transactions costs (of verifying the accuracy of measurements) downstream (including end-use
applications) from the primary users (laser instrument suppliers and their customers) of NIST’s
laser power standards and calibration services.
Second, an evaluation of NIST’s measurement technology for photolithography lasers
operating with the 248 nanometer (nm) wavelength used in the then current generation of
projection photolithography, the key process for the progressive miniaturization of semiconductor
integrated circuits (ICs). Benefits and costs over the period from 1990 to 2009 for NIST’s R&D,
standards and calibration services for 248 nm excimer lasers were developed. The NIST standards
and services facilitated the economic fabrication of smaller IC line widths allowing continued and
rapid development of the electronics industry. Interviews with the relevant power meter and laser
suppliers documented the additional costs for them and their downstream customers if NIST’s
investments had not been made. In the counterfactual absence of NIST’s outputs, the survey
respondents would have incurred additional transactions costs to verify measurement accuracy for
customers, costs for purchase, installation, operation, and maintenance of extra equipment and for
additional scientists and engineers to establish in-house proprietary metrology standards, and
technical and administrative costs to work with foreign laboratories rather than NIST. Evaluation
metrics were conservative because of two sources of downward bias. Not quantified were the
benefits of reduced efforts (because of confidence in the accuracy of detector readings calibrated to
NIST’s standards as a requirement for purchase) for semiconductor manufacturers in monitoring
photolithography process problems. Another source of downward bias in the metrics was that the
time series of NIST’s investment costs included costs shared by metrology standards and services
other than the 248 nm metrology for which benefits were measured.
Third, NIST develops and maintains standards and provides calibration services for specialized
optical sources and detectors used in high performance communications systems. Significant
technical progress in the communications industry has been associated with increasing the
bandwidth of optical fibers and the associated laser transmitters and receivers (detectors). Systems

58
with greater bandwidth increase the volume of telephone calls, cable television stations, and
computer data content (graphics/audio/video) that can be carried over a single fiberoptic
communications link. NIST supports industry with methods for characterizing the increasing
frequency response of high-speed detectors that are essential to enabling higher bandwidth systems.
Advances in high-speed detector measurement technology have contributed to the recent expansion
in many areas of the telecommunications industry, including high-speed internet access, optical
fiber telephone landline systems, cable TV, local area network, antenna remoting applications with
fiberoptic cables for satellite telephone and micro-cellular systems, and high bandwidth secure
military communications links.
A series of interviews with the leading firm’s key expert in metrology for fiberoptic high-speed
frequency response provided that firm’s view of the impact of NIST's investments. Consultation
with other industry experts allowed estimation of industry-wide benefits from NIST’s investments
in high-speed metrology. The detailed interviews revealed that in the absence of NIST’s
investments for high-speed metrology, industry would have incurred additional costs in R&D and
equipment in the mid-1990s to establish the state-of-the art metrology, engineering effort (from
extra technical staff for participation at standards conferences and publication of papers describing
the proprietary standards) to establish measurement technology standards, continuous effort to
maintain the private investments in high-speed metrology, and transaction costs to verify the
accuracy of measurement traceability because customers would have less trust in calibrations
obtained through a private, non-neutral source of primary standards. Evaluation metrics were
developed from the 1992-2009 time series of benefits (largely R&D costs avoided by the direct
users of NIST’s high-speed metrology services as well as transactions costs savings for the direct
users and their customers) and the investment costs for NIST’s high-speed metrology program.
The metrics are conservative estimates of NIST’s impact on U.S. industry with the key source of
downward bias being that the counterfactual investments by industry would have been unable to
replace completely the measurement technology and services provided by NIST. Industry attempts
to replicate the NIST R&D and metrology would have fallen short of complete substitution because
the neutrality of a U.S. national standards organization would be lost and the metrology would be
less robust. Interviews identified products for which sales would have been less in the
counterfactual scenario, but not measured were the benefits of avoiding those sales losses and more
generally of losing the rapid expansion in the telecommunications industry supported by NIST’s
high-speed metrology services because of a shortfall in the quality of the counterfactual proprietary
measurement technology. Moreover, additional transaction costs to verify the accuracy of
measurements in more downstream tiers of the telecommunications industry in the absence of
NIST were not quantified, and therefore are another source of downward bias in the estimate of
benefits.
Fourth, laser power measurement supporting the medical community was examined. Lasers
have been used in medicine for a variety of diagnostic and therapeutic applications. Precise
targeting of laser power and accurate dosimetry provides many benefits for the medical industry,
59
and the measurement infrastructure provided by NIST (national standards and calibration services)
provides a consistent frame of reference for the chain of firms supplying medical laser systems and
the users of these systems. Having agreement on this measurement infrastructure reduces disputes
and transaction costs among all affected parties, and reduces the cost of regulatory compliance for
traceability to absolute standards at NIST. Suppliers of power and energy meters believe that new
investments in metrology at NIST could support emerging laser technologies that have evolved
beyond those served by the capabilities of the current infrastructure. Although a quantitative
analysis was not provided in this fourth part of the report, the qualitative evidence documented
industry’s belief that new investments by NIST and industry could make valuable improvements in
the infrastructure for laser metrology that supports the medical supply chain.
(8) “The Economic Impacts of NIST’s Cholesterol Standards Program,” Planning
Report 00-4
The purpose of this analysis is to assess the economic impacts of cholesterol-related standard
reference materials (SRMs) from NIST's Clinical Standards Program. A national quality control
system, the National Reference System for Clinical Laboratories (NRSCL), has evolved within the
U.S. medical community and its supporting industries to assure accurate measurement of
cholesterol and other medically significant constituents of blood. NIST has played an important
part in that system by developing basic measurement methods and standards as well as providing
highly accurate reference materials to assure the accuracy of cholesterol tests.
The cornerstone of cholesterol measurement traceability is NIST’s definitive method for
cholesterol determinations—Isotope Dilution Mass Spectrometry (IDMS). The IDMS system at
NIST was significantly upgraded in 1986, and the analysis focuses on the benefits and costs of that
upgraded system for providing cholesterol SRMs. Typically, IDMS is labor intensive, expensive,
and requires highly specialized instrumentation and analysis. NIST’s SRMs and the definitive
method constitute the reference point of a system of traceability that runs from NIST to cholesterol
system manufacturers and public organizations, like the Centers for Disease Control and
Prevention (CDC), and College of American Pathologists (CAP), and ultimately to the hospitals,
physician offices, and independent laboratories where cholesterol tests are actually performed.
The counterfactual scenario that is used to develop the estimates of benefits assumes that in the
absence of NIST’s cholesterol SRMs the private sector would not have attempted to replace
NIST’s highly accurate measurement reference materials. The report states that this particular
counterfactual scenario was chosen because it yielded more conservative estimates of the benefits
from the program. One could make the argument that NIST was asked to develop cholesterol
SRMs because the industry (medical testing labs) was under pressure to improve the accuracy of
cholesterol measurement; and therefore, the development of accurate SRMs had to happen. The
problem was how to do it most efficiently. The measurement technologies developed by NIST are

60
highly accurate, complex, and expensive compared to the measurement technologies typically used
in high-volume cholesterol testing laboratories. Assuring access to the most accurate measurement
technologies across the supply chain—from measurement system manufacturers, to clinical
laboratories, to medical service providers—is essential for controlling the disparities in
measurement accuracy among laboratories. In the absence of public sector efforts to make these
measurement technologies widely available, the analysis examines the counterfactual scenario
where the private sector would not have undertaken a similar investment. Thus, the counterfactual
scenario assumes that the supply chain would have operated without a system of measurements
traceable to a standard of high accuracy such as provided with NIST’s SRMs. The analysis
considered the alternative counterfactual scenario in which CDC would replicate the functions
currently performed by NIST, but concluded that the estimated benefits would be more
conservative (because developing the highly accurate measurement technology was far less costly
for NIST) using instead the counterfactual that without NIST, NIST’s cholesterol SRM functions
would not be replicated.
The economic benefits of NIST’s Cholesterol Standards Program are experienced at four levels
in the supply chain that ultimately delivers medical services to the consumer. First, because of
availability of highly accurate cholesterol reference materials, manufacturers of cholesterol
measurement systems (including measurement instruments and the complementary diagnostic
chemicals used with them) experience lower production costs than they would if SRMs were not
available from NIST. Second, in their interactions with measurement system users (clinical
laboratories) concerning the quality and accuracy of their products, measurement system
manufacturers face significantly lower transactions costs than they would if the accuracy of their
products was not traceable to nationally-recognized standards. Third, clinical laboratories
experience lower cost in maintaining their quality control and assurance systems. Finally,
consumers of medical services receive higher quality medical services in the form of more accurate
test results, because inaccurate cholesterol tests can lead to unnecessary medical expenses and
health risks.
Electronic mail surveys with follow-up phone calls and electronic mail correspondence was
used to gather the data about benefits. Of the 20 identified, 7 manufacturers of cholesterol
measurement instruments and complementary diagnostic chemicals provided responses to the
survey. Three large national independent clinical laboratories, each controlling scores of
laboratories across the U.S. and representing a significant fraction of cholesterol tests by
independent laboratories, provided responses to a survey. Several hospital laboratory directors also
responded to a survey, but because they were not a representative sample, their responses were not
used in computing the economic impact metrics.
The measured benefits from NIST’s cholesterol SRMs were based on the survey responses
about costs avoided because of the use of the SRMs. The reported cost avoidance is of two kinds:
production costs and transaction costs. In the hypothetical absence of NIST, manufacturers and
clinical laboratories would incur additional operating costs in assigning, or validating, cholesterol

61
concentration values to secondary or working calibration standards. Dispute resolution costs
(transaction costs), born largely, but not solely, by the manufacturers when the measurement
processes in clinical laboratory settings get out of control, would be higher if manufacturers could
not trace their value assignments to NIST. The sum of these reported costs avoided are interpreted
as the benefits to society of NIST’s investment in the development and maintenance of cholesterol
SRMs and the definitive method that assures their accuracy.
This report assessed the economic impacts of NIST’s cholesterol SRMs at three of four levels
in the medical services supply chain: in the development of cholesterol measurement system
products, in the clinical laboratories’ cost of quality, and in the transactions and communications
between manufacturers and clinical labs. The respondents provided estimates of costs avoided
because of NIST’s SRMs for one year, 1999. The costs avoided were for internal production and
quality control costs and for transactions costs. Those estimated costs avoided in 1999 were then
used for every preceding year (adjusting the 1999 nominal amount for inflation so that in constant
dollar terms benefits were the same in each year as in 1999) back through 1988, the year of the first
sale of an SRM series certified by means of the upgraded IDMS system. Using the 1999 benefits
for the preceding years was considered a conservative estimate because the respondents’ direct use
of NIST SRMs declined over those years as CDC reference materials traceable to NIST standards
were substituted for the purchase of NIST SRMs. Metrics of economic impact compared the time
series of constant dollar benefits from 1988 through 1999 with the time series for NIST’s costs,
associated with the development and distribution of the cholesterol SRMs beginning in 1986 when
NIST upgraded the IDSM system, and including supporting costs incurred by CAP, through 1999.
The metrics are conservative for several reasons. First, not all types of benefits realized
throughout the supply chain were quantified. A second source of downward bias in measured
benefits is that the timeframe for the analysis (1986-1999) covers only a part of NIST’s cholesterol
SRM program’s life, and benefits for respondents have declined relative to benefits realized earlier
in the program’s history when more users purchased SRMs directly rather than relying on the
NIST-traceable CDC program. There is a lesson here for the methodology of economic impact
analysis. An analysis can be done too late; in contrast to the thermocouple analysis, the analysis of
NIST’s cholesterol SRM program was done too late because as a practical matter it is not typically
possible to gather the quantitative information about benefits in a period about which the
institutional memory of respondents—even if appropriate respondents can be found—has faded.
A third source of downward bias for the benefits was that the respondents’ estimates were not
extrapolated to reflect benefits to their industry as a whole because the industry’s structure was not
well enough understood to justify such a procedure.

62
(9) “The Economic Impacts of NIST’s Data Encryption Standard (DES) Program,”
Planning Report 01-2
This report examines the evolution and economic significance of NIST’s Data Encryption Standard
(DES) Program. DES was developed by NIST for protecting sensitive, unclassified government
information and has become a standard for much of industry in the United States and across the
world.
In 1972, NIST launched a computer security program under the auspices of its Institute for
Computer Sciences and Technology (ICST), a precursor of today’s Information Technology
Laboratory (ITL), to develop a single, standard cryptographic algorithm that could be tested and
certified. This encryption algorithm would be readily available, support cryptographic equipment
interoperability, and be less costly to implement than traditional approaches to computer security.
Following its collaborative assessment with the National Security Agency (NSA), NIST
adopted the Data Encryption Standard (DES) as a federal standard on November 23, 1976, and
authorized it for securing all sensitive, unclassified government data from unauthorized access and
for encrypting information transferred through communications. The official description of the
standard, Federal Information Processing Standard Publication 46 (FIPS PUB 46), “Data
Encryption Standard,” was published on January 15, 1977 and became effective six months later.
There have been subsequent developments and editions, but only the original FIPS PUB 46 is
evaluated in this report.
The original motivation for DES was to provide an encryption algorithm for use in protecting
sensitive, unclassified federal information from unauthorized disclosure or undetected modification
during transmission or while in storage. However, the standard could also be implemented and
used by those outside the Federal government. In fact, its major impact was outside government in
the financial services industry. NIST also developed and implemented conformance tests for DES
users to help assure correct functioning of their DES implementations. DES is based on work of the
International Business Machines Corp. (IBM) which agreed to make this technology available
publicly on a royalty-free basis. DES has also been adopted as an American National Standard, a
commercial version that has benefited financial services and other U.S. industries. DES has been
built into a wide array of hardware and software products and has been used as a security building
block in ways not envisioned at the time of its initial issuance.
The initial publication of DES and the activities leading up to it involved a significant
economic contribution by developing a consensus around a single standard, and subsequently
educating federal and potential commercial users about the standard. This, in turn, contributed to
the growth and stability of the market for cryptographic products. Through NIST participation in
voluntary standards-making activities, DES became the basis for numerous other standards used by
government and industry. These included international standards, broadening the reach of DES
and its acceptance in domestic and international markets until there were a variety of DES-based
devices, interoperable equipment, and software products available worldwide. Evidence of DES’

63
acceptance can be seen not only through the number of standards based on it, but also through
increased cryptographic patenting activity. In fact, a new subclass of the U.S. patent system was
created specifically for DES applications. New patents in this class have increased in number since
the creation of this subclass—reflecting a growth in products incorporating DES.
The supply chain extends from NIST to the users of DES technology in three downstream
stages—the manufacturers of cryptographic products that incorporate DES (encryption hardware
and software manufacturers) and the industry organizations that support them, laboratories
providing conformance testing services, and the broad community of industrial users of
cryptographic products employing DES and the industry associations that support them. The
industrial users include most prominently the R&D intensive industries of pharmaceuticals, oil
exploration, automotive, and aerospace industries, the financial industry (bank-to-bank, ATM, and
SEC transactions), and E-commerce (networks and transportation).
As a result of NIST’s efforts, the market for encryption hardware and software expanded,
developers of these products faced lower technical and market risks, and users of encryption
systems enjoyed operational efficiencies from their enhanced ability to substitute secure electronic
transactions for more costly paper-based and face-to-face transactions.
The counterfactual scenario for this analysis assumes industry would have developed a
substitute with a lag and that during the lag time after DES was released in 1977 and before
industry had developed the substitute by 1983 in the counterfactual scenario there would not have
been the benefits from the DES standard. So the counterfactual approach would estimate as
benefits the shortfall in performance during the lag time and also the costs for industry to develop
the alternative. However, there was no survey because attempts to survey encryption hardware and
software manufacturers were unsuccessful. Therefore, neither set of benefits is fully estimated.
Estimation of the costs to develop the alternative is not attempted, and the benefits (because of
costs avoided of the shortfall in performance during the lag time) are estimated by examining just a
part of the supply chain’s benefits. Thus, the benefits for the supply chain during the assumed lag
period are not estimated except for one aspect of one part of one of the end users in the supply
chain.
Only benefits in the form of operational efficiencies of major private-sector users of encryption
technology could be estimated. The benefit estimates were solely from the retail banking segment
of the financial industry. Unlike most economic impact assessments conducted by NIST, which
rely on primary interview-based data from respondents in the affected industries, these impact
estimates were developed from published data on the operating costs of U.S. banks. There is a
clear methodology lesson for the practice of economic impact analyses; possibilities for using
published data (in conjunction with or in place of gathering new survey data) should be considered
and used when appropriate information is available. Information published by the Federal Reserve
Bank was developed and interpreted to estimate cost-avoidance benefits. These benefits resulted
from banks’ enhanced capability to utilize electronic transactions rather than paper transactions
from 1977 through 1982 when, in the counterfactual scenario, DES was not available and industry
64
would not yet have developed a substitute.
Thus, none of the upstream beneficiaries are included in the analysis of benefits for the supply
chain, and for the downstream beneficiaries, only banking is used. Also, the only banking activity
used was demand deposit accounts. Although the necessary data for the period for which benefits
were to be measured were not available for those demand deposit accounts, the benefits for demand
deposit accounts from 1977 to 1982 were constructed from an estimate of benefits for another
period when the data were available to develop an estimate of the reduction in costs from electronic
rather than paper transactions for FDIC-insured banks during the years in which DES would not
have been available.
NIST began working with the National Security Agency (NSA) in 1973 to develop a
government-wide standard for encrypting unclassified government information. Costs for the
combined efforts of NIST and NSA to provide DES are measured over the time from 1973 through
1982 when the benefits from DES as embodied in FIPS PUB 46 are conservatively stopped, given
that newer versions of the standard became available subsequently. Benefits are estimated from
1977 through 1982, during the lag period before industry would have replaced DES.
The estimated benefits are on the whole conservative because so many benefits that were
identified in the analysis are not measured quantitatively. For what was not measured, consider
that benefits from DES were realized throughout the supply chain of beneficiaries. Only for
finance and only for banking in finance and only for demand deposits in FDIC-insured banks are
benefits estimated.
(10) “Economic Evaluation of the Baldrige National Quality Program,” Planning
Report 01-3
The Baldrige National Quality Program at NIST is a national quality award program established by
Congress in the Malcolm Baldrige National Quality Improvement Act of 1987 (P.L. 100-107) to
help improve quality and productivity of U.S. firms in the wake of the productivity slowdown and
loss of international competitiveness during the preceding two decades. Congress established the
Malcolm Baldrige National Quality Award to stimulate improvements in quality and productivity,
to recognize the achievements of U.S. organizations and provide examples for others, to provide
guidelines and criteria to organizations to evaluate their efforts to improve quality, and provide
guidance for how to manage for high quality with information about the award winning
organizations. Without the information provided by the Program, organizations would have had to
incur extra costs to perform assessments of their quality management and improve their practices.
Organizational benefit and private assessment-cost data were collected by mail survey
administered by the Baldrige National Program Office. The American Society for Quality (ASQ)
distributed the survey to its 875 U.S. organizational members accounting for 8.8 percent by sales of
the 50 represented industrial sectors. The response to the survey was low (7.43% of the members

65
responded), and projecting the answers of the respondents to the ASQ as a whole and then to the
economy required a series of estimations of models of response to the survey, for the probability
that that a member would use the Baldrige Criteria to improve its quality performance, and for the
net present value of doing such an assessment using the Baldrige Criteria. The organizational
benefit and private assessment-cost data from the respondents were extrapolated first to the ASQ
U.S. organizational membership as a whole, and then to the U.S. economy as a whole using a
conservative method that used lower bounds for the projected benefits. There is a methodological
lesson in the low response rate for the survey in this analysis—namely, the ASQ sent the survey to
its members, but the study team did not have access to the e-mail list of the recipients of the survey.
The predictable result was the low response rate because although the ASQ could follow up with a
mass e-mail to its members, the opportunity for the study team to implore each member to
participate was absent.
Benefits to the economy from the Program are systematically quantified in terms of the cost
savings organizations realized by having the Baldrige Criteria to follow as opposed to
organizations, on their own, developing and testing comparable criteria. Each respondent
estimated the costs it would have had to incur to achieve the same level of expertise (as it had at the
time of the survey) in performance management/quality improvement in the absence of the
National Quality Program. Thus, each estimated the costs avoided per year because of the Program
and also provided the number of previous years in which such costs would have been incurred.
The benefits from the Program were the costs avoided because the Program provided information
and assistance about performance management/quality improvement assessments. Without the
Program, there would have been the need to incur expenditures to develop and acquire such
knowledge and assistance from other sources. From the responses was formulated, for each
respondent, a time series of real benefits received (i.e., the costs avoided reported in constant 2000
dollars) associated with the Baldrige National Quality Program. Regarding costs to compare to this
time series of benefits, each respondent provided a time series of real (in constant 2000 dollars)
costs incurred to make the Baldrige Criteria operational within its organization.
The net present value of each member’s benefits is calculated using these survey data by first
calculating the present value (referenced to the earlier of the first year of benefits or the first year of
costs, hereafter the base year) of each member’s benefits and each member’s costs. Thus, net
present value is the difference between the present value of benefits less the present value of costs,
both referenced to the base year. Each member’s net present value of benefits is then re-referenced
to year 2000. Responses about benefits and costs from those organizations answering the survey
were used to estimate the non-respondents’ likely responses and their net present value of benefits
referenced to year 2000.
Cost data describing the combination of public and private funds used to administer the
Program were provided by the Baldrige National Quality Program Office at NIST. In addition to
the public funding through NIST, there are private sources of funds The Program was initially
endowed by private industry with $10 million. A foundation was established to manage these funds

66
and to allocate the interest earned to the Program for award ceremonies, publication costs, and
partial training and travel costs for examiners whose companies would not pay for such expenses.
Industry also supports the Program through volunteer examiners during the application and
evaluation process. Baldrige National Quality Program operating costs were measured from the
incipiency of the program in 1988 through 2000, the year of the analysis. Total operating costs
included NIST allocations to the Program, Foundation allocations, company reimbursed examiner
expenses, and opportunity cost of examiner time.
With all benefits and costs measured in constant year-2000 dollars, the benefits and costs are
all brought forward to year 2000 and then compared. Thus, the relevant evaluation metric is a
benefit-to-cost ratio, with all benefits and all costs referenced to year 2000. The evaluation metric
is conservative because each step used lower-bound estimates of benefits.
(11) “The Economic Impact of Role-Based Access Control,” Planning Report 02-1
Role-based access control (RBAC) is a technology that assigns access to an organization’s
information based on an individual’s need for the information, with need being a function of the
individual’s role within the organization. RBAC decreases the cost of network administration and
improves network security. This analysis quantifies the benefits of RBAC relative to alternative
access control systems and determines the proportion of those benefits that resulted because of the
NIST/Information Technology Laboratory (ITL) RBAC project’s contributions to the development
and adoption of RBAC.
NIST began working on RBAC in the early 1990s and published the first comprehensive
RBAC model in 1992. Over the next decade, NIST’s RBAC project contributed significantly to
the development and adoption of RBAC through publications and patents that have been widely
cited and provided the technology base for many of the commercial products introduced by
software vendors, sponsoring conferences and workshops and outreach projects, and supplying
infrastructure tools to industry. NIST’s contributions reduced the cost of R&D for private
companies developing network security products based on RBAC. NIST developed generic
technologies that provide the technology base for RBAC commercial applications, and it developed
infratechnologies that support implementation and interoperability across different systems. NIST
has also developed specific tools for implementing RBAC for the World Wide Web, demonstrated
the use of RBAC for corporate intranets and for the health care industry, and implemented RBAC
on a NSA secure operating system. NIST disseminates information about RBAC and has proposed
a standard for RBAC to serve as a foundation for product development, evaluation, and
procurement specifications. NIST’s infratechnology tools lower the risk and cost of adoption and
provide the basis for the new and emerging market for RBAC-enabled products.
The supply chain using NIST’s RBAC infratechnology services includes academics and
research organizations developing RBAC, software developers offering RBAC-enabled products,

67
and the end-users of RBAC. The end users of RBAC include organizations in sectors using a
computer network to limit user access to information. The analysis concludes that the highest
RBAC adoption rates are likely to be in banking, health care, government agencies,
telecommunications, computer applications security, and the military.
To estimate the net benefits to RBAC and NIST’s contributions to realizing these net benefits,
data collection activities focused on software developers and the end users that integrate RBAC
products into their business operations. Primary data collection methods included telephone
interviews with 8 software developers that were among the most active in the RBAC field and
additional brief interviews with other software developers helped developed qualitative
understanding. End users also were surveyed. There was an internet survey of 9,530 of the
subscribers of Information Security Magazine, a leading trade publication for information and
systems security administrators. The e-mail message targeted subscribers responsible for network
and systems security administration; 92 individual companies responded and completed some
portion of the survey. Telephone interviews were also conducted with 1 major telecommunications
firm and 1 large commercial bank and a case study of a multiproduct insurance company was
developed. Secondary data sources included the professional literature and economic surveys
conducted by the federal government and research organizations.
NIST’s papers and patents, conferences and workshops, and programs and tools affected all
levels of the RBAC supply chain from the basic research of academics and other research
organizations—increasing standardization and accelerating model development—to software
developers—lowering their costs of applied research and accelerating product development—to
end users, lowering their implementation costs and accelerating adoption.
To estimate the economic impacts of NIST/ITL’s RBAC project, the analysis relied on the
surveys to develop a time series of benefits and costs for the three key segments of the RBAC
supply chain. The time series captures NIST’s expenditures, software developers’ R&D
expenditures with and without NIST, and industry users’ benefits and adoption costs with and
without NIST. The potential economic impact of NIST/ITL’s RBAC project resulted from changes
in R&D costs, changes in implementation costs, and changes in the number of employees being
managed by RBAC systems over time. The surveys and interviews showed that the activities of
the NIST RBAC project accelerated the development and adoption of RBAC and lowered R&D
and implementation costs.
The report develops the time series of RBAC benefits above and beyond the benefits that
would have been available with alternative access control technologies. It then develops the impact
that NIST had on the cost and time of the development and adoption of RBAC and RBAC-enabled
products and services. Thus, to estimate the return from the NIST/ITL RBAC project, the report
first develops a baseline time series of the benefits and costs of RBAC. Second, that baseline time
series that includes NIST’s contributions is shifted to reflect the counterfactual scenario without
NIST’s impact on the development and adoption of RBAC. Third, the time series for the benefits
of NIST’s contributions is estimated as the change for each year in the net benefits of RBAC with

68
the NIST project and without it. The resulting time series of the benefits from NIST’s
contributions begins in 1996 and is projected through 2006 when the growth of employees using
RBAC systems was estimated to have become substantial. These benefits from NIST’s RBAC
contributions are weighed against the time series of NIST’s costs that begin in 1992.
The report observes that the estimated economic impact for NIST’s RBAC project should be
considered a conservative lower bound estimate of the benefits and rate of return on NIST’s
investment because the quantified benefits do not include the potential security benefits from using
RBAC. A methodological lesson for the timing of economic impact analyses is that an analysis
can be premature if there has not yet been sufficient market penetration of the infratechnology
being evaluated. Most companies indicated that RBAC would reduce the frequency and severity of
security violations, but the benefits from improved security could not be quantified because the
information is highly sensitive and companies would not release it.
(12) “The Economic Impact of the Gas-Mixture NIST-Traceable Reference
Materials Program,” Planning Report 02-4
The gas mixture NIST-Traceable Reference Materials (NTRM) program was jointly created by the
National Institute of Standards and Technology (NIST), the U.S. Environmental Protection Agency
(EPA) and specialty gas companies (SGCs) to increase the availability of NIST-certified gas-
mixture reference materials. EPA regulations mandated traceability to NIST standards of
measurements of pollutants in gases and thereby created an unprecedented demand on NIST’s
laboratory to produce gas mixtures to support end users’ needs for traceability. Under the program,
SGCs manufacture gas-mixture standard reference material (SRM) equivalents under NIST’s
technical specifications and submit these gas mixtures to NIST for certification. Once certified, the
NTRMs are the functional equivalent of SRMs and are used to assay the large volume of secondary
reference standards demanded by consumers to meet their compliance obligations.
Since the program’s inception in 1992, it has become an integral component of the high-
accuracy reference gas supply chain. Environmental regulation has become increasingly
sophisticated over time and often requires facilities and monitoring organizations to supply real-
time information on the pollutants that they are emitting to the environment. To meet these
regulations’ data acquisition and accuracy needs, regulated establishments are required to calibrate
pollution monitoring equipment with reference standards traceable to NIST.
The analysis measures the economic impacts of the NTRM program relative to a counterfactual
scenario that describes the reference material supply chain in the absence of the NTRM program.
The counterfactual scenario specifies the tactical changes that SGCs and users of reference
materials (the end users) would likely need to make if NTRMs were not available to produce
NIST-Traceable Gases (NTGs).
With the NTRM program, either SRMs or NTRMs can be used to certify directly traceable

69
reference gases called gas manufacturers’ intermediate standards (GMISs). For the counterfactual
scenario, the analysis assumes that in the absence of the NTRM program, the traceability to NIST
mandated by EPA would require SGCs to increase reliance on intermediate standards because of
NIST’s limited capacity to supply SRMs. GMISs are used in the production of indirectly traceable
gases that have higher uncertainty than directly traceable gases do because of the additional step in
their traceability chain. In the absence of NTRMs, SRMs would be the only materials certified by
and traceable to NIST. Directly traceable gases would need to be certified via an SRM. In the
counterfactual scenario, with fewer SRMs and the equivalent NTRMs, more GMISs would be used
and therefore industry would be using more indirectly traceable gases that would have a longer
traceability chain to reach a NIST SRM. With the NTRM program, the majority of calibration
gases are directly traceable to NIST, but under the counterfactual, most of the reference gases used
by industry would be indirectly traceable.
The counterfactual situation would entail higher costs for SGCs and their customers. SGCs’
calibration gas production costs would increase because of the reduced supply of SRMs and the
equivalent NTRMs and the need to produce large numbers of GMISs to increase the certification
capacity of each SRM. Some end users would need to use indirectly traceable gases; they would
incur higher operations and maintenance expenses because of their lowered confidence in their
calibration gas that would now have greater measurement uncertainty. Because of the uncertainty
in their emissions content, these end users would need to obtain more emissions allowances to
ensure they avoid regulatory penalties. The social benefits of the NTRM program are the
elimination of the foregoing counterfactual costs.
The NIST-traceable gas-mixture supply chain includes NIST, the SGCs, and end users that fall
into four major groups—electric utilities, petrochemical firms, transportation equipment firms, and
government agencies and independent organizations. To estimate the benefits of the NTRM
program, the analysis collected primary and secondary data throughout the gas-mixture reference
material supply chain. All the major parties involved in the supply chain participated in the
analysis, including NIST, SGCs, and end users such as electric utilities and automotive emissions
testers. Seven of the nine SGCs that regularly submit NTRM batches to NIST for certification and
testing participated in the survey. The seven companies represented 95 percent of NTRM
production in 2000.
To evaluate how the counterfactual scenario would affect end users of NTGs, interviews were
conducted with four electric utilities and four regulatory agencies about how an increase in the
analytical uncertainty of the reference gases they consume would affect their operations and costs.
The electric utilities were used to represent the continuous emissions monitoring systems
calibration market, and the regulatory agencies provided information for the automotive emissions
testing market. SGCs identified these two market segments as the ones that benefited the most from
the NTRM program.
In the counterfactual scenario without NIST’s NTRM program, NIST would need to increase
production of SRMs and would have had increased production costs. SGCs would have an

70
increased use of SRMs to replace NTRMs and changes in their production process to stretch the
supply of SRMs resulting in increased production cost. For end users, the decreased supply of
directly traceable gases leads to increased use of indirectly traceable gases and an increase in
reference gases’ uncertainty. As a result, the end users have increased labor and material cost
associated with calibration activities and also they must retire additional emissions allowances.
EPA would experience delays in new rule making because of the increased time required to
develop new reference materials and the attainment of social benefits from new regulations would
be postponed.
NIST incurred program development costs beginning in 1990, and the NTRM program began
operation in 1992. The time series of costs for the NTRM program begins in 1990 and includes
costs of both NIST, where the initial program development costs were incurred in the early 1990s,
and industry where ongoing certification costs are incurred by SGCs.
The time series of benefits from the program begins in 1993 and includes the increased labor
and capital expenditures that SGCs and reference material users would incur in the absence of the
NTRM program. Both series—costs and benefits—are observed through 2007. The time series
was extended into the future because the benefits of the NTRM program were projected to increase
significantly as participation in emission trading programs increased and credits were retired under
advanced phases of cap and trade programs. Reference material users were the primary
beneficiaries of the NTRM program, accounting for somewhat more than 90 percent of the benefits
(representing their avoided operations and maintenance costs and emissions credit expenditures.
The analysis observes that the evaluation metrics are conservative because quantified benefits
may not capture fully the effects of end users’ loss of confidence in their measurements when
forced to use indirectly traceable NTGs in the counterfactual scenario. Benefits were not
quantified for end users other than those performing continuous emissions monitoring and
automotive emissions tests. These end users for whom benefits were not measured include ambient
air quality monitoring organizations, petrochemical facilities, and independent testing organizations
and laboratories, including universities.
(13) “Economic Impact Assessment of the International Standard for the Exchange
of Project Model Data (STEP) in Transportation Equipment Industries,” Planning
Report 02-5
The Standard for Exchange of Product model data (STEP) is an international standard designed to
address interoperability problems encountered in the exchange of digital product information.
STEP is a suite of standards enabling manufacturing companies to exchange digital representations
of engineering and manufacturing data.
Beginning in the mid-1980s, NIST has contributed to the development of the STEP standard,
the integration of STEP functionality into applications, and the adoption of STEP functionality by

71
end users. NIST also participated in several public-private partnerships involving demonstrations
and development projects with software developers, industry, and other federal agencies.
This analysis quantified NIST’s contributions to the economic value of the efficiency gains
because of the improved data exchange enabled by STEP’s use by the three industries with the
most widespread use of STEP—the automotive, aerospace, and shipbuilding industries and also the
specialty tool and die industries that supply them. The analysis estimated the full potential and
current realized benefits from STEP’s use by these transportation equipment industries and then
estimates the portion of the benefits resulting from the economic impact of NIST’s administrative
and technical contributions to STEP.
From the data collected from industry surveys and case studies, the potential benefits of
existing STEP capabilities to reduce interoperability problems were estimated as well as the portion
of those potential benefits realized at the time of the analysis. The survey of end users had
responses from 36 automotive firms, 19 aerospace firms, 4 shipbuilding firms, and 7 specialty tool
and die firms. The software vendors surveyed produced 9 of the approximately 50 software
products with significant user bases and STEP functionality. The 9 products represent some of the
most widely used products as well as some niche products for applications in specific industries.
Information about the coverage of the various industries and the supply chains within them was
used to extrapolate from the respondents’ benefits to reach estimates of the industry-wide benefits
from STEP. Avoidance cost—cost incurred to prevent interoperability problems before they
occur—savings accounted for approximately half of the potential benefits of STEP. Eighty percent
of avoidance costs were labor costs associated with the use and support of redundant computer
aided systems for design, engineering, or manufacturing and for product data management.
Mitigation costs—costs of addressing interoperability problems after they occur—resulting from
file transfer and data reentry accounted for the balance of benefits. Industry did not indicate delay
costs—costs that arise from interoperability problems that delay introduction of a new product
resulting in lost profits because of lower market share or delay of revenues. Benefits and costs
were projected through 2010 assuming a 75% penetration rate for STEP by 2010.
The time series for social benefits from STEP is begun in 1995, but the social costs of STEP is
begun in 1987—the first year in which NIST identified costs directly attributable to STEP
development. Industry and software development costs begin with the founding in late 1988 of
PDES, Inc., the public-private organization tasked with STEP deployment and coordination in the
United States. The STEP development costs include expenditures by government agencies,
software vendors, and industry users. The costs are mostly the staff time contributed to standards
development, software development, and adoption by end users.
Industry indicated the amount of time by which NIST’s activities accelerated the development
and adoption of STEP. From that information, NIST’s contribution to STEP benefits was
estimated. The analysis quantified all NIST expenditures on STEP-related activities, including
contributions to the standards development process, software tools, and testing services. The NIST
contributions to benefits and the NIST investments were then used to estimate returns to NIST’s

72
investment to support STEP development and software implementation.
Industry survey data showed that NIST’s contributions not only accelerated the development
and introduction of STEP, but also the NIST contributions increased the quality of STEP and
lowered costs of using STEP. However, the benefits from the quality improvements and the cost
reductions could not be quantified by the respondents, and so the benefits attributed to NIST’s
contributions to STEP were based solely on the acceleration in the development and introduction of
STEP. The analysis observes that the acceleration effect that could be quantified is used as a
partial indicator of the economic impact resulting from NIST’s activities. It does not capture
NIST’s full impact because the benefits from the quality improvements and cost reductions are not
quantified, and therefore the analysis’s estimates of NIST’s economic impact are conservative.
(14) “Evaluation of ATP’s Intramural Research Awards Program,” NIST GCR 04-
866
The intramural program at NIST’s Advanced Technology Program (ATP) used ATP appropriations
to fund R&D projects performed by NIST scientists in the NIST Measurement and Standards
Laboratories (MSLs). ATP’s statute permitted the program to allocate up to 10 % of its annual
appropriation internally at NIST for research on infratechnologies in support of ATP’s mission.
This analysis includes five case studies—one non-economics based assessment that documents the
outputs of the complete set of ATP intramural projects and four economics-based studies of
economic impact that use the Griliches (1958) traditional method.41
A survey of all ATP intramural project principal investigators (PIs), along with supporting
information from ATP and NIST, provided the information used in the analysis documenting the
outputs from all intramural projects. The analysis is unusual in offering an assessment of all
projects associated with a major program element. It is also unusual because the assessment of the
survey controls for sample selection bias that results because only a subset of the PIs surveyed
responded to the survey. From each PI, the survey requested information about broadly defined
outputs for each research project. These outputs included the effect of ATP intramural funding on
the scope of laboratory research, publications, citations, patents, presentations, and leveraging other
funding sources. The analysis reports by MSL the actual outputs per project, and then models
were estimated to predict measures of the outputs for each project as a function of the project’s
budget, age, MSL, with control for response bias. Such a model could be used by managers to
predict the outputs from projects with various characteristics. Additionally, the analysis assesses
41 The traditional method was used at the request of the Advanced Technology Program. Thus, the status-quo technology provides the counterfactual situation to establish the benefits from NIST’s investments in infratechnologies. For full discussion of the distinctions among the non-economics based methods and the economics based methods including the traditional approach, see Link and Scott (2011).
73
the hypothetical effects of the intramural funding as compared to the counterfactual scenario of
similar projects without the ATP funding and support more generally. The hypothetical effects are
quickening of the pace of the progress of research projects and changes in their duration,
broadening of the scope of the projects, stimulating more technically challenging projects, more
new measurement technologies, more new standards, and more new databases.
The four case studies of ATP-funded intramural research projects are unusual for the formality
of the selection process that chose the four projects for which economic impact was evaluated. The
research team worked with ATP management to select a large set of projects as potential case
studies and then interviewed the PIs for those projects in their NIST laboratories. The report
documents the process, including description of all of the intramural projects considered. The 4
case studies are also unusual because, at the specific request of the management of ATP, the
evaluation of economic impact used the “traditional” approach of Griliches (1958) for which the
counterfactual scenario absent the ATP intramural project was the status-quo-ante technology—
i.e., the technology before the NIST laboratory infratechnologies developed in the ATP intramural
project being evaluated.
The first case study evaluated an intramural project that developed an improved SRM for the
measurement of the wavelength of light in optical fiber networks. The project provided valuable
infratechnology to support wavelength division multiplexed optical fiber communications, and
resulted in production related engineering and experimentation cost savings, calibration cost
savings, increased production yields, negotiation cost savings in disputes about the performance
attributes of products, and reduced marketing costs of products because of greater buyer confidence
inspired by the new measurement standard traceable to NIST.
The foregoing benefits were estimated based on detailed interviews with 5 manufacturers that
together purchased about 30% of the new SRMs sold. The benefits for the respondents were
extrapolated to estimate industry-wide benefits. The time series of benefits was estimated from
1999 through 2009, using the respondents’ view that a commercial lifetime about 10 years would
be a very conservative estimate of the period of intense commercial use of the new SRM. The time
series of costs began in 1998 and included the costs for the ATP intramural project performed in
the NIST laboratory and also an estimate of the pull costs for industry.
The second case study estimated the economic impact of an intramural project that developed a
new bone graft material that was superior to previously existing materials used in dental and
orthopedic surgeries. The new material reduced the cost of dental implants by 30 %, it also
allowed orthopedic procedures on joints to become closed procedures, lowering the procedure cost
by 50 % and also saving the cost of harvesting the patient’s own bone. Additional benefits from
the new material that were not quantified included an increased success rate of periodontal
surgeries and a reduced recovery time for orthopedic surgeries.
Interviews with experts at NIST, research centers of the American Dental Association (ADA),
the National Institutes of Health (NIH), doctors at medical centers using the procedures, and
pharmaceutical companies were used to estimate the benefits and costs that industry would incur to
74
develop and market the new material. In addition to the ATP intramural project costs during the
years 1999 through 2001, the time series of costs included marketing costs by industry to launch
the use of the new material. The material was expected to be marketed with benefits accruing
beginning in 2007 and very conservatively projected to continue for another 10 years only. The
metrics for economic impact are downward biased because of the conservative assumption about
useful commercial lifetime and the unmeasured benefits from better success rates for periodontal
surgeries and reduced recovery time for orthopedic surgeries.
The third case study estimated the economic impact of the Internet Commerce for
Manufacturing (ICM) project, a cross-laboratory ATP intramural project performed with combined
resources from NIST’s Information Technology Laboratory (ITL), the Electronics and Electrical
Engineering Laboratory (EEEL), the Manufacturing Engineering Laboratory (MEL), and also the
Manufacturing Extension Partnership (MEP) Program. The project provided infratechnologies that
addressed problems faced by companies using the Internet for business-to-business (B2B)
electronic commerce (e-commerce). The ICM project focused on the printed circuit board (PCB)
fabrication and assembly manufacturing process and the industry and trading partners that are
involved in the activities of manufacturing and assembling electronic boards. The ICM project
assisted industry in developing open standards to enable exchange of business and product data for
all supply chain participants, provided a flexible testbed for industry and government to collaborate
in testing and evaluating standards-based tools and integration technologies, and demonstrated B2B
e-commerce.
The costs of the ICM project were incurred over the period from 1999 through 2000. Benefits
were quantified in telephone discussions with individuals, identified by the ICM project leaders,
representing companies throughout the supply chain. The benefits quantified in this case study
began in 2001 and continued through 2008 and reflected cost savings for original equipment
manufacturers (OEMs) and for electronics manufacturing services (EMS) companies because they
received the benefits of the infratechnologies sooner than if they had evolved from industry’s
initiatives in the absence of the ATP intramural project. Cost savings for interviewed OEMs were
estimated in terms of man-years saved (and the fully burdened cost of a man-year) because of
improved communication with contractors. Cost savings for interviewed EMS companies were
estimated in terms of man-years saved and the fully burdened cost of a man year) on data
translations per customer (and the number of customers). The starting point and the duration of the
time series of benefits used in estimating economic impact was based on the interviews and
conservative, interview-based, assumptions about the useful commercial lifetime of the
infratechnologies.
The final case study estimated the economic impact of an ATP intramural project that
established new metrology to characterize electrical properties of embedded capacitance in printed
wiring boards. The research project grew from industry’s needs for new thin-film embedded
passive materials, fabrication processes that are compatible with the new printed circuit boards
with embedded capacitance, and broadband testing of the materials at high frequencies. The new

75
technology developed in the intramural project allows characterization of the embedded
capacitance using new thin-film dielectric materials needed for the high-speed electronics used in
the transmission of information in communications systems.
The data used for the discussion of the outcomes of the project and for estimating the benefits
for industry are based on discussions with the PI at NIST and interviews with several respondents
from industry, representing 8 firms active in the development and uses of thin-film dielectric
materials for embedded capacitance for printed wiring boards, and also an expert at the National
Center for Manufacturing Science. The categories for industrial benefits from the ATP-funded
dielectrics project included materials characterization savings, improved production yields,
negotiation cost savings, and the enabling of new products. With the new metrology standard
industry expected benefits from being able to characterize the new materials and better understand
their performance at high frequencies during the development of materials for OEMs. The benefits
would result from lower costs for materials suppliers characterizing dielectric materials and for
board fabricators verifying the performance of materials. Also, the test method was expected to
provide accurate characterization of materials and allow higher production yields for both the
materials suppliers and the board fabricators. The test method was expected to enable new
products for the materials suppliers, the board manufacturers, and the OEMs.
To calculate the metrics for economic impact, the time series of costs included not only the
costs of the ATP project during the period from 1999 through 2001, but also costs during that time
incurred by industry in making in-kind contributions to the research at NIST, contributing
equipment, materials, and expertise. Interview-based predicted benefits were estimated over the
period from 2004 through 2020 using very conservative assumptions that were expected to bias
downward the estimates of benefits from the intramural project.
(15) “Economic Analysis of NIST’s Investments in Superfilling Research,” Planning
Report 08-1
In the 1990s, the need for smaller critical dimensions for integrated circuits (ICs) to continue the
reductions in size and increases in speed and power efficiency of devices required the
semiconductor industry to switch from aluminum to copper for the interconnections between the
transistors in ICs. The fabrication process of depositing copper in the presence of electrolytes—
filling with copper—was poorly understood by the industry and required much trial and error.
NIST assisted the semiconductor industry with research on superfilling (the superconformal
deposition process) by developing a new model—the Curvature Enhanced Accelerator Coverage
(CEAC) model—for copper electroplating and by developing software codes enabling industry to
perform modeling and simulations. NIST’s CEAC model lowered industry’s R&D costs for
copper electroplating and reduced the time from R&D to production. NIST continued to support
the semiconductor industry with refinements of the CEAC model and further development of the

76
electroplating process. This analysis evaluated the economic impact of NIST’s superfilling
research performed from 1999 through 2002.
NIST’s superfilling research benefited chemical and material suppliers (mainly supplying
electrolytes), equipment suppliers (supplying electroplating equipment), analytical tool suppliers
(supplying tools to analyze process parameters in processes or in R&D), and semiconductor
manufacturers (mainly producing ICs) by reducing their R&D costs associated with developing the
next generation of ICs and significantly improving the superfilling process. NIST’s predictive
model reduced the need for trial and error processes and increased production yield rates for the
semiconductor manufacturers.
Interviews were conducted with two chemical and material suppliers that accounted for 85% of
their market, two equipment suppliers that accounted for 80% of their market, three analytical tool
suppliers that accounted for 50% of their market, and four device (i.e. semiconductor)
manufacturers that accounted for 80% of their market. Estimates of market coverage were made
from the information gathered in the interviews about the portion of the companies’ sales relevant
to superfilling chemicals, equipment, or tools (for the chemical and material suppliers, equipment
suppliers, and analytical tools suppliers) and the portion of device manufacturer products that used
copper for interconnects and hence use a superfilling process for manufacturing.
To estimate the economic benefits from NIST’s research investment in superfilling modeling,
the analysis focused on the initial development of NIST’s CEAC model. The major aspects of the
model were first disseminated to the research community through seven published, hallmark papers
based on research conducted from 1999 through 2002.
The costs of NIST’s investment in superfilling research were estimated for the research
conducted from1999 through 2002 that resulted in the seven hallmark papers that described the
CEAC model. For calculating evaluation metrics, the time series of costs in constant 2008 dollars
include fully burdened labor (salary plus benefits), chemicals and materials, equipment costs, and
overhead.
The analysis considered the benefits for each potential application of NIST’s research
findings—benefits in R&D, in the adoption of superfilling, and in production. However, only
R&D cost savings could be quantified. The interviews with industry placed the benefits from 2003
through 2005; after that time, survey respondents anticipated that another organization would have
developed the CEAC model. For calculating evaluation metrics, the time series of benefits in
constant 2008 dollars was presented for the base case including only the interviewed organizations
and then for a fully extrapolated case representing the entire industry.
Estimates of the social benefits from NIST’s superfilling research are conservative (i.e., the
analysis’s estimates of the social benefits from NIST’s investment downward biased) because only
the benefits from reduced R&D costs could be estimated. The relatively small reduction in R&D
costs suggests a methodological lesson when deciding to undertake an investment project: be sure a
significant underinvestment gap exists. Although one could argue that the estimates of reduced
R&D costs are absolutely small, nonetheless the ratio of benefits to costs was 6-to-1. Although

77
they could not be quantified, the analysis reports many other types of social benefits that have
resulted from NIST’s superfilling research. Benefits for preproduction (during the time from R&D
until production begins) and production activities could not be quantified. The necessary
information was not documented by industry in real time while the results of the NIST research
were being used, and the industry respondents could not estimate the benefits. The analysis
provides a qualitative description of the benefits that could not be quantified. In addition to the
quantified R&D cost savings, NIST’s research also decreased preproduction costs and accelerated
the transition to production. Manufacturers were able to develop higher-quality chips faster,
resulting in reduced overall production costs and allowing the second-generation of ICs that used
copper to reach the market sooner. Also, evidence from paper citations and patent citations shows
that the knowledge in the CEAC model and the seven hallmark papers clearly influenced other
scientists and helped generate the benefits from their research. Moreover, NIST has continued to
develop the CEAC model, and industry reports that the new developments are very useful.
(16) “Economic Analysis of NIST’s Low-k Materials Characterization Research,”
Planning Report 08-2
The analysis estimates the economic impact of research into the characterization of materials with
low dielectric constants (low-k materials) conducted between 1998 and 2006 in NIST’s Polymers
Division of the Materials Science & Engineering Laboratory (MSEL). The research was in part
contracted research that NIST conducted for SEMATECH and in part internally funded research.
Low-k materials were desired by the semiconductor industry to replace the standard insulating
material, silicon dioxide, used to insulate the wiring between transistors and transistor components
within a microprocessor. The new insulating material allowed improved performance of the
integrated circuits and microprocessors manufactured by the semiconductor industry. Industry was
unable to quantitatively and critically compare different materials being considered for the
replacement of the standard insulating material because it lacked confidence in the data from
existing characterization methods which were inaccurate.
Under the contract for SEMATECH, between 1998 and 2006 NIST performed characterization
analyses of low-k materials being considered as new insulating materials. NIST also developed
novel techniques for characterizing low-k materials and created a large amount of objective high
quality data.
NIST’s work affected the entire semiconductor supply chain—materials suppliers (developers
and manufacturers of low-k materials) that realized R&D cost savings, equipment suppliers
(makers of equipment used to develop and test low-k materials) who realized R&D cost savings,
and device manufacturers (semiconductor manufacturers, mainly of integrated circuits) who
realized R&D cost savings, low-k material adoption cost savings, and production cost savings. The
device manufacturers benefited the most because they could now use low-k materials without

78
extensive characterization testing.
Interviews were conducted with 5 materials suppliers representing about 80% of the market, 4
equipment suppliers representing over 90% of the market, and 4 device manufacturers representing
about 80% of the market. Benefits for the respondents were extrapolated to estimate industry-wide
benefits.
The time series of costs for NIST’s low-k materials research from 1998 through 2006 include
SEMATECH’s funding and also NIST’s internal funding of the research effort. Benefits from the
research began in mid-1998 when NIST began providing data about the potential insulating
materials to SEMATECH. Those benefits included cost savings that accrued to industry because of
reduced R&D spending on low-k materials characterization, reduced low-k materials’ adoption
costs, and reduced production expenses. Respondents believed that the reduction in the costs of
industry R&D was the main benefit of NIST’s work. One expert observed: “The cost difference
was not sufficient to justify the project. NIST produced material characterizations that were likely
higher quality than private-sector suppliers would have accomplished, but the difference was not
deemed necessary by industry to meet its needs. This project should not have been undertaken.”
That opinion notwithstanding, the conservative (because benefits other than the R&D cost savings
were not quantified) benefit-to-cost ratio was 9-to-1. Although the analysis concluded that benefits
from NIST’s research were likely to continue beyond 2006, industry respondents could not
quantify benefits other than R&D cost saving through 2006 from NIST’s R&D characterization
work performed through that time. Quantification of the benefits of using NIST’s new
characterization methods and the benefits of NIST’s research for production activities was not
possible because the necessary information was not gathered at the time NIST research and results
were being used. Because only the R&D cost savings were quantified, the evaluation metrics for
the economic impact of NIST’s low-k materials characterization research are conservative lower
bound estimates. However, the analysis developed additional qualitative information about social
benefits and concluded that additional impacts not quantified included the acceleration of the
availability of high quality characterization data about low-k materials and that accelerated the
development of products, freed up R&D resources for other innovation activities and that improved
quality, and provided new low-k materials characterization processes and that reduced costs and
improved quality.
(17) “Retrospective Economic Impact Assessment of the NIST Combinatorial
Methods,” Planning Report 09-1
Combinatorial methods enable the creation of a large number of related chemical samples (called
libraries) and rapid analysis (high throughput screening or experimentation) of those samples’
properties. NIST began work on combinatorial methods for materials research in 1998, presented
results in 1999, published results in 2000, and in 2002 opened the NIST Combinatorial Methods
79
Center (NCMC), a public-private research consortium to develop and transfer to industry and
academia combinatorial methods technology that would increase the efficiency of polymers
research programs that are the basis for a wide range of products. This analysis evaluates the
economic impact of NIST’s investments in combinatorial methods research from its first project in
1998 through 2007.
NIST’s leadership in metrology, its impartiality, and its reputation for scientific excellence
made it possible for it to create the NCMC as a successful precompetitive forum with members
from the private sector. The NCMC developed, demonstrated, and rapidly transferred
combinatorial methods technology into the public domain.
NCMC advances were particularly important to key economic stakeholders active in polymers
R&D: advanced materials manufacturers (e.g., resins, rubber, specialty chemicals, synthetic fibers)
that produce and market material components to other industrial consumers; paints, coatings, and
adhesives manufacturers; personal care and household products firms that use combinatorial
methods to investigate candidate material formulations; academic and government laboratories that
employ combinatorial methods in academic research settings; and laboratory equipment, software,
and service providers that participate in the consortium to connect with customers, participate in
the technical dialog, and leverage NCMC’s methods, software, concepts, and manuals.
Data were collected from semi-structured interviews, survey forms completed via e-mail, and
an Internet survey of materials discovery scientists. Most responding scientists were employed by
NCMC members or alumni, research universities, or large chemical companies that did not join the
NCMC. All were directly involved in polymers R&D. Results from the survey sample were
extrapolated to national estimates using publicly reported R&D expenditures for firms in the
advanced materials, paints and coatings, and personal and household care product industries that
are likely to be using combinatorial methods in their research. Almost all private-sector survey
respondents fell into these industry groups. Their responses were augmented by contributions from
academic researchers, equipment and software vendors, and government researchers. Some
respondents completed survey instruments and participated in multiple rounds of informational
interviews. More than 70 researchers participated via surveys, telephone interviews, or in-person
discussions. Respondents to the survey had publicly reported R&D expenditures equivalent to
72% of the estimated total R&D expenditure for combinatorial methods users in the industries
covered by the analysis.
To calculate the evaluation metrics, time series of investment costs covered the period from
1998 through 2007 and included NIST’s costs plus NCMC membership and project fees and
technology acquisition costs for NCMC-developed technology. The time series of measured
benefits began in 2001 and continued through 2007. The benefits were measured for the key
participants in polymers R&D—advanced materials manufacturers (e.g., resins, rubber, specialty
chemicals, synthetic fibers) that produce and sell material components to industrial customers;
paints, coatings, and adhesives manufacturers; and personal and household care products firms that
use combinatorial methods to investigate formulations. Improvements in product R&D efficiency

80
realized from applying NCMC technology and from accelerating the adoption of the research
methods accounted for all but one-eighth of the benefits. The remaining estimated benefits were
mostly attributed to the expansion of the knowledge base supporting combinatorial methods
resulting in better selection of R&D research projects. There were also some measured benefits
attributed to the demonstration and training opportunities provided by the consortium experience.
The quantified benefits from NIST’s research and the NCMC are conservative (i.e., downward
biased) for several reasons. Only impacts for early adopters of combinatorial methods could be
quantified. Adoption of NCMC technology outside of the advanced materials, paints and coatings,
and personal care and household products industries could not be estimated, and so economic
benefits accruing to other industries were not quantified. Benefits for industries that use polymers
enabled by combinatorial methods and benefits for the final end users that receive quality benefits
from polymer-containing products could not be quantified. Benefits for two stakeholder groups,
equipment vendors and academic laboratories, could not be reliably estimated.
Note: Planning Reports are available at http://www.nist.gov/director/planning/impact_assessment.cfm. NIST GCR 04-866 is available at the preceding location under “Advanced Technology Program” and at http://www.atp.nist.gov/eao/eao_pubs.htm.
81
References
Arvanitis, S., H. Hollenstein, and S. Lenz (2002). “The Effectiveness of Government
Promotion of Advanced Manufacturing Technologies (SMT): An Economic Analysis
Based on Swiss Micro Data,” Small Business Economics, 19: 321-340.
Arvanitis, S. and M. Keilback (2002). “Econometric Models,” in RTD Evaluation Toolbox
(edited by G. Fahrenkrog, W. Polt, J. Rojo, A. Tübke, and K. Zinöcker), Sevilla, España:
European Commission.
Bührer, S. (2002). “Network Analysis,” in RTD Evaluation Toolbox (edited by G.
Fahrenkrog, W. Polt, J. Rojo, A. Tübke, and K. Zinöcker), Sevilla, España: European
Commission.
Buson, I. (2000). “An Empirical Evaluation of the Effects of R&D Subsidies,” Economics of
Innovation and New Technology, 9: 111-148.
Council of Economic Advisers (annual). Economic Report of the President, Washington,
D.C.: U.S. Government Printing Office.
David, P.A., B.H. Hall, and A.A. Toole (2000). “Is Public R&D a Complement for Private
R&D?” Research Policy, 29: 497-529.
Executive Office of the President (1990). U.S. Technology Policy, Washington, DC: Office
of Science and Technology Policy.
Freeman, L.C. (2000). “Visualizing Social Networks,” Journal of Social Structure, 1: 1-41.
Griliches, Z. (1958). “Research Costs and Social Returns: Hybrid Corn and Related
Innovations,” Journal of Political Economy, 66: 419–431.
Hall, B.H., J. Mairesse, and P. Mohnen (2010). “Measuring the Returns to R&D,” in The
Economics of Innovation (edited by B.H. Hall and N. Rosenberg), Amsterdam: Elsevier.
Hill, C.T. (1997). “The Congressional Office of Technology Assessment: A Retrospective
and Prospects for the Post-OTA World,” Technological Forecasting and Social Change,
54: 191-198.
Jaffe, A. B. (2002). “Building Programme Evaluations into the Design of Public Research-
Support Programs,” Oxford Review of Economic Policy, 18: 22-34.
Kahin, B. and C.T. Hill (2010). “United States: the Need for Continuity,” ISSUES in Science
and Technology, 26: 51-60.
Leech, D. P., and J. T. Scott (2008). “Intelligent Machine Technology and Productivity
Growth,” Economics of Innovation and New Technology, 17: 677-687.

82
Licht, G. and G. Sirilli (2002). “Innovation Surveys,” in RTD Evaluation Toolbox (edited by
G. Fahrenkrog, W. Polt, J. Rojo, A. Tübke, and K. Zinöcker), Sevilla, España: European
Commission.
Link, A.N. and J.T. Scott (1998). Public Accountability: Evaluating Technology–based
Institutions, Norwell, Mass.: Kluwer Academic Publishers.
Link, A.N. and J.T. Scott (1998). “Public/Private Partnerships: Stimulating Competition in a
Dynamic Market,” International Journal of Industrial Organization, 19: 763-794.
Link, A.N. and J.T. Scott (2002). “Explaining Observed Licensing Agreements: Toward a
Broader Understanding of Technology Flows,” Economics of Innovation and New
Technology, 11: 211-231.
Link, A.N. and J.T. Scott (2005). Evaluating Public Research Institutions: The U.S.
Advanced Technology Program’s Intramural Research Initiative, London: Routledge.
Link, A.N. and J.T. Scott (2011). Public Goods, Public Gains: Calculating the Social
Benefits of Public R&D, New York: Oxford University Press.
Mansfield, E., J. Rapoport, A. Romeo, S. Wagner, and G. Beardsley, G. (1977). “Social and
Private Rates of Return from Industrial Innovations,” Quarterly Journal of Economics,
91: 221–240.
Martin, B. (1995). “Foresight in Science and Technology,” Technology Analysis and
Strategic Management, 7: 140-168.
Martin, S. and J.T. Scott (2000). “The Nature of Innovation Market Failure and the Design of
Public Support for Private Innovation,” Research Policy, 29: 437–447.
Narin, F. and K.S. Hamilton (1996). “Bibliometric Performance Measures,” Scientometrics,
36: 293‒310.
National Academy of Sciences (1999). Evaluating Federal Research Programs: Research
and the Government Performance and Results Act, Washington, DC: National Academy
of Sciences.
Office of Management and Budget (OMB) (1992). Circular No. A–94: Guidelines and
Discount Rates for Benefit–Cost Analysis of Federal Programs, Washington, D.C:
Government Printing Office.
Office of Management and Budget (OMB) (2003). Circular No. A–4: Regulatory Analysis,
Washington, DC: Government Printing Office.
Office of Naval Research (1989). Significant Accomplishments: Office of Naval Research
Sponsored Programs, Washington, DC: Office of Naval Research.
Ormala, E. “Impact Assessment: European Experience of Qualitative Methods and
Practices,” Evaluation Review, 18: 41-51.

83
Orszag, P.R. (2009a). “Testimony of Peter Orszag before the Subcommittee on Financial
Services, Committee on Appropriations, on May 20, 2009,” Washington, DC: House of
Representatives, U.S. Congress.
Orszag, P.R. (2009b).“Memorandum for the Heads of Executive Departments and
Agencies,” Office of Management and Budget, Executive Office of the President,
October 7.
Polt, W., C. Rammer, H. Gassler, A. Schibany, and D. Schartinger (2001). “Benchmarking
Industry—Science Relations: The Role of Framework Conditions,” Science and Public
Policy, 4: 247-258.
Polt, W. and J. Rojo (2002). “Evaluation Methodologies,” in RTD Evaluation Toolbox
(edited by G. Fahrenkrog, W. Polt, J. Rojo, A. Tübke, and K. Zinöcker): España:
European Commission.
President’s 2004 Budget (2003).
Available at: http://www.gpoaccess.gov/usbudget/fy04/pdf/budget/performance.pdf
Schot, J. and A. Rip. (1997). “The Past and the Future of Constructive Technology
Assessment,” Technological Forecasting and Social Change, 54: 251-268.
Tassey, G. (1997). The Economics of R&D Policy, Westport, CT: Quorum Books.
Tassey, G. (2003). “Methods for Assessing the Economic Impacts of Government R&D,”
Gaithersburg, MD: NIST Planning Report 03-1.
U.S. Department of Energy (1982). An Assessment of the Basic Energy Sciences Program,
Washington, DC: Office of Energy Research.
U.S. Department of Energy (1991). Procedures for Peer Review Assessments, Washington,
DC: Office of Energy Research.
United Nations Development Programme (2005). Peer Assessment of Evaluation in
Multilateral Organisations, Koege, Denmark: Ministry of Foreign Affairs of Denmark.