Embed Size (px)
Citation preview

LINK Mobility Group ASA Financial Results Third quarter 2017

INTERIM REPORT Q3 2017
Mobilizing Your Business
2 / 22
Highlights third quarter 2017
• Continued strong revenue growth of 129 percent. Organic growth of 22 percent, 36
percent for the mobile messaging segment
• High acquisition activity with closed transactions for GMS in Spain, Vianett in
Norway, Voicecom in Bulgaria, Comvision in Poland and Netmessage in France
• A diversified and strong customer base with more than 16 000 enterprise customers
• Adjusted EBITDA of NOK 32 million or 10.8 percent (+2.8 percent above last year)
• Signed contract with Lindex regarding mobile communication services covering 18
countries including significant amounts of mobile coupons for use in-store
• Transformation of Germany implemented, improved margins with 4 percentage
points in the third quarter. Transformation of Denmark initiated
• Contemplating tap issue of EUR 30 million of existing bond agreement immediately
after third quarter reporting to finance future acquisitions
130
298
28
140
Q3 16 Organic growth Acquired growth Q3 17
Total revenue development,QonQ, (NOKm)
22%
107%
125 130
256229
281298
Q2 2016 Q3 2016 Q4 2016 Q1 2017 Q2 2017 Q3 2017
Operating revenues, (NOKm)
= Organical grow th QonQ
129%
Existing markets are defined as the subsidiaries as reported in third quarter in 2016. Acquired business inlude the acquisition of Labyrintti Group, Whatever Mobile Group, Linus, Globalmouth Marketing AB, Didimo-Jet Group and Vianett.
17
10
30
17
3032
Q2 2016 Q3 2016 Q4 2016 Q1 2017 Q2 2017 Q3 2017
Adjusted EBITDA,(NOKm)
= Adjusted EBITDA margin
10,8%13.7% 8.0% 11.7% 7.4% 10.8%
8,0 %
-1,6 %
3,3 %
0,5 %0,7 %
10,8 %
Q3 16 Delta GM1 Delta OPEX Delta OPEX Margin effect Q3 17
Existing markets Groupfunctions
Aquiredentities
Adjusted EBITDA% development,QonQ
22%32% 35% 29% 25% 23%

INTERIM REPORT Q3 2017
Mobilizing Your Business
3 / 22
Strong organic growth and successful acquisitions LINK Mobility Group ASA (LINK) confirms its strategy, and reports solid revenue growth in the
third quarter of 2017 which is traditionally a slow quarter. The strong figures are the result of high
organic growth and successful acquisitions. LINK has closed multiple transactions which will
further strengthen the market position in Norway and Spain through the acquisitions of Vianett
and GMS, and entering the Polish, Bulgarian and French market through the acquisitions of
Comvision, Voicecom and Netmessage. LINK has also signed a term sheet regarding the
acquisition of the Italian entity Totalconnect. LINK is one of Europe’s leading and fastest growing
companies within the industry.
The strong organic revenue growth in the quarter, confirms the positive underlying trend of solid growth
in the market for mobile messaging and mobile solutions delivered by LINK. LINK achieved operating
revenues of NOK 298 million in the third quarter, up 129 percent compared with corresponding period
last year. The overall market conditions have been favorable, resulting in a messaging volume of 934
million, and an organic growth in the Mobile Messaging segment of 36 percent (see graphs below).
The adjusted EBITDA for the third quarter is reported at NOK 32 million, an increase of NOK 22 million
from same quarter last year. The EBITDA margin is reported at 10.8 percent, an increase of 2.8
percentage points versus same quarter last year. The increase in margin is due to:
• +3.8 percent due to scale advantages as OPEX does not increase at the same rate as revenue
• +0.7 percent due to margin effect of acquired entities. Link Germany has substantially increased
margins as cost cutting efforts have been in effect for the third quarter
• -1.6 percent due to lower gross margin from existing entities
o Introduction of high volume and low price customers in Sweden. LINK is working with
upselling initiatives of mobile solution products to increase margins.
o Sesonality and a negative one-time effect on license revenue in Norway.
Net finance items are reported at negative NOK 9.6 million, impacted by interest cost of NOK 8.2 million.
In the third quarter, LINK implemented hedge accounting in accordance with IAS 39 related to
borrowings in foreign currency which is expected to reduce the currency fluctuations significantly.
The financial position is good, with a cash position of NOK 289 million. LINK has no additional plans to
raise new equity to fund acquisitions except for future acquisitions settled partly in LINK shares.

INTERIM REPORT Q3 2017
Mobilizing Your Business
4 / 22
LINK secured a EUR 50 million, with a EUR 175 million borrowing limit, 5-year, fixed interest of 4.75%
senior secured bond in the first quarter of 2017. LINK has mandated ABG Sundal Collier ASA and
Danske Bank to arrange for a tap issue of EUR 30 million on the existing bond agreement subject to
inter alia market conditions. If successful, net proceeds from such transaction will be used to provide
funding for future acquisitions in line with the acquisition strategy towards 2018.
Acquisitions and pro forma financials
In the second quarter of 2016, LINK closed the acquisition of Responsfabrikken in Denmark. In the third
quarter of 2016, LINK closed the acquisition of Whatever Mobile Group in Germany, Labyrintti Group in
Finland, Linus AS in Norway and Globalmouth Marketing AB in Sweden. In the first quarter of 2017,
LINK closed the acquisition of the Didimo-Jet Group in Spain. In the third quarter of 2017, LINK closed
the acquisition of Vianett AS in Norway and GMS SL in Spain. For the third quarter of 2017, Vianett is
included in the income statement for August and September. The acquisitions of Comvision Sp.z o.o. in
Poland, Voicecom AD in Bulgaria and Netmessage SARL in France were closed in the fourth quarter.
LINK reports the following pro forma revenue and adjusted EBITDA for 2016:
(Amounts in NOK million) 2016 Reported
2016 Pro forma**)
Operating revenues 622 1 407
Adjusted EBITDA* 67 175
Adjusted EBITDA margin* 10.8 % 12.4 %
Number of messages (million) 1 901 4 373
LINK reports the following year to date pro forma revenue and adjusted EBITDA in third quarter of 2017:
(Amounts in NOK million) 2017 YTD Q3 reported
2017 YTD Q3 Pro forma **)
Operating revenues 808 1 151
Adjusted EBITDA* 79 136
Adjusted EBITDA margin* 9.8% 11.8%
Number of messages (million) 2 467 3 896
*) Adjusted for costs related to acquisitions, one-off cost and share based compensations. **) Proforma: includes full year effect of the acquisitions of Responsfabrikken, Whatever Mobile Group, Labyrintti Group, Linus, Globalmouth Marketing, Didimo-Jet Group, Vianett, GMS, Comvision, Netmessage and Voicecom. All acquisitions are closed.
Outlook 2017
In the second quarter of 2017, LINK gave the market an outlook regarding pro forma revenue and adjusted EBITDA for 2017. LINK is adjusting the pro forma outlook for 2017 as a consequence of a specific undisclosed acquisition not been finalised as previously estimated by management due to the detection of material findings in the due diligence. The updated outlook takes into consideration management’s best estimate towards;
• Organic development of existing footprint
• Effect from closed acquisitions or acquisitions that LINK has announced to the market which are in progress

INTERIM REPORT Q3 2017
Mobilizing Your Business
5 / 22
• An estimate of the pro forma financial impact for 2017 relating to LINK´s view of its M&A pipeline for second half of 2017.
LINK’s updated outlook for 2017 is based on the stated assumptions, and the updated outlook should therefore be:
• Revenue*) NOK 1 600 to 1 700 million
• Adjusted EBITDA*) NOK 195 to 210 million LINK’s outlook for 2018 is kept unchanged with a pro forma revenue*) of NOK 2 700 million and a pro forma adjusted EBITDA*) of NOK 400 million. LINK has during 2017 taken the #1 position within mobile messaging and solutions in Europe. This is an excellent position for LINK to leverage on market position and operational scale in a large European market with strong potential for far greater penetration levels and usage of LINK´s global mobile messaging and solutions services. Being the leading mobile messaging and solutions provider in the European market, should position LINK for continued growth from greater use and penetration of its services. LINK also believe that when the new messaging solutions applications develops (WhatsApp, Facebook Messenger, Snapchat, Viber, Google RCS etc.), and these channels start monetizing their channels, LINK will be a natural partner in Europe towards the Enterprise segment, the same way that the Operators have monetized through LINK and other selected partners within the SMS messaging space.
*) The above outlook for 2017 and 2018 is calculated on LINK’s best estimate based on information available to LINK, and views and assessment of LINK, as of the date of this report. LINK’s growth assumptions may deviate from the outcome resulting in material or immaterial deviations from the outlook. Further, LINK’s assumption relating to successfully acquire further businesses during 2018 is to a great extent outside the control of LINK. LINK’s ability to successfully acquire new businesses at fair value, or at all, could materially affect the outlook figures correspondingly. Investors must therefore make their own calculation in relation to valuing LINK based on their own analysis and judgement.
Market conditions
LINK is continuing to experience a high degree of recurring revenue combined with high organic growth
as most customers increase their use of LINK’s various mobile services. The overall market trend is the
move towards “mobilization of businesses”. Customers who have first started using mobile
communications in one area, tend to move more and more business activities to mobile platforms. In
addition to the strong increase in demand for mobile messages, LINK is also experiencing an increased
demand for integrated mobile solutions such as customer clubs, statistical and analytical tools,
databases, payment solutions, strategic advice and numerous other mobile services.
In the third quarter LINK delivered mobile services to more than 100 million unique mobile subscribers.
LINK’s international business was also picking up through enterprise with global customers. In the third
quarter, LINK delivered mobile messages to nearly all nations throughout the world.
The Scandinavian markets are regarded as advanced in terms of adopting mobile technologies and
services. Scandinavian organizations are 2-4 years ahead of their counterparts in other markets in taking
mobile messaging services into use. LINK has a comparative advantage when entering new markets.
Highly developed technological platforms, advanced services and solid reference cases, will make LINK
able to expand the market potential when entering new geographical markets.
INTERIM REPORT Q3 2017
Mobilizing Your Business
6 / 22
Business segments
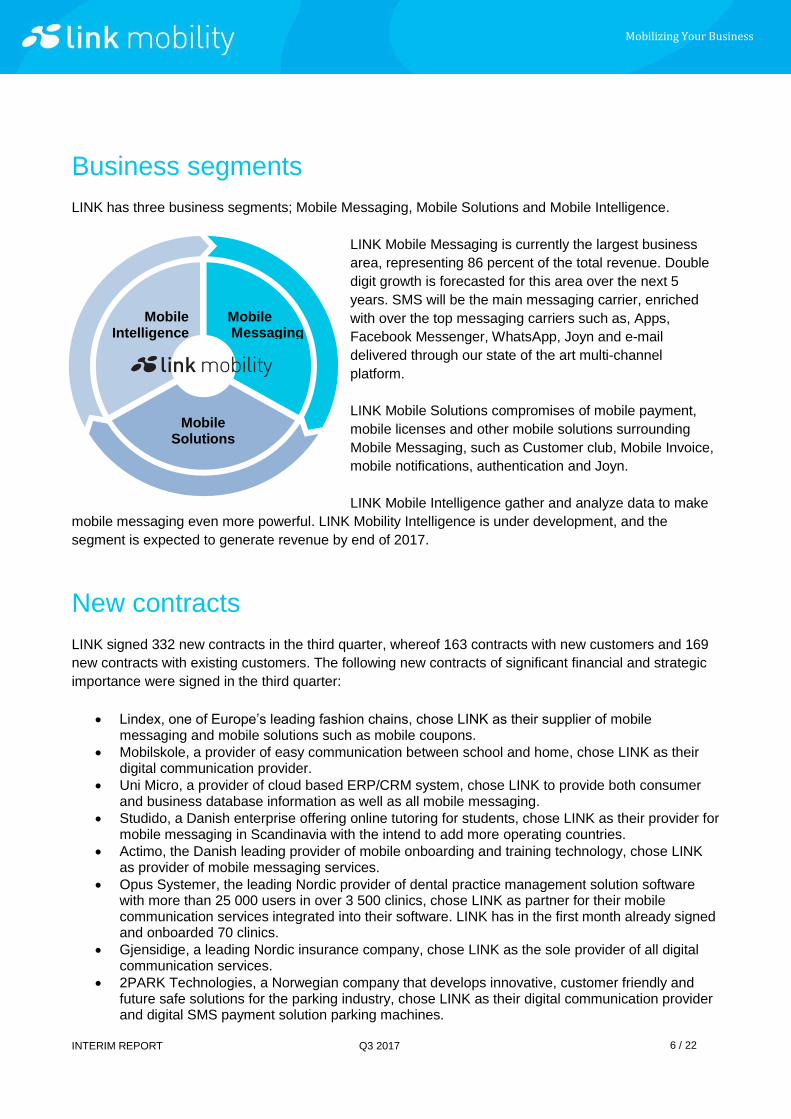
LINK has three business segments; Mobile Messaging, Mobile Solutions and Mobile Intelligence.
LINK Mobile Messaging is currently the largest business
area, representing 86 percent of the total revenue. Double
digit growth is forecasted for this area over the next 5
years. SMS will be the main messaging carrier, enriched
with over the top messaging carriers such as, Apps,
Facebook Messenger, WhatsApp, Joyn and e-mail
delivered through our state of the art multi-channel
platform.
LINK Mobile Solutions compromises of mobile payment,
mobile licenses and other mobile solutions surrounding
Mobile Messaging, such as Customer club, Mobile Invoice,
mobile notifications, authentication and Joyn.
LINK Mobile Intelligence gather and analyze data to make
mobile messaging even more powerful. LINK Mobility Intelligence is under development, and the
segment is expected to generate revenue by end of 2017.
New contracts
LINK signed 332 new contracts in the third quarter, whereof 163 contracts with new customers and 169
new contracts with existing customers. The following new contracts of significant financial and strategic
importance were signed in the third quarter:
• Lindex, one of Europe’s leading fashion chains, chose LINK as their supplier of mobile messaging and mobile solutions such as mobile coupons.
• Mobilskole, a provider of easy communication between school and home, chose LINK as their digital communication provider.
• Uni Micro, a provider of cloud based ERP/CRM system, chose LINK to provide both consumer and business database information as well as all mobile messaging.
• Studido, a Danish enterprise offering online tutoring for students, chose LINK as their provider for mobile messaging in Scandinavia with the intend to add more operating countries.
• Actimo, the Danish leading provider of mobile onboarding and training technology, chose LINK as provider of mobile messaging services.
• Opus Systemer, the leading Nordic provider of dental practice management solution software with more than 25 000 users in over 3 500 clinics, chose LINK as partner for their mobile communication services integrated into their software. LINK has in the first month already signed and onboarded 70 clinics.
• Gjensidige, a leading Nordic insurance company, chose LINK as the sole provider of all digital communication services.
• 2PARK Technologies, a Norwegian company that develops innovative, customer friendly and future safe solutions for the parking industry, chose LINK as their digital communication provider and digital SMS payment solution parking machines.
Mobile Messaging Messaging
Mobile Intelligence
Mobile Solutions

INTERIM REPORT Q3 2017
Mobilizing Your Business
7 / 22
Financial Review (Figures in brackets refer to the same quarter last year)
Group Income Statement Operating revenues amounted to NOK 298 million (NOK 130 million) or a growth of 129 percent versus
same quarter last year. The strong growth was due to organic growth and successful acquisitions last
quarters. The organic growth is driven by the Mobile Messaging business segment with a growth rate of
36 percent versus last year. A lower organic growth rate of 22 percent for total revenue is due to lower
growth rates for Direct carrier billing and Consulting which is not a strategic area for LINK.
Direct carrier billing is a mature product, and LINK
is expecting a slow decline within this business
area. However, LINK sees opportunities for taking
a stronger role as mobile payment enabler, offering
customers access to multiple scalable mobile
payment alternatives through the product Mobile
Invoice.
Consulting revenues varies from quarter to quarter
dependent on order reserves and internal
development projects. LINK is focusing on
standardized scalable solutions rather than tailor
made products within the Consulting area.
Total gross margin was 30 percent (38.8 percent) or a 8.9 percentage points reduction due to;
• -7.3 percent reduced margins due to the dilutive effect of lower margins from acquired companies in
Germany, Spain and Norway (Vianett). The subsidiaries acquired over the last quarters are
messaging companies with lower gross margin. LINK is expecting long-term margin improvements in
the acquired entities due to focus on LINK’s mobile solutions products.
• -1.6 percent due to lower gross margin from existing entities.
o Lower margins for Sweden due to the introduction of high volume and low price customers.
LINK is working with upselling initiatives of mobile solution products to increase margins.
o Lower margins for Norway due to sesonality as the third quarter is a weak quarter for the
retail and SME segment which on average have higher prices. Also, license revenue was
negatively impacted by one-time effects.
Q3 2016 Q4 2016 Q1 2017 Q2 2017 Q3 2017
Transactions 94 200 183 235 255
Direct carrier billing 11 21 14 11 11
Licenses 20 30 28 30 29
Consulting 5 5 4 5 2
Total 130 256 229 281 298
Q3 2016 Q4 2016 Q1 2017 Q2 2017 Q3 2017
Norway 75 107 96 106 123
Sweden 24 34 31 34 33
Denmark 29 35 29 30 28
Baltics 2 2 2 1 1
Finland 0 16 14 16 15
Germany 62 57 64 70
Spain 29 29
Total 130 256 229 281 298
Revenues by operating
segment
Revenues by business
segment

INTERIM REPORT Q3 2017
Mobilizing Your Business
8 / 22
Personnel costs were, in addition to cost of services rendered, the main cost element. Personnel costs
adjusted for costs related to share based compensation, were in the third quarter 13.5 percent of net
operating revenues (22.7 percent).
Adjusted EBITDA, before non-recurring cost, was NOK 32 million (NOK 10 million), equaling an adjusted
EBITDA margin of 10.8 percent (8.0 percent) or an increase of 2.8 percentage points. The increase in
margin versus same quarter last year is due to:
• -1.6 percent regarding change in GM1 margins in existing markets (see comments above)
• +3.3 percent due to lower OPEX from existing markets (scale effect)
• +0.5 percent due to lower OPEX regarding Group functions
• +0.7 percent due to margins from acquired business due to margin improvements in Germany
EBITDA is reported at NOK 21 million (NOK -3 million) for the third quarter after deduction of non-
recurring cost of NOK 12 million (NOK 14 million) related to acquisitions, one-off items due to
restructuring efforts and share based compensation.
Financial items amounted to a negative NOK 10 million (NOK 3 million in profit). NOK 8 million (NOK 2
million) were interest expenses on sellers’ credits and the senior secured bond. The net impact of
currency loss amounted to NOK 0.7 million. In the third quarter, LINK implemented hedge accounting in
accordance with IAS 39 related to borrowings in foreign currency which is expected to reduce the
currency fluctuations in the P&L significantly. Under other financial expenses, a loss of NOK 0,8 million is
incurred regarding the disposal of Whereever SIM as part of the transformation in Germany.
Balance sheet, financing and liquidity
Non-current assets amounted to NOK 1 144 million (NOK 746 million), the increase is due to acquisitions
as customer relations, technology and goodwill from acquired subsidiaries represent a book value of
NOK 1 079 million. Investments in R&D amounted to NOK 11 million (NOK 7 million) resulting in NOK 55
million in book value.
Trade receivables and other receivables amounted to NOK 262 million (NOK 162 million), the increase is
mainly a result of acquisitions. The cash balance is strong with NOK 289 million (NOK 92 million).
Existing markets are defined as the subsidiaries as reported in third quarter in 2016. Acquired business inlude the acquisition of Labyrintti Group, Whatever Mobile Group, Linus, Globalmouth Marketing AB, Didimo-Jet Group and Vianett.
17
10
30
17
3032
Q2 2016 Q3 2016 Q4 2016 Q1 2017 Q2 2017 Q3 2017
Adjusted EBITDA,(NOKm)
= Adjusted EBITDA margin
10,8%13.7% 8.0% 11.7% 7.4% 10.8%
8,0 %
-1,6 %
3,3 %
0,5 %0,7 %
10,8 %
Q3 16 Delta GM1 Delta OPEX Delta OPEX Margin effect Q3 17
Existing markets Groupfunctions
Aquiredentities
Adjusted EBITDA% development,QonQ

INTERIM REPORT Q3 2017
Mobilizing Your Business
9 / 22
Total equity amounted to NOK 633 million (NOK 414 million) or 37 percent of balance sheet value (41
percent). Long term liabilities amounted to NOK 612 million (NOK 257 million). Further details can be
found in Note 6 “Long term liabilities”.
Net cash from operating activities for the first three quarters of 2017 was positive with NOK 90 million
(NOK 43 million). Net cash flow from operating activities for 2016 was NOK 52 million.
Outlook and way forward The market for B2C mobile services has been a double-digits growth market over the last years. LINK
expects this trend to last, as more and more businesses, public services and organizations are forced by
customers’ and users’ demands to use mobile devices as the key channel for communication. LINK is
experiencing a higher growth rate than the markets in which it operates.
LINK is currently delivering a wide variety of mobile messaging services and mobile solutions. LINK sees
that businesses communicating with their customers via LINK’s advanced cloud based messaging
services, gain a strong advantage in their customer relations. LINK is now fueling the development of
new and attractive mobile solutions ranging from innovative in-app mobile messaging, customer club and
loyalty programs, to creative mobile payment solutions. LINK is currently developing a mobile
intelligence offering to its existing customers. This increased insight puts LINK in a leading position to
give targeted and valuable advice to its customers, on how best to deploy LINK’s mobile messaging and
solutions to their business. The Scandinavian market for developing and deploying state of the art mobile
solutions is amongst the most innovative in the world. LINK intends to capitalize on the knowledge from
the Nordic markets to access and expand new underdeveloped markets.
It is the opinion of the company that LINK is well positioned to pursue new profitable growth initiatives.
LINK has a solid customer portfolio, a highly scalable technology and an experienced organization. The
R&D capacity is good, and the business models are agile. LINK is well prepared to further strengthen its
position in the fast growing B2C market for mobile services. We see that the current growth level, both
organic and non-organic, will continue through our strategic planning period 2018.
LINK will constantly seek to streamline its operations and development activities across our footprint to
ensure that we optimize our use of resources and synergies. Some key activities related to this work are:
• Consolidate our messaging and solution platforms
• Strengthening our sales profile in each of our markets
• Drive innovation through standardized common product and solutions for all our markets
Expected annual recurring synergies from scaling up and consolidation activities ranging from NOK 50 to
70 million (full year effect 2019) with corresponding EBITDA improvement of 2-3 percentage points.

INTERIM REPORT Q3 2017
Mobilizing Your Business
10 / 22
Consolidated Income Statement
Consolidated Income Statement (NOKk) Note 3Q 2017 3Q 2016 YTD 2017 YTD 2016 Year 2016
Operating revenues 3 298 109 130 161 808 232 365 219 621 606
Total operating revenues 298 109 130 161 808 232 365 219 621 606
Cost of services rendered 208 926 79 659 546 693 220 653 391 255
Personell costs 40 278 29 482 134 647 78 624 114 610
Other operating expenses 16 655 10 645 47 705 28 344 48 310
Total operating expenses 265 860 119 786 729 045 327 621 554 175
Adjusted EBITDA* 3 32 249 10 375 79 188 37 599 67 431
Share based compensation 5 2 473 5 309 13 485 11 978 18 038
Expenses related to acquisitions 6 688 8 380 14 452 10 335 11 939
Restructuring costs 2 616 2 616
EBITDA 20 472 -3 314 48 633 15 266 37 454
Depreciation intangible assets 8 10 322 7 771 26 431 22 096 24 274
Operating profit 3 10 151 -11 085 22 203 -6 830 13 180
Interest income 160 144 881 252 718
Other financial income 688 5 303 1 037 5 939 11 037
Interest expenses 6 8 164 1 504 22 512 3 785 7 867
Other financial expenses 2 252 1 145 17 186 5 656 6 980
Net financial items -9 569 2 797 -37 780 -3 250 -3 092
Profit before tax 582 -8 288 -15 580 -10 080 10 088
Income tax -6 623 1 485 -7 700 1 631 5 417
Profit for the period -6 041 -9 773 -21 125 -11 711 4 671
Earnings per share (NOK/share) Earnings per share -0,440 -0,998 -1,580 -1,196 0,466
Diluted earnings per share 5 -0,440 -0,998 -1,580 -1,196 0,423
Profit attributable to: Owners of the company -6 041 -9 773 -21 125 -11 711 4 671
Statement of comprehensive income Profit for the year -6 041 -9 773 -21 125 -11 711 4 671
Exchange rate differences Group -5 259 241 21 638 282 -973
Total comprehensive income -11 300 -9 532 513 -11 429 3 698
* Before share-based compensation, one-off items and expenses related to acquisitions.

INTERIM REPORT Q3 2017
Mobilizing Your Business
11 / 22
Consolidated Balance Sheet Consolidated Balance Sheet (NOKk) Note 3Q 2017 3Q 2016 2016
Assets Non-current assets Intangible assets 8 1 134 503 739 179 757 752
Equipment and fixtures 6 065 6 499 6 304
Deferred tax assets 3 361 2 136
Total non-current assets 1 143 929 745 678 766 192
Current assets Trade receivables and other receivables 262 173 161 805 169 513
Cash and cash equivalents 288 897 92 432 187 924
Total current assets 551 070 254 237 357 437
Total assets 1 694 999 999 915 1 123 629
Equity and liabilities Share capital 7 13 790 11 795 13 087
Share premium 7 455 350 273 037 399 749
Other equity 8 164 107 129 126 152 433
Total equity 633 247 413 958 565 269
Deferred tax Deferred tax 72 921 42 483 46 280
Total deferred tax 72 921 42 483 46 280
Long-term liabilities Seller's credit 6 152 905 150 770 117 332
Debt to financial institutions 105 876 88 350
Bond loan 459 248
Other long-term liabilities 6 341
Total long-term liabilities 612 494 256 647 205 682
Short-term liabilities Seller’s credit short term 6 33 698 19 821
Trade and other payables 316 372 217 185 204 954
Tax payable 8 380 10 294 8 245
Short-term debt to financial institutions 15 652 59 348 73 378
Short-term liabilities Bond loan 6 2 235 Total short-term liabilities 376 337 286 827 306 398
Total liabilities 1 061 752 585 957 558 360
Total equity and liabilities 1 694 999 999 915 1 123 629

INTERIM REPORT Q3 2017
Mobilizing Your Business
12 / 22
Statement of changes in equity Statement of changes in equity (NOKk)
Note Ordinary
shares Share
premium Other
equity Total
equity
Balance at 31.12.2016 13 087 399 749 152 433 565 269
Comprehensive income for the year Profit for the period -21 125 -21 125
Exchange rate differences 21 638 21 638
Total comprehensive income for the year 513 513
Contributions by and distributions to owners Issue of share capital 703 55 601 56 304
Employee share-option schemes 11 160 11 160
Total contributions by and distributions to owners 703 55 601 11 160 67 464
Balance at 30.09.2017 13 790 455 350 164 106 633 246
Note Ordinary
shares Share
premium Other
equity Total
equity
Balance at 31.12.2015 9 641 102 773 29 374 141 788
Comprehensive income for the year Profit for the period 4 671 4 671
Exchange rate differences -973 -973
Total comprehensive income for the year 3 697 3 697
Contributions by and distributions to owners Issue of share capital 3 446 296 976 112 345 412 767
Employee share-option schemes 7 017 7 017
Total contributions by and distributions to owners 3 446 296 976 119 362 419 784
Balance at 31.12.2016 13 087 399 749 152 433 565 269

INTERIM REPORT Q3 2017
Mobilizing Your Business
13 / 22
Consolidated Cash Flow Statement
Consolidated Cash Flow Statement (NOKk) 3Q 2017 3Q 2016 YTD 2017 YTD 2016 Year 2016
Cash flow from operating activities Profit before tax 582 -8 288 -15 579 -10 080 10 088
Taxes paid -598 -2 181 -9 795 -2 919 -8 284
Depreciation and amortization 10 322 7 771 26 431 22 096 24 274
Adjustment for share-based payment 2 473 -921 13 485 3 778 18 038
Adjustment for expenses related to acquisitions 6 687 14 660 11 939
Net interest in profit and loss 8 004 -2 798 21 631 3 249 3 093
Interest received 160 152 475 252
Other financial items 1 620 16 151
Change in trade receivables and other receivables -10 798 -66 800 -18 073 -63 099 -65 103
Change in trade and other payables 22 180 100 115 42 723 89 475 69 222
Change social security tax share based payment 1 386 -2 325 -11 021
Other change in operating activities 621
Net cash flow from operating activities 42 639 27 050 89 784 42 752 52 246
Cash flow from investing activities Acquisition of subsidiary, net of cash acquired -162 396 -90 844 -174 850 -108 183 -118 571
Purchase price adjustment subsidiary, net of cash -968 -20 281
Expenses related to acquisitions -6 687 -14 660 -11 939
Purchase of tangible assets -89 -114 -612 -2 576 -4 042
Purchase of intangible assets -10 570 -6 764 -33 491 -16 856 -24 444
Net cash flow from investing activities -180 710 -97 721 -243 894 -127 615 -158 996
Cash flow from financial activities Net interest paid -13 095 -1 496 -18 750 -3 432 -5 060
Other financial items -5 173 -5 173
Proceed from borrowings 126 000 447 924 147 000 147 000
Repayment of borrowings -13 162 -6 823 -173 012 -12 223 -16 117
Proceeds from issuing new shares 1 127 8 534 6 255 129 842
Net cash flow from financial activities -30 303 117 681 259 523 137 600 255 665
Foreign exchange effect on cash -6 762 -341 -4 441 -382 -1 065
Net change in cash and cash equivalents -175 136 46 671 100 972 52 357 147 850
Cash and cash equivalents at the beginning for the period 464 033 45 761 187 924 40 075 40 075
Cash and cash equivalents at the end of the period 288 897 92 432 288 897 92 432 187 924

INTERIM REPORT Q3 2017
Mobilizing Your Business
14 / 22
Selected notes to the accounts
Note 1 – General information LINK Mobility Group ASA is a private limited company registered in Norway. LINK Mobility Group ASA is
the parent company of the LINK Mobility Group (LINK or the group) and owns 100 percent of the
subsidiaries LINK Mobility AS and Vianett AS in Norway, LINK Mobility Group in Sweden, LINK Mobility
Group in Denmark, Link Mobility Group in Germany, Link Mobility Group in Finland, LINK Mobility SIA in
the Baltics, Link Mobility Spain and Global Messaging Solutions in Spain. LINK is headquartered in Oslo,
Norway.
LINK is the leading provider of B2C mobile messaging and services in the Nordic, Baltic, German and
Spanish markets. LINK provides services that enable companies, public services and organizations to
have mobile communication with and deliver mobile services to their customers and users. LINK offers
products and services extending from mobile messaging, marketing, payment, databases and
applications. LINK’s business is classified into the business segments; Mobile Messaging, Mobile
Solutions and Mobile Intelligence.
Note 2 – Basis for preparation / Accounting Policies
The consolidated interim financial statements for the third quarter of 2017 have been prepared in
accordance with IAS 34 “Interim Financial Reporting”. The financial statements should be read in
conjunction with the annual financial statements of the financial year 2016, which have been prepared in
accordance with IFRS as adopted by EU, and the financial statements for the four quarters 2016 that
have been prepared in accordance with IAS 34 “Interim Financial Reporting”. The accounting policies
adopted are consistent with those of the previous financial reporting.
The consolidated financial statements for the third quarter of 2017 were approved by the Board of
Directors of Link Mobility Group ASA on the 8th of November 2017.
The financial statements have not been audited or reviewed by the auditors.
LINK’s presentation currency is Norwegian kroner (NOK), which is also the parent company’s functional
currency. All amounts are stated in NOK 1 000.
Consolidation
The consolidated financial statements show the total financial results and financial position of the parent
company, LINK Mobility Group ASA and its subsidiaries that are 100 percent owned by LINK Mobility
Group ASA, and are fully consolidated in the consolidated financial statement. Subsidiaries acquired in
2017 are included in the consolidated financial statement from the date of closing the transactions.
Global Messaging Solutions SL (GMS) is consolidated in the balance statement as of September 2017,
with no effect on the profit and loss statement in third quarter. Vianett AS is consolidated in the financial
statement from August 2017.

INTERIM REPORT Q3 2017
Mobilizing Your Business
15 / 22
Note 3 – Segment reporting
The tables below show the revenues generated by business segments and operating segment.
Revenues by business segment 3Q 2017 3Q 2016 YTD 2017 YTD 2016 Year 2016
Transactions 255 474 94 445 673 557 265 194 465 339
Direct carrier billing 11 470 10 912 37 107 32 177 53 397
Licenses 28 764 19 788 86 132 55 765 85 763
Consulting 2 401 5 016 11 436 12 083 17 107
Total 298 109 130 161 808 232 365 219 621 606
Direct costs by business segment 3Q 2017 3Q 2016 YTD 2017 YTD 2016 Year 2016
Transactions 194 125 68 493 502 951 188 170 339 352
Direct carrier billing 9 849 6 777 28 968 21 495 36 195
Licenses 4 698 3 278 13 649 9 232 13 171
Consulting 255 1 112 1 124 1 757 2 537
Total 208 926 79 660 546 693 220 654 391 255
Revenues per country (operating segment) 3Q 2017 3Q 2016 YTD 2017 YTD 2016 Year 2016
Norway 122 705 75 076 324 518 227 359 333 954
Sweden 33 063 23 811 98 425 66 939 100 715
Denmark 28 100 29 243 87 474 65 110 100 976
Baltics 1 088 2 031 4 070 5 810 7 948
Germany 69 691 190 473 61 986
Finland 14 695 45 025 16 028
Spain 28 766 58 249 Total 298 109 130 161 808 232 365 218 621 606
Direct costs per country (operating segment) 3Q 2017 3Q 2016 YTD 2017 YTD 2016 Year 2016
Norway 78 539 45 802 199 052 137 238 203 855
Sweden 25 045 15 968 74 719 43 790 69 627
Denmark 15 613 16 424 45 505 35 270 53 977
Baltics 849 1 466 3 139 4 355 5 977
Germany 55 501 148 531 48 813
Finland 8 776 25 496 9 006
Spain 24 605 50 250 Total 208 926 79 660 546 693 220 654 391 255
Adjusted EBITDA by operating segment 3Q 2017 3Q 2016 YTD 2017 YTD 2016 Year 2016
Norway 20 980 5 723 56 956 22 982 50 793
Sweden 1 695 2 003 4 045 6 057 8 327
Denmark 5 456 2 422 13 642 8 832 15 973
Baltics -44 226 82 -272 278
Germany 8 942 20 015 4 629
Finland 2 640 8 316 4 228
Spain 2 845 5 339 Group cost -10 264 -29 207 -16 799
Adjusted EBITDA* 32 249 10 375 79 188 37 599 67 431
*Before share-based compensation, one-off items and expenses related to acquisitions

INTERIM REPORT Q3 2017
Mobilizing Your Business
16 / 22
EBIT by operating segment 3Q 2017 3Q 2016 YTD 2017 YTD 2016 Year 2016
Norway 18 824 -8 958 49 451 -1 530 13 884
Sweden 1 343 692 1 285 3 340 4 951
Denmark 1 426 1 245 7 230 7 347 13 536
Baltics -47 222 74 -283 263
Germany 8 358 18 614 4 015
Finland 2 414 7 651 4 216
Spain 2 439 5 142 Group cost -24 607 -4 011 -67 244 -15 704 -27 685
EBIT 10 151 -11 085 22 203 -6 830 13 180
Note 4 – Related party transaction
There have been no transactions with related parties of significant importance in the period.
Note 5 – Options
Allotment of share options has been consistent with resolutions of LINK’s general meetings, lastly LINK’s
Annual General Meeting on 27 April 2017, which granted the Board of Directors an authority to increase
the share capital of LINK with up to NOK 750 000 in connection with share option programs for
employees in LINK. The authorization is valid until 30 June 2018. Authorization to grant share options is
held by the CEO and the Chairman of the Board of Directors jointly or by the Board of Directors. All
options have an exercise schedule and expired options will lapse without any compensation to the
holder. If the options are exercised, the price per share shall be equal to the agreed strike price. No fees
were paid nor will be paid for the options. In general, share options have a vesting period of 3 years and
the strike price is set in accordance with the value of LINK’s shares as registered on the Oslo Stock
Exchange at the time of signing of the option agreement in question.
If the options are exercised, LINK Mobility Group ASA may choose to issue shares, or to transfer shares
from its own stock of shares, in either case against payment of the strike price specified above. Option
agreements contains provisions regarding the lock up period, and the consequences for remaining share
options in case of a possible termination of employment. There are 851 674 outstanding options to
executive management and other key employees of LINK with the following agreed average strike price:
Average strike price Remaining share options
27.8 133 340
35 66 667
45 383 333
119 16 667
147 16 667
158 50 000
166 185 000
851 674
The fair value of the options is calculated when they are allotted and expensed over the vesting period.
The fair value at grant date is determined using an adjusted form of the Black Scholes Model, that

INTERIM REPORT Q3 2017
Mobilizing Your Business
17 / 22
considers the strike price, the term of the option, the impact of dilution (where material), the share price
at the grant date, expected price volatility of the underlying share and risk-free interest. A cost of NOK
2.5 million (including accrued social security tax) has been charged as an expense for the third quarter.
Note 6 - Long-term liabilities
LINK Mobility Group ASA completed in February 2017 the issuance of EUR 50 million senior secured
bonds in the Nordic bond market. Settlement was on the 24 February 2017, with final maturity the 24
February 2022. The bond issue has a fixed coupon of 4.75 % p. a. The bond issue is booked to
amortized cost. For details regarding LINK's borrowings, see table below:
Bond issue: Amounts in million
Outstanding debt
Currency Amortized cost EUR
Amoritzed cost NOK
Maturity Term Interest Due date interest
Bond issue 50 EUR 48.8 459.2 24.02.2022 5 years 4.75 % Half yearly
Accrued interest bond is classified under short term liabilities bond loan in balance
statement.
Seller’s credit:
Seller’s credit from the acquisition of Vianett, initial amounted to NOK 27.7 million , is paid in equal
quarterly instalments over 24 months period, starting from 1st of October 2017.
Seller’s credit from the acquisition of PSWincom with maturity within 12 months, and quarterly
instalments regarding seller’s credit from the acquisition of Vianett with due date within 12 months are
classified as short term interest bearing debt in balance statement.
Note 7 – Increase in share capital
The total of 280 318 new shares with par value NOK 1 were issued in third quarter 2017, increasing the
share capital from 13 509 338 to NOK 13 789 656.
The Board of Directors decided to increase the share capital with NOK 230 318 by issuing 230 318 new
shares with par value NOK 1 at the price NOK 120.50 per shares at its meeting 15 August 2017. The
shares were issued to the sellers of Vianett AS.
Purpose Outstanding
debt Currency
Outstanding
debt NOK Maturity Term Interest
Due date
interest
Acquisition of PSWinCom 19,8 NOK 19,8 30.12.2017 3 years 5 % Quarterly
Acquisition of Responsfabrikken A/S 16,7 DKK 21,1 29.06.2019 3 years 5 % Quarterly
Acquisition of Linus AS 6,8 NOK 6,8 30.09.2019 3 years 5 % Quarterly
Acquisition of Labyrintti Group 3,0 EUR 28,2 30.09.2019 3 years 5 % Quarterly
Acquisition of Whatever Mobile Group 7,0 EUR 65,8 30.09.2019 3 years 5 % Quarterly
Acquisition of Didimo Group 2,2 EUR 20,6 31.03.2020 3 years 5 % Quarterly
Acquisition of Vianett AS 24,3 NOK 24,3 Specified below Quarterly, 24 months 4,75 % Quarterly
Total 186,6

INTERIM REPORT Q3 2017
Mobilizing Your Business
18 / 22
The Board of Directors decided to increase the share capital with NOK 50 000 by issuing 50 000 new
shares with par value NOK 1 at the price NOK 27.80 per share at its meeting 9 August 2017. The shares
were issued as part of the option program. Pursuant to the share option agreement, 50 000 options were
earned on 30 April 2017, with a strike price of NOK 27.80 and a deadline to subscribe within 30 October
2018. The options were exercised on 9 August 2017.
Note 8 – Business combinations Acquisition of Vianett AS, Norway
Vianett was established in 1998, and acquired Sendega AS in 2014. ViaNett has a total of 1 100 customers in Norway and Sweden. Vianett/Sendega has experienced solid growth during the last years. Fair value of consideration at closing amounted to NOK 83.4 million and was settled as follows: • 1/3 of the purchase price in cash at closing, • 1/3 of the purchase price as sellers' credit to be paid quarterly over 24 months after closing. Interest of
4.75% per annum is to be paid in quarterly arrears, and • 1/3 of the purchase price in LINK shares Details of the fair value of identifiable assets and liabilities acquired, purchase consideration and goodwill based on a provisionary purchase price allocation are as follows: (amounts in NOKk) Book value Adjustment Fair value
Customer relationships 30 302 30 302
Technology 271 9 995 10 266 Defferred tax asset 685 685 Investment in subsidiaries 288 288 Net working capital -6 620 -6 620 Cash and cash equivalents 1 301 1 301
NET ASSETS -4 075 40 297 36 222
Fair value of consideration paid (NOKk)
Cash 27 753 Seller’s credit 27 753 Link shares 27 868
TOTAL CONSIDERATION 83 375
Allocation of purchase price (NOKk)
Equity purchase price 83 375 Book value of equity -15 188
Excess value 68 187
Book value of intangible assets to be allocated 21 879
Excess value to be allocated 90 067
Customer relationships 30 302 Technology 10 266
Sum intangible assets 40 568
Goodwill excl. deferred tax liability 49 598
Deferred tax liability 9 671
TOTAL GOODWILL 59 270

INTERIM REPORT Q3 2017
Mobilizing Your Business
19 / 22
Purchase price allocation (PPA) The above purchase price allocation is a provisional PPA based on the information available at the reporting date for LINK Group for the third quarter. This allocation may be changed in the final PPA based on further information and the final opening balance for Vianett AS.
Acquisition of Global Messaging Solutions SL, Spain
On 28 September 2017, LINK Mobility Group ASA acquired 100 % of the voting equity instruments of Global Messaging Solutions SL (GMS). GMS has a solid position in the Spanish market for mobile messaging services, and is particularly strong on mobile marketing and mobile multi-channel solutions. GMS is located in Madrid, and has 20 employees. The acquisition was completed at a revised purchase price of EUR 15.5 million paid in cash. Details of the fair value of identifiable assets and liabilities acquired, purchase consideration and goodwill based on a provisionary purchase price allocation are as follows: (amounts in NOKk) Book value Adjustment Fair value
Customer relationships 29 123 29 123
Technology 2 819 8 189 11 008 Fixed assets 2 600 2 561
Other financial assets 1 400 1 394 Defferred tax asset 100 88
Net working capital 4 360 4 360 Cash and cash equivalents 10 719 10 719
NET ASSETS 21 999 37 311 59 253
Fair value of consideration paid (NOKk)
Cash 144 626
TOTAL CONSIDERATION 144 626
Allocation of purchase price (NOKk)
Equity purchase price 144 626
Book value of equity -5 418
Excess value 139 208
Book value of intangible assets to be allocated
2 819
Excess value to be allocated 142 028
Customer relationships 29 123
Technology 11 008
Sum intangible assets 40 131
Goodwill excl. deferred tax liability 101 897
Deferred tax liability 9 328
TOTAL GOODWILL 111 225
Purchase price allocation (PPA) The above purchase price allocation is a provisional PPA based on the information available at the reporting date for LINK Group for third quarter. This allocation may be changed in the final PPA based on further information and the final opening balance for GMS.

INTERIM REPORT Q3 2017
Mobilizing Your Business
20 / 22
Note 9 – Non-current assets LINK has depreciated customer relationships recorded in the balance sheet linearly over five years until
third quarter 2016. Based on analysis of customer churn and the remaining useful lifetime of the
customer relationships recorded in the balance sheet, it is assessed to be more than five years from the
acquisition dates. Based on the analysis, LINK has prolonged the depreciation period of the customer
relationships acquisitions to 10 years (from the acquisition date).
Note 10 – Events after the reporting period Possible tap issue of EUR 30 million on bond agreement
At 9 November 2017, LINK will start book building for a tap issue of EUR 30 million on the existing bond agreement. The bond has a EUR 175 million borrowing limit, 5-year, fixed interest of 4.75%. The transaction will be used to provide funding for future acquisitions in line with the acquisition strategy towards 2018.
New share capital
In connection with the acquisition of Voicecom AD, the Board of directors resolved to issue 96 683 new shares in the Company as partial consideration to the sellers of Voicecom. In connection with the acquisition of Comvision Sp. z.o.o., the Board of directors resolved to issue 381 123 new shares in the Company as partial consideration to the sellers of Comvision Sp. z.o.o. Pursuant to the Board's resolution, the Company's new share capital is NOK 14 267 462 divided into 14 267 462 shares, each with a nominal value of NOK 1.
Acquisition of Voicecom AD, Bulgaria
On 2 October 2017, LINK Mobility Group ASA acquired 100 % of the voting equity instruments of Voicecom AD. Voicecom is one of the leading providers of value added mobile services in Bulgaria with a market share of approximately 40%. Voicecom’s offices are located in Sofia, and has 32 employees. The acquisition was completed based on an agreed enterprise value of EUR 3.82 million, on a cash-free and debt-free basis. The enterprise value is based on an adjusted EBITDA of EUR 0.683 million multiplied by a factor of 6. The purchase price under the transaction will, subject to customary adjustments, be settled as follows: • 1/3 of the purchase price in cash upon closing, • 1/3 of the purchase price as sellers' credit to be paid within three years after closing. Interest of 4.75%
per annum is to be paid in quarterly arrears • 1/3 of the purchase price in LINK shares Acquisition of Comvision Sp. Z. o. o., (SMSAPI), Poland
On 12 October 2017, LINK Mobility Group ASA acquired 100 % of the voting equity instruments of Comvision Sp. z o. o., providing services under the brand of SMSAPI. SMSAPI has a strong presence in the Polish market, leading the market for self-service mobile messaging in Poland with a market share of more than 40%. SMSAPI is located in Gliwice, and has 37 employees. The acquisition was completed based on an agreed enterprise value of EUR 16 million on a cash-free and dept-free basis. The enterprise value is based on an estimated EBITDA for 2017 of EUR 2.66 million multiplied by a factor of 6. The purchase price under the transaction will, subject to customary adjustments, be settled as follows: • 40% of the purchase price in cash upon closing • 34% of the purchase price to be held on escrow to be released in equal installments 6 and 18 months
after closing • 26% of the purchase price in LINK shares

INTERIM REPORT Q3 2017
Mobilizing Your Business
21 / 22
Acquisition of Netmessage SARL, France
On 31 October 2017, LINK Mobility Group ASA completed the acquisition of 100 % of the voting equity instruments of Netmessage SARL located in Paris. Netmessage has a strong position in the French market, and is one of the leading mobile messaging and marketing providers in France. The agreed enterprise value of the transaction is EUR 9.9 million, on a cash -free and debt-free basis and assuming a normalized level of working capital. The enterprise value is based on a normalized EBITDA of EUR 1.65 million multiplied by a factor of 6. The purchase price under the transaction will, subject to customary adjustments, be settled as follows: • 70% of the purchase price in cash upon closing • 15% of the purchase price as sellers' credit to be paid in two equal installments 6 and 12 months after
closing. Interest of 4.75% per annum is to be paid in quarterly arrears • 15% of the purchase price to be held on escrow and released in equal instalments 6 and 12 months
after closing
Definitions
Alternative Performance Measures (“APM’s”)
The European Securities and Markets Authority (ESMA) has issued guidelines on Alternative
Performance Measures (“APMs”) for listed issuers effective from 3 July 2016. An APM is a financial
measure of historical or future financial performance, financial position, or cash flows, other than a
financial measure defined or specified in the applicable financial reporting framework.
In this, the Group presents certain alternative performance measures (“APMs”), including EBIT, EBITDA,
adjusted EBITDA and adjusted EBITDA margin. The Group believes that APMs such as EBIT and
EBITDA are commonly reported by companies in the markets in which it competes and are widely used
by investors in comparing performance on a consistent basis without regard to factors such as
depreciation and amortization, which can vary significantly, depending upon accounting methods
(particularly when acquisitions have occurred) or based on non-operating factors. Below follows a short
description of these APMs:
EBIT means Earnings Before Interest and Taxes. EBIT is a performance measure applied to express
profitability of operating activities. EBIT is presented in note 3 “Segment reporting”.
EBITDA means Earnings Before Interest, Taxes, Amortization, Depreciation and Impairments. LINK
Mobility has presented EBITDA in the consolidated statement of profit and loss because management
believes that the measure provides useful information regarding the Group’s ability to service debt and to
fund capital expenditures and provides a helpful measure for comparing its operating performance with
other companies.
Adjusted EBITDA means EBITDA deducted by expenses related to share-based compensation and
acquisitions incl. restructuring cost. LINK Mobility has presented adjusted EBITDA in the consolidated
statement of profit and loss because management believes the measure provides useful information
regarding operating performance.
Adjusted EBITDA margin is presented as adjusted EBITDA as a percentage of operating revenues in the
respective periods.

LINK Mobility Group ASA
Langkaia 1
0150 Oslo, Norway
IR Contact Thomas Berge Email: [email protected]
Mobile phone: +47 41 31 90 28