Embed Size (px)
Citation preview
RICARDO LUÍS CARVALHO MONTEIRO
Licenciado em Química, Minor em Biologia pela Faculdade de Ciências da Universidade de Lisboa
LINK BETWEEN VIRAL INFECTION AND AUTOIMMUNITY IN PRIMARY
SJÖGREN’S SYNDROME: CLUES FROM LYMPHOCYTIC PROFILE AND EBV
ANTIBODIES
DISSERTAÇÃO PARA OBTENÇÃO DO GRAU DE MESTRE
EM BIOQUÍMICA PARA A SAÚDE
Orientador: Catarina Gregório Martins, PhD, Faculdade de Ciências Médicas da Universidade Nova de Lisboa
Co-orientador: Luís Miguel Borrego, MD, PhD, Faculdade
de Ciências Médicas da Universidade Nova de Lisboa
Setembro 2018
Ricardo Luís Carvalho Monteiro
Licenciado em Química, Minor em Biologia pela Faculdade de Ciências da Universidade de Lisboa
Link between viral infection and autoimmunity in primary Sjögren’s Syndrome: clues from lymphocytic
profile and EBV antibodies
Dissertação para obtenção do grau de Mestre em Bioquímica para a Saúde
Orientador: Catarina Gregório Martins, PhD, Faculdade de Ciências Médicas da Universidade Nova de Lisboa
Co-orientador: Luís Miguel Borrego, MD, PhD, Faculdade
de Ciências Médicas da Universidade Nova de Lisboa Júri: Presidente: Prof. Doutor António Sebastião Rodrigues – Coordenador do Mestrado, Professor Auxiliar da Faculdade de Ciências Médicas | NOVA Medical School da Universidade NOVA de Lisboa Arguente: Prof. Doutor Artur Augusto Paiva – Professor Adjunto da Escola Superior de Tecnologia da Saúde de Coimbra Vogal: Profª. Doutora Ana Catarina Silva Gregório da Costa Martins – Professora Auxiliar Convidada da Faculdade de Ciências Médicas | NOVA Medical School da Universidade NOVA de Lisboa Vogal: Profª. Doutora Maria Teresa Nunes Mangas Catarino - Professora Auxiliar da Faculdade de Ciências e Tecnologias da Universidade NOVA de Lisboa
Faculdade de Ciências Médicas da Universidade Nova de Lisboa
Setembro 2018

i
‘An intelligent heart acquires knowledge, and the ear of the wise seeks knowledge.’
Book of Proverbs 18.15
ii
Bibliographic elements resulting from this dissertation
Poster
Filipe Barcelos, Catarina Martins, Ricardo Monteiro, Glória Nunes, Teresa Lopes,
Luis Miguel Borrego Follicular CD8 T cells: correlation with circulating B cells
and disease activity in primary Sjögren's Syndrome, XX Congresso Português de
Reumatologia, May 2018 poster presentation.
Ricardo Monteiro, Catarina Martins, Filipe Barcelos, Glória Nunes, Teresa Lopes,
Luís Miguel Borrego. Follicular CD8 T cells in primary Sjögren's Syndrome:
clues for viral aetiology? SPI'44 XLIV Anual Meeting - Sociedade Portuguesa de
Imunologia, June 2018, poster presentation.
Oral communications
Ricardo Monteiro, Catarina Martins, Filipe Barcelos, Glória Nunes, Teresa Lopes,
Luís Miguel Borrego. Follicular helper and follicular cytotoxic T cells in primary
Sjögren’s Syndrome: clues for an abnormal antiviral response as a pathogenic
mechanism, 3rd CiiEM International Congress, June 2018 oral communication.
Published extended abstracts
Ricardo Monteiro, Catarina Martins, Filipe Barcelos, Glória Nunes, Teresa Lopes,
Luís Miguel Borrego. Follicular helper and follicular cytotoxic T cells in primary
Sjögren’s Syndrome: clues for an abnormal antiviral response as a pathogenic
mechanism, Annals of Medicine, June 2018, extended abstract accepted for
publication.

iii
Agradecimentos
Quero demonstrar o meu sincero agradecimento a todos os que tornaram possível a escrita
desta tese e todo o trabalho que possibilitou a elaboração deste pedaço de conhecimento
científico que, embora talvez seja uma pequena contribuição, pode ser um passo importante
na compreensão de uma síndrome que afeta milhares de pessoas por todo o mundo.
Em primeiro lugar, é a essas pessoas, as pacientes de Síndrome de Sjögren, a quem quero
dirigir o meu primeiro agradecimento e às quais dedico este trabalho. A todas as mulheres
que se ofereceram para participar neste estudo e, dessa forma, contribuíram para o avanço do
conhecimento nesta área.
Quero agradecer a minha orientadora, a Profª Doutora Catarina Martins, cuja dedicação,
competência, conhecimento, amabilidade e disponibilidade foram indispensáveis para que
este trabalho acontecesse.
Agradeço ao Prof. Doutor Luís Miguel Borrego pelo seu sempre pertinente insight e pela
paixão contagiante pela imunologia.
Ao Dr. Filipe Barcelos os meus agradecimentos pelo apoio prestado e pela perseverante
curiosidade e vontade de descobrir.
Uma palavra especial para as companheiras de laboratório, a Ionela, a Teresa e a Glória cuja
companhia e auxílio na bancada não foram apenas trabalho, mas muitas vezes partilha de
experiências e histórias que ficarão comigo.
Quero deixar um agradecimento muito especial à minha noiva, Diana Carvalho. Sem o teu
encorajamento, esta tese não seria escrita. Ouviste-me muitas vezes quando te falava sobre
imunologia, citometria de fluxo, autoimunidade, virologia e tantos outros temas que fui
ganhando paixão. Ouviste muitos “…hoje não posso…” para que este trabalho acontecesse.
Estiveste ao meu lado a cada passo, e é por isso e muito mais que te amo.

iv
Ao meu pai e ao meu irmão, que sempre estão lá para me apoiar e encorajar- Obrigado!
Também pelas perguntas que faziam sobre o que estava a fazer que me obrigavam a elaborar
sobre o trabalho e, consequentemente, aumentavam a minha compreensão do trabalho.
Quero agradecer aos coordenadores do curso de mestrado em Bioquímica para a Saúde que
estiveram mais presentes durante este processo - a Prof. Doutora Teresa Catarino e ao Prof.
Doutor António Sebastião Rodrigues, pela constante disponibilidade e auxílio.
Por último, quero agradecer a Deus. Por me dar este privilégio de estudar e aprender. Pela
oportunidade e alegria que é produzir ciência para benefício da vida de muitos. Pelo prazer
da curiosidade e da descoberta, do qual muito pude experimentar durante a elaboração desta
tese.
Obrigado.
v
Abstract
Primary Sjögren’s Syndrome (pSS) is a chronic systemic autoimmune disease characterized
by lymphocytic infiltration of the exocrine glands, predominantly the salivary and lachrymal
glands, leading to damage and secretory impairment. It occurs mainly in women, with ratios
of incidence female/male are between 10:1 and 20:1. Women over 50 years of age are the
most affected. The main symptoms of this condition are xerostomia (dry mouth),
keratoconjunctivitis sicca (ocular dryness with corneal damage), and dryness of other
mucosal surfaces (skin, vagina and respiratory epithelium). Extraglandular manifestations
frequently occur, especially inflammatory articular and cutaneous manifestations, as well as
less common and more serious involvement such as neuropathy, nephritis, vasculitis or
lymphoma. Several viruses have been associated with pSS. Epstein-Barr virus (EBV) has
been a strong candidate for the triggering of autoimmune epithelitis occurring in pSS. There
isn’t, however, an established viral trigger for SS autoimmune epithelitis. Our study revealed
a lymphocytic profile indicating B cell hyperactivity, Breg impairment and T cell alterations,
namely in circulating T cells with follicular-like phenotype. These changes can be attributed
to an underlying viral agent triggering an unregulated response. Indeed, pSS patients
presented a higher percentage of positive serum for anti-EBV EA-D IgG, which might point
towards a role of EBV in pSS. Still, more work is required to establish a definite viral trigger
for pSS. Adding to this study, more antiviral Abs can be assessed, namely, against CMV,
human T-lymphotropic virus (HTLV), HCV and others. We call the attention towards
follicular T cell subsets for a possible link between viral infection and pSS. More studies
using animal models can be paramount in the understanding of follicular T cells roles in both
contexts and identify similar mechanisms and differentiation patterns and a breakdown of
tolerance mechanisms.
vi
Resumo
A Síndrome de Sjögren primária (pSS) é uma doença sistémica autoimune caracterizada pela
presença de infiltrados linfocitários nas glândulas exócrinas, predominantemente nas
glândulas salivares e lacrimais. Ocorre principalmente em mulheres, onde os rácios de
incidência feminino/masculino estão entre 10:1 e 20:1. Mulheres com mais de 50 anos de
idade são mais afetadas. Os sintomas principais desta condição são: xerostomia (boca seca),
keratoconjuctivitis sicca (secura dos olhos com inflamação), e secura de outras superfícies
mucosas (pele, vagina e epitélio do aparelho respiratório). Vários vírus têm sido associados
à pSS. O vírus Epstein-Barr (EBV) tem sido um forte candidato para o despoletar da epitelite
autoimune presente na pSS. No entanto, não existe um causador viral estabelecido da epitelite
autoimune em pSS. O presente estudo demonstrou um perfil linfocítico que indica
hiperatividade da célula B, limitação da célula Breg e alterações na célula T, nomeadamente
nas células T circulantes que possuem um fenótipo caracteristicamente folicular. Estas
alterações podem apontar para a existência de um agente viral subjacente causador de uma
resposta imune desregulada, uma vez que alterações semelhantes estão presentes num
contexto de infeção viral. De facto, pacientes com pSS apresentam uma percentagem
aumentada de soros positivos de IgG anti-EBV EA-D, que poderá apontar para o
envolvimento do EBV na pSS. Assim, é necessário mais trabalho para estabelecer um
causador viral em pSS. Para acrescentar a este estudo, mais anticorpos para antivirais podem
ser avaliados, nomeadamente, anti-citomegalovirus, anti-vírus T linfotrópico humano, anti-
hepatite C entre outros. Chamamos a atenção para as células T foliculares para uma possível
ligação entre infeção viral e pSS. Estudos adicionais com modelos animais podem ser
cruciais na compreensão do papel destas células em ambos os contextos e identificação de
mecanismos e padrões de diferenciação similares e a falha dos mecanismos de tolerância.
vii
Table of Contents
BIBLIOGRAPHIC ELEMENTS RESULTING FROM THIS DISSERTATION........ II
AGRADECIMENTOS ...................................................................................................... III
ABSTRACT .......................................................................................................................... V
RESUMO ............................................................................................................................ VI
TABLE OF CONTENTS ................................................................................................. VII
FIGURES INDEX .............................................................................................................. IX
TABLES INDEX ................................................................................................................ XI
ABBREVIATIONS ........................................................................................................... XII
1. CHAPTER 1 – INTRODUCTION .............................................................................. 1
1.1. Immunology overview ............................................................................................ 1
1.1.1. Innate and adaptive immunity ......................................................................... 1
1.1.2. Lymphocytes and membrane markers ............................................................ 2
1.1.1. Germinal centres ............................................................................................. 5
1.1.2. Cytokines and antibodies ................................................................................ 6
1.2. Sjögren’s Syndrome (SS) ........................................................................................ 8
1.1.3. General features .............................................................................................. 8
1.1.4. Lymphocytic distribution in pSS .................................................................. 10
1.1.5. Pathophysiology ............................................................................................ 11
1.1.6. Etiopathogenesis ........................................................................................... 11
1.1.7. Viral infections and Sjögren’s Syndrome ..................................................... 12
1.3. Objectives ............................................................................................................. 14
2. CHAPTER 2 – MATERIALS AND METHODS..................................................... 15
2.1 Patients .................................................................................................................. 15
2.2 Flow cytometry ..................................................................................................... 16
2.3 T cell characterization ........................................................................................... 17
viii
2.4 T cell functional assay .......................................................................................... 18
2.5 B cell characterization .......................................................................................... 22
2.6 Anti-Epstein-Barr virus Abs ................................................................................. 26
2.7 Statistics ................................................................................................................ 28
3. CHAPTER 3 - RESULTS AND DISCUSSION ....................................................... 29
3.1 Demographic and clinical data of patient groups and HC assessed for B and T
cell subsets ........................................................................................................................ 29
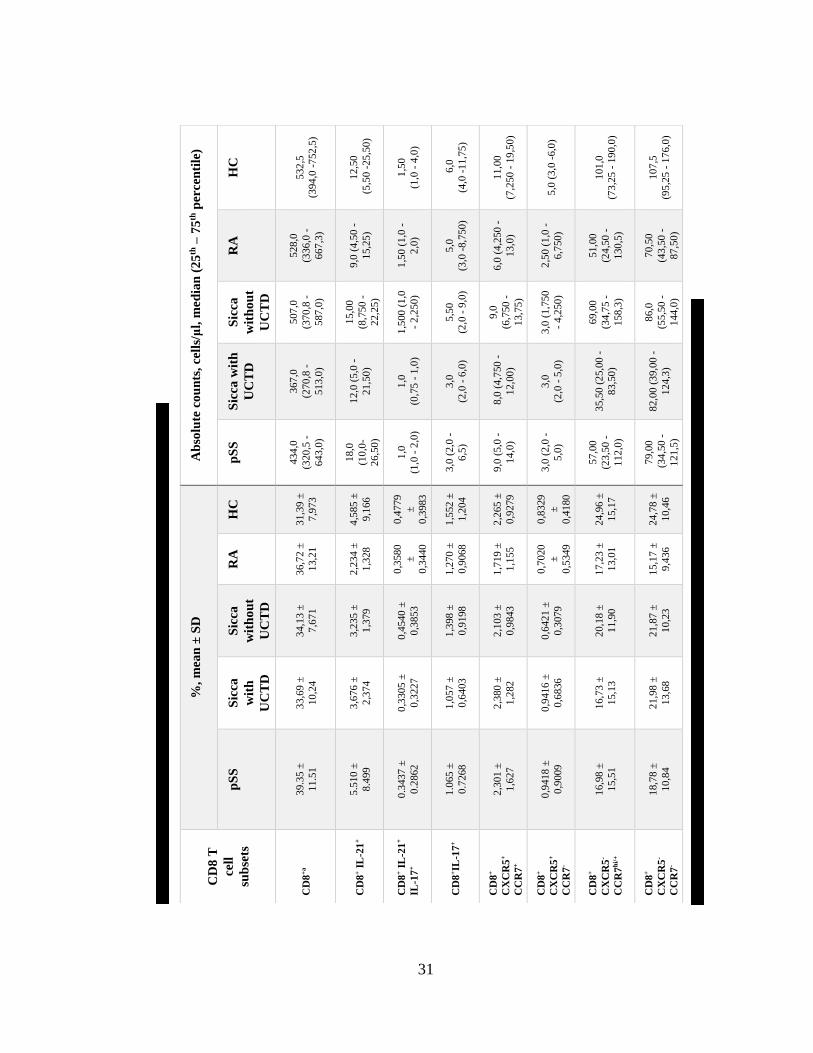
3.2 T cell subsets ......................................................................................................... 30
3.2.1 Percentages and absolute values of T cell subsets ............................................ 30
3.2.2 CD4 T cell subsets in pSS patients ................................................................... 32
3.2.3 Positive correlation between IL-21+ CD4 and CXCR5+ CD4 T cells .............. 33
3.2.4 CD8 T cell subsets in pSS................................................................................. 35
3.3 B cell subsets ........................................................................................................ 39
3.3.1 Percentages and absolute values of B cell subsets ............................................ 39
3.3.2 Alterations in B cell subsets in pSS patients: the IgD/CD27 classification ...... 41
3.3.3 Alterations in B cell subsets in pSS: the Bm1-5 classification ......................... 44
3.3.4 Plasmablasts and Breg subsets in pSS patients ................................................. 48
3.4 EBV serologic markers in pSS patients ................................................................ 52
3.4.1 Demographic data ............................................................................................. 52
3.4.2 Anti-EBV EA-D IgG ........................................................................................ 53
3.4.3 Anti-EBV EA-D IgA ........................................................................................ 54
3.4.4 Anti-EBV CA IgG ............................................................................................ 54
3.4.5 Anti-EBV CA IgA ............................................................................................ 55
3.4.6 Anti-EBV-CA IgM ........................................................................................... 55
3.4.7 Anti-EBNA IgG ................................................................................................ 56
3.4.8 Summary ........................................................................................................... 57
4. CHAPTER 4 - DISCUSSION AND CONCLUSIONS ............................................ 59
5. BIBLIOGRAPHIC REFERENCES ......................................................................... 66
ix
Figures Index
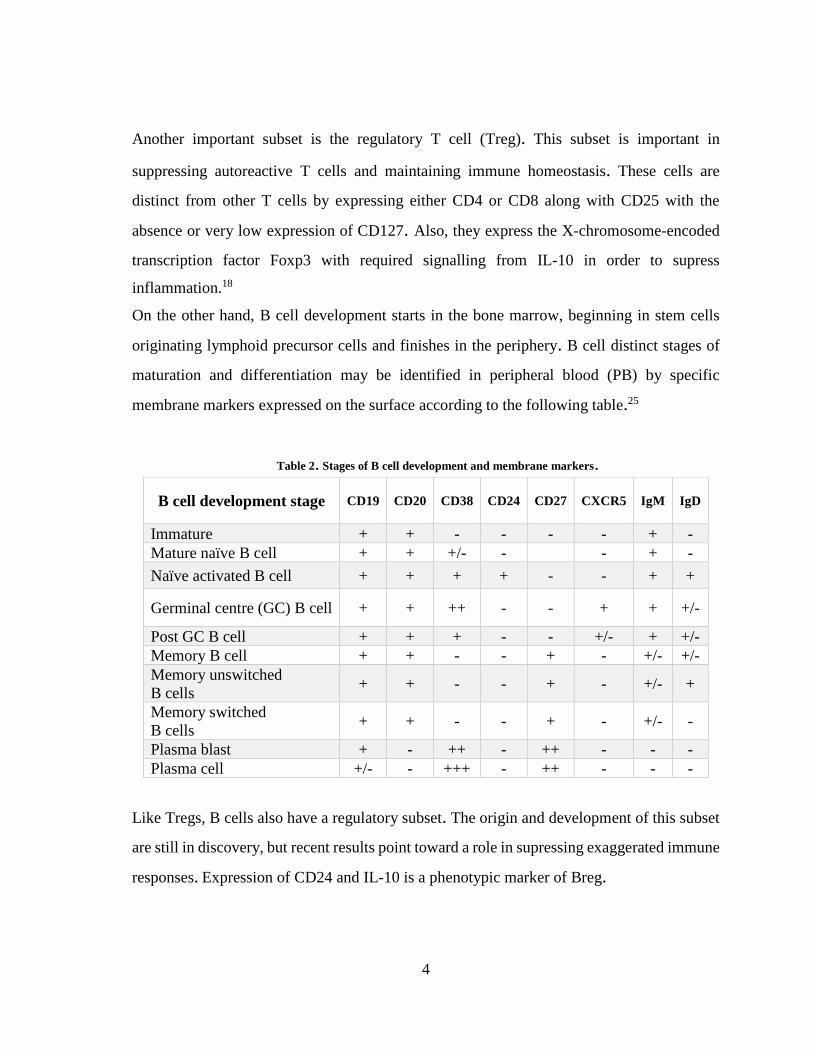
Figure 1. B cell development with highlighted subsets that might include regulatory B
cells. ................................................................................................................................. 5
Figure 2. Immunoglobulin general structure, showing L and H chains. ......................... 7
Figure 3. Main symptoms of Sjögren's Syndrome ............................................................. 9
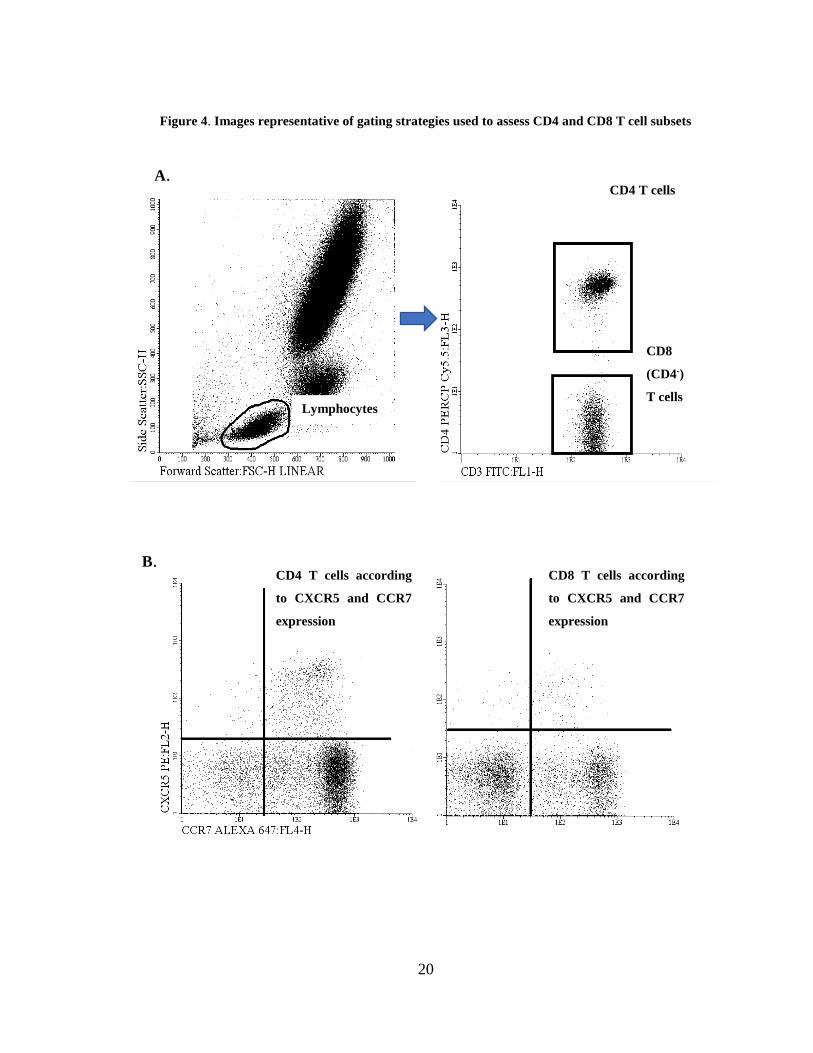
Figure 4. Images representative of gating strategies used to assess CD4 and CD8 T cell
subsets ........................................................................................................................... 20
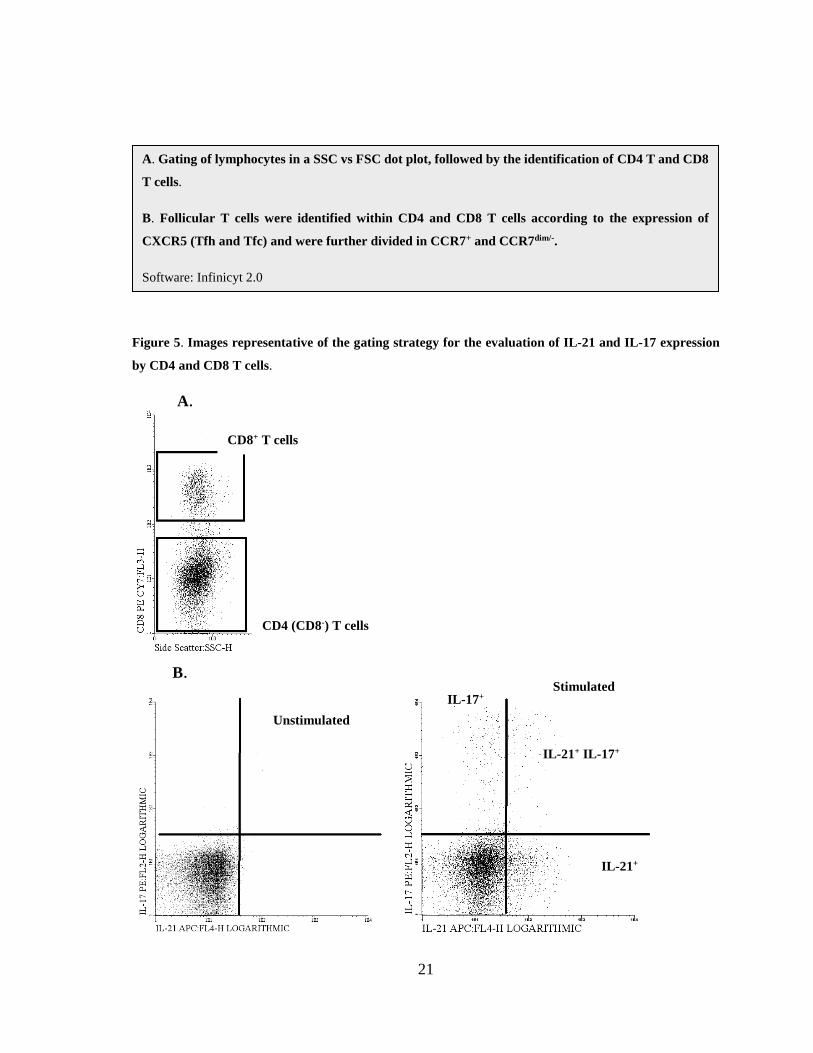
Figure 5. Images representative of the gating strategy for the evaluation of IL-21 and
IL-17 expression by CD4 and CD8 T cells. ............................................................... 21
Figure 6. Gating strategies used to assess B cell subsets. ................................................ 24
Figure 7. Circulating CD4 T cells in the groups of patients studied .............................. 32
Figure 8. Circulating CXCR5+ CD4 T cells in the groups of patients studied .............. 33
Figure 9. IL-21-secreting cells in pSS patients ................................................................. 34
Figure 10. Correlation of IL-21+ CD4 T cells with CXCR5+ CCR7dim/- CD4 T cells in
pSS. ............................................................................................................................... 35
Figure 11. Circulating CD8 T cells in the groups of patients studied ............................ 36
Figure 12. Percentages of CXCR5- CCR7hi and CXCR5- CCR7+ CD8 T cells .............. 36
Figure 13. Circulating IL-21+ CD8 T cells in the groups of patients studied ................ 37
Figure 14. cTfc cells and disease activity in pSS ............................................................. 38
Figure 15. Percentages and absolute values of naïve B cells ........................................... 41
Figure 16. Percentages and absolute values of memory B cells ...................................... 42
Figure 17. Percentages and absolute values of memory unswitched B cells ................. 43
Figure 18. Percentages and absolute values of memory switched B cells. ..................... 44
Figure 19. Percentages and absolute value of Bm1 cells ................................................. 45
Figure 20. Percentages and absolute value of Bm2 cells ................................................. 46
Figure 21. Percentages and absolute values of Bm2’ cells. ............................................. 47
Figure 22. Percentages and absolute values of eBm5 cells. ............................................. 47
Figure 23. Percentages and absolute values of Bm5 cells ................................................ 48
x
Figure 24. Percentages and absolute values of IgM+/- CD38hi plasmablasts.................. 49
Figure 25. Percentages and absolute value of CD24+ CD27+ Breg cells. ....................... 50
Figure 26. Percentages and absolute values of CD24+ CD38hi Breg. ............................. 51
Figure 27. Calibration curve for anti-EBV EA-D IgG .................................................... 53
Figure 28. Calibration curve for anti-EBV CA IgG ........................................................ 54
Figure 29. Calibration curve for anti-EBNA IgG ............................................................ 56
xi
Tables Index
Table 1. Surface molecules expressed in T cells subsets. ................................................... 3
Table 2. Stages of B cell development and membrane markers. ...................................... 4
Table 3. EBV serology used to determine stage of infection. .......................................... 13
Table 4. Monoclonal Abs used in this study ..................................................................... 17
Table 5. Tube panel 1 for follicular T cell characterization ........................................... 18
Table 6. Tube panel for T cell IL-21 and IL-17 expression ............................................ 18
Table 7. Tube panel for B cell characterization ............................................................... 22
Table 8. Abs assessed with ELISA .................................................................................... 26
Table 9. Patient groups and HC demographic data. ....................................................... 29
Table 10. Percentages and absolute values of CD4 T cell subsets. ................................. 30
Table 11. Percentages and absolute values of CD8 T cell subsets. ................................. 31
Table 12. Percentages and absolute values of B cell subset. ........................................... 39
Table 13. Percentages (relative to total B cells) and absolute values of Bm1-Bm5 cells.
....................................................................................................................................... 40
Table 14. pSS, RA patients and HC assessed for EBV Ab demographic data. ............. 52
Table 15. Results for Anti-EBV EA-D IgG....................................................................... 53
Table 16. Results obtained for anti-EBV EA-D IgA ........................................................ 54
Table 17. Results for Anti-EBV CA IgG........................................................................... 55
Table 18. Results obtained for anti-EBV CA IgA ............................................................ 55
Table 19. Results obtained for anti-EBV CA IgM ........................................................... 55
Table 20. Results obtained for anti-EBNA IgG ............................................................... 56
Table 21. Summary of results obtain for all positive anti-EBV Ab and p-values for
differences among groups. .......................................................................................... 57
xii
Abbreviations
ºC - Celsius
μL – microlitre
Ab – antibody
ADCC – antibody dependent cell-mediated cytotoxicity
AECG - American-European Consensus Group
Ag - antigen
APC – allophycocyanin
BAFF – B cell activating factor
BCR – B cell receptor
Breg – regulatory B cells
CA – capsid antigen
CCL – chemokine ligand
CCR – CC chemokine receptor
CD – cluster of differentiation
CNS - central nervous system
Cy5.5 - cyanine5.5
cTfc – circulating follicular cytotoxic T cell
cTfh – circulating follicular helper T cells
CXCR – CXC chemokine receptor
DC – dendritic cell
DN – double-negative
EA-D – diffuse early antigen
EBNA – Epstein-Barr natural antigen
EBV – Epstein-Barr virus
ELISA – enzyme-linked immunosorbent assay
eSS – secondary Sjögren’s Syndrome
ESSDAI – European League Against Rheumatism (EULAR) Sjögren’s Syndrome Disease
Activity Index
xiii
EULAR – European League Against Rheumatism
FACS – Fluorescence Activator Cell Sorter
FBS – foetal bovine serum
FITC - fluorescein isothiocyanate
FL – fluorescence channel
FMO – fluorescence minus one
FoxP3 – forkhead box protein 3
FSC – forward scatter
GC – germinal centre
HC – healthy controls
IFN – interferon
Ig – immunoglobulin
IL – interleukin
LPS – lipopolysaccharide
MHC – major histocompatibility complex
mL – millilitre
mm – millimetre
NA – not applicable
NK – natural killer
PAMP – pathogen associated molecular patterns
PB – peripheral blood
PCR – polymerase chain reaction
PE – phycoerythrin
PerCP - peridinin chlorophyll protein complex
PMA – phorbol 12-myristate 13-acetate
PNS – peripheral nervous system
PRR – pattern recognition receptors
pSS – primary Sjögren’s Syndrome
RA – rheumatoid arthritis
RNA – ribonucleic acid
xiv
RU – relative units
SD – standard deviation
SLE – systemic lupus erythematosus
SLO – secondary lymphoid organs
SS – Sjögren’s syndrome
SSA - Sjögren’s-syndrome-related antigen A
SSB - Sjögren’s-syndrome-related antigen B
SSC – side scatter
TCR – T cell receptor
Tfc – cytotoxic follicular T cell
Th – helper T cell
Tfh – follicular helper T cell
Treg – regulatory T cell
UCTD – undifferentiated connective tissue disease
1
1. Chapter 1 – Introduction
1.1. Immunology overview
1.1.1. Innate and adaptive immunity
The human immune system is responsible for defending the organism from harmful
invaders such as viruses, bacteria and macromolecules.44 It can also protect the organism
from internal threats such as cancer cells.1 Human immunity is divided into innate (also
called non-specific) and adaptive (specific) immunity.36 Innate immunity is the first barriers,
such as the skin and the mucosal epithelia. It prevents microbes from establishing infections,
as well as providing an immediate response if the microbes can penetrate the first barriers of
defence (skin, stomach high acidity, mucosal secretions, etc). Innate responses are mediated
by cells like the granulocytes (basophils, neutrophils, eosinophils and mast cells), phagocytes
(monocytes/macrophages and also neutrophils) and natural killer (NK).44 Pathogen
associated molecular patterns (PAMP) from the invading microorganisms are detected by
pathogen recognition receptors (PRR) present in immune cells and in soluble form in the
serum and other body fluids.3 PAMPs are essential molecules of the microorganism, like
double-stranded RNA, lipopolysaccharide (LPS), lipoproteins and carbohydrates. Innate
immunity acts by recognizing these general molecular structures common to a group of
related microbes and is unable to distinguish between different types of microbes.2 The time
of response and efficacy of threat elimination is practically unchanged, even with repeated
invasion.
Adaptive immunity responds to microbial invaders in a specific manner and the time and
effectiveness of response improves each time a specific invader is encountered. This type of
immunity is capable of defending the organism against a large number of microbes and
establishing immunological memory, which allows for a more effective response in a second
exposure to a given pathogen.14 The adaptive immune response also adapts to better respond
to an invading pathogen, increasing its recognition and elimination effectiveness. Adaptive
immunity can be divided into humoral immunity and cell-mediated immunity. The cells
2
responsible for humoral immunity are the B cells, which are produced and matured in the
bone marrow. These cells that produce and release antibodies which are the mediators of
humoral immunity recognize microbial antigens (Ags) and opsonize them for posterior
destruction by various mechanisms.27
These cells, when activated become plasmablasts, that produce and release the antibodies
(Abs) in humoral responses.27 Cell-mediated immunity aims for the destruction of cells
infected with intracellular microbes, such as virus and some bacteria. This is carried out by
cytotoxic T cells which are lymphocytic cells produced in the bone marrow, but their
maturation occurs in the thymus. Also, another type of T cells are the helper T cells, whose
function is to provide stimuli to B cells.44
Though distinct in terms of mechanisms and effector cells, innate and adaptive
immune responses establish constant and diverse interactions. For instance, innate immune
cells play a significant role in messaging adaptive response cells, and promote the recruitment
of lymphocytes to sites of infection.
1.1.2. Lymphocytes and membrane markers
In immune responses, B and T cells interact with other immune players through membrane
receptors. The B cell receptor (BCR) and the T cell receptor (TCR) are surface complexes
present in B cells and T cells, respectively. In T cells, the TCR function is to bind an Ag
presented by the major histocompatibility complex (MHC) molecules, expressed in the
surface of Antigen-Presenting cells (APC).38 However, this interaction between the TCR and
the Ag:MHC complex is weak, and the binding affinity is enhanced by co-receptors.54 Two
major subsets of T cells are distinguished within T cells, according to the type of co-receptor
they express: CD4+ and CD8+ T cells. CD4+ T cells - the helper T cells (Th) - are responsible
for stimulating differentiation and proliferation of antibody-producing B cells, binding to the
Ag presented by the MHC class II molecules.72 Also, they engage in cytotoxic T cell
activation and help macrophages in their phagocytic activity.44,96 Th cells can be further
divided in specific subgroups such as Th1, Th2, Th17, Th17/Th1-like, Treg (regulatory T cells)
3
and Tfh (follicular helper T cells), which are distinguished by the type of cytokines and
surface markers that they express.8
CD8+ T cells are cytotoxic cells responsible for cell-mediated immunity and bind to the Ag
presented in MHC class I.72 Both types of T cells express yet another receptor, CD28, that
works as a co-stimulator.13,91 The interaction between CD28 present on T cells and CD80/86
(B7.1 and B7.2) on APCs is essential for T cell activation and survival.41,46 T cells originate
in a bone marrow cellular precursor that migrates to the thymus where development to mature
T cells occurs. 26,63
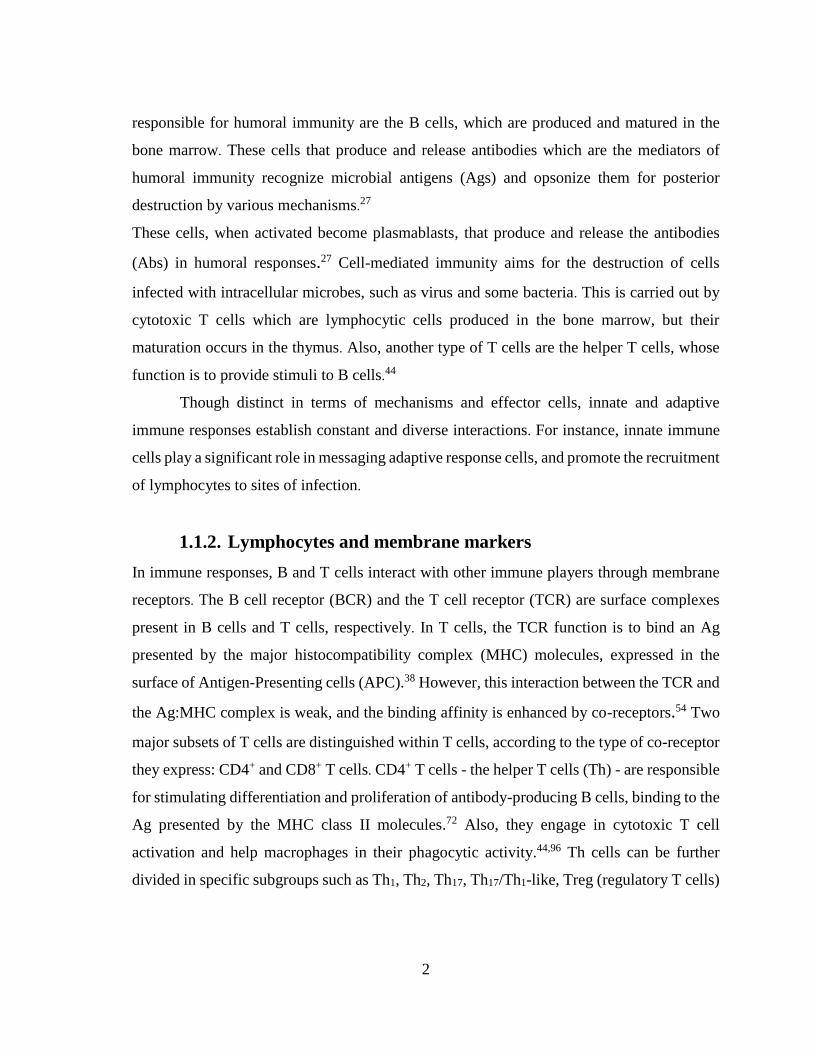
Table 1. Surface molecules expressed in T cells subsets.
During maturation, T cells go through several stages of development in the thymic cortex.
After the thymic maturation, T cells can be categorized in different subsets: naïve, effector
and memory. T memory cells can be further subdivided in central memory cells and
peripheral memory cells. Follicular T cells express specific B cell follicle-homing chemokine
receptors that induce their migration to B cell sites in secondary lymphoid organs (SLO).
There, these T cells will provide B cell help by inducing specific antibody produced by
plasma cells. The different T cell subsets differ in the expression of membrane markers
according to the table above.82
T cell
subsets CCR7 CXCR5 CD4 CD8
Naïve + - + -
Effector + - + -
Central
memory + - - -
Peripheral
memory + - - -
Follicular T
cells - + +/- +/-
T helper 1 - - + -
T helper 17 - - + -
4
Another important subset is the regulatory T cell (Treg). This subset is important in
suppressing autoreactive T cells and maintaining immune homeostasis. These cells are
distinct from other T cells by expressing either CD4 or CD8 along with CD25 with the
absence or very low expression of CD127. Also, they express the X-chromosome-encoded
transcription factor Foxp3 with required signalling from IL-10 in order to supress
inflammation.18
On the other hand, B cell development starts in the bone marrow, beginning in stem cells
originating lymphoid precursor cells and finishes in the periphery. B cell distinct stages of
maturation and differentiation may be identified in peripheral blood (PB) by specific
membrane markers expressed on the surface according to the following table.25
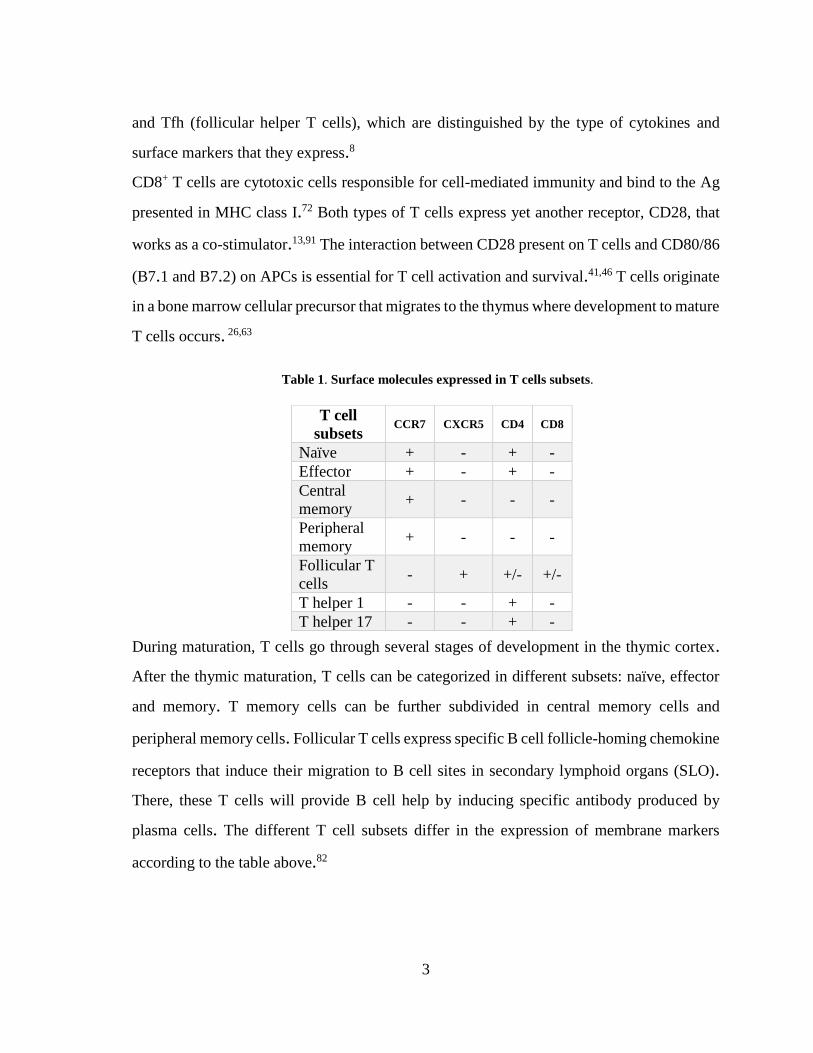
Table 2. Stages of B cell development and membrane markers.
Like Tregs, B cells also have a regulatory subset. The origin and development of this subset
are still in discovery, but recent results point toward a role in supressing exaggerated immune
responses. Expression of CD24 and IL-10 is a phenotypic marker of Breg.
B cell development stage CD19 CD20 CD38 CD24 CD27 CXCR5 IgM IgD
Immature + + - - - - + -
Mature naïve B cell + + +/- - - + -
Naïve activated B cell + + + + - - + +
Germinal centre (GC) B cell + + ++ - - + + +/-
Post GC B cell + + + - - +/- + +/-
Memory B cell + + - - + - +/- +/-
Memory unswitched
B cells + + - - + - +/- +
Memory switched
B cells + + - - + - +/- -
Plasma blast + - ++ - ++ - - -
Plasma cell +/- - +++ - ++ - - -
5
As for the BCR, it consists of a membrane immunoglobulin complex whose function is to
bind to an Ag, leading to the initiation of a cascade of intracellular signalling. Then, the B
cell internalizes the Ag and further processes it to be presented in the membrane through
MHC class II and bind to the TCR in helper T cell. This binding of the Ag presented by the
B cell to the TCR of helper Th cells TCR will stimulate the differentiation and proliferation
of B cells. Like the T cells, the BCR also requires co-receptors, namely CD19, CD21 and
CD81, that participate in the signal transduction cascade.
1.1.1. Germinal centres
Figure 1. B cell development with highlighted subsets that might include regulatory B cells.
Adapted from Miyagaki et al. (2015).
Furthermore, subsets with regulatory functions have been identified in B cells.64 These
regulatory B cells (Bregs) are supposed to play a role in the suppression exaggerated immune
responses.49 A consensual phenotype/marker for Bregs has not been identified so far, thus
their origin and development are still unclear. Expression of CD24 and CD38 are markers
of Bregs.32 The production of IL-10 is also considered an important functional marker of
Breg.23
6
1.1.2. Cytokines and antibodies
Communication between immune cells is essential for an effective response against invading
agents. Cytokines are small molecules that participate in these processes. These molecules
potentially secreted by almost all types of cells and bind to specific receptors in target cells,
leading to an alteration of enzyme activity and gene expression of that cell. Cytokines can
regulate the duration and intensity of an immune response. Many physiological processes
require the action of cytokines like wound healing, haematopoiesis, induction of
inflammatory response and cellular and humoral immunity.
Antibodies (Abs) are another important set group of immunological proteins are the Abs,
also designated as immunoglobulins (Igs). These glycoproteins, which are present in serum,
are secreted by plasma cells and are responsible for the neutralization and opsonization for
posterior phagocytosis of foreign microbial agents. Also, they participate in complement
system activation and antibody-dependent cell-mediated cytotoxicity (ADCC).44
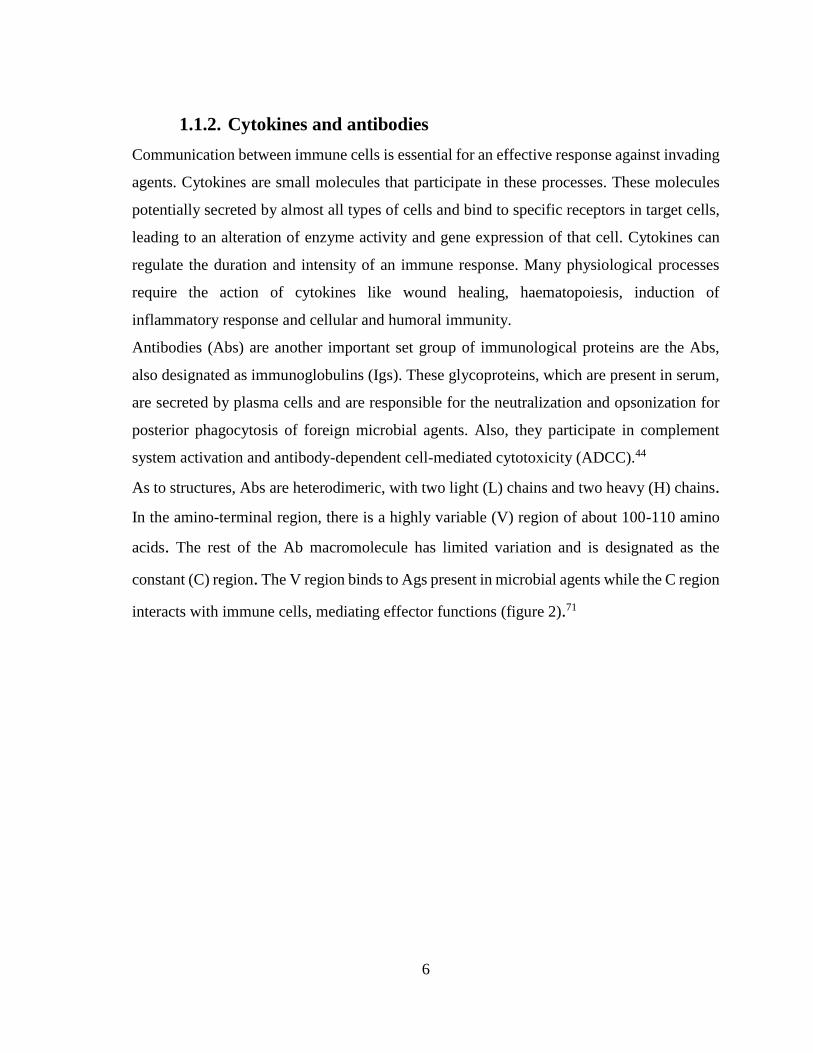
As to structures, Abs are heterodimeric, with two light (L) chains and two heavy (H) chains.
In the amino-terminal region, there is a highly variable (V) region of about 100-110 amino
acids. The rest of the Ab macromolecule has limited variation and is designated as the
constant (C) region. The V region binds to Ags present in microbial agents while the C region
interacts with immune cells, mediating effector functions (figure 2).71
7
Figure 2. Immunoglobulin general structure, showing L and H chains.
Adapted from Navarro et al. (2010).
Abs can be divided in five different isotypes differing in their heavy chain constant (CH)
region: IgG, IgM, IgA, IgE and IgD. IgG is the most abundant class of immunoglobulins
present in serum and has a variety of immunobiological activities such as complement
activator (IgG3, IgG1 and IgG2), opsonization (IgG1, IgG3 and IgG2) and placenta crossing
for providing foetal immunity (IgG1, IgG3 and IgG4). IgM composes around 5%-10% of
serum immunoglobulins and can be present as a monomeric membrane immunoglobulin in
B cells or can be secreted as a pentamer. IgM is the first immunoglobulin produced in a first
contact with an Ag as well as the first immunoglobulin produced by the foetus. Due to its
pentameric structure and subsequent higher valency, IgM is more efficient in antiviral
responses, since viruses have a great number of repeating epitopes. IgA is the main
immunoglobulin present in external secretions. Although it exists primarily in a monomeric
8
form, it can present itself in dimers, trimers and tetramers. Secretory IgA is present in dimeric
or trimeric form. Mucous membranes are the main sites of IgA production.44
1.2. Sjögren’s Syndrome (SS)
1.1.3. General features
Sjögren’s Syndrome, a condition described initially by a Swedish ophthalmologist Henrik
Sjögren in 1933, is classified as a chronic systemic autoimmune disease characterized by the
presence of infiltrated lymphocytes in the exocrine glands, predominantly the salivary and
lacrimal glands15. It occurs mainly in women, where ratios of incidence female/male are
between 10:174 and 20:14. Women with over 50 years of age are the most affected
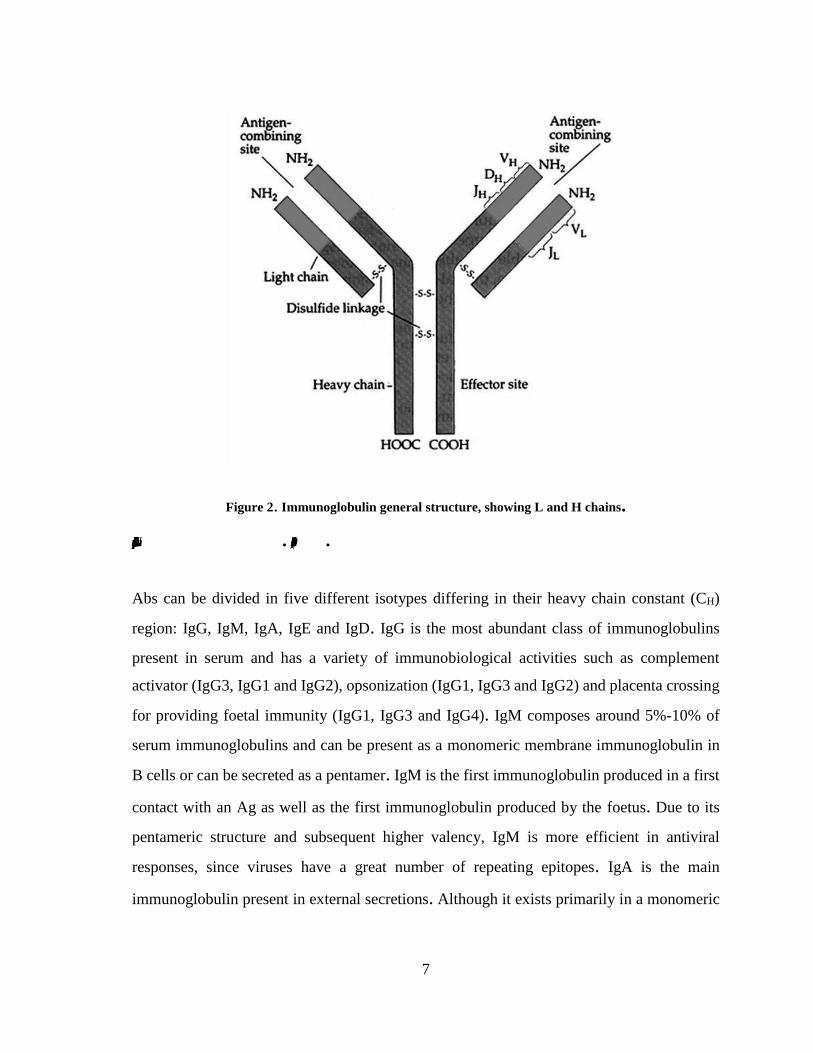
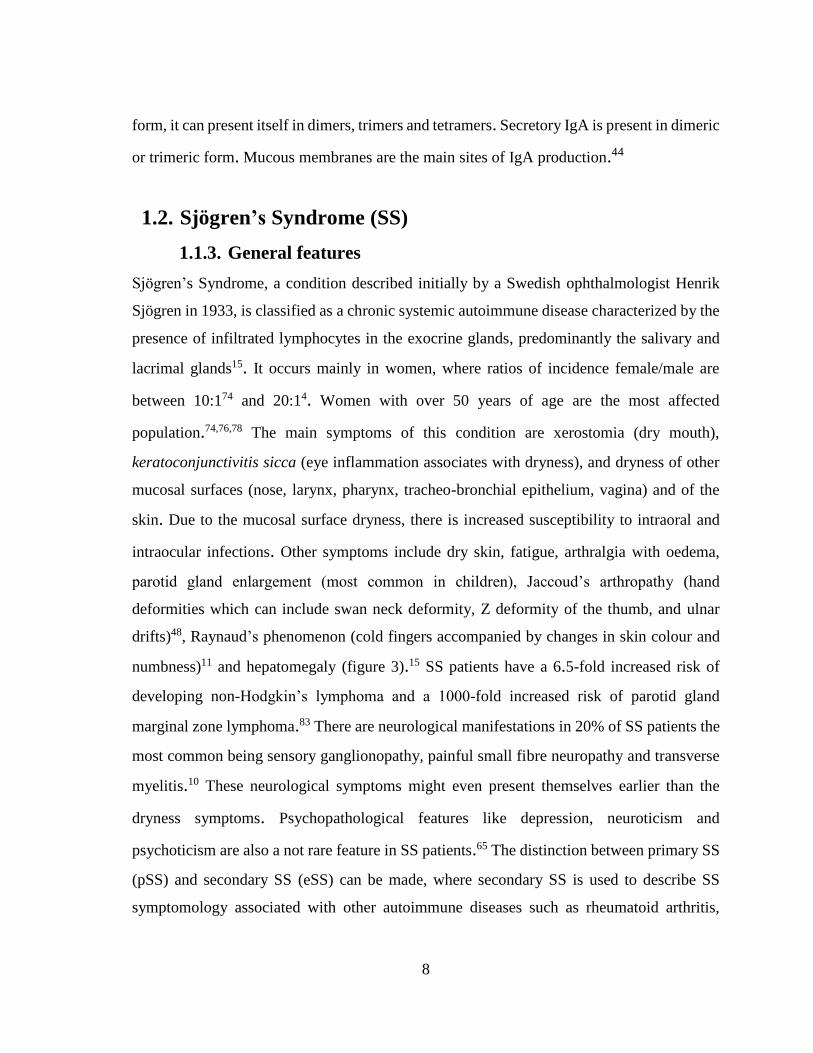
population.74,76,78 The main symptoms of this condition are xerostomia (dry mouth),
keratoconjunctivitis sicca (eye inflammation associates with dryness), and dryness of other
mucosal surfaces (nose, larynx, pharynx, tracheo-bronchial epithelium, vagina) and of the
skin. Due to the mucosal surface dryness, there is increased susceptibility to intraoral and
intraocular infections. Other symptoms include dry skin, fatigue, arthralgia with oedema,
parotid gland enlargement (most common in children), Jaccoud’s arthropathy (hand
deformities which can include swan neck deformity, Z deformity of the thumb, and ulnar
drifts)48, Raynaud’s phenomenon (cold fingers accompanied by changes in skin colour and
numbness)11 and hepatomegaly (figure 3).15 SS patients have a 6.5-fold increased risk of
developing non-Hodgkin’s lymphoma and a 1000-fold increased risk of parotid gland
marginal zone lymphoma.83 There are neurological manifestations in 20% of SS patients the
most common being sensory ganglionopathy, painful small fibre neuropathy and transverse
myelitis.10 These neurological symptoms might even present themselves earlier than the
dryness symptoms. Psychopathological features like depression, neuroticism and
psychoticism are also a not rare feature in SS patients.65 The distinction between primary SS
(pSS) and secondary SS (eSS) can be made, where secondary SS is used to describe SS
symptomology associated with other autoimmune diseases such as rheumatoid arthritis,
9
systematic lupus erythematosus and scleroderma. However, in a clinical context, this
distinction is not useful.15 SS activity and severity are measured using the EULAR SS
Disease Activity Index (ESSDAI), which is the main standard for clinical studies for
classification purposes. It evaluates 3 or 4 levels of activity in 12 organ systems (cutaneous,
respiratory, renal, articular, muscular, peripheral nervous system (PNS), central nervous
system (CNS), haematological, glandular, constitutional, lymphadenopathic and
biological).81
Figure 3. Main symptoms of Sjögren's Syndrome
Due to the presence of many non-specific symptoms like dryness, fatigue and arthralgia,
which may to be ignored by the patient or attending physician for some time, diagnosis time
can be delayed an average of four years.24 Several criteria for SS classification diagnosis
have been proposed over time, none of which being specifically developed for the diagnosis.
The presence of anti-Ro/SSA (70-100% of patients) and anti-La/SSB (35-70% of patients)
10
Abs in serum and focal lymphocytic sialadenitis (at least 1 focus per 4 mm2 surface at a 4-
lobule minimum) in a labial gland biopsy are the most useful criteria for diagnoses. However,
since the biopsy is an invasive procedure, it is not suitable for reassessment and some many
patients even refuse to do it.19
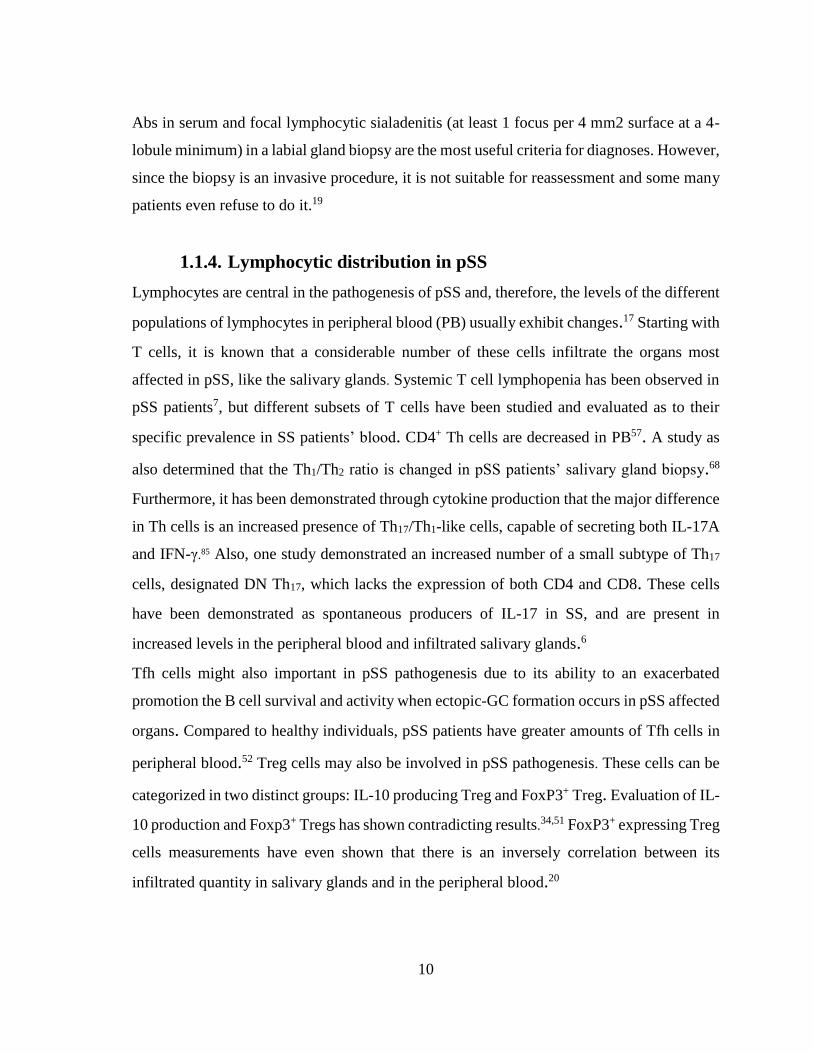
1.1.4. Lymphocytic distribution in pSS
Lymphocytes are central in the pathogenesis of pSS and, therefore, the levels of the different
populations of lymphocytes in peripheral blood (PB) usually exhibit changes.17 Starting with
T cells, it is known that a considerable number of these cells infiltrate the organs most
affected in pSS, like the salivary glands. Systemic T cell lymphopenia has been observed in
pSS patients7, but different subsets of T cells have been studied and evaluated as to their
specific prevalence in SS patients’ blood. CD4+ Th cells are decreased in PB57. A study as
also determined that the Th1/Th2 ratio is changed in pSS patients’ salivary gland biopsy.68
Furthermore, it has been demonstrated through cytokine production that the major difference
in Th cells is an increased presence of Th17/Th1-like cells, capable of secreting both IL-17A
and IFN-γ.85 Also, one study demonstrated an increased number of a small subtype of Th17
cells, designated DN Th17, which lacks the expression of both CD4 and CD8. These cells
have been demonstrated as spontaneous producers of IL-17 in SS, and are present in
increased levels in the peripheral blood and infiltrated salivary glands.6
Tfh cells might also important in pSS pathogenesis due to its ability to an exacerbated
promotion the B cell survival and activity when ectopic-GC formation occurs in pSS affected
organs. Compared to healthy individuals, pSS patients have greater amounts of Tfh cells in
peripheral blood.52 Treg cells may also be involved in pSS pathogenesis. These cells can be
categorized in two distinct groups: IL-10 producing Treg and FoxP3+ Treg. Evaluation of IL-
10 production and Foxp3+ Tregs has shown contradicting results.34,51 FoxP3+ expressing Treg
cells measurements have even shown that there is an inversely correlation between its
infiltrated quantity in salivary glands and in the peripheral blood.20
11
As for B cells, increasing evidence supports their active and central role in SS pathogenesis.
B-lymphocytes leave the bone marrow as transitional B cell and proceed to the SLO, where
their maturation continues under modulation of T cells.
Still, further insight is required in pSS lymphocytic profile. This could be useful for diagnosis
and establish a differentiation pattern resembling antiviral responses, giving clue as to how
viral pathogens could induce autoimmune epithelitis.
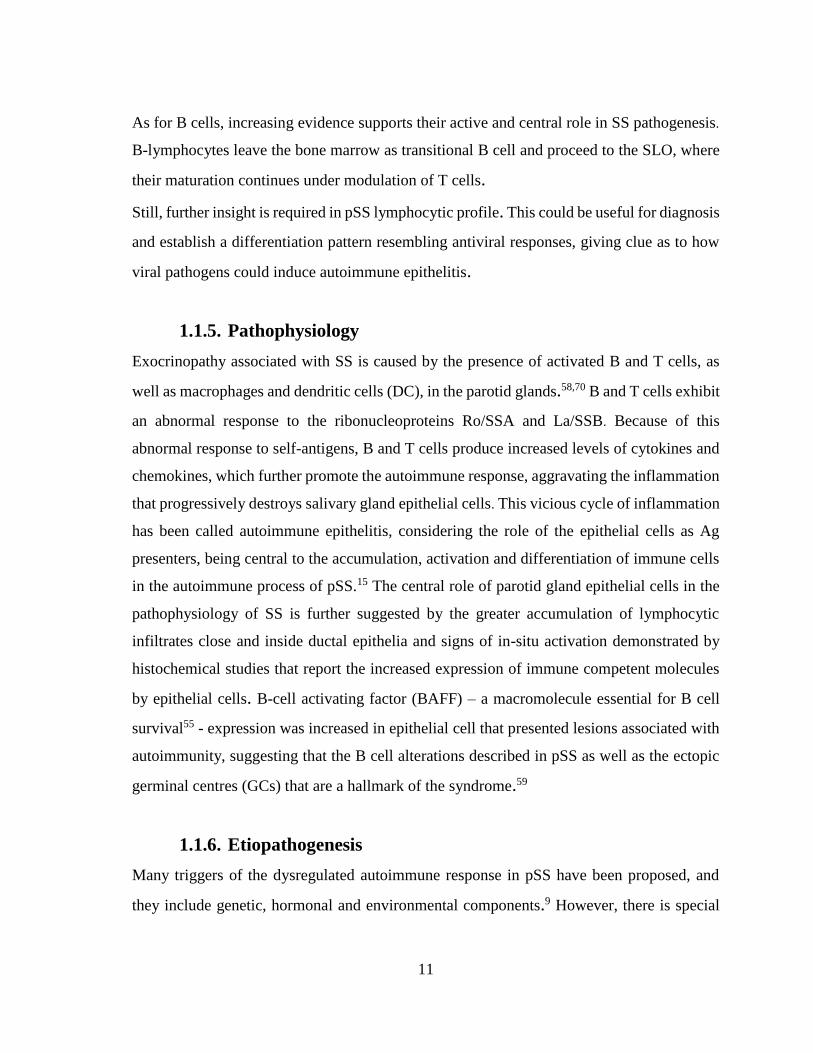
1.1.5. Pathophysiology
Exocrinopathy associated with SS is caused by the presence of activated B and T cells, as
well as macrophages and dendritic cells (DC), in the parotid glands.58,70 B and T cells exhibit
an abnormal response to the ribonucleoproteins Ro/SSA and La/SSB. Because of this
abnormal response to self-antigens, B and T cells produce increased levels of cytokines and
chemokines, which further promote the autoimmune response, aggravating the inflammation
that progressively destroys salivary gland epithelial cells. This vicious cycle of inflammation
has been called autoimmune epithelitis, considering the role of the epithelial cells as Ag
presenters, being central to the accumulation, activation and differentiation of immune cells
in the autoimmune process of pSS.15 The central role of parotid gland epithelial cells in the
pathophysiology of SS is further suggested by the greater accumulation of lymphocytic
infiltrates close and inside ductal epithelia and signs of in-situ activation demonstrated by
histochemical studies that report the increased expression of immune competent molecules
by epithelial cells. B-cell activating factor (BAFF) – a macromolecule essential for B cell
survival55 - expression was increased in epithelial cell that presented lesions associated with
autoimmunity, suggesting that the B cell alterations described in pSS as well as the ectopic
germinal centres (GCs) that are a hallmark of the syndrome.59
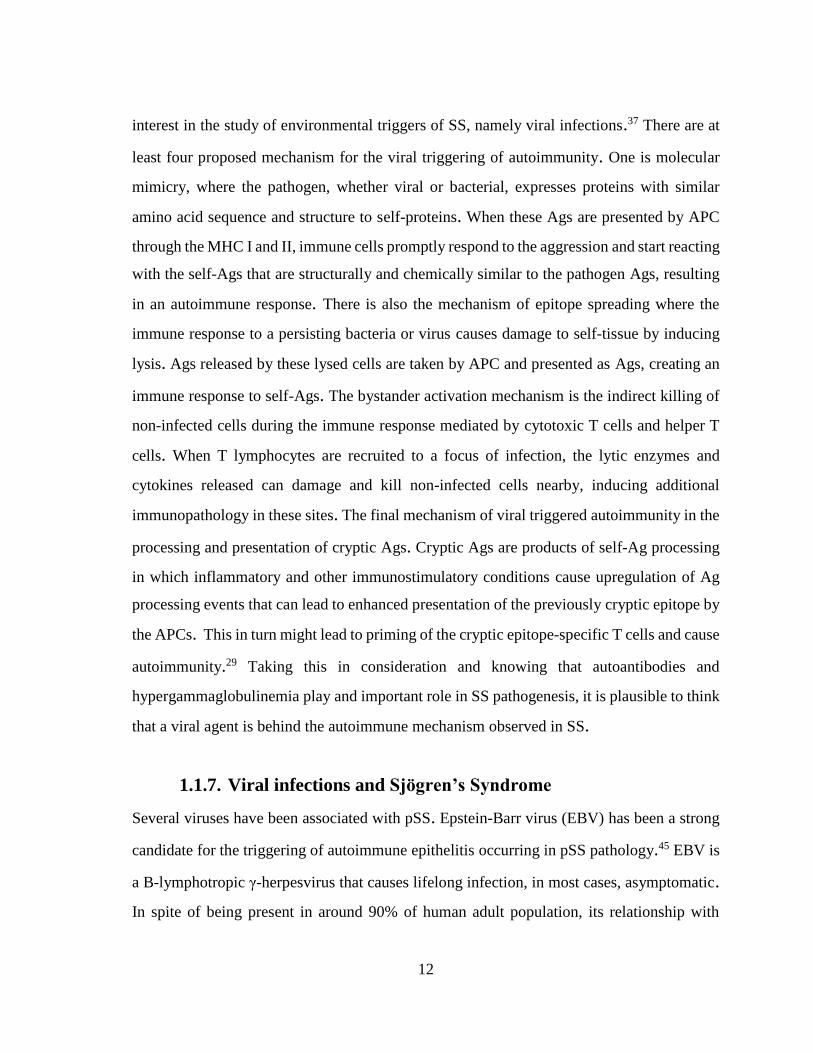
1.1.6. Etiopathogenesis
Many triggers of the dysregulated autoimmune response in pSS have been proposed, and
they include genetic, hormonal and environmental components.9 However, there is special
12
interest in the study of environmental triggers of SS, namely viral infections.37 There are at
least four proposed mechanism for the viral triggering of autoimmunity. One is molecular
mimicry, where the pathogen, whether viral or bacterial, expresses proteins with similar
amino acid sequence and structure to self-proteins. When these Ags are presented by APC
through the MHC I and II, immune cells promptly respond to the aggression and start reacting
with the self-Ags that are structurally and chemically similar to the pathogen Ags, resulting
in an autoimmune response. There is also the mechanism of epitope spreading where the
immune response to a persisting bacteria or virus causes damage to self-tissue by inducing
lysis. Ags released by these lysed cells are taken by APC and presented as Ags, creating an
immune response to self-Ags. The bystander activation mechanism is the indirect killing of
non-infected cells during the immune response mediated by cytotoxic T cells and helper T
cells. When T lymphocytes are recruited to a focus of infection, the lytic enzymes and
cytokines released can damage and kill non-infected cells nearby, inducing additional
immunopathology in these sites. The final mechanism of viral triggered autoimmunity in the
processing and presentation of cryptic Ags. Cryptic Ags are products of self-Ag processing
in which inflammatory and other immunostimulatory conditions cause upregulation of Ag
processing events that can lead to enhanced presentation of the previously cryptic epitope by
the APCs. This in turn might lead to priming of the cryptic epitope-specific T cells and cause
autoimmunity.29 Taking this in consideration and knowing that autoantibodies and
hypergammaglobulinemia play and important role in SS pathogenesis, it is plausible to think
that a viral agent is behind the autoimmune mechanism observed in SS.
1.1.7. Viral infections and Sjögren’s Syndrome
Several viruses have been associated with pSS. Epstein-Barr virus (EBV) has been a strong
candidate for the triggering of autoimmune epithelitis occurring in pSS pathology.45 EBV is
a B-lymphotropic γ-herpesvirus that causes lifelong infection, in most cases, asymptomatic.
In spite of being present in around 90% of human adult population, its relationship with
13
several diseases as been established.31 The life cycle of EBV can be divided in active lytic
and latent phase. In the active lytic phase, the virus replicates and propagates, while in the
latent phase, the virus remains inactive in B cells. Considering the main pathway of EBV
transmission is through oral mucosa and preference for B cell infection, it is plausible that
this virus may be involved in pSS aetiology and/or pathogenesis. Several studies demonstrate
that the expression of EBV proteins is increased in SS patients, both in peripheral blood and
salivary or lacrimal gland biopsies.56,61,69,80,92 Also, polyclonal activation of B cells in pSS is
greater that in RA and SLE patients.86 Molecular mimicry has been pointed out as a possible
mechanism for EBV-induced autoimmunity. Anti-Ro/La autoantibodies – found frequently
in pSS patients – precipitates protein antigens associated with small RNA expressed by
EBV.50 Also, an EBV transcriptional activator, EBNA1 has caused cross reactivity with
autoantibodies found in SLE.75 There isn’t, however, an established viral trigger for SS
autoimmune epithelitis.
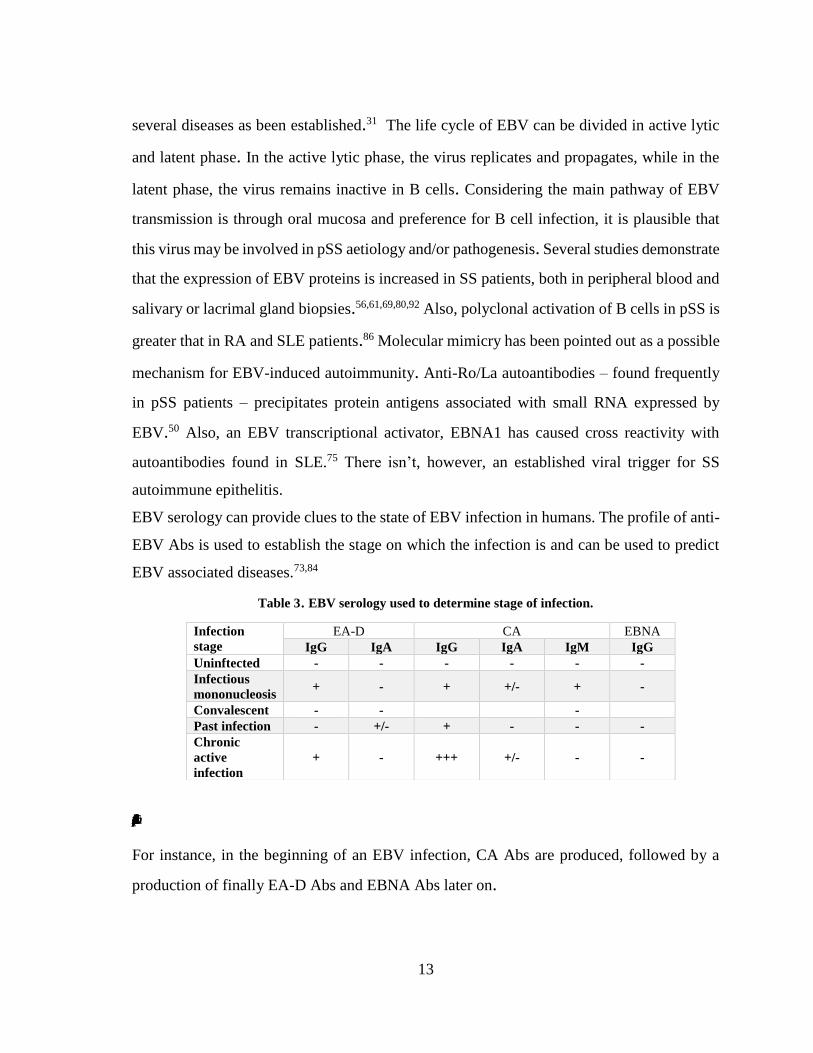
EBV serology can provide clues to the state of EBV infection in humans. The profile of anti-
EBV Abs is used to establish the stage on which the infection is and can be used to predict
EBV associated diseases.73,84
Table 3. EBV serology used to determine stage of infection.
Adapted from Straus, S. E. et al (1993)
For instance, in the beginning of an EBV infection, CA Abs are produced, followed by a
production of finally EA-D Abs and EBNA Abs later on.
Infection
stage
EA-D CA EBNA
IgG IgA IgG IgA IgM IgG
Uninftected - - - - - -
Infectious
mononucleosis + - + +/- + -
Convalescent - - -
Past infection - +/- + - - -
Chronic
active
infection
+ - +++ +/- - -
14
1.3. Objectives
Our aim with this work was to further elucidate the role of viral infection as an etiological
agent of the autoimmune epithelitis observed in SS patients by 1) characterizing T and B cell
population subsets, assess differences between patients groups and evaluate their correlation
with disease activity, clinical manifestation and other immune parameters that might indicate
a dysregulated antiviral response, 2) assess the viral background of patients, namely
evaluating the presence and quantity of antibodies anti-EBV Ags.
15
2. Chapter 2 – Materials and methods
2.1 Patients
For this study, we included 57 adult patients (aged 18-75 years) with pSS were recruited from
the rheumatology outpatient clinic in two hospitals in Lisbon - CUF Descobertas and Instituto
Português de Reumatologia. pSS patients were classified according to the pSS classification
criteria proposed by the American-European Consensus Group (AECG).88 Recruitment and
evaluation was performed between July 2014 and March 2017. Also, for comparison, 4 other
groups were considered in this study: Sicca syndrome patients with (n=38) and without
(n=30) criteria for undifferentiated connective tissue disease (UCTD), patients with
rheumatoid arthritis (RA; n=20) and healthy controls (HC; n=24). The Sicca syndrome group
as composed of patients with oral and ocular dryness (sicca syndrome) not fulfilling AECG
criteria. The exclusion criteria from the AECG criteria were also applied to all sicca patients,
and additional exclusion factors were considered for all patients: IgG4-related disease,
history of other corneal diseases and refractive surgery. Sicca patients were classified as
undifferentiated connective tissue disease (UCTD) if the presented ANA in a titre equal or
greater than 1/320 and at least one additional clinical feature of autoimmune rheumatic
disease, such as arthritis or inflammatory joint pain, cutaneous rash, Raynaud's phenomenon
or cytopenia of autoimmune origin. Sicca patients without those features were considered
non-UCTD. RA patients fulfilled the American College Against Rheumatology/ European
League Against Rheumatism (EULAR) classification criteria.5 All the participants in these
groups were recruited from CUF Descobertas hospital. The control group was composed by
healthy individuals without sicca syndrome recruited from the Ophthalmology outpatient
clinic of CUF Descobertas hospital.
In pSS patients, disease activity was determined using the (EULAR) Sjögren’s syndrome
disease activity index (ESSDAI) validated scale.81 pSS patients were stratified according to
the disease activity in two subgroups: low disease activity (ESSDAI<5) and moderate or high
disease activity (ESSDAI≥5).
16
A demographic and anthropometric characterization of patient groups and HC was made.
This study was approved by the Ethics committee of Hospital Cuf Descobertas, Ethics
committee of Instituto Português de Reumatologia and NOVA Medical School Ethics (no.
17/2016/CEFCM). In addition, all patient groups involved gave written consent to participate
in this study and all procedures were performed according to the guidelines of the Declaration
of Helsinki.93
2.2 Flow cytometry
Flow cytometry was used for B and T cell compartment characterization. The cytometer used
was the BD FACS Calibur™ cytometer (BD Biosciences, San Jose, California, USA). This
cytometer is equipped with a 488 nm blue light laser emitter, and a red diode laser with
wavelength emission of 647 nm, allowing a 4-color multiparametric analysis with 4 different
fluorescence channels (FL1-4). A total of 3 ml of whole peripheral blood was collected into
EDTA containing tubes and 3 to 5 mL were collected for tubes containing heparin. All
samples were processed and analysed within 24 h after collection.
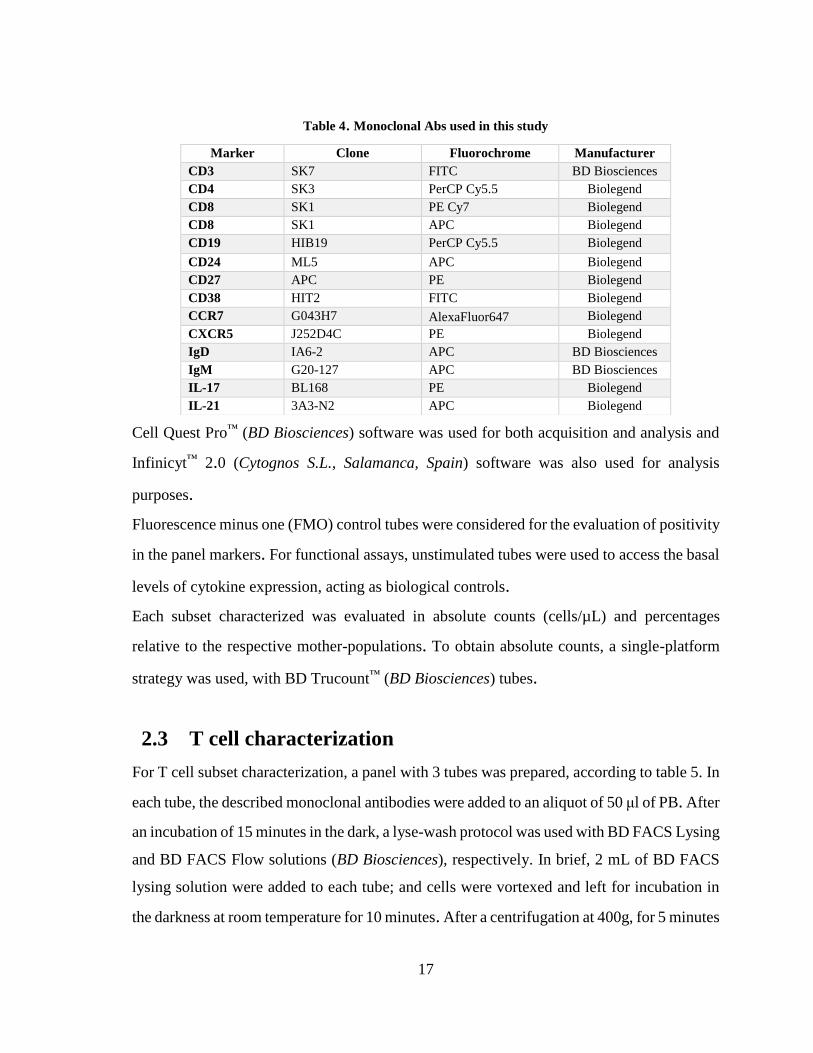
A pre-validated panel of monoclonal Abs was used for the characterization of the cell subsets,
using the reagents shown in table 4.
17
Table 4. Monoclonal Abs used in this study
Cell Quest Pro™ (BD Biosciences) software was used for both acquisition and analysis and
Infinicyt™ 2.0 (Cytognos S.L., Salamanca, Spain) software was also used for analysis
purposes.
Fluorescence minus one (FMO) control tubes were considered for the evaluation of positivity
in the panel markers. For functional assays, unstimulated tubes were used to access the basal
levels of cytokine expression, acting as biological controls.
Each subset characterized was evaluated in absolute counts (cells/µL) and percentages
relative to the respective mother-populations. To obtain absolute counts, a single-platform
strategy was used, with BD Trucount™ (BD Biosciences) tubes.
2.3 T cell characterization
For T cell subset characterization, a panel with 3 tubes was prepared, according to table 5. In
each tube, the described monoclonal antibodies were added to an aliquot of 50 μl of PB. After
an incubation of 15 minutes in the dark, a lyse-wash protocol was used with BD FACS Lysing
and BD FACS Flow solutions (BD Biosciences), respectively. In brief, 2 mL of BD FACS
lysing solution were added to each tube; and cells were vortexed and left for incubation in
the darkness at room temperature for 10 minutes. After a centrifugation at 400g, for 5 minutes
Marker Clone Fluorochrome Manufacturer
CD3 SK7 FITC BD Biosciences
CD4 SK3 PerCP Cy5.5 Biolegend
CD8 SK1 PE Cy7 Biolegend
CD8 SK1 APC Biolegend
CD19 HIB19 PerCP Cy5.5 Biolegend
CD24 ML5 APC Biolegend
CD27 APC PE Biolegend
CD38 HIT2 FITC Biolegend
CCR7 G043H7 AlexaFluor647 Biolegend
CXCR5 J252D4C PE Biolegend
IgD IA6-2 APC BD Biosciences
IgM G20-127 APC BD Biosciences
IL-17 BL168 PE Biolegend
IL-21 3A3-N2 APC Biolegend

20
Figure 4. Images representative of gating strategies used to assess CD4 and CD8 T cell subsets
Lymphocytes
CD4 T cells A.
B.
CD8
(CD4-)
T cells
CD4 T cells according
to CXCR5 and CCR7
expression
CD8 T cells according
to CXCR5 and CCR7
expression
21
Figure 5. Images representative of the gating strategy for the evaluation of IL-21 and IL-17 expression
by CD4 and CD8 T cells.
A.
IL-21+
IL-21+ IL-17+
IL-17+
CD4 (CD8-) T cells
CD8+ T cells
Unstimulated
Stimulated B.
A. Gating of lymphocytes in a SSC vs FSC dot plot, followed by the identification of CD4 T and CD8
T cells.
B. Follicular T cells were identified within CD4 and CD8 T cells according to the expression of
CXCR5 (Tfh and Tfc) and were further divided in CCR7+ and CCR7dim/-.
Software: Infinicyt 2.0
23
supernatant removal. Finally, 300 μL of BD CellFix solution was added to the pellet, the
tubes vortexed and the samples acquired in the cytometer.
Using Infinicyt™ 2.0, B cells were analysed using CD19, CD27, CD38, IgD, and classified
as naïve, unswitched and switched memory and plasmablasts according to the gating
strategies displayed in Figure 4 for the classical IgD/CD27 classification and for the Bm1-
Bm5 classification using IgD/CD38 expression. Moreover, B cell regulatory subsets were
analysed: transitional CD24Hi CD38Hi and memory CD24hi CD27+.
24
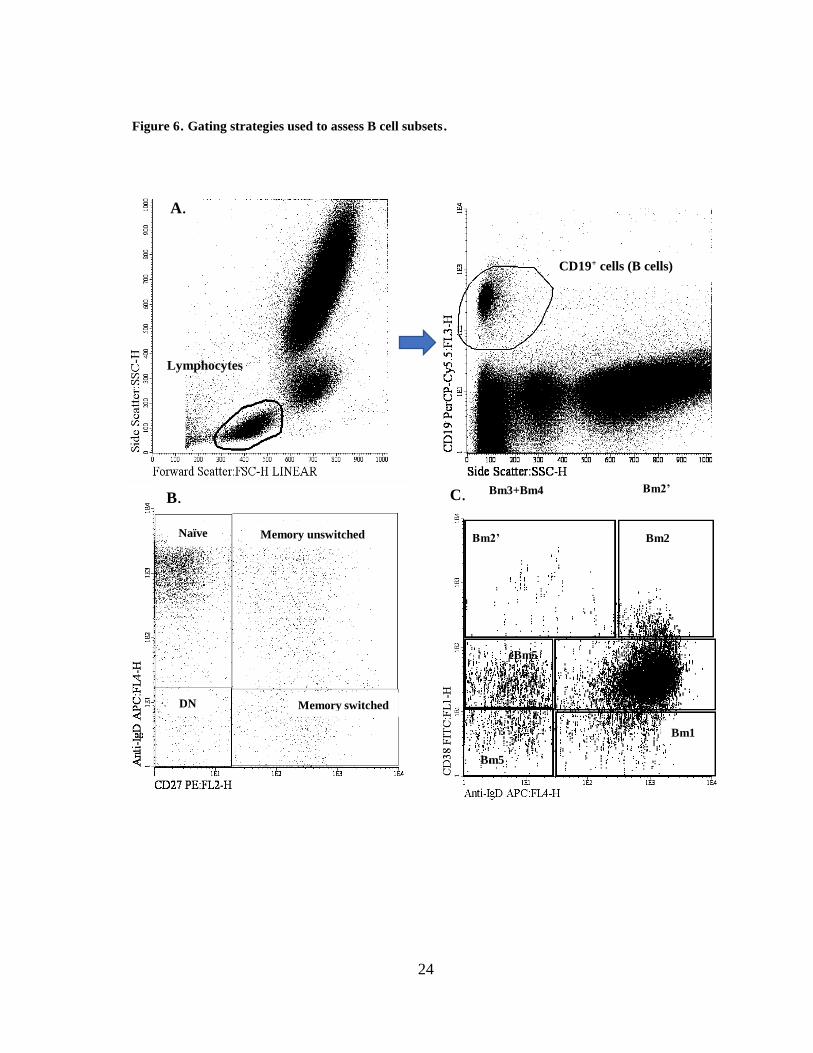
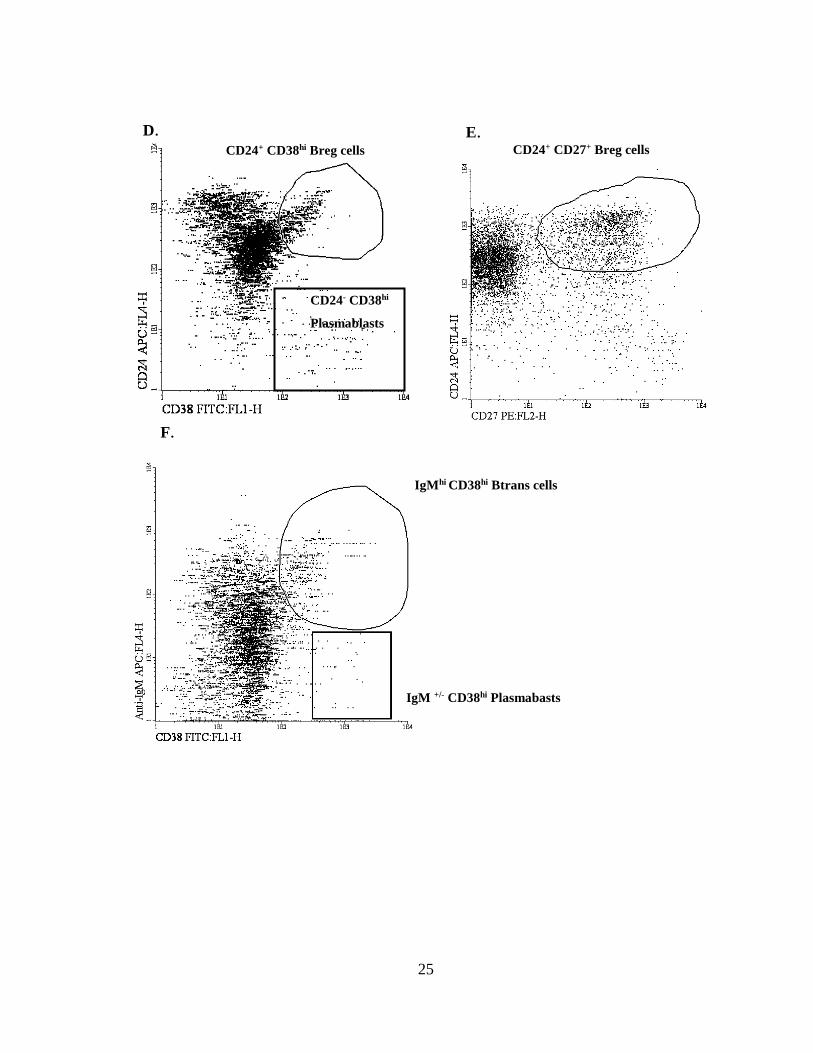
Figure 6. Gating strategies used to assess B cell subsets.
A.
B.
Lymphocytes
CD19+ cells (B cells)
Naïve Memory unswitched
DN Memory switched
Bm3+Bm4 Bm2’
eBm5
Bm2
Bm5
Bm1
C.
Bm2’
25
CD24+ CD38hi Breg cells CD24+ CD27+ Breg cells
D. E.
CD24- CD38hi
Plasmablasts
IgM +/- CD38hi Plasmabasts
IgMhi CD38hi Btrans cells
F.
26
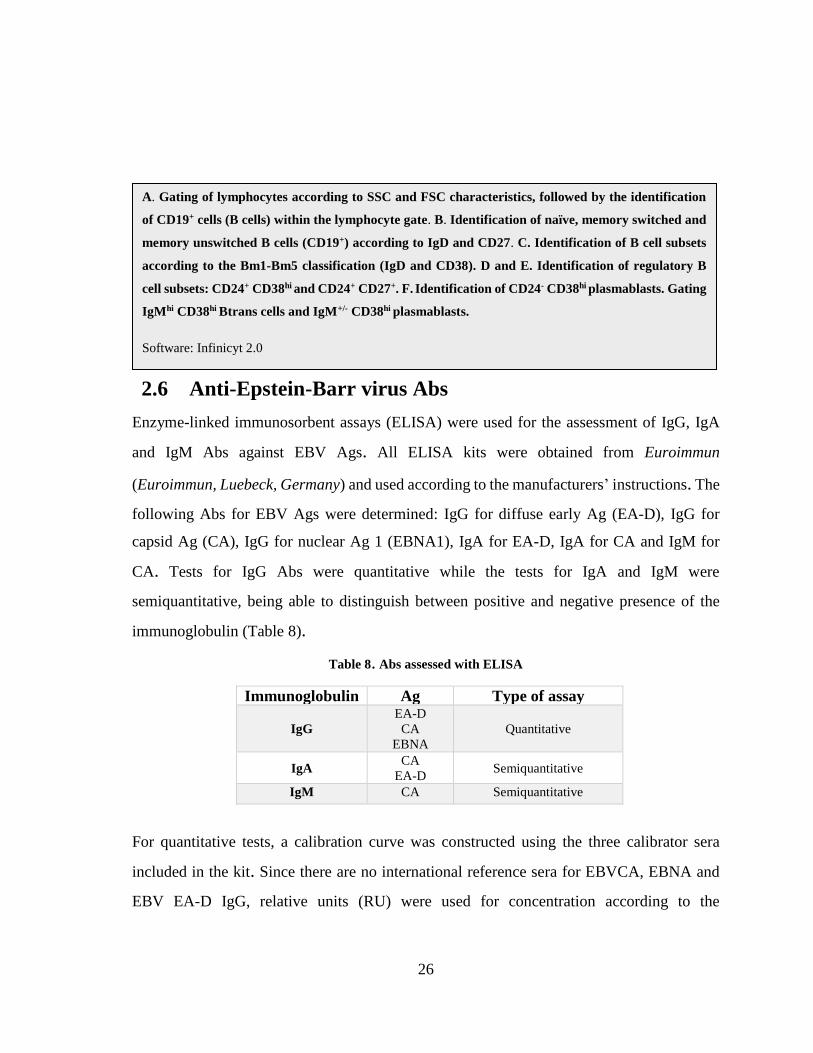
2.6 Anti-Epstein-Barr virus Abs
Enzyme-linked immunosorbent assays (ELISA) were used for the assessment of IgG, IgA
and IgM Abs against EBV Ags. All ELISA kits were obtained from Euroimmun
(Euroimmun, Luebeck, Germany) and used according to the manufacturers’ instructions. The
following Abs for EBV Ags were determined: IgG for diffuse early Ag (EA-D), IgG for
capsid Ag (CA), IgG for nuclear Ag 1 (EBNA1), IgA for EA-D, IgA for CA and IgM for
CA. Tests for IgG Abs were quantitative while the tests for IgA and IgM were
semiquantitative, being able to distinguish between positive and negative presence of the
immunoglobulin (Table 8).
Table 8. Abs assessed with ELISA
Immunoglobulin Ag Type of assay
IgG
EA-D
CA
EBNA
Quantitative
IgA CA
EA-D Semiquantitative
IgM CA Semiquantitative
For quantitative tests, a calibration curve was constructed using the three calibrator sera
included in the kit. Since there are no international reference sera for EBVCA, EBNA and
EBV EA-D IgG, relative units (RU) were used for concentration according to the
A. Gating of lymphocytes according to SSC and FSC characteristics, followed by the identification
of CD19+ cells (B cells) within the lymphocyte gate. B. Identification of naïve, memory switched and
memory unswitched B cells (CD19+) according to IgD and CD27. C. Identification of B cell subsets
according to the Bm1-Bm5 classification (IgD and CD38). D and E. Identification of regulatory B
cell subsets: CD24+ CD38hi and CD24+ CD27+. F. Identification of CD24- CD38hi plasmablasts. Gating
IgMhi CD38hi Btrans cells and IgM+/- CD38hi plasmablasts.
Software: Infinicyt 2.0
27
manufacturers’ instructions. The concentrations of the calibrators used were 2 RU/ml, 20
RU/ml and 200 RU/ml. For semiquantitative assessment, a single calibrator serum was
determined in triplicate, as recommended in the protocol. Also, a positive and a negative
control were used in each assay.
Briefly, in each assay, 100 μl of calibrators, positive and negative controls and sample sera
were incubated in individual wells of the pre-coated microplates for 30 minutes at room
temperature. After this, the plate was manually washed with 300 μl of washing buffer for 3
times. At the end of the third wash, 100 μl of the proper enzyme-conjugated antibody (anti-
human IgG conjugated with peroxidase) were added to the wells and left for incubation
during 30 minutes in the dark. Again, three washes were performed as above-mentioned.
After this, 100 μl of the chromogen/substrate solution were added to the wells and incubated
for 15 minutes protected from light and at room temperature. Photometric reading was
performed in an automatic photometric reader (Awareness Technology™ Stat Fax 2100) at
450 nm and 630 nm immediately after.
For quantitative assays, the calibration curve obtained with the calibrators sera was used to
determine que antibody concentration in RU. Whenever concentration values for patient’s
samples were above the highest calibrator, the calibrator value (200 RU/mL) was considered
for calculation purposes. In quantitative assays, Ab concentration levels were used to
establish positive (≥22 UR/ml), negative (<16 UR/ml) and borderline (≥16 to <22 RU/ml
results.
In semi-quantitative assays, a ratio between the sample/control absorbance and average of
calibrator absorbances was determined and used to establish a positive or negative result as
well as borderline values (ratio <0.8, negative; ratio >0.8 and <1.1; borderline; ratio >1.1,
positive).
Sample concentration was determined using calibration curves constructed with ELISA-
Logit-V24May2017 free software, available at
https://ednieuw.home.xs4all.nl/Calibration/Logit/Logit.htm.
28
2.7 Statistics
GraphPadPrism™ 6.0 (Graph Pad Software, San Diego, CA, USA) was used for statistical
analysis. Demographic and clinical data such as age, age of onset, time of disease evolution,
age of diagnostic and ESSDAI scores were presented as median (maximum – minimum).
Normality of data sets was assessed using D'Agostino & Pearson omnibus and Shapiro-Wilk
normality tests. ANOVA/Kruskal-Wallis was made for multiple analysis among groups.
When a significant difference was found,each two groups were compared using the Unpaired
Student’s t test with Welch’s correction whenever variables passed both normality tests,
while Mann-Whitney test was used for non-normal variables. Results in demographic data
tables are presented in median (minimum – maximum). In cell subset tables, percentage
values are presented in mean ± SD while absolute values are presented in median (25th – 75th
percentile). Fischer’s test, Chi-square and odds ratio (OR) were applied to assess differences
in positive cases among each patient group (pSS, HC and RA) studied in IgG anti-EBV
detection and quantification. Statistical significance was considered for p-values <0,05.
29
3. Chapter 3 - Results and discussion
3.1 Demographic and clinical data of patient groups and HC
assessed for B and T cell subsets
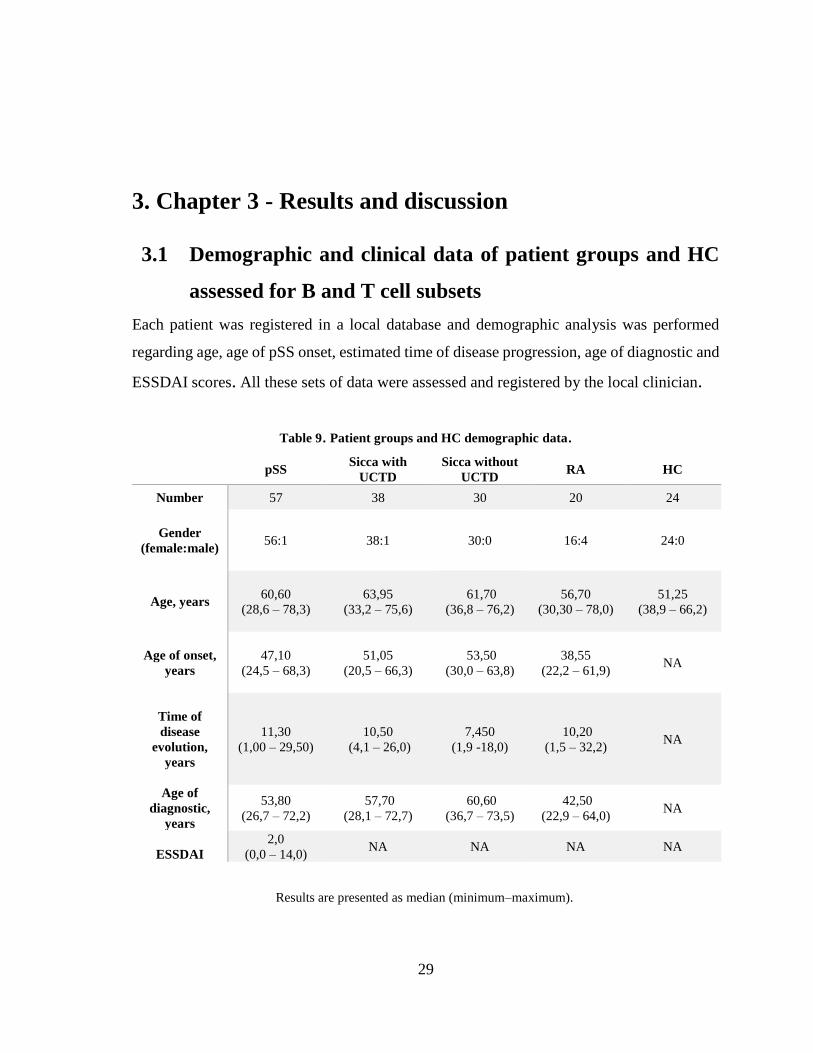
Each patient was registered in a local database and demographic analysis was performed
regarding age, age of pSS onset, estimated time of disease progression, age of diagnostic and
ESSDAI scores. All these sets of data were assessed and registered by the local clinician.
Table 9. Patient groups and HC demographic data.
Results are presented as median (minimum–maximum).
pSS Sicca with
UCTD
Sicca without
UCTD RA HC
Number 57 38 30 20 24
Gender
(female:male)
56:1 38:1 30:0 16:4 24:0
Age, years 60,60
(28,6 – 78,3)
63,95
(33,2 – 75,6)
61,70
(36,8 – 76,2)
56,70
(30,30 – 78,0)
51,25
(38,9 – 66,2)
Age of onset,
years
47,10
(24,5 – 68,3)
51,05
(20,5 – 66,3)
53,50
(30,0 – 63,8)
38,55
(22,2 – 61,9) NA
Time of
disease
evolution,
years
11,30
(1,00 – 29,50)
10,50
(4,1 – 26,0)
7,450
(1,9 -18,0)
10,20
(1,5 – 32,2) NA
Age of
diagnostic,
years
53,80
(26,7 – 72,2)
57,70
(28,1 – 72,7)
60,60
(36,7 – 73,5)
42,50
(22,9 – 64,0) NA
ESSDAI
2,0
(0,0 – 14,0) NA NA NA NA
30
3.2 T cell subsets
3.2.1 Percentages and absolute values of T cell subsets
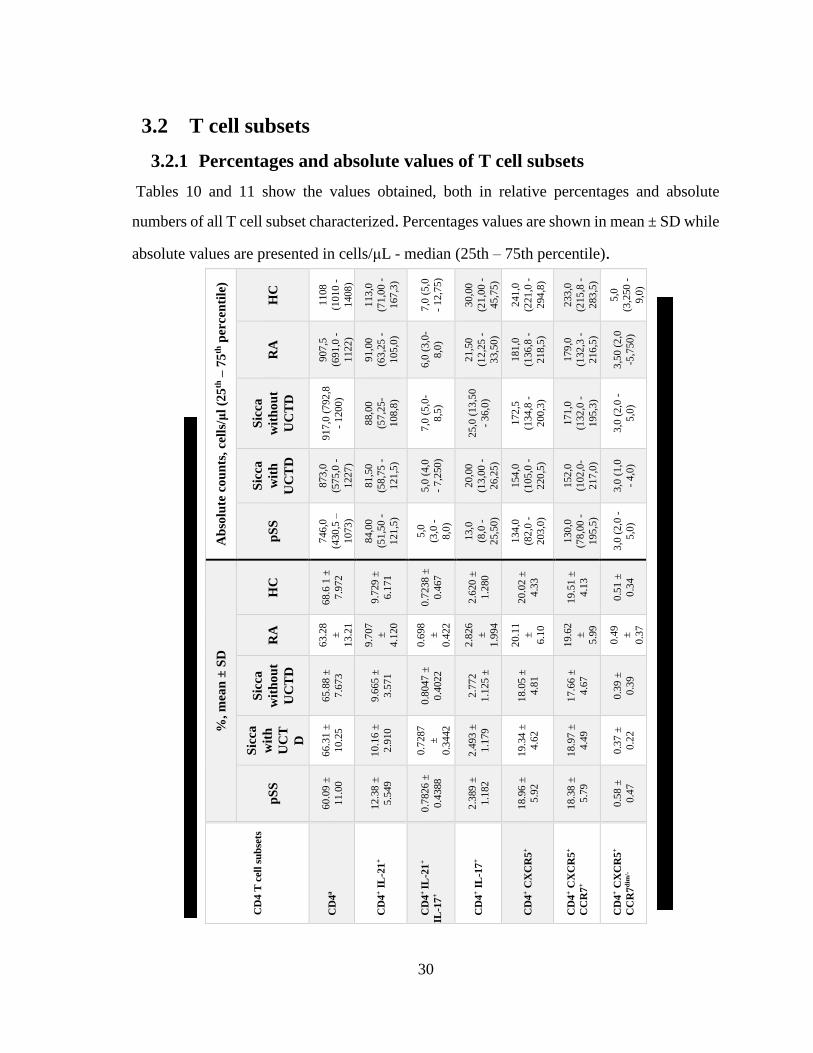
Tables 10 and 11 show the values obtained, both in relative percentages and absolute
numbers of all T cell subset characterized. Percentages values are shown in mean ± SD while
absolute values are presented in cells/μL - median (25th – 75th percentile).
Ab
solu
te c
ou
nts
, ce
lls/
μl
(25
th –
75
th p
ercen
tile
)
HC
1108
(101
0 -
1408
)
113
,0
(71
,00
-
167
,3)
7,0
(5,0
- 1
2,7
5)
30,0
0
(21
,00
-
45,7
5)
241
,0
(221
,0 -
294
,8)
233
,0
(215
,8 -
283
,5)
5,0
(3,2
50
-
9,0
)
RA
907
,5
(691
,0 -
1122
)
91,0
0
(63
,25
-
105
,0)
6,0
(3,0
-
8,0
)
21,5
0
(12
,25
-
33,5
0)
181
,0
(136
,8 -
218
,5)
179
,0
(132
,3 -
216
,5)
3,5
0 (
2,0
-5,7
50
)
Sic
ca
wit
ho
ut
UC
TD
917
,0 (
792
,8
- 1
200
)
88,0
0
(57
,25
-
108
,8)
7,0
(5,0
-
8,5
)
25,0
(13
,50
- 3
6,0
)
172
,5
(134
,8 -
200
,3)
171
,0
(132
,0 -
195
,3)
3,0
(2,0
-
5,0
)
Sic
ca
wit
h
UC
TD
873
,0
(575
,0 -
1227
)
81,5
0
(58
,75
-
121
,5)
5,0
(4,0
- 7
,250
)
20,0
0
(13
,00
-
26,2
5)
154
,0
(105
,0 -
220
,5)
152
,0
(102
,0-
217
,0)
3,0
(1,0
- 4
,0)
pS
S
746
,0
(430
,5 –
1073
)
84,0
0
(51
,50
-
121
,5)
5,0
(3,0
-
8,0
)
13,0
(8,0
-
25,5
0)
134
,0
(82
,0 -
203
,0)
130
,0
(78
,00
-
195
,5)
3,0
(2,0
-
5,0
)
%,
mea
n ±
SD
HC
68.6
1 ±
7.9
72
9.7
29
±
6.1
71
0.7
238
±
0.4
67
2.6
20
±
1.2
80
20.0
2 ±
4.3
3
19.5
1 ±
4.1
3
0.5
1 ±
0.3
4
RA
63.2
8
±
13.2
1
9.7
07
±
4.1
20
0.6
98
±
0.4
22
1
2.8
26
±
1.9
94
20.1
1
±
6.1
0
19.6
2
±
5.9
9
0.4
9
±
0.3
7
Sic
ca
wit
ho
ut
UC
TD
65.8
8 ±
7.6
73
9.6
65
±
3.5
71
0.8
047
±
0.4
022
2.7
72
1.1
25
±
18.0
5 ±
4.8
1
17.6
6 ±
4.6
7
0.3
9 ±
0.3
9
Sic
ca
wit
h
UC
T
D
66.3
1 ±
10.2
5
10.1
6 ±
2.9
10
0.7
287
±
0.3
442
2.4
93
±
1.1
79
19.3
4 ±
4.6
2
18.9
7 ±
4.4
9
0.3
7 ±
0.2
2
pS
S
60.0
9 ±
11.0
0
12.3
8 ±
5.5
49
0.7
826
±
0.4
388
2.3
89
±
1.1
82
18.9
6 ±
5.9
2
18.3
8 ±
5.7
9
0.5
8 ±
0.4
7
CD
4 T
cel
l su
bse
ts
CD
4a
CD
4+ I
L-2
1+
CD
4+
IL-2
1+
IL-1
7+
CD
4+ I
L-1
7+
CD
4+ C
XC
R5
+
CD
4+ C
XC
R5
+
CC
R7
+
CD
4+ C
XC
R5
+
CC
R7
dim
/-
a.p
erce
nta
ge
of
tota
l ly
mp
ho
cyte
s. A
ll o
ther
sub
sets
are
pre
sente
d a
s p
erce
nta
ges
of
tota
l C
D4
T c
ells
Tab
le 1
0.
Per
cen
tag
es a
nd
ab
solu
te v
alu
es o
f C
D4
T c
ell
sub
sets
.
31
Ab
solu
te c
ou
nts
, ce
lls/
μl,
med
ian
(2
5th
– 7
5th
per
cen
tile
)
HC
532
,5
(394
,0 -
752
,5)
12,5
0
(5
,50 -
25
,50
)
1,5
0
(1,0
- 4
,0)
6,0
(4,0
-11
,75
)
11,0
0
(7,2
50
- 1
9,5
0)
5,0
(3,0
-6,0
)
101
,0
(73
,25
- 1
90,0
)
107
,5
(95
,25
- 1
76,0
)
RA
528
,0
(336
,0 -
667
,3)
9,0
(4,5
0 -
15,2
5)
1,5
0 (
1,0
-
2,0
)
5,0
(3,0
-8,7
50
)
6,0
(4,2
50
-
13,0
)
2,5
0 (
1,0
-
6,7
50
)
51,0
0
(24
,50
-
130
,5)
70,5
0
(43
,50
-
87,5
0)
Sic
ca
wit
ho
ut
UC
TD
507
,0
(370
,8 -
587
,0)
15,0
0
(8,7
50
-
22,2
5)
1,5
00
(1
,0
- 2
,250
)
5,5
0
(2,0
- 9
,0)
9,0
(6,7
50
-
13,7
5)
3,0
(1,7
50
- 4
,250
)
69,0
0
(34
,75
-
158
,3)
86,0
(55
,50
-
144
,0)
Sic
ca w
ith
UC
TD
367
,0
(270
,8 -
513
,0)
12,0
(5
,0 -
21,5
0)
1,0
(0,7
5 -
1,0
)
3,0
(2,0
- 6
,0)
8,0
(4
,750
-
12,0
0)
3,0
(2,0
- 5
,0)
35,5
0 (
25,0
0 -
83,5
0)
82,0
0 (
39,0
0 -
124
,3)
pS
S
434
,0
(320
,5 -
643
,0)
18,0
(10
,0-
26,5
0)
1,0
(1,0
- 2
,0)
3,0
(2,0
-
6,5
)
9,0
(5,0
-
14,0
)
3,0
(2,0
-
5,0
)
57,0
0
(23
,50
-
112
,0)
79,0
0
(3
4,5
0 -
121
,5)
%,
mea
n ±
SD
HC
31,3
9 ±
7,9
73
4,5
85
±
9,1
66
0,4
779
±
0,3
983
1,5
52
±
1,2
04
2,2
65
±
0,9
279
0,8
329
±
0,4
180
24,9
6 ±
15,1
7
24,7
8 ±
10,4
6
RA
36,7
2 ±
13,2
1
2,2
34
±
1,3
28
0,3
580
±
0,3
440
1,2
70
±
0,9
068
1,7
19
±
1,1
55
0,7
020
±
0,5
349
17,2
3 ±
13,0
1
15,1
7 ±
9,4
36
Sic
ca
wit
ho
ut
UC
TD
34,1
3 ±
7,6
71
3,2
35
±
1,3
79
0,4
540
±
0,3
853
1,3
98
±
0,9
198
2,1
03
±
0,9
843
0,6
421
±
0,3
079
20,1
8 ±
11,9
0
21,8
7 ±
10,2
3
Sic
ca
wit
h
UC
TD
33,6
9 ±
10,2
4
3,6
76
±
2,3
74
0,3
305
±
0,3
227
1,0
57
±
0,6
403
2,3
80
±
1,2
82
0,9
416
±
0,6
836
16,7
3 ±
15,1
3
21,9
8 ±
13,6
8
pS
S
39.3
5 ±
11.5
1
5.5
10
±
8.4
99
0.3
437
±
0.2
862
1.0
65
±
0.7
268
2,3
01
±
1,6
27
0,9
418
±
0,9
009
16,9
8 ±
15,5
1
18,7
8 ±
10,8
4
CD
8 T
cell
sub
sets
CD
8+
a
CD
8+ I
L-2
1+
CD
8+ I
L-2
1+
IL-1
7+
CD
8+IL
-17
+
CD
8+
CX
CR
5+
CC
R7
+
CD
8+
CX
CR
5+
CC
R7
-
CD
8+
CX
CR
5-
CC
R7
hi/
+
CD
8+
CX
CR
5-
CC
R7
-
Ta
ble
11
. P
erce
nta
ges
an
d a
bso
lute
va
lues
of
CD
8 T
cell
su
bse
ts.
a.p
erce
nta
ge
of
tota
l ly
mp
ho
cyte
s. A
ll o
ther
sub
sets
are
pre
sente
d a
s p
erce
nta
ges
of
tota
l C
D8
T c
ells
32
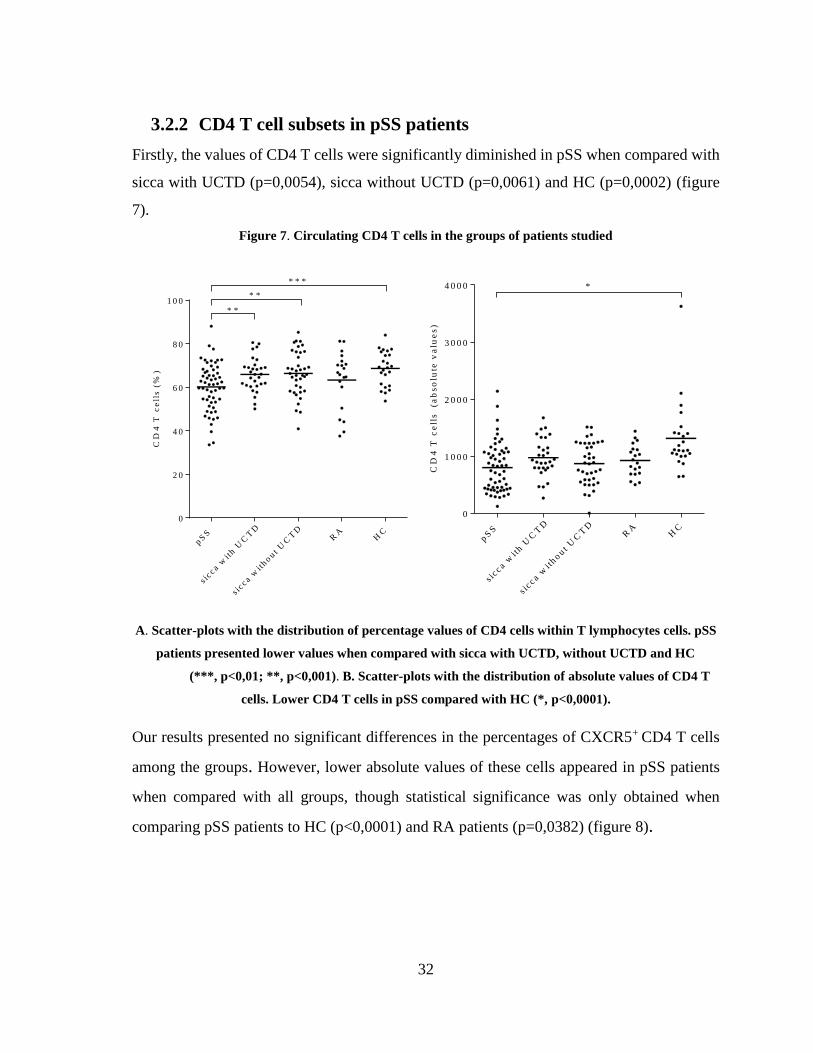
3.2.2 CD4 T cell subsets in pSS patients
Firstly, the values of CD4 T cells were significantly diminished in pSS when compared with
sicca with UCTD (p=0,0054), sicca without UCTD (p=0,0061) and HC (p=0,0002) (figure
7).
Figure 7. Circulating CD4 T cells in the groups of patients studied
CD
4 T
ce
lls
(%
)
pS
S
s ic c a w
ith U
CT
D
s ic c a w
ithout U
CT
D
RA
HC
0
2 0
4 0
6 0
8 0
1 0 0
* * *
* *
* *
CD
4 T
ce
lls
(a
bs
olu
te v
alu
es
)
pS
S
s ic c a w
ith U
CT
D
s ic c a w
ithout U
CT
D
RA
HC
0
1 0 0 0
2 0 0 0
3 0 0 0
4 0 0 0 *
A. Scatter-plots with the distribution of percentage values of CD4 cells within T lymphocytes cells. pSS
patients presented lower values when compared with sicca with UCTD, without UCTD and HC
(***, p<0,01; **, p<0,001). B. Scatter-plots with the distribution of absolute values of CD4 T
cells. Lower CD4 T cells in pSS compared with HC (*, p<0,0001).
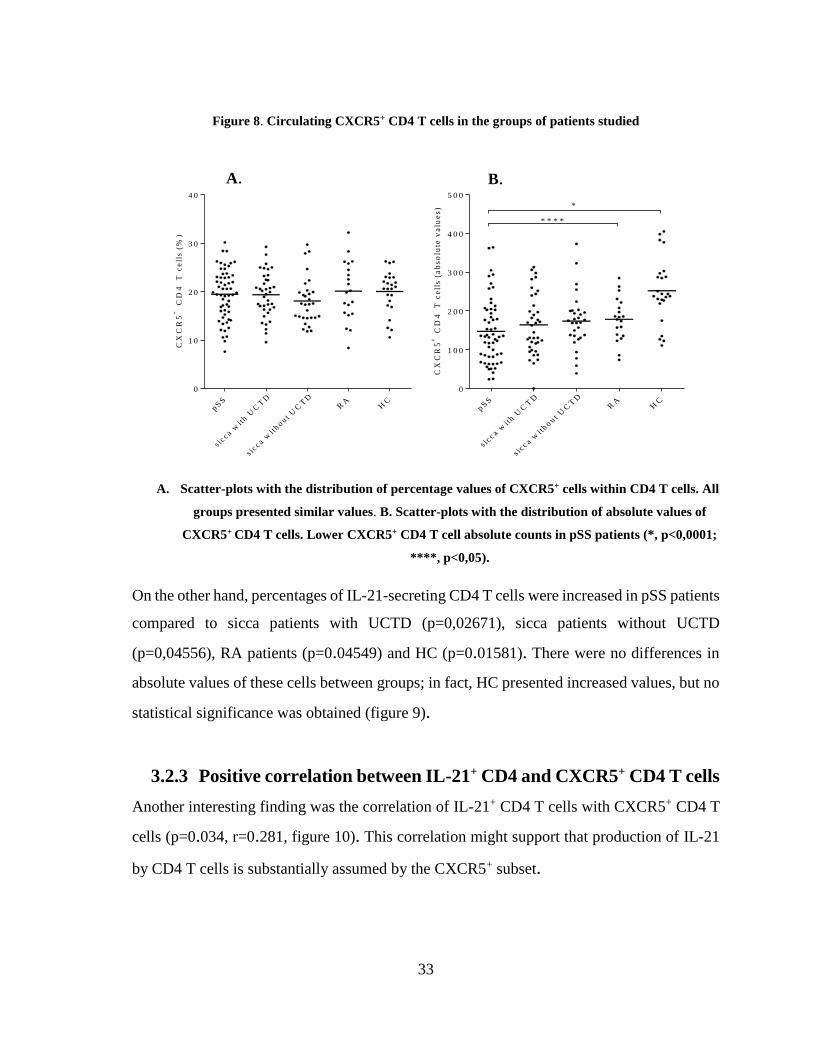
Our results presented no significant differences in the percentages of CXCR5+ CD4 T cells
among the groups. However, lower absolute values of these cells appeared in pSS patients
when compared with all groups, though statistical significance was only obtained when
comparing pSS patients to HC (p<0,0001) and RA patients (p=0,0382) (figure 8).
33
Figure 8. Circulating CXCR5+ CD4 T cells in the groups of patients studied
C
XC
R5
+
CD
4
T c
ell
s (
%)
pS
S
s icc a w
ith U
CT
D
s icc a w
ithout
UC
TD
RA
HC
0
1 0
2 0
3 0
4 0
CX
CR
5+
CD
4
T c
ell
s (
ab
so
lute
va
lue
s)
p SS
s icc a w
ith U
CT
D
s icc a w
ith o u t
UC
TD
RA
HC
0
1 0 0
2 0 0
3 0 0
4 0 0
5 0 0
*
* * * *
A. Scatter-plots with the distribution of percentage values of CXCR5+ cells within CD4 T cells. All
groups presented similar values. B. Scatter-plots with the distribution of absolute values of
CXCR5+ CD4 T cells. Lower CXCR5+ CD4 T cell absolute counts in pSS patients (*, p<0,0001;
****, p<0,05).
On the other hand, percentages of IL-21-secreting CD4 T cells were increased in pSS patients
compared to sicca patients with UCTD (p=0,02671), sicca patients without UCTD
(p=0,04556), RA patients (p=0.04549) and HC (p=0.01581). There were no differences in
absolute values of these cells between groups; in fact, HC presented increased values, but no
statistical significance was obtained (figure 9).
3.2.3 Positive correlation between IL-21+ CD4 and CXCR5+ CD4 T cells
Another interesting finding was the correlation of IL-21+ CD4 T cells with CXCR5+ CD4 T
cells (p=0.034, r=0.281, figure 10). This correlation might support that production of IL-21
by CD4 T cells is substantially assumed by the CXCR5+ subset.
A. B.
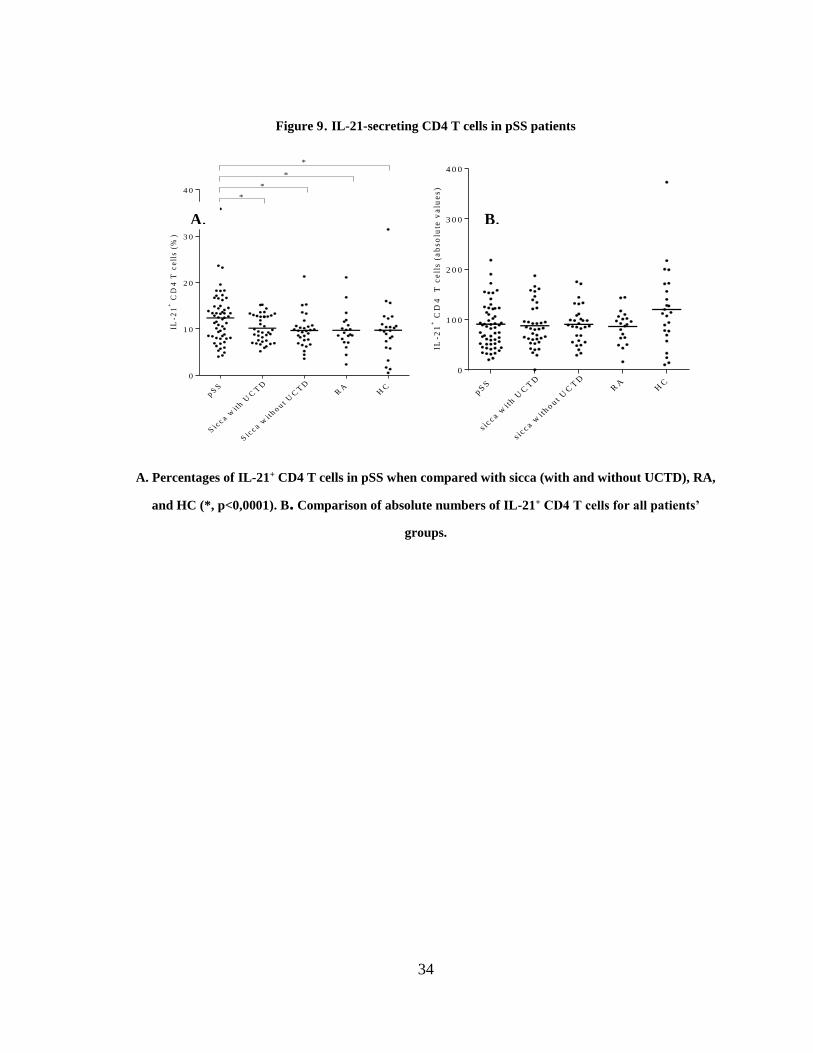
34
Figure 9. IL-21-secreting CD4 T cells in pSS patients
IL-2
1+
CD
4 T
ce
lls
(%
)
p SS
Sic
c a wit
h UC
TD
Sic
c a wit
h o u t U
CT
DR
AH
C
0
1 0
2 0
3 0
4 0*
*
*
*
IL-2
1+
CD
4
T c
ell
s (
ab
so
lute
va
lue
s)
p SS
s icc a w
ith U
CT
D
s icc a w
ith o u t
UC
TD
RA
HC
0
1 0 0
2 0 0
3 0 0
4 0 0
A. Percentages of IL-21+ CD4 T cells in pSS when compared with sicca (with and without UCTD), RA,
and HC (*, p<0,0001). B. Comparison of absolute numbers of IL-21+ CD4 T cells for all patients’
groups.
A. B.
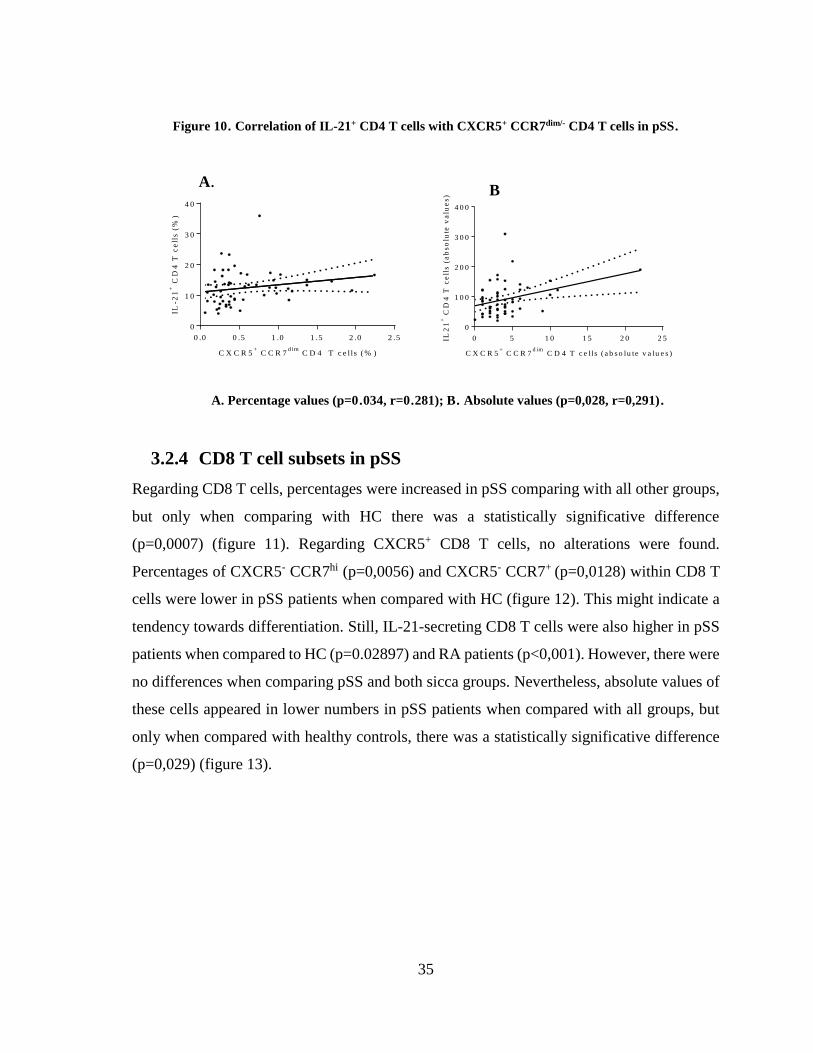
35
Figure 10. Correlation of IL-21+ CD4 T cells with CXCR5+ CCR7dim/- CD4 T cells in pSS.
C X C R 5+
C C R 7d im
C D 4 T c e l ls ( % )
IL-2
1+
CD
4 T
ce
lls
(%
)
0 .0 0 .5 1 .0 1 .5 2 .0 2 .5
0
1 0
2 0
3 0
4 0
C X C R 5
+ C C R 7
d im C D 4 T c e l ls ( a b s o lu te v a lu e s )
0 5 1 0 1 5 2 0 2 5
0
1 0 0
2 0 0
3 0 0
4 0 0
IL2
1+
CD
4 T
ce
lls
(a
bs
olu
te v
alu
es
)
A. Percentage values (p=0.034, r=0.281); B. Absolute values (p=0,028, r=0,291).
3.2.4 CD8 T cell subsets in pSS
Regarding CD8 T cells, percentages were increased in pSS comparing with all other groups,
but only when comparing with HC there was a statistically significative difference
(p=0,0007) (figure 11). Regarding CXCR5+ CD8 T cells, no alterations were found.
Percentages of CXCR5- CCR7hi (p=0,0056) and CXCR5- CCR7+ (p=0,0128) within CD8 T
cells were lower in pSS patients when compared with HC (figure 12). This might indicate a
tendency towards differentiation. Still, IL-21-secreting CD8 T cells were also higher in pSS
patients when compared to HC (p=0.02897) and RA patients (p<0,001). However, there were
no differences when comparing pSS and both sicca groups. Nevertheless, absolute values of
these cells appeared in lower numbers in pSS patients when compared with all groups, but
only when compared with healthy controls, there was a statistically significative difference
(p=0,029) (figure 13).
A. B
.
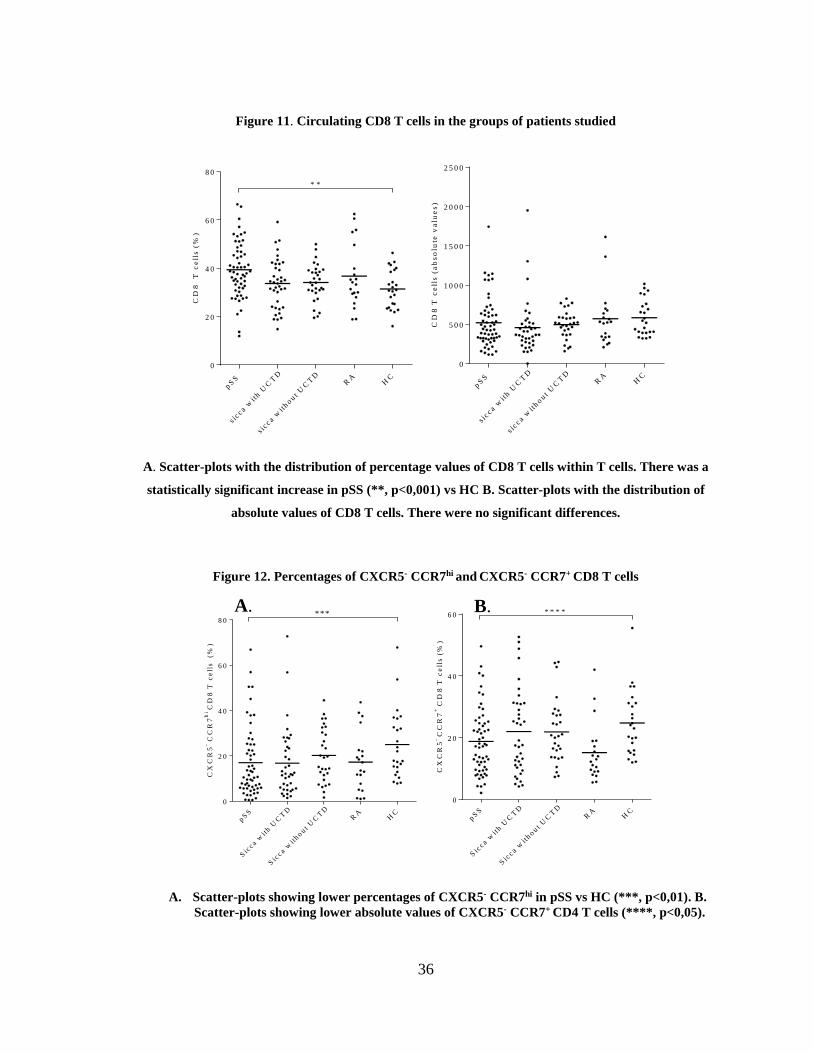
36
A. B.
Figure 11. Circulating CD8 T cells in the groups of patients studied
CD
8
T c
ell
s (
%)
pS
S
s ic c a w
ith U
CT
D
s ic c a w
ithout U
CT
D
RA
HC
0
2 0
4 0
6 0
8 0
* *
CD
8 T
ce
lls
(a
bs
olu
te v
alu
es
)
pS
S
s ic c a w
ith U
CT
D
s ic c a w
ithout U
CT
D
RA
HC
0
5 0 0
1 0 0 0
1 5 0 0
2 0 0 0
2 5 0 0
A. Scatter-plots with the distribution of percentage values of CD8 T cells within T cells. There was a
statistically significant increase in pSS (**, p<0,001) vs HC B. Scatter-plots with the distribution of
absolute values of CD8 T cells. There were no significant differences.
Figure 12. Percentages of CXCR5- CCR7hi and CXCR5- CCR7+ CD8 T cells
CX
CR
5- C
CR
7h
iC
D8
T c
ell
s
(%
)
pS
S
Sic
c a wit
h U
CT
D
Sic
c a wit
hout
UC
TD
RA
HC
0
2 0
4 0
6 0
8 0***
CX
CR
5-
CC
R7
+C
D8
T c
ell
s (
%)
pS
S
Sic
c a wit
h U
CT
D
Sic
c a wit
hout
UC
TD
RA
HC
0
2 0
4 0
6 0 * * * *
A. Scatter-plots showing lower percentages of CXCR5- CCR7hi in pSS vs HC (***, p<0,01). B.
Scatter-plots showing lower absolute values of CXCR5- CCR7+ CD4 T cells (****, p<0,05).
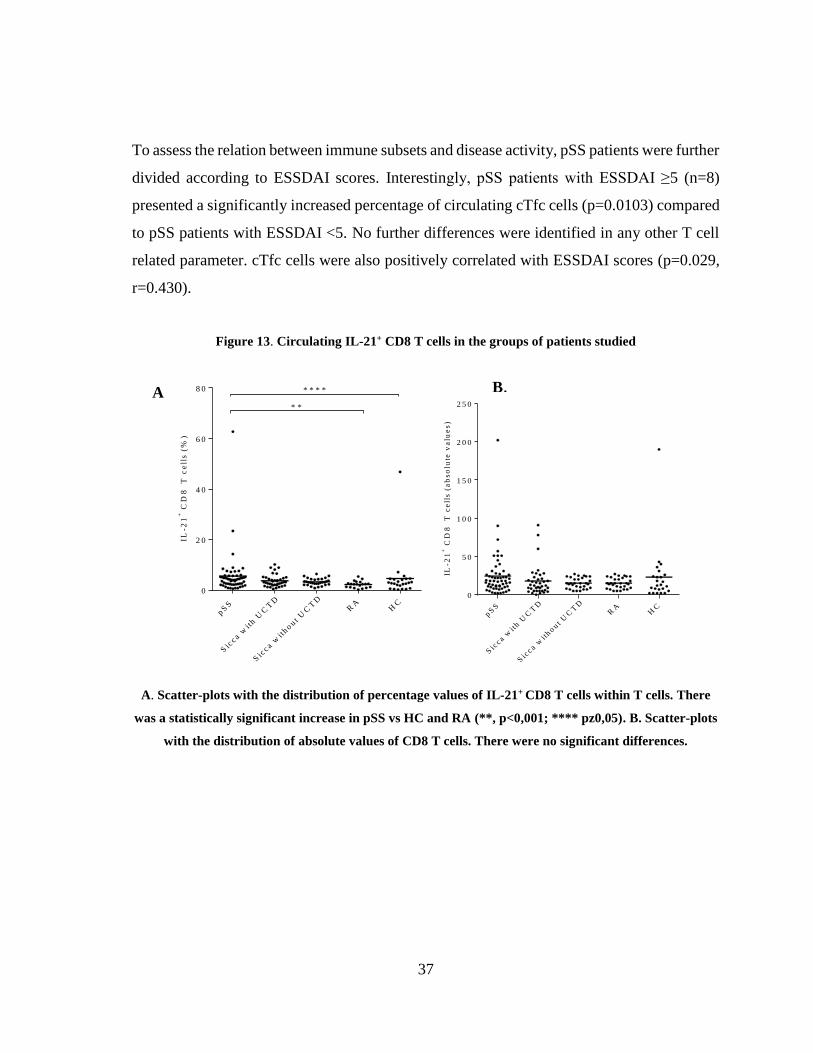
37
To assess the relation between immune subsets and disease activity, pSS patients were further
divided according to ESSDAI scores. Interestingly, pSS patients with ESSDAI ≥5 (n=8)
presented a significantly increased percentage of circulating cTfc cells (p=0.0103) compared
to pSS patients with ESSDAI <5. No further differences were identified in any other T cell
related parameter. cTfc cells were also positively correlated with ESSDAI scores (p=0.029,
r=0.430).
Figure 13. Circulating IL-21+ CD8 T cells in the groups of patients studied
IL-2
1+
CD
8
T c
ell
s (
%)
pS
S
Sic
c a wit
h U
CT
D
Sic
c a wit
hout
UC
TD
RA
HC
0
2 0
4 0
6 0
8 0 * * * *
* *
IL-2
1+
CD
8
T c
ell
s (
ab
so
lute
va
lue
s)
pS
S
Sic
c a wit
h U
CT
D
Sic
c a wit
hout
UC
TD
RA
HC
0
5 0
1 0 0
1 5 0
2 0 0
2 5 0
A. Scatter-plots with the distribution of percentage values of IL-21+ CD8 T cells within T cells. There
was a statistically significant increase in pSS vs HC and RA (**, p<0,001; **** pz0,05). B. Scatter-plots
with the distribution of absolute values of CD8 T cells. There were no significant differences.
A
.
B.
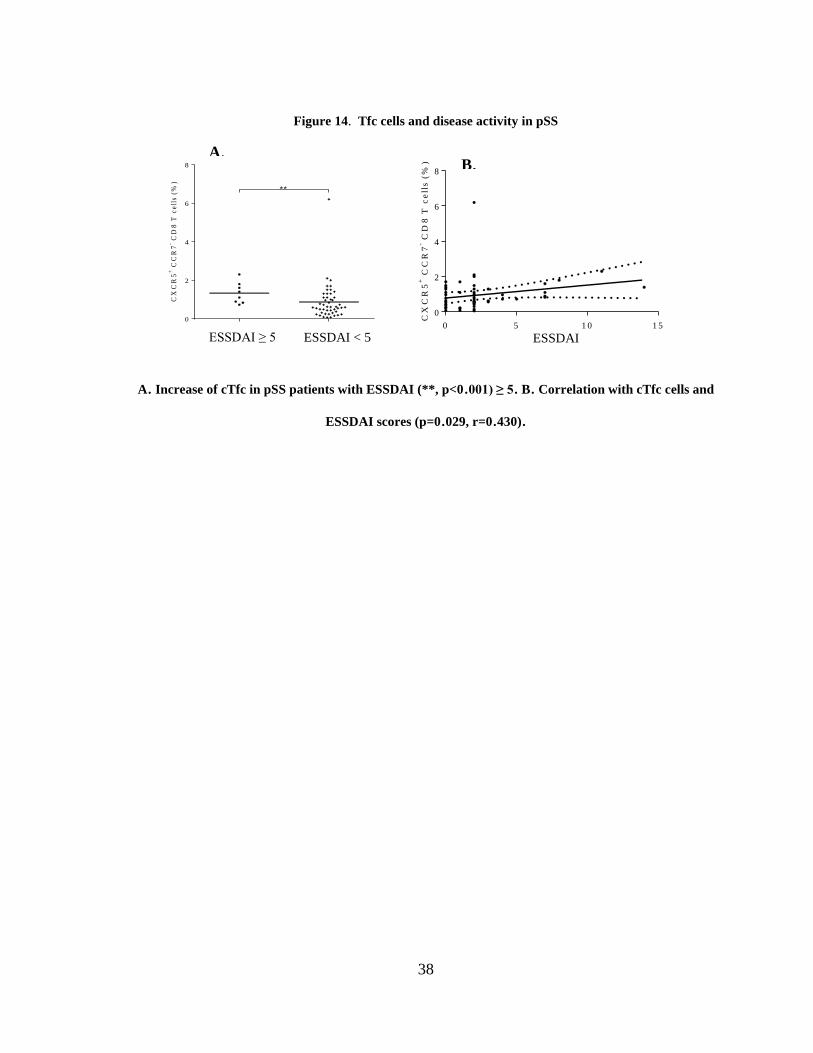
38
ESSDAI
Figure 14. Tfc cells and disease activity in pSS
CX
CR
5+
CC
R7
- CD
8 T
ce
lls
(%
)
0
2
4
6
8
**
CX
CR
5+
CC
R7
- CD
8 T
ce
lls
(%
)
0 5 1 0 1 5
0
2
4
6
8
A. Increase of cTfc in pSS patients with ESSDAI (**, p<0.001) ≥ 5. B. Correlation with cTfc cells and
ESSDAI scores (p=0.029, r=0.430).
A. B.
ESSDAI ≥ 5 ESSDAI < 5
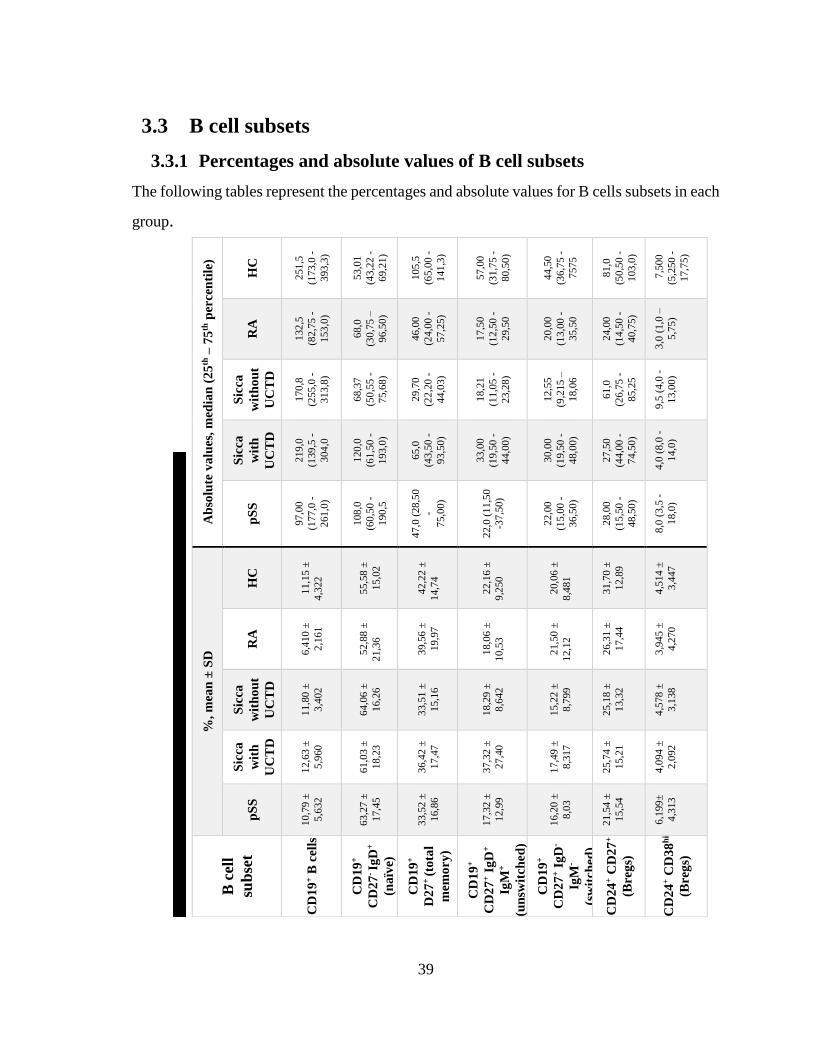
39
Ta
ble
12
. P
erce
nta
ges
an
d a
bso
lute
va
lues
of
B c
ell
su
bse
t.
3.3 B cell subsets
3.3.1 Percentages and absolute values of B cell subsets
The following tables represent the percentages and absolute values for B cells subsets in each
group.
Ab
solu
te v
alu
es,
med
ian
(2
5th
– 7
5th
per
cen
tile
)
HC
251
,5
(173
,0 -
393
,3)
53,0
1
(43
,22
-
69,2
1)
105
,5
(65
,00
-
141
,3)
57,0
0
(31
,75
-
80,5
0)
44,5
0
(36
,75
-
7575
81,0
(50
,50
-
103
,0)
7,5
00
(5,2
50
-
17,7
5)
RA
132
,5
(82
,75
-
153
,0)
68,0
(30
,75
–
96,5
0)
46,0
0
(24
,00
-
57,2
5)
17,5
0
(12
,50
-
29,5
0
20,0
0
(13
,00
-
35,5
0
24,0
0
(14
,50
-
40,7
5)
3,0
(1,0
–
5,7
5)
Sic
ca
wit
ho
ut
UC
TD
170
,8
(255
,0 -
313
,8)
68,3
7
(50
,55
-
75,6
8)
29,7
0
(22
,20
-
44,0
3)
18,2
1
(11
,05
-
23,2
8)
12,5
5
(9,2
15
–
18,0
6
61,0
(26
,75
-
85,2
5
9,5
(4,0
-
13,0
0)
Sic
ca
wit
h
UC
TD
219
,0
(139
,5 -
304
,0
120
,0
(61
,50
-
193
,0)
65,0
(43
,50
-
93,5
0)
33,0
0
(19
,50
-
44,0
0)
30,0
0
(19
,50
-
48,0
0)
27,5
0
(44
,00
-
74,5
0)
4,0
(8,0
-
14,0
)
pS
S
97,0
0
(177
,0 -
261
,0)
108
,0
(60
,50
-
190
,5
47,0
(28
,50
-
75,0
0)
22,0
(11
,50
-37
,50
)
22,0
0
(15
,00
-
36,5
0)
28,0
0
(15
,50
-
48,5
0)
8,0
(3,5
-
18,0
)
%,
mea
n ±
SD
HC
11,1
5 ±
4,3
22
55,5
8 ±
15,0
2
42,2
2 ±
14,7
4
22,1
6 ±
9,2
50
20,0
6 ±
8,4
81
31,7
0 ±
12,8
9
4,5
14
±
3,4
47
RA
6,4
10
±
2,1
61
52,8
8 ±
21,3
6
39,5
6 ±
19,9
7
18,0
6 ±
10,5
3
21,5
0 ±
12,1
2
26,3
1 ±
17,4
4
3,9
45
±
4,2
70
Sic
ca
wit
ho
ut
UC
TD
11,8
0 ±
3,4
02
64,0
6 ±
16,2
6
33,5
1 ±
15,1
6
18,2
9 ±
8,6
42
15,2
2 ±
8,7
99
25,1
8 ±
13,3
2
4,5
78
±
3,1
38
Sic
ca
wit
h
UC
TD
12,6
3 ±
5,9
60
61,0
3 ±
18,2
3
36,4
2 ±
17,4
7
37,3
2 ±
27,4
0
17,4
9 ±
8,3
17
25,7
4 ±
15,2
1
4,0
94
±
2,0
92
pS
S
10,7
9 ±
5,6
32
63,2
7 ±
17,4
5
33,5
2 ±
16,8
6
17,3
2 ±
12,9
9
16,2
0 ±
8,0
3
21,5
4 ±
15,5
4
6,1
99
±
4,3
13
B c
ell
sub
set
CD
19
+ B
cell
s
CD
19
+
CD
27
- Ig
D+
(na
ïve)
CD
19
+
D2
7+
(to
tal
mem
ory
)
CD
19
+
CD
27
+ I
gD
+
IgM
+
(un
swit
ched
)
CD
19
+
CD
27
+ I
gD
-
IgM
-
(sw
itch
ed)
CD
24
+ C
D2
7+
(Bre
gs)
CD
24
+ C
D3
8h
i
(Bre
gs)
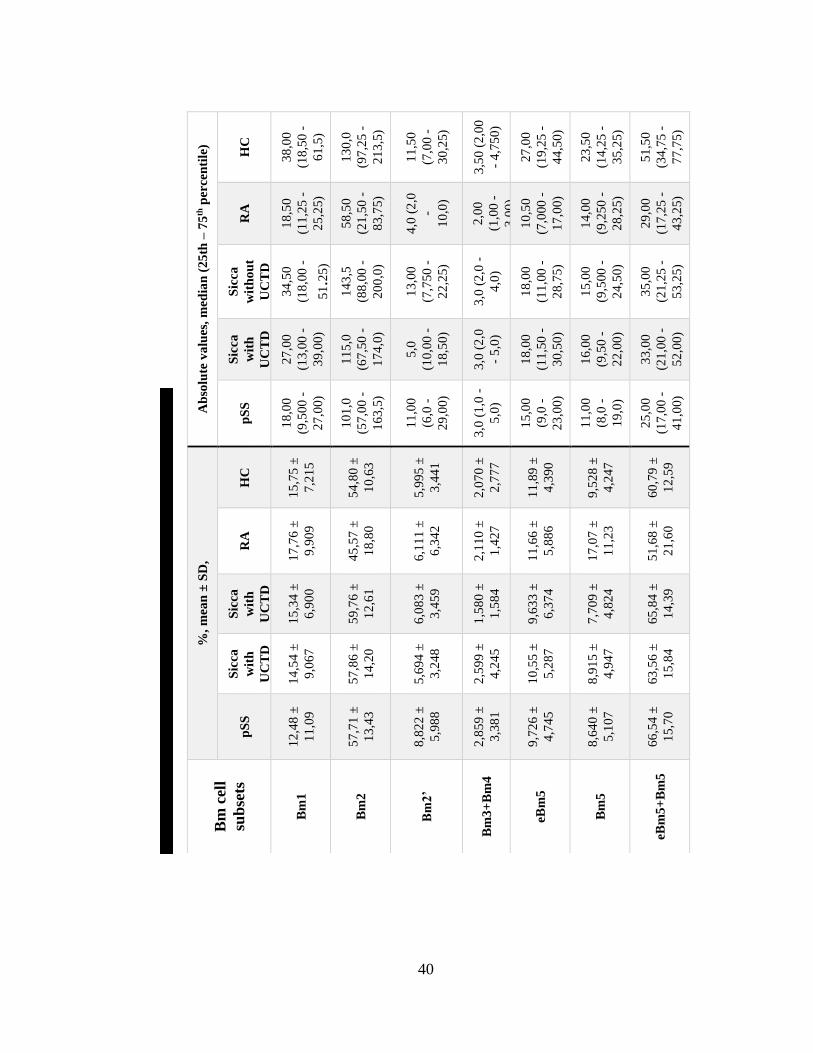
40
Ta
ble
13
. P
erce
nta
ges
(re
lati
ve
to t
ota
l B
cell
s) a
nd
ab
solu
te v
alu
es o
f B
m1
-Bm
5
cell
s.
Ab
solu
te v
alu
es,
med
ian
(2
5th
– 7
5th
per
cen
tile
)
HC
38
,00
(18
,50
-
61
,5)
13
0,0
(97
,25
-
21
3,5
)
11
,50
(7,0
0 -
30
,25)
3,5
0 (
2,0
0
- 4
,75
0)
27
,00
(19
,25
-
44
,50)
23
,50
(14
,25
-
35
,25)
51
,50
(34
,75
-
77
,75)
RA
18
,50
(11
,25
-
25
,25)
58
,50
(21
,50
-
83
,75)
4,0
(2
,0
-
10
,0)
2,0
0
(1,0
0 -
3,0
0)
10
,50
(7,0
00
-
17
,00)
14
,00
(9,2
50
-
28
,25)
29
,00
(17
,25
-
43
,25)
Sic
ca
wit
ho
ut
UC
TD
34
,50
(18
,00
-
51.2
5)
14
3,5
(88
,00
-
20
0,0
)
13
,00
(7,7
50
-
22
,25)
3,0
(2
,0 -
4,0
)
18
,00
(11
,00
-
28
,75)
15
,00
(9,5
00
-
24
,50)
35
,00
(21
,25
-
53
,25)
Sic
ca
wit
h
UC
TD
27
,00
(13
,00
-
39
,00)
11
5,0
(67
,50
-
17
4,0
)
5,0
(10
,00
-
18
,50)
3,0
(2
,0
- 5
,0)
18
,00
(11
,50
-
30
,50)
16
,00
(9,5
0 -
22
,00)
33
,00
(21
,00
-
52
,00)
pS
S
18
,00
(9,5
00
-
27
,00)
10
1,0
(57
,00
-
16
3,5
)
11
,00
(6,0
-
29
,00)
3,0
(1
,0 -
5,0
)
15
,00
(9,0
-
23
,00)
11
,00
(8,0
-
19
,0)
25
,00
(17
,00
-
41
,00)
%,
mea
n ±
SD
,
HC
15
,75 ±
7,2
15
54
,80 ±
10
,63
5,9
95 ±
3,4
41
2,0
70 ±
2,7
77
11
,89 ±
4,3
90
9,5
28 ±
4,2
47
60
,79 ±
12
,59
RA
17
,76 ±
9,9
09
45
,57 ±
18
,80
6,1
11 ±
6,3
42
2,1
10 ±
1,4
27
11
,66 ±
5,8
86
17
,07 ±
11
,23
51
,68 ±
21
,60
Sic
ca
wit
h
UC
TD
15
,34 ±
6,9
00
59
,76 ±
12
,61
6,0
83 ±
3,4
59
1,5
80 ±
1,5
84
9,6
33 ±
6,3
74
7,7
09 ±
4,8
24
65
,84 ±
14
,39
Sic
ca
wit
h
UC
TD
14
,54 ±
9,0
67
57
,86 ±
14
,20
5,6
94 ±
3,2
48
2,5
99 ±
4,2
45
10
,55 ±
5,2
87
8,9
15 ±
4,9
47
63
,56 ±
15
,84
pS
S
12
,48 ±
11
,09
57
,71 ±
13
,43
8,8
22 ±
5,9
88
2,8
59 ±
3,3
81
9,7
26 ±
4,7
45
8,6
40 ±
5,1
07
66
,54 ±
15
,70
Bm
cel
l
sub
sets
Bm
1
Bm
2
Bm
2’
Bm
3+
Bm
4
eBm
5
Bm
5
eBm
5+
Bm
5
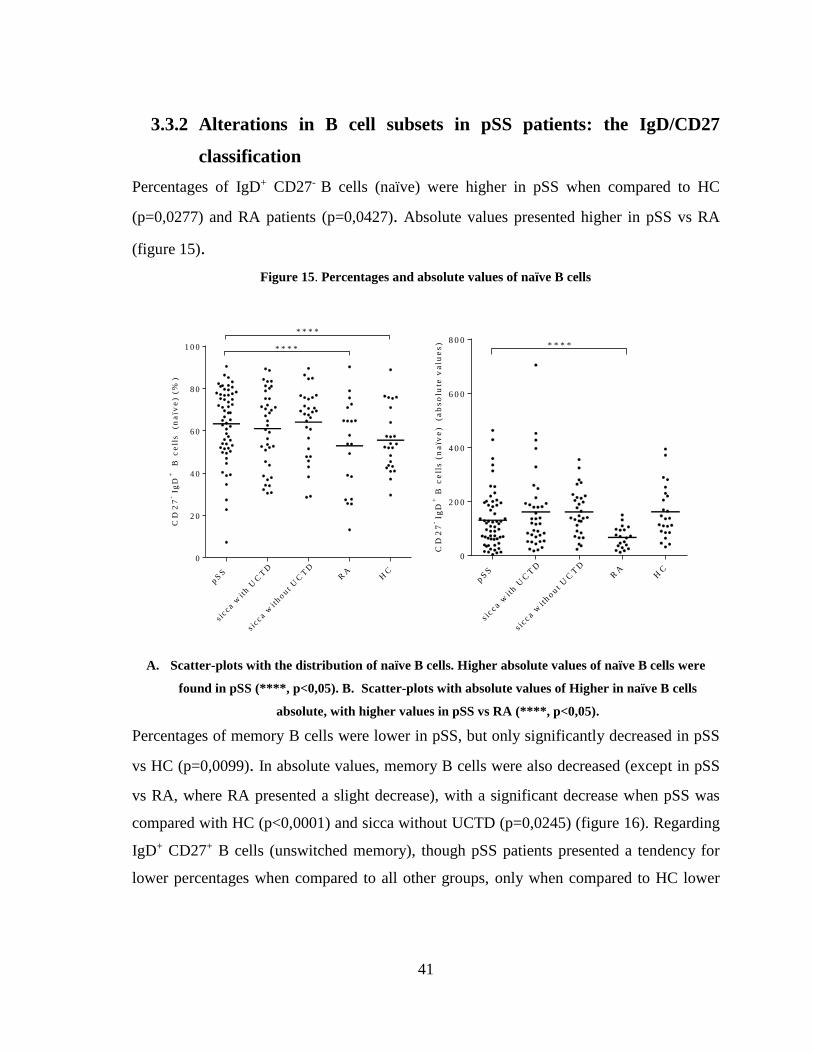
41
3.3.2 Alterations in B cell subsets in pSS patients: the IgD/CD27
classification
Percentages of IgD+ CD27- B cells (naïve) were higher in pSS when compared to HC
(p=0,0277) and RA patients (p=0,0427). Absolute values presented higher in pSS vs RA
(figure 15).
Figure 15. Percentages and absolute values of naïve B cells
CD
27
- Ig
D+
B
ce
lls
(n
aïv
e) (
%)
pS
S
s ic c a w
ith U
CT
D
s ic c a w
ithout U
CT
DR
AH
C
0
2 0
4 0
6 0
8 0
1 0 0 * * * *
* * * *
CD
27
-Ig
D+
B c
ell
s (
na
ïve
)
(ab
so
lute
va
lue
s)
pS
S
s ic c a w
ith U
CT
D
s ic c a w
ithout U
CT
DR
AH
C
0
2 0 0
4 0 0
6 0 0
8 0 0* * * *
A. Scatter-plots with the distribution of naïve B cells. Higher absolute values of naïve B cells were
found in pSS (****, p<0,05). B. Scatter-plots with absolute values of Higher in naïve B cells
absolute, with higher values in pSS vs RA (****, p<0,05).
Percentages of memory B cells were lower in pSS, but only significantly decreased in pSS
vs HC (p=0,0099). In absolute values, memory B cells were also decreased (except in pSS
vs RA, where RA presented a slight decrease), with a significant decrease when pSS was
compared with HC (p<0,0001) and sicca without UCTD (p=0,0245) (figure 16). Regarding
IgD+ CD27+ B cells (unswitched memory), though pSS patients presented a tendency for
lower percentages when compared to all other groups, only when compared to HC lower
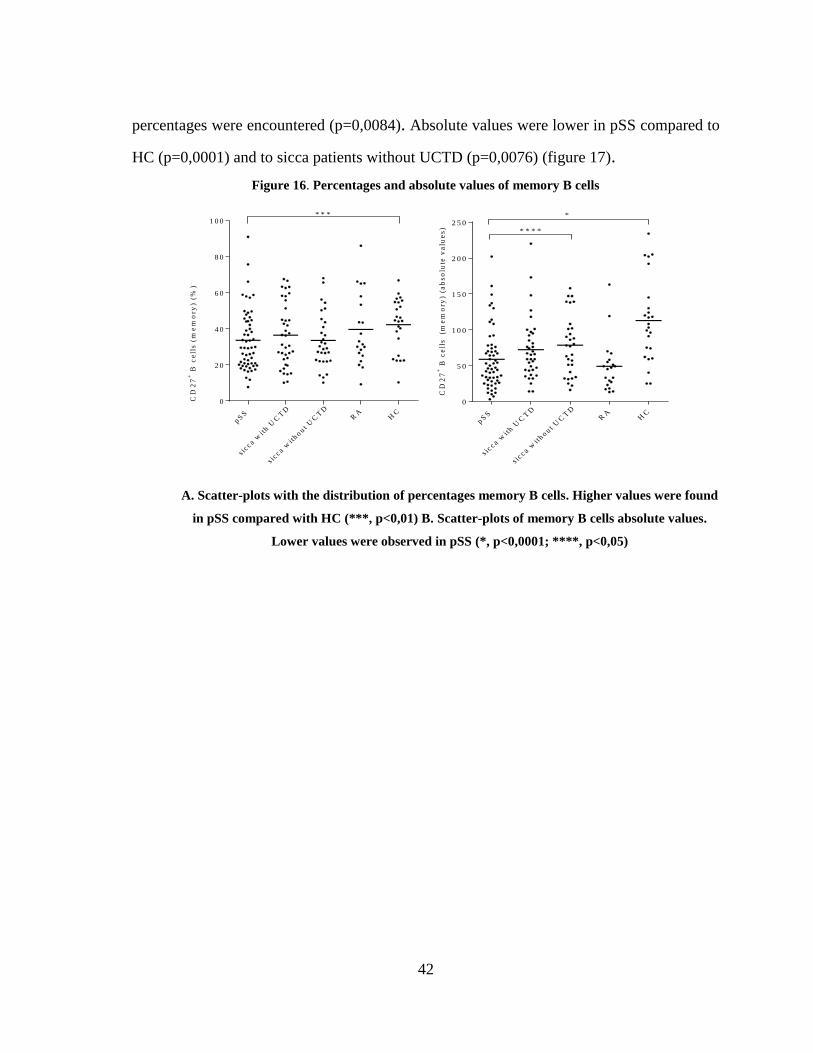
42
percentages were encountered (p=0,0084). Absolute values were lower in pSS compared to
HC (p=0,0001) and to sicca patients without UCTD (p=0,0076) (figure 17).
Figure 16. Percentages and absolute values of memory B cells
pS
S
s ic c a w
ith U
CT
D
s ic c a w
ithout
UC
TD
RA
HC
0
2 0
4 0
6 0
8 0
1 0 0
CD
27
+ B
ce
lls
(m
em
ory
) (%
)
* * *
CD
27
+ B
ce
lls
(m
em
ory
) (a
bs
olu
te v
alu
es
)
p SS
s icc a w
ith U
CT
D
s icc a w
ith o u t
UC
TD
RA
HC
0
5 0
1 0 0
1 5 0
2 0 0
2 5 0*
* * * *
A. Scatter-plots with the distribution of percentages memory B cells. Higher values were found
in pSS compared with HC (***, p<0,01) B. Scatter-plots of memory B cells absolute values.
Lower values were observed in pSS (*, p<0,0001; ****, p<0,05)
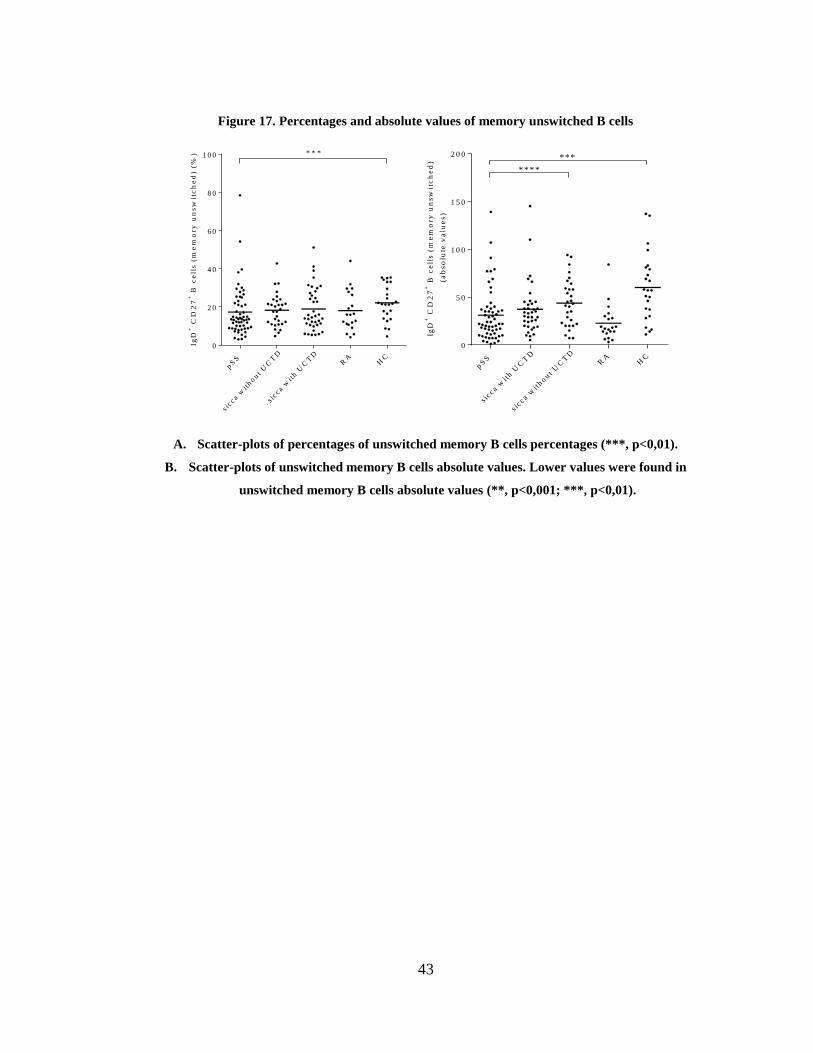
43
Figure 17. Percentages and absolute values of memory unswitched B cells
IgD
+ C
D2
7+
B c
ell
s (
me
mo
ry
un
sw
itc
he
d) (
%)
pS
S
s ic c a w
ithout U
CT
D
s ic c a w
ith U
CT
DR
AH
C
0
2 0
4 0
6 0
8 0
1 0 0 * * *
IgD
+ C
D2
7+
B c
ell
s (
me
mo
ry u
ns
wit
ch
ed
)
(a
bs
olu
te v
alu
es
)
pS
S
s ic c a w
ith U
CT
D
s ic c a w
ithout
UC
TD
RA
HC
0
5 0
1 0 0
1 5 0
2 0 0 ***
****
A. Scatter-plots of percentages of unswitched memory B cells percentages (***, p<0,01).
B. Scatter-plots of unswitched memory B cells absolute values. Lower values were found in
unswitched memory B cells absolute values (**, p<0,001; ***, p<0,01).
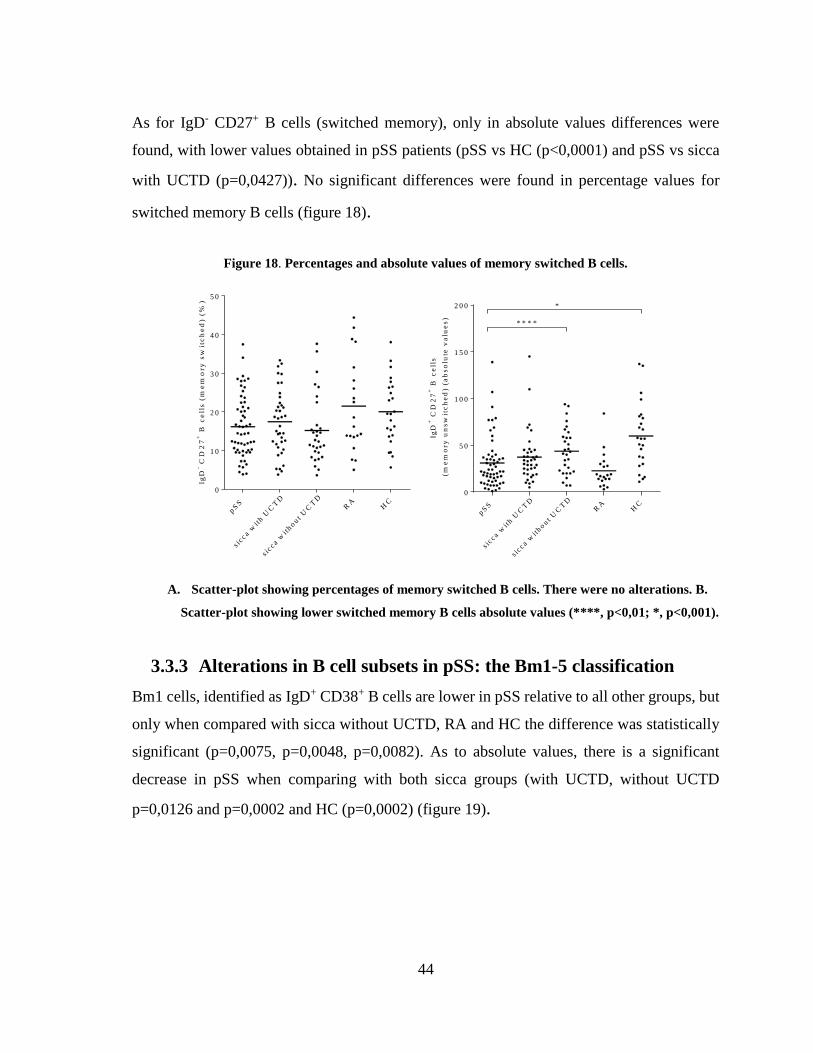
44
As for IgD- CD27+ B cells (switched memory), only in absolute values differences were
found, with lower values obtained in pSS patients (pSS vs HC (p<0,0001) and pSS vs sicca
with UCTD (p=0,0427)). No significant differences were found in percentage values for
switched memory B cells (figure 18).
Figure 18. Percentages and absolute values of memory switched B cells.
IgD
- CD
27
+ B
ce
lls
(m
em
ory
sw
itc
he
d) (
%)
pS
S
s ic c a w
ith U
CT
D
s ic c a w
ithout U
CT
DR
AH
C
0
1 0
2 0
3 0
4 0
5 0
IgD
+ C
D2
7+
B c
ell
s
(m
em
ory
un
sw
itc
he
d) (
ab
so
lute
va
lue
s)
pS
S
s ic c a w
ith U
CT
D
s ic c a w
ithout U
CT
DR
AH
C
0
5 0
1 0 0
1 5 0
2 0 0 *
* * * *
A. Scatter-plot showing percentages of memory switched B cells. There were no alterations. B.
Scatter-plot showing lower switched memory B cells absolute values (****, p<0,01; *, p<0,001).
3.3.3 Alterations in B cell subsets in pSS: the Bm1-5 classification
Bm1 cells, identified as IgD+ CD38+ B cells are lower in pSS relative to all other groups, but
only when compared with sicca without UCTD, RA and HC the difference was statistically
significant (p=0,0075, p=0,0048, p=0,0082). As to absolute values, there is a significant
decrease in pSS when comparing with both sicca groups (with UCTD, without UCTD
p=0,0126 and p=0,0002 and HC (p=0,0002) (figure 19).
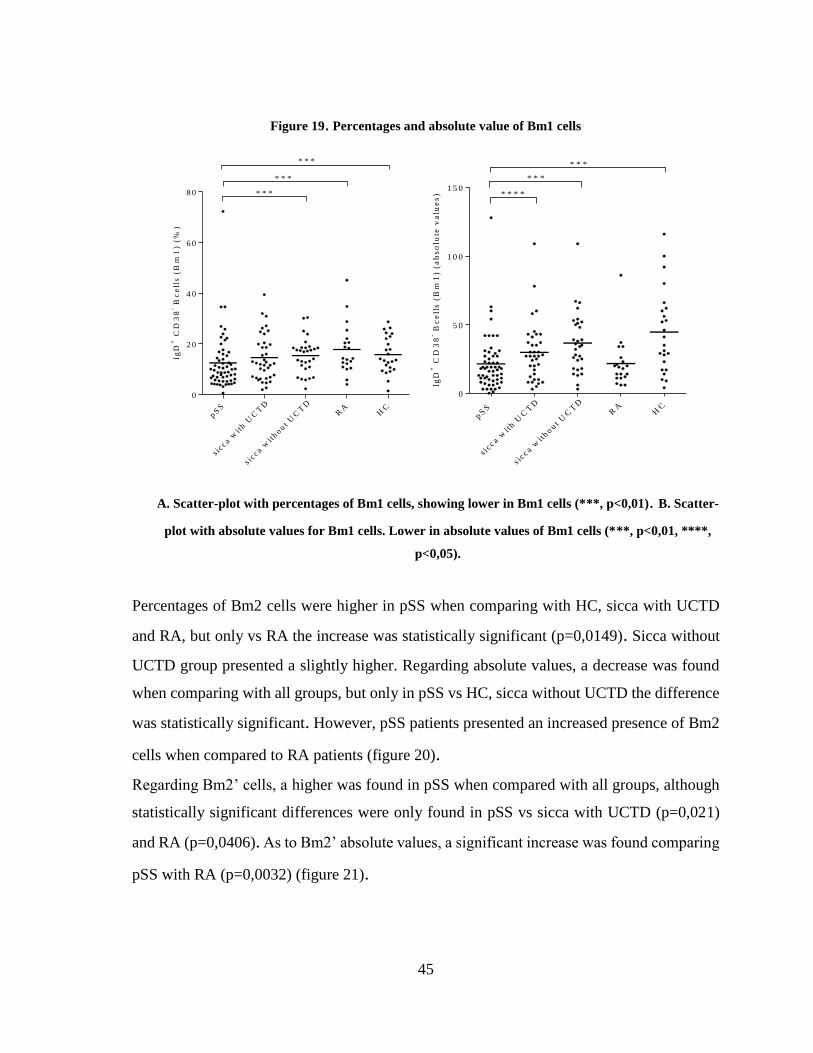
45
Figure 19. Percentages and absolute value of Bm1 cells
IgD
+ C
D3
8- B
ce
lls
(B
m1
) (
%)
pS
S
s ic c a w
ith U
CT
D
s ic c a w
ithout
UC
TD
RA
HC
0
2 0
4 0
6 0
8 0 * * *
* * *
* * *
IgD
+ C
D3
8- B
ce
lls
(B
m1
) (a
bs
olu
te v
alu
es
)
pS
S
s icc a w
ith U
CT
D
s icc a w
ithout
UC
TD
RA
HC
0
5 0
1 0 0
1 5 0* * * *
* * *
* * *
A. Scatter-plot with percentages of Bm1 cells, showing lower in Bm1 cells (***, p<0,01). B. Scatter-
plot with absolute values for Bm1 cells. Lower in absolute values of Bm1 cells (***, p<0,01, ****,
p<0,05).
Percentages of Bm2 cells were higher in pSS when comparing with HC, sicca with UCTD
and RA, but only vs RA the increase was statistically significant (p=0,0149). Sicca without
UCTD group presented a slightly higher. Regarding absolute values, a decrease was found
when comparing with all groups, but only in pSS vs HC, sicca without UCTD the difference
was statistically significant. However, pSS patients presented an increased presence of Bm2
cells when compared to RA patients (figure 20).
Regarding Bm2’ cells, a higher was found in pSS when compared with all groups, although
statistically significant differences were only found in pSS vs sicca with UCTD (p=0,021)
and RA (p=0,0406). As to Bm2’ absolute values, a significant increase was found comparing
pSS with RA (p=0,0032) (figure 21).
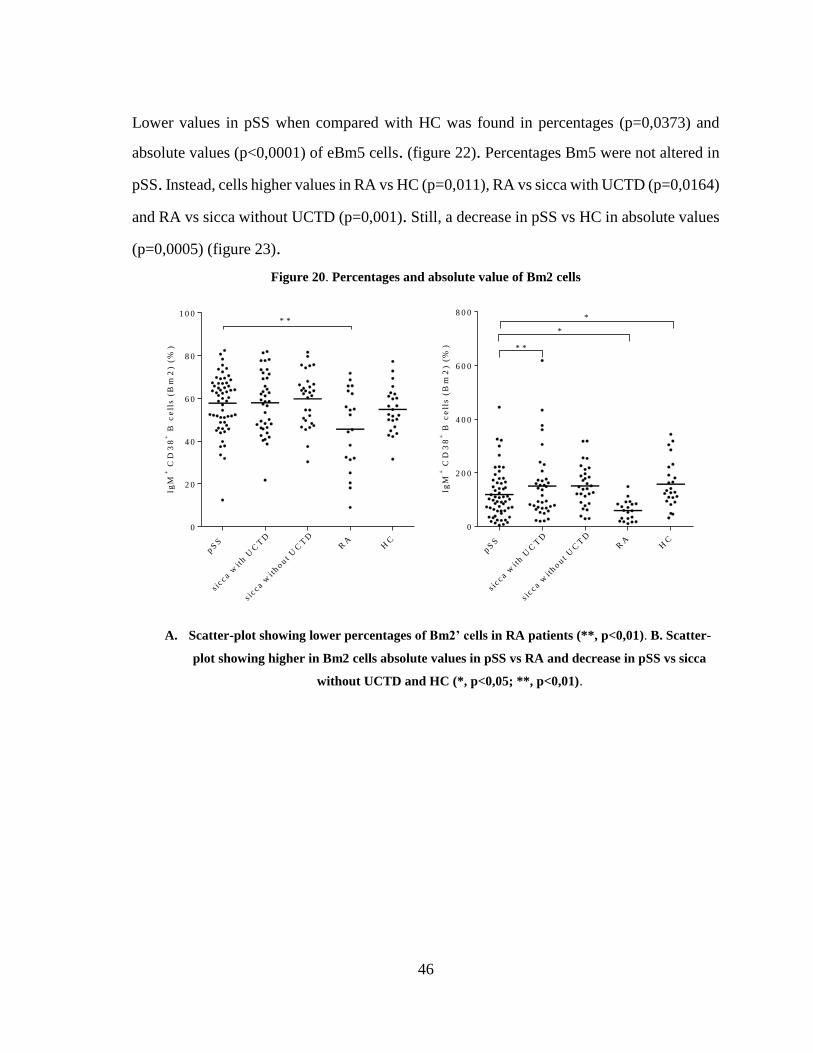
46
Lower values in pSS when compared with HC was found in percentages (p=0,0373) and
absolute values (p<0,0001) of eBm5 cells. (figure 22). Percentages Bm5 were not altered in
pSS. Instead, cells higher values in RA vs HC (p=0,011), RA vs sicca with UCTD (p=0,0164)
and RA vs sicca without UCTD (p=0,001). Still, a decrease in pSS vs HC in absolute values
(p=0,0005) (figure 23).
Figure 20. Percentages and absolute value of Bm2 cells
IgM
+ C
D3
8+
B c
ell
s (
Bm
2) (
%)
pS
S
s ic c a w
ith U
CT
D
s ic c a w
ithout U
CT
DR
AH
C
0
2 0
4 0
6 0
8 0
1 0 0* *
IgM
+ C
D3
8+
B c
ell
s (
Bm
2)
(%)
pS
S
s ic c a w
ith U
CT
D
s ic c a w
ithout U
CT
DR
AH
C
0
2 0 0
4 0 0
6 0 0
8 0 0*
*
* *
A. Scatter-plot showing lower percentages of Bm2’ cells in RA patients (**, p<0,01). B. Scatter-
plot showing higher in Bm2 cells absolute values in pSS vs RA and decrease in pSS vs sicca
without UCTD and HC (*, p<0,05; **, p<0,01).
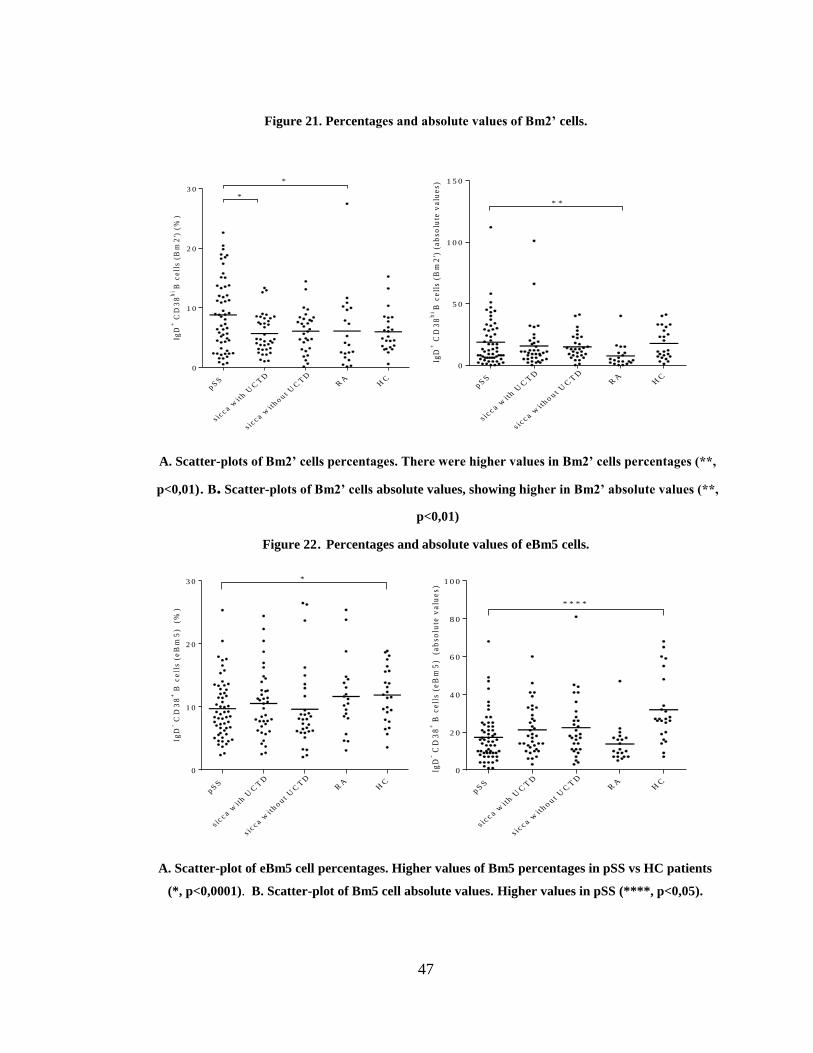
47
Figure 21. Percentages and absolute values of Bm2’ cells.
IgD
+ C
D3
8h
iB
ce
lls
(B
m2
') (
%)
p SS
s icc a w
ith U
CT
D
s icc a w
ith o u t
UC
TD
RA
HC
0
1 0
2 0
3 0*
*
IgD
+ C
D3
8h
iB
ce
lls
(Bm
2')
(a
bso
lute
va
lue
s)
p SS
s icc a w
ith U
CT
D
s icc a w
ith o u t
UC
TD
RA
HC
0
5 0
1 0 0
1 5 0
* *
A. Scatter-plots of Bm2’ cells percentages. There were higher values in Bm2’ cells percentages (**,
p<0,01). B. Scatter-plots of Bm2’ cells absolute values, showing higher in Bm2’ absolute values (**,
p<0,01)
Figure 22. Percentages and absolute values of eBm5 cells.
IgD
- CD
38
+B
ce
lls
(e
Bm
5)
(%
)
p SS
s icc a w
ith U
CT
D
s icc a w
ith o u t
UC
TD
RA
HC
0
1 0
2 0
3 0 *
p SS
s icc a w
ith U
CT
D
s icc a w
ith o u t
UC
TD
RA
HC
0
2 0
4 0
6 0
8 0
1 0 0
IgD
- CD
38
+B
ce
lls
(eB
m5
) (
ab
so
lute
va
lue
s)
* * * *
A. Scatter-plot of eBm5 cell percentages. Higher values of Bm5 percentages in pSS vs HC patients
(*, p<0,0001). B. Scatter-plot of Bm5 cell absolute values. Higher values in pSS (****, p<0,05).
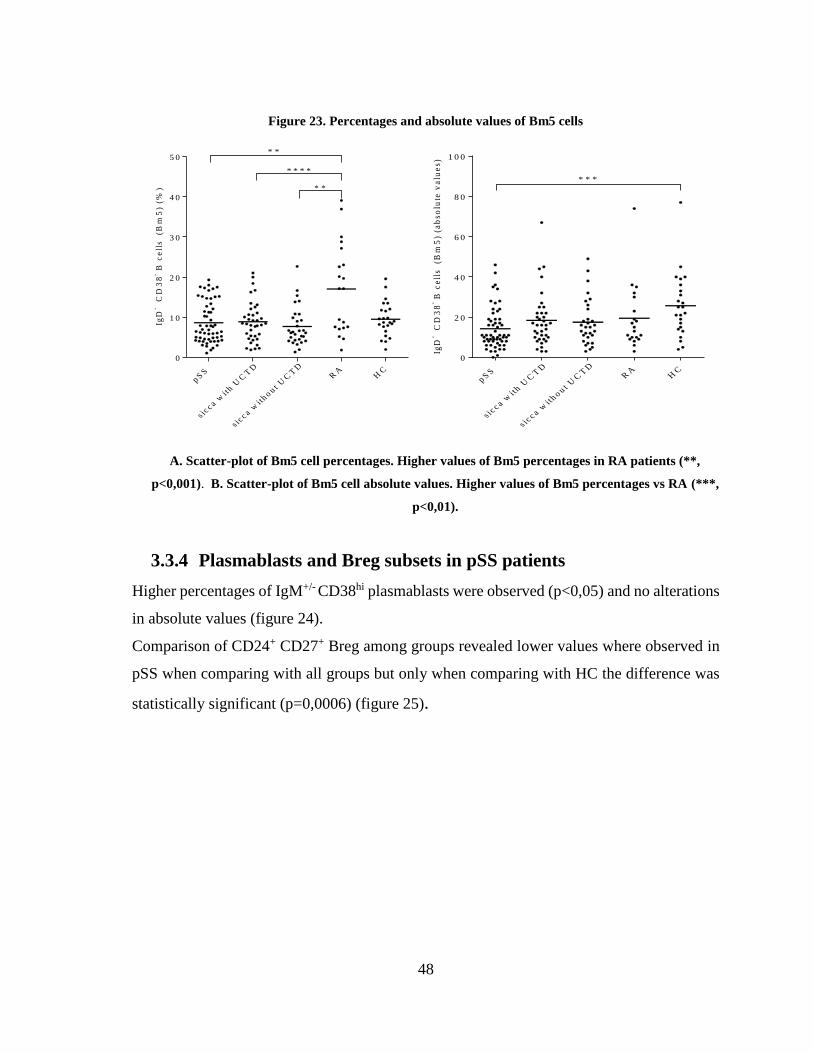
48
Figure 23. Percentages and absolute values of Bm5 cells
IgD
- C
D3
8- B
ce
lls
(B
m5
) (%
)
p SS
s icc a w
ith U
CT
D
s icc a w
ith o u t
UC
TD
RA
HC
0
1 0
2 0
3 0
4 0
5 0* *
* *
* * * *
IgD
- C
D3
8- B
ce
lls
(B
m5
) (a
bs
olu
te v
alu
es
)
p SS
s icc a w
ith U
CT
D
s icc a w
ith o u t
UC
TD
RA
HC
0
2 0
4 0
6 0
8 0
1 0 0
* * *
A. Scatter-plot of Bm5 cell percentages. Higher values of Bm5 percentages in RA patients (**,
p<0,001). B. Scatter-plot of Bm5 cell absolute values. Higher values of Bm5 percentages vs RA (***,
p<0,01).
3.3.4 Plasmablasts and Breg subsets in pSS patients
Higher percentages of IgM+/- CD38hi plasmablasts were observed (p<0,05) and no alterations
in absolute values (figure 24).
Comparison of CD24+ CD27+ Breg among groups revealed lower values where observed in
pSS when comparing with all groups but only when comparing with HC the difference was
statistically significant (p=0,0006) (figure 25).
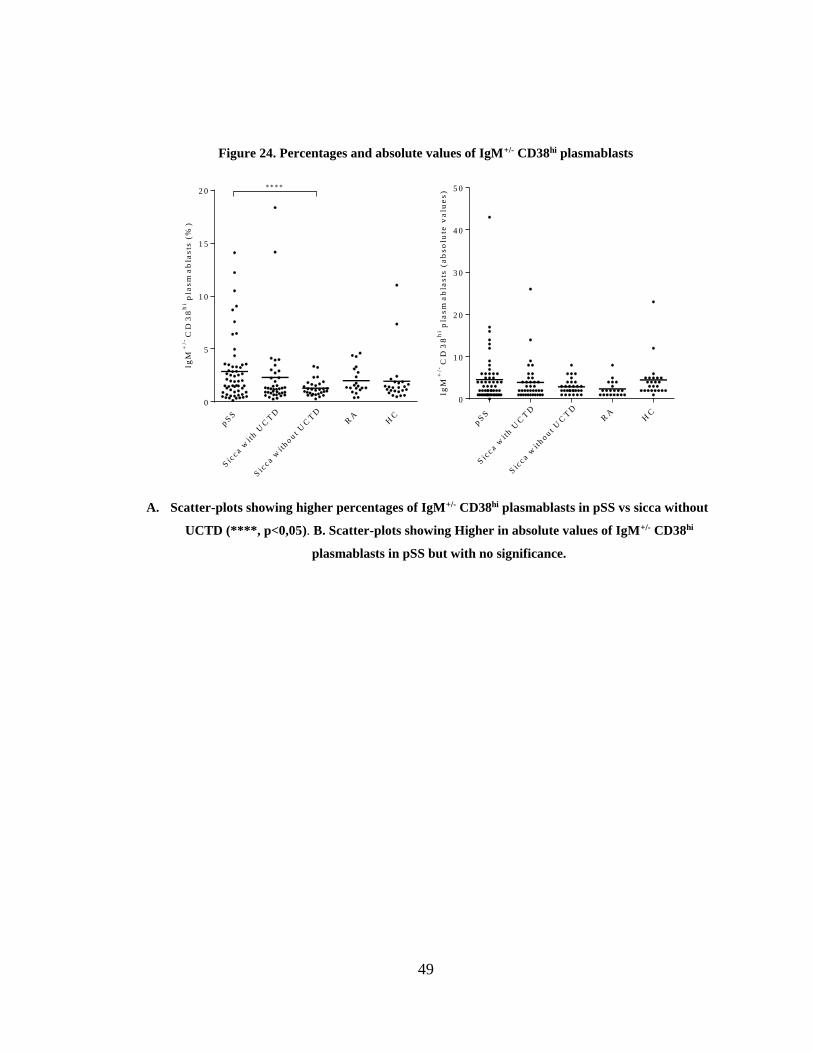
49
Figure 24. Percentages and absolute values of IgM+/- CD38hi plasmablasts
Ig
M+
/-C
D3
8h
i pla
sm
ab
las
ts (
%)
pS
S
Sic
c a wit
h U
CT
D
Sic
c a wit
hout U
CT
DR
AH
C
0
5
1 0
1 5
2 0* * * *
IgM
+/-
CD
38
hi p
las
ma
bla
sts
(a
bs
olu
te v
alu
es
)
pS
S
Sic
c a wit
h U
CT
D
Sic
c a wit
hout U
CT
DR
AH
C
0
1 0
2 0
3 0
4 0
5 0
A. Scatter-plots showing higher percentages of IgM+/- CD38hi plasmablasts in pSS vs sicca without
UCTD (****, p<0,05). B. Scatter-plots showing Higher in absolute values of IgM+/- CD38hi
plasmablasts in pSS but with no significance.
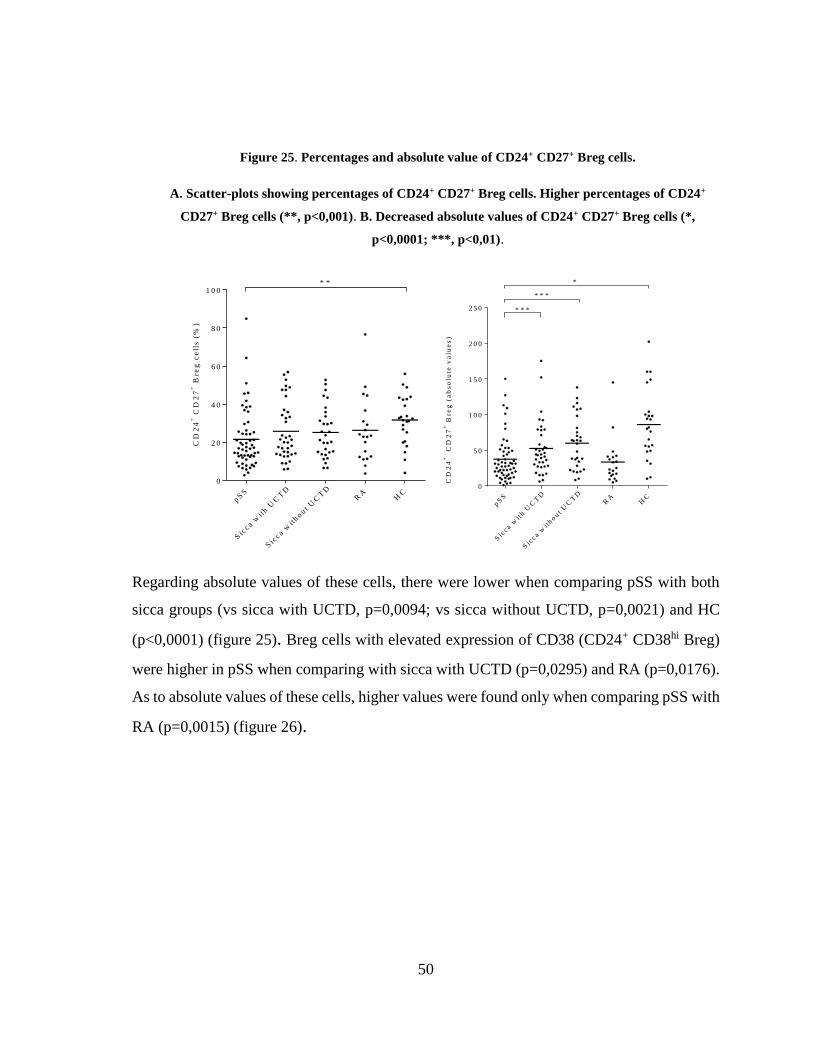
50
Figure 25. Percentages and absolute value of CD24+ CD27+ Breg cells.
A. Scatter-plots showing percentages of CD24+ CD27+ Breg cells. Higher percentages of CD24+
CD27+ Breg cells (**, p<0,001). B. Decreased absolute values of CD24+ CD27+ Breg cells (*,
p<0,0001; ***, p<0,01).
CD
24
+ C
D2
7+
Bre
g c
ell
s (
%)
pS
S
Sic
c a wit
h U
CT
D
Sic
c a wit
hout
UC
TD
RA
HC
0
2 0
4 0
6 0
8 0
1 0 0* *
pS
S
Sic
c a wit
h U
CT
D
Sic
c a wit
hout U
CT
DR
AH
C
0
5 0
1 0 0
1 5 0
2 0 0
2 5 0 * * *
* * *
*
CD
24
+
CD
27
+ B
reg
(a
bs
olu
te v
alu
es
)
Regarding absolute values of these cells, there were lower when comparing pSS with both
sicca groups (vs sicca with UCTD, p=0,0094; vs sicca without UCTD, p=0,0021) and HC
(p<0,0001) (figure 25). Breg cells with elevated expression of CD38 (CD24+ CD38hi Breg)
were higher in pSS when comparing with sicca with UCTD (p=0,0295) and RA (p=0,0176).
As to absolute values of these cells, higher values were found only when comparing pSS with
RA (p=0,0015) (figure 26).
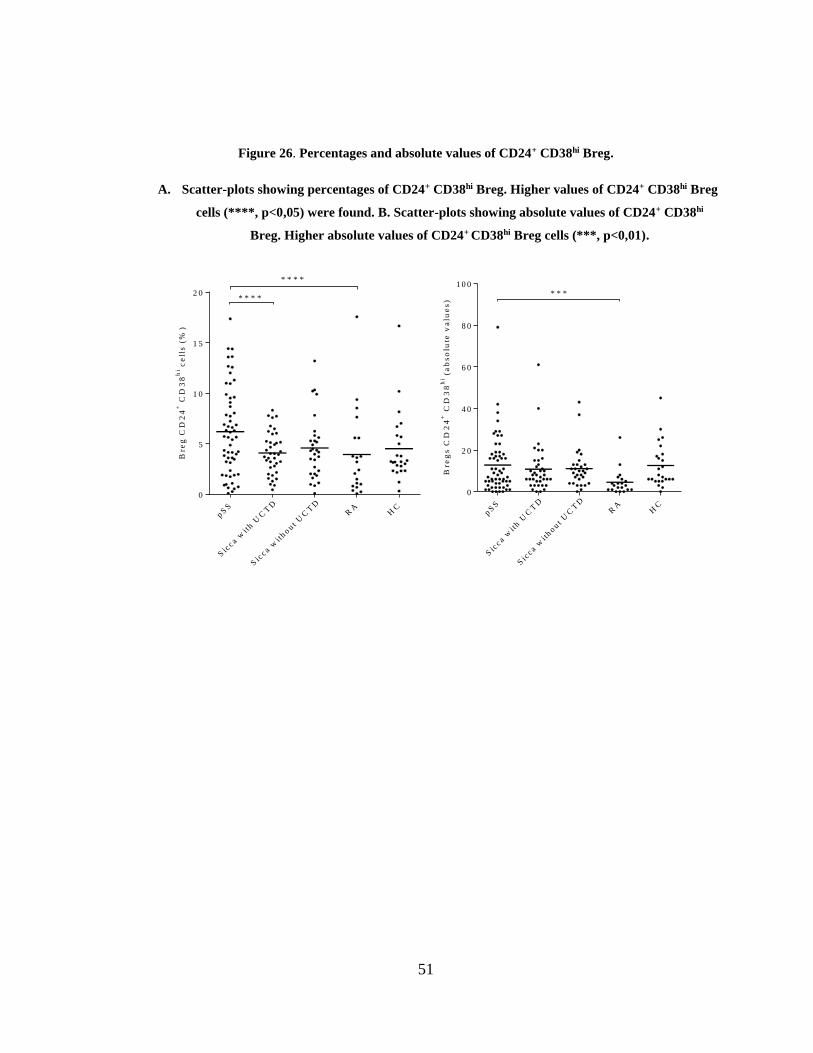
51
Figure 26. Percentages and absolute values of CD24+ CD38hi Breg.
A. Scatter-plots showing percentages of CD24+ CD38hi Breg. Higher values of CD24+ CD38hi Breg
cells (****, p<0,05) were found. B. Scatter-plots showing absolute values of CD24+ CD38hi
Breg. Higher absolute values of CD24+ CD38hi Breg cells (***, p<0,01).
Bre
g C
D2
4+
CD
38
hi c
ell
s (
%)
pS
S
Sic
c a wit
h U
CT
D
Sic
c a wit
hout
UC
TD
RA
HC
0
5
1 0
1 5
2 0* * * *
* * * *
Bre
gs
CD
24
+ C
D3
8h
i (a
bs
olu
te v
alu
es
)
pS
S
Sic
c a wit
h U
CT
D
Sic
c a wit
hout U
CT
DR
AH
C
0
2 0
4 0
6 0
8 0
1 0 0* * *
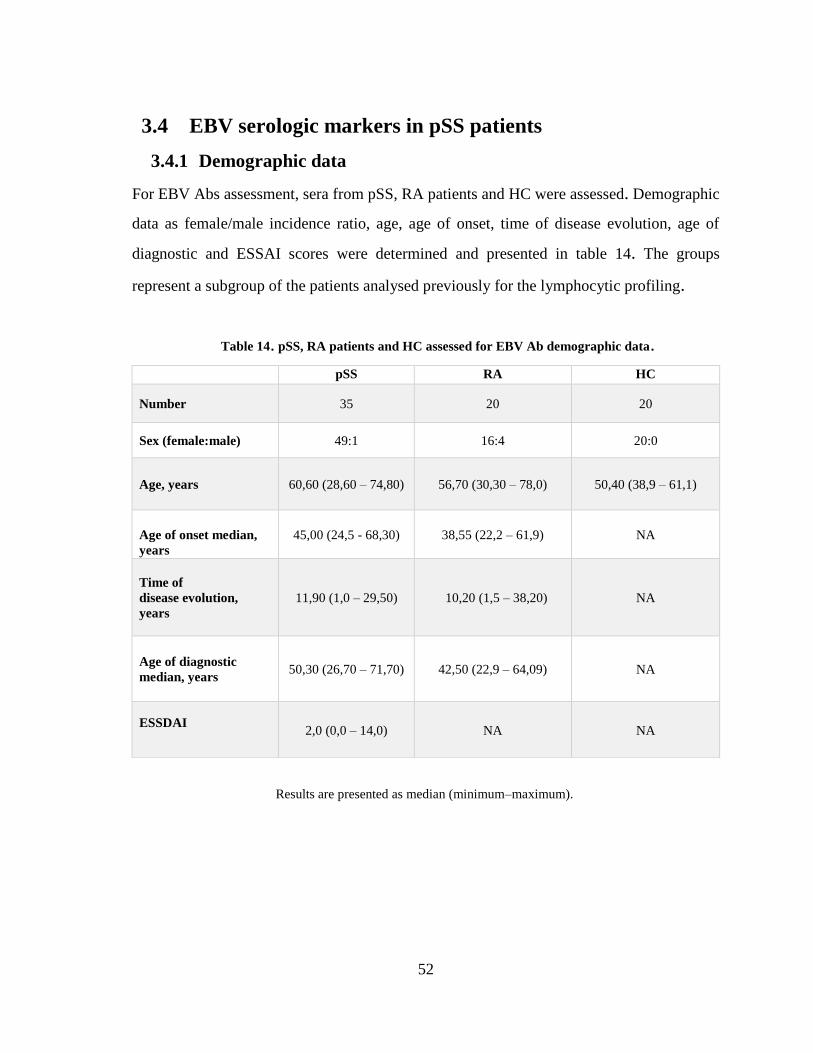
52
3.4 EBV serologic markers in pSS patients
3.4.1 Demographic data
For EBV Abs assessment, sera from pSS, RA patients and HC were assessed. Demographic
data as female/male incidence ratio, age, age of onset, time of disease evolution, age of
diagnostic and ESSAI scores were determined and presented in table 14. The groups
represent a subgroup of the patients analysed previously for the lymphocytic profiling.
Table 14. pSS, RA patients and HC assessed for EBV Ab demographic data.
Results are presented as median (minimum–maximum).
pSS RA HC
Number 35 20 20
Sex (female:male) 49:1 16:4 20:0
Age, years 60,60 (28,60 – 74,80) 56,70 (30,30 – 78,0) 50,40 (38,9 – 61,1)
Age of onset median,
years
45,00 (24,5 - 68,30) 38,55 (22,2 – 61,9) NA
Time of
disease evolution,
years
11,90 (1,0 – 29,50) 10,20 (1,5 – 38,20) NA
Age of diagnostic
median, years 50,30 (26,70 – 71,70) 42,50 (22,9 – 64,09) NA
ESSDAI
2,0 (0,0 – 14,0) NA NA
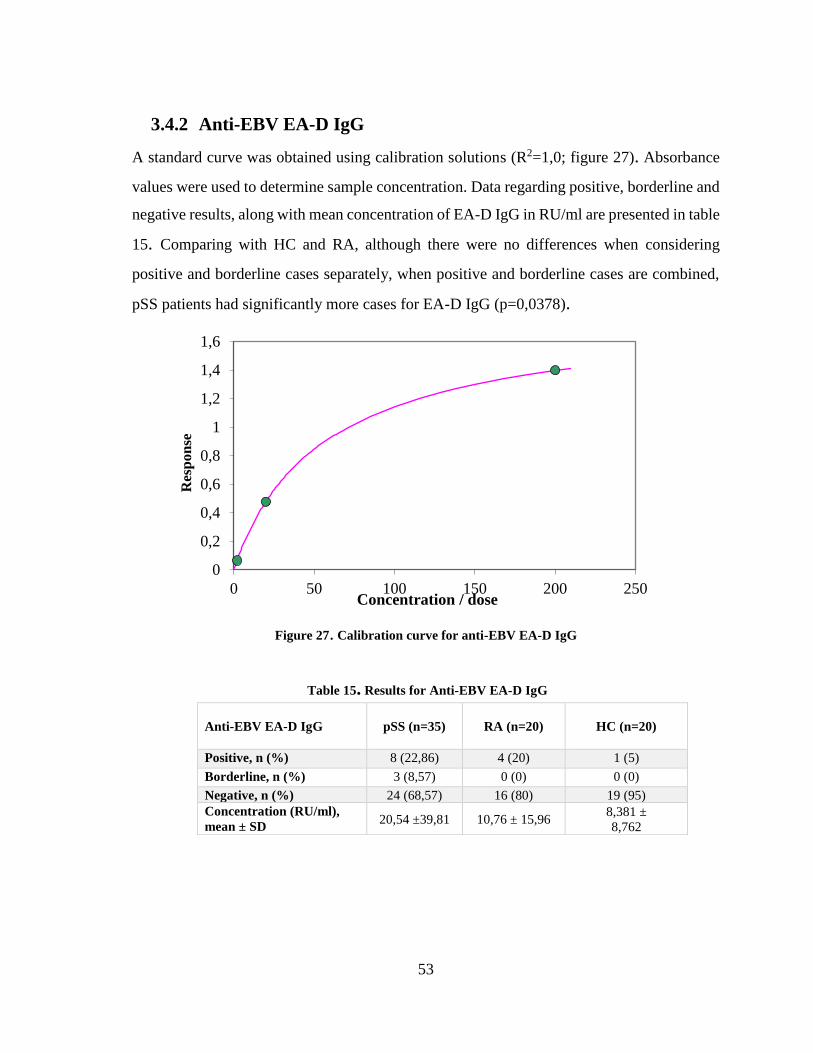
53
3.4.2 Anti-EBV EA-D IgG
A standard curve was obtained using calibration solutions (R2=1,0; figure 27). Absorbance
values were used to determine sample concentration. Data regarding positive, borderline and
negative results, along with mean concentration of EA-D IgG in RU/ml are presented in table
15. Comparing with HC and RA, although there were no differences when considering
positive and borderline cases separately, when positive and borderline cases are combined,
pSS patients had significantly more cases for EA-D IgG (p=0,0378).
Figure 27. Calibration curve for anti-EBV EA-D IgG
Table 15. Results for Anti-EBV EA-D IgG
Anti-EBV EA-D IgG
pSS (n=35) RA (n=20) HC (n=20)
Positive, n (%) 8 (22,86) 4 (20) 1 (5)
Borderline, n (%) 3 (8,57) 0 (0) 0 (0)
Negative, n (%) 24 (68,57) 16 (80) 19 (95)
Concentration (RU/ml),
mean ± SD 20,54 ±39,81 10,76 ± 15,96
8,381 ±
8,762
0
0,2
0,4
0,6
0,8
1
1,2
1,4
1,6
0 50 100 150 200 250
Res
pon
se
Concentration / dose
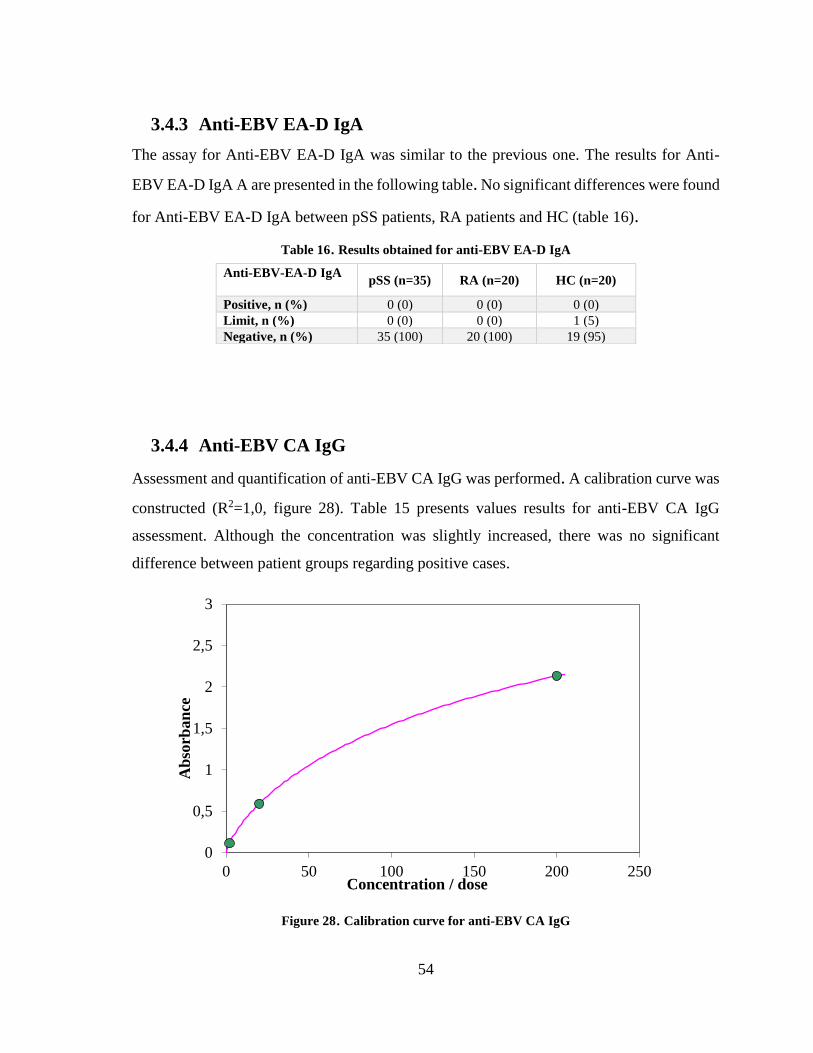
54
3.4.3 Anti-EBV EA-D IgA
The assay for Anti-EBV EA-D IgA was similar to the previous one. The results for Anti-
EBV EA-D IgA A are presented in the following table. No significant differences were found
for Anti-EBV EA-D IgA between pSS patients, RA patients and HC (table 16).
Table 16. Results obtained for anti-EBV EA-D IgA
3.4.4 Anti-EBV CA IgG
Assessment and quantification of anti-EBV CA IgG was performed. A calibration curve was
constructed (R2=1,0, figure 28). Table 15 presents values results for anti-EBV CA IgG
assessment. Although the concentration was slightly increased, there was no significant
difference between patient groups regarding positive cases.
Figure 28. Calibration curve for anti-EBV CA IgG
Anti-EBV-EA-D IgA
pSS (n=35) RA (n=20) HC (n=20)
Positive, n (%) 0 (0) 0 (0) 0 (0)
Limit, n (%) 0 (0) 0 (0) 1 (5)
Negative, n (%) 35 (100) 20 (100) 19 (95)
0
0,5
1
1,5
2
2,5
3
0 50 100 150 200 250
Ab
sorb
an
ce
Concentration / dose
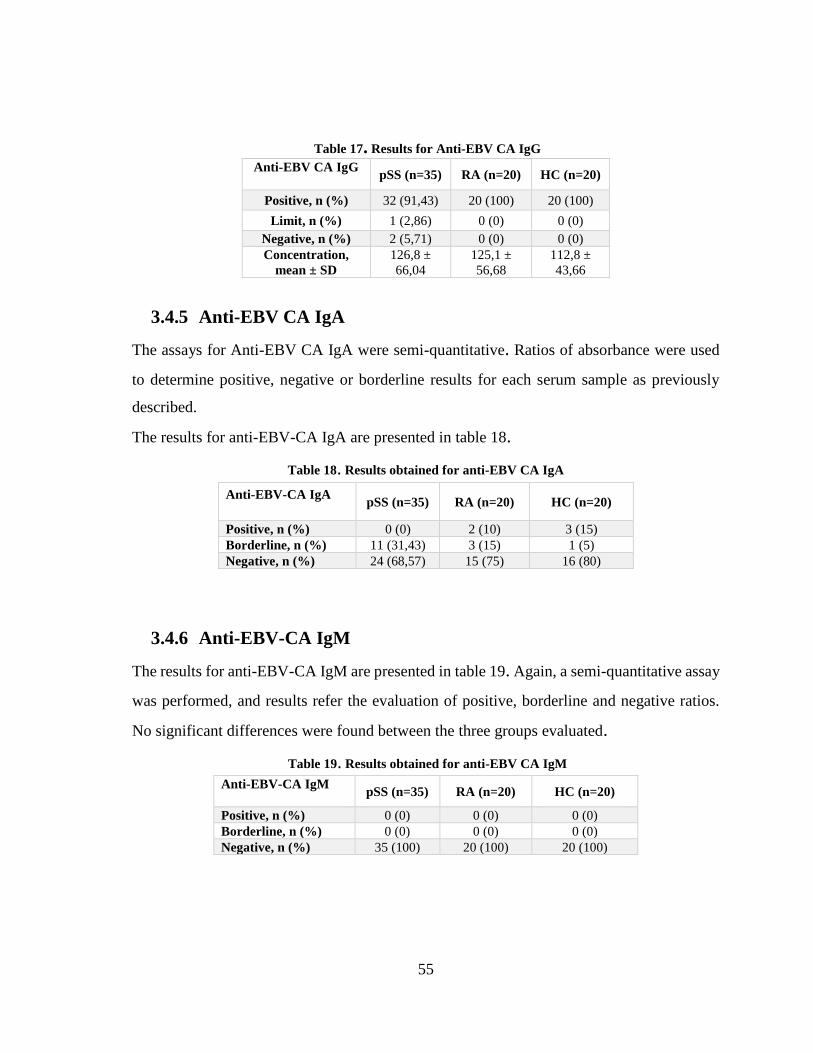
55
Table 17. Results for Anti-EBV CA IgG
3.4.5 Anti-EBV CA IgA
The assays for Anti-EBV CA IgA were semi-quantitative. Ratios of absorbance were used
to determine positive, negative or borderline results for each serum sample as previously
described.
The results for anti-EBV-CA IgA are presented in table 18.
Table 18. Results obtained for anti-EBV CA IgA
3.4.6 Anti-EBV-CA IgM
The results for anti-EBV-CA IgM are presented in table 19. Again, a semi-quantitative assay
was performed, and results refer the evaluation of positive, borderline and negative ratios.
No significant differences were found between the three groups evaluated.
Table 19. Results obtained for anti-EBV CA IgM
Anti-EBV CA IgG
pSS (n=35) RA (n=20) HC (n=20)
Positive, n (%) 32 (91,43) 20 (100) 20 (100)
Limit, n (%) 1 (2,86) 0 (0) 0 (0)
Negative, n (%) 2 (5,71) 0 (0) 0 (0)
Concentration,
mean ± SD
126,8 ±
66,04
125,1 ±
56,68
112,8 ±
43,66
Anti-EBV-CA IgA
pSS (n=35) RA (n=20) HC (n=20)
Positive, n (%) 0 (0) 2 (10) 3 (15)
Borderline, n (%) 11 (31,43) 3 (15) 1 (5)
Negative, n (%) 24 (68,57) 15 (75) 16 (80)
Anti-EBV-CA IgM
pSS (n=35) RA (n=20) HC (n=20)
Positive, n (%) 0 (0) 0 (0) 0 (0)
Borderline, n (%) 0 (0) 0 (0) 0 (0)
Negative, n (%) 35 (100) 20 (100) 20 (100)
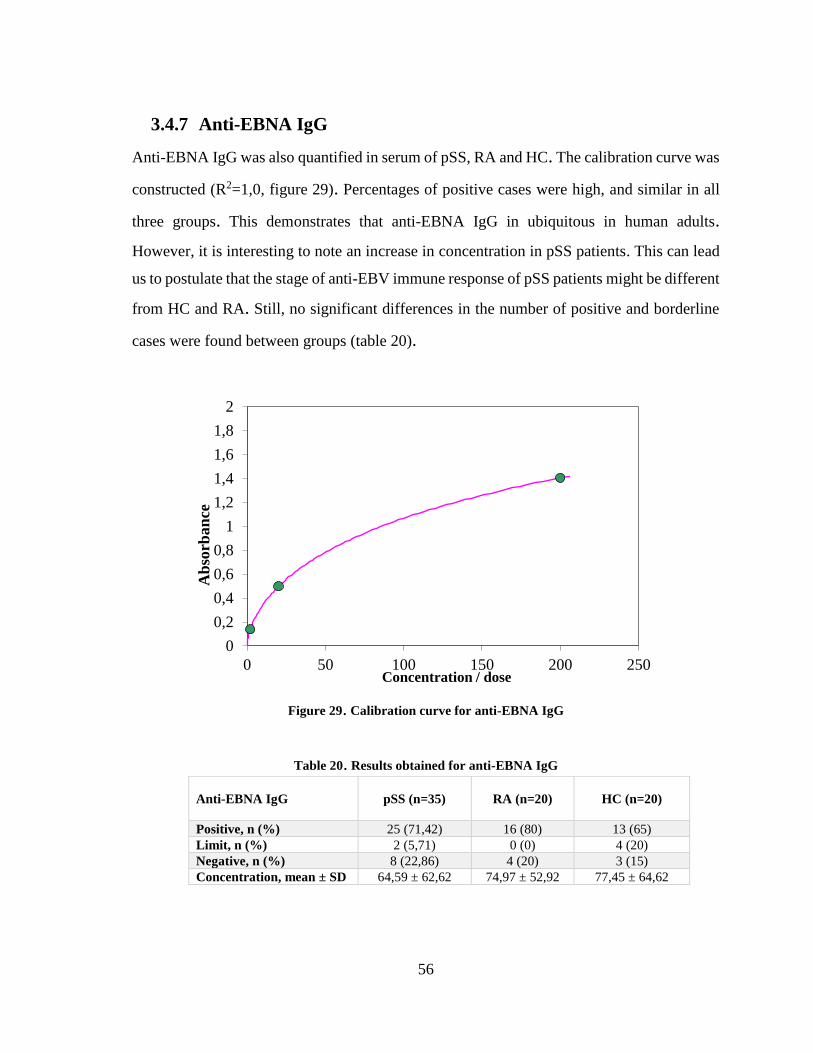
56
3.4.7 Anti-EBNA IgG
Anti-EBNA IgG was also quantified in serum of pSS, RA and HC. The calibration curve was
constructed (R2=1,0, figure 29). Percentages of positive cases were high, and similar in all
three groups. This demonstrates that anti-EBNA IgG in ubiquitous in human adults.
However, it is interesting to note an increase in concentration in pSS patients. This can lead
us to postulate that the stage of anti-EBV immune response of pSS patients might be different
from HC and RA. Still, no significant differences in the number of positive and borderline
cases were found between groups (table 20).
Figure 29. Calibration curve for anti-EBNA IgG
Table 20. Results obtained for anti-EBNA IgG
0
0,2
0,4
0,6
0,8
1
1,2
1,4
1,6
1,8
2
0 50 100 150 200 250
Ab
sorb
an
ce
Concentration / dose
Anti-EBNA IgG pSS (n=35) RA (n=20) HC (n=20)
Positive, n (%) 25 (71,42) 16 (80) 13 (65)
Limit, n (%) 2 (5,71) 0 (0) 4 (20)
Negative, n (%) 8 (22,86) 4 (20) 3 (15)
Concentration, mean ± SD 64,59 ± 62,62 74,97 ± 52,92 77,45 ± 64,62
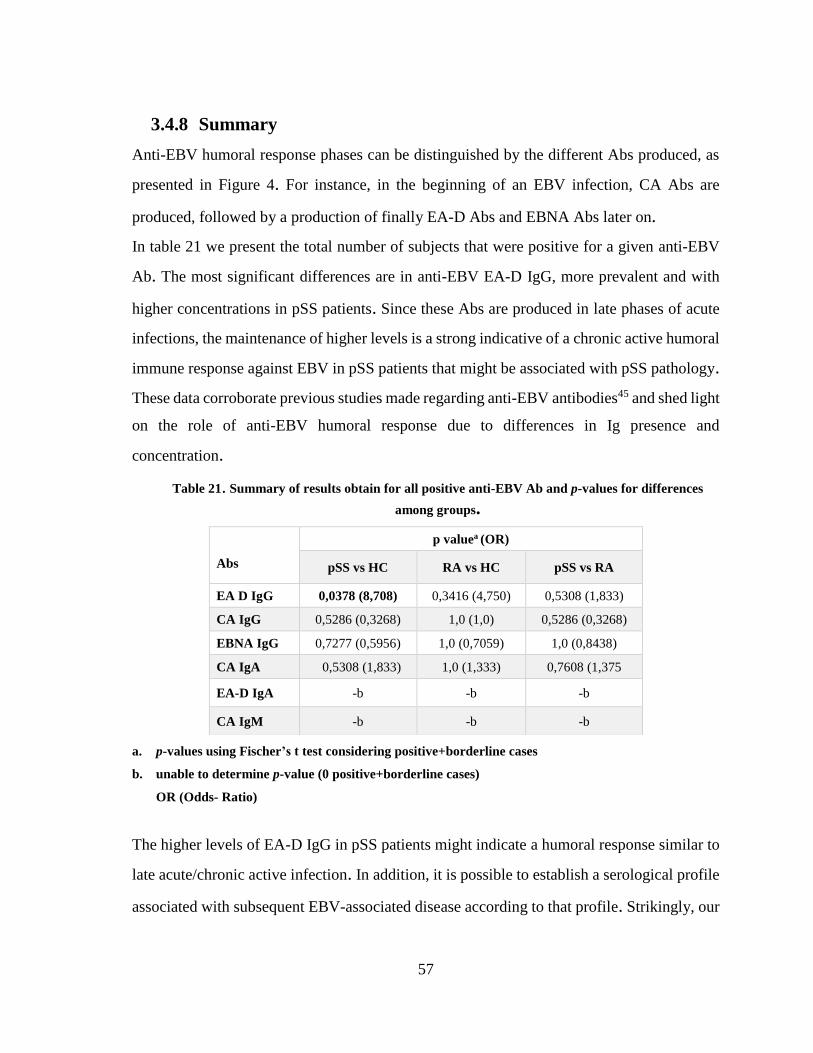
57
3.4.8 Summary
Anti-EBV humoral response phases can be distinguished by the different Abs produced, as
presented in Figure 4. For instance, in the beginning of an EBV infection, CA Abs are
produced, followed by a production of finally EA-D Abs and EBNA Abs later on.
In table 21 we present the total number of subjects that were positive for a given anti-EBV
Ab. The most significant differences are in anti-EBV EA-D IgG, more prevalent and with
higher concentrations in pSS patients. Since these Abs are produced in late phases of acute
infections, the maintenance of higher levels is a strong indicative of a chronic active humoral
immune response against EBV in pSS patients that might be associated with pSS pathology.
These data corroborate previous studies made regarding anti-EBV antibodies45 and shed light
on the role of anti-EBV humoral response due to differences in Ig presence and
concentration.
Table 21. Summary of results obtain for all positive anti-EBV Ab and p-values for differences
among groups.
a. p-values using Fischer’s t test considering positive+borderline cases
b. unable to determine p-value (0 positive+borderline cases)
OR (Odds- Ratio)
The higher levels of EA-D IgG in pSS patients might indicate a humoral response similar to
late acute/chronic active infection. In addition, it is possible to establish a serological profile
associated with subsequent EBV-associated disease according to that profile. Strikingly, our
Abs
p valuea (OR)
pSS vs HC RA vs HC pSS vs RA
EA D IgG 0,0378 (8,708) 0,3416 (4,750) 0,5308 (1,833)
CA IgG 0,5286 (0,3268) 1,0 (1,0) 0,5286 (0,3268)
EBNA IgG 0,7277 (0,5956) 1,0 (0,7059) 1,0 (0,8438)
CA IgA 0,5308 (1,833) 1,0 (1,333) 0,7608 (1,375
EA-D IgA -b -b -b
CA IgM -b -b -b
58
study demonstrates that pSS patients fit into the chronic infection profile described in the
literature.73 This is a clue that, in fact, an underlying humoral response characteristic of
chronic infection is present in pSS.
However, these results do not assure an active EBV infection is taking place and directly
inducing autoimmunity. In fact, we observed negative results for Anti-EBV-CA antigen IgM
in all pSS patients evaluated, despite we recognize that the presence of antibodies directed to
EBV-CA antigens are mostly restricted to an initial phase post-acute infection. Nevertheless,
to determine if an actual active infection is taking place, viral load of EBV should be assessed
by polymerase chain reaction (PCR). The quantification of viral DNA in PB is considered
the best method for the assessment and confirmation of an EBV active infection.43 Still,
ELISA serological measurements are useful for diagnosing EBV-associated diseases,
moreover, they may be informative on the assessment of humoral responses and the
comprehension of the interplay between anti-viral and autoimmune mechanisms.
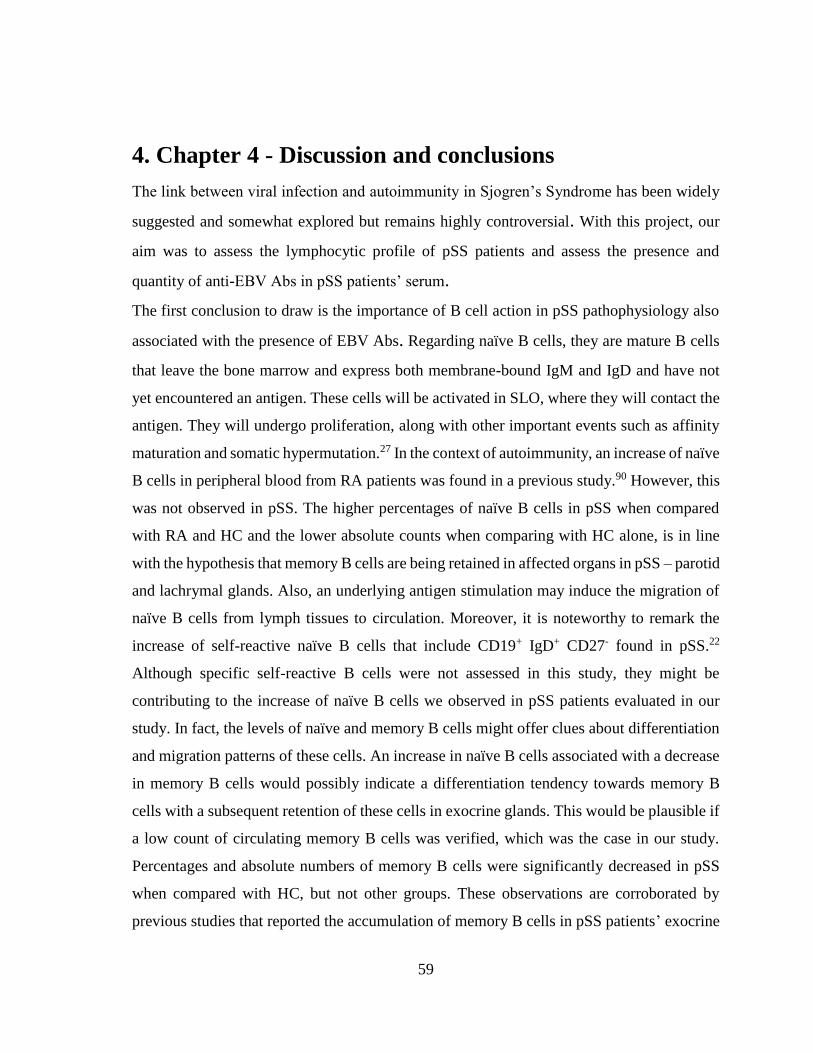
59
4. Chapter 4 - Discussion and conclusions
The link between viral infection and autoimmunity in Sjogren’s Syndrome has been widely
suggested and somewhat explored but remains highly controversial. With this project, our
aim was to assess the lymphocytic profile of pSS patients and assess the presence and
quantity of anti-EBV Abs in pSS patients’ serum.
The first conclusion to draw is the importance of B cell action in pSS pathophysiology also
associated with the presence of EBV Abs. Regarding naïve B cells, they are mature B cells
that leave the bone marrow and express both membrane-bound IgM and IgD and have not
yet encountered an antigen. These cells will be activated in SLO, where they will contact the
antigen. They will undergo proliferation, along with other important events such as affinity
maturation and somatic hypermutation.27 In the context of autoimmunity, an increase of naïve
B cells in peripheral blood from RA patients was found in a previous study.90 However, this
was not observed in pSS. The higher percentages of naïve B cells in pSS when compared
with RA and HC and the lower absolute counts when comparing with HC alone, is in line
with the hypothesis that memory B cells are being retained in affected organs in pSS – parotid
and lachrymal glands. Also, an underlying antigen stimulation may induce the migration of
naïve B cells from lymph tissues to circulation. Moreover, it is noteworthy to remark the
increase of self-reactive naïve B cells that include CD19+ IgD+ CD27- found in pSS.22
Although specific self-reactive B cells were not assessed in this study, they might be
contributing to the increase of naïve B cells we observed in pSS patients evaluated in our
study. In fact, the levels of naïve and memory B cells might offer clues about differentiation
and migration patterns of these cells. An increase in naïve B cells associated with a decrease
in memory B cells would possibly indicate a differentiation tendency towards memory B
cells with a subsequent retention of these cells in exocrine glands. This would be plausible if
a low count of circulating memory B cells was verified, which was the case in our study.
Percentages and absolute numbers of memory B cells were significantly decreased in pSS
when compared with HC, but not other groups. These observations are corroborated by
previous studies that reported the accumulation of memory B cells in pSS patients’ exocrine
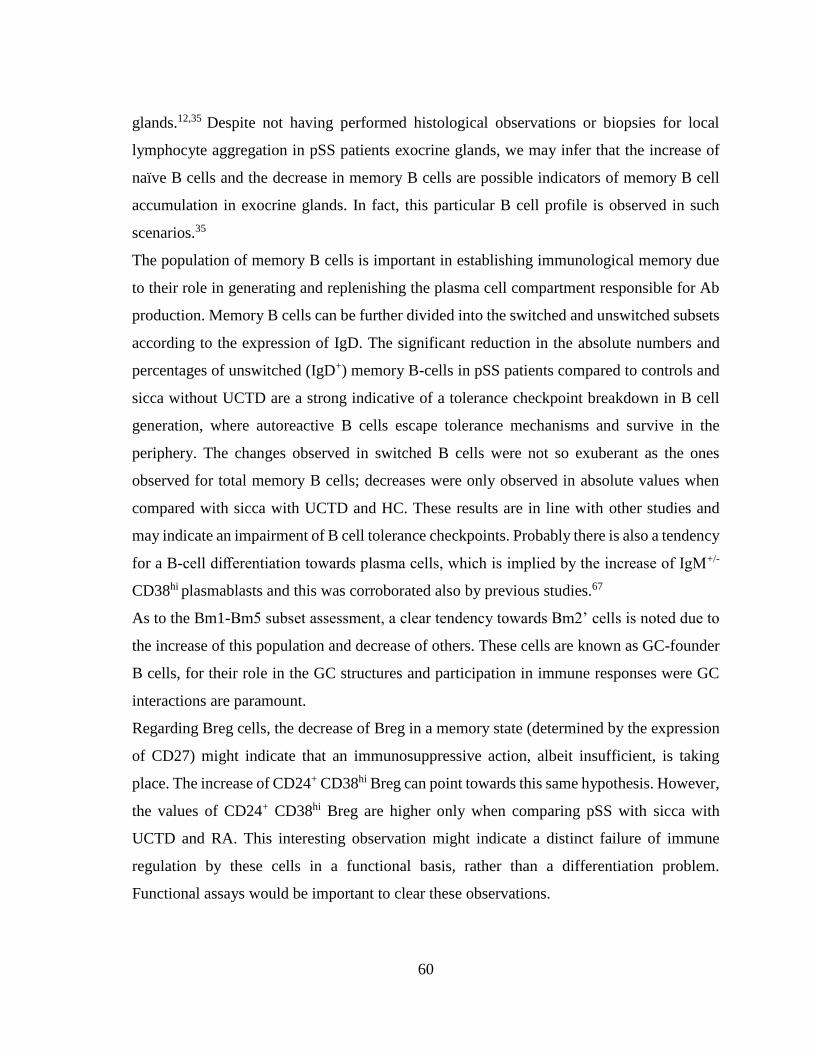
60
glands.12,35 Despite not having performed histological observations or biopsies for local
lymphocyte aggregation in pSS patients exocrine glands, we may infer that the increase of
naïve B cells and the decrease in memory B cells are possible indicators of memory B cell
accumulation in exocrine glands. In fact, this particular B cell profile is observed in such
scenarios.35
The population of memory B cells is important in establishing immunological memory due
to their role in generating and replenishing the plasma cell compartment responsible for Ab
production. Memory B cells can be further divided into the switched and unswitched subsets
according to the expression of IgD. The significant reduction in the absolute numbers and
percentages of unswitched (IgD+) memory B-cells in pSS patients compared to controls and
sicca without UCTD are a strong indicative of a tolerance checkpoint breakdown in B cell
generation, where autoreactive B cells escape tolerance mechanisms and survive in the
periphery. The changes observed in switched B cells were not so exuberant as the ones
observed for total memory B cells; decreases were only observed in absolute values when
compared with sicca with UCTD and HC. These results are in line with other studies and
may indicate an impairment of B cell tolerance checkpoints. Probably there is also a tendency
for a B-cell differentiation towards plasma cells, which is implied by the increase of IgM+/-
CD38hi plasmablasts and this was corroborated also by previous studies.67
As to the Bm1-Bm5 subset assessment, a clear tendency towards Bm2’ cells is noted due to
the increase of this population and decrease of others. These cells are known as GC-founder
B cells, for their role in the GC structures and participation in immune responses were GC
interactions are paramount.
Regarding Breg cells, the decrease of Breg in a memory state (determined by the expression
of CD27) might indicate that an immunosuppressive action, albeit insufficient, is taking
place. The increase of CD24+ CD38hi Breg can point towards this same hypothesis. However,
the values of CD24+ CD38hi Breg are higher only when comparing pSS with sicca with
UCTD and RA. This interesting observation might indicate a distinct failure of immune
regulation by these cells in a functional basis, rather than a differentiation problem.
Functional assays would be important to clear these observations.
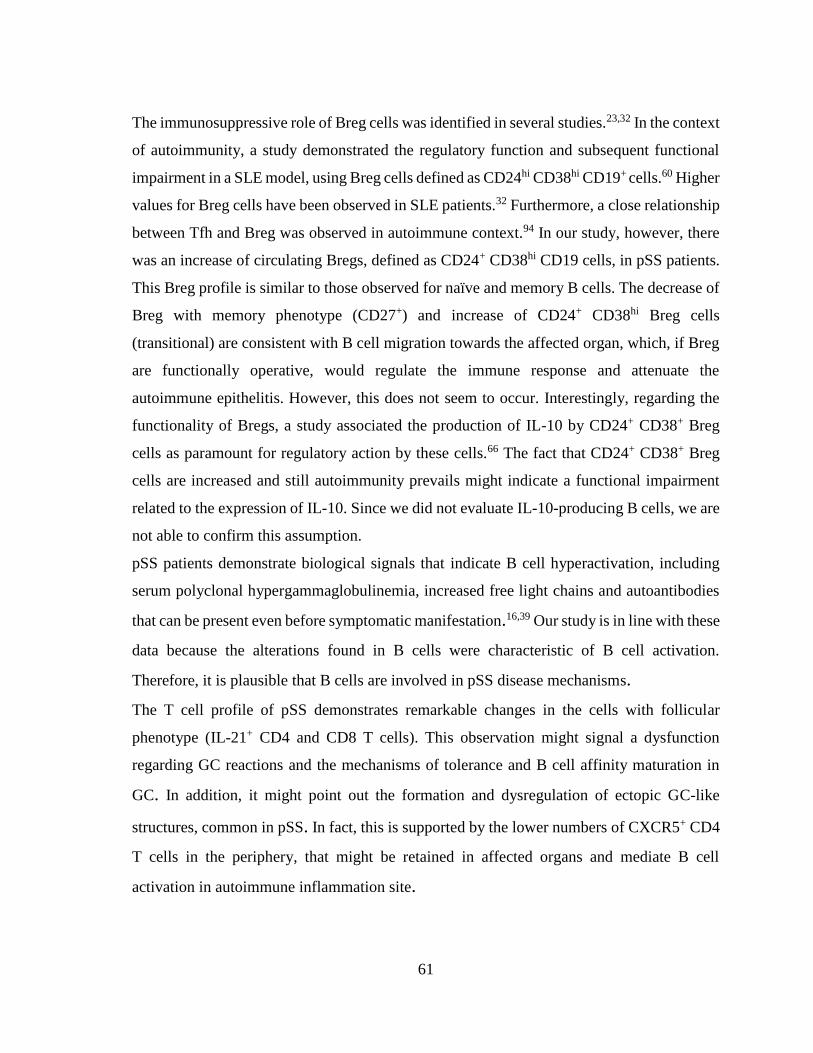
61
The immunosuppressive role of Breg cells was identified in several studies.23,32 In the context
of autoimmunity, a study demonstrated the regulatory function and subsequent functional
impairment in a SLE model, using Breg cells defined as CD24hi CD38hi CD19+ cells.60 Higher
values for Breg cells have been observed in SLE patients.32 Furthermore, a close relationship
between Tfh and Breg was observed in autoimmune context.94 In our study, however, there
was an increase of circulating Bregs, defined as CD24+ CD38hi CD19 cells, in pSS patients.
This Breg profile is similar to those observed for naïve and memory B cells. The decrease of
Breg with memory phenotype (CD27+) and increase of CD24+ CD38hi Breg cells
(transitional) are consistent with B cell migration towards the affected organ, which, if Breg
are functionally operative, would regulate the immune response and attenuate the
autoimmune epithelitis. However, this does not seem to occur. Interestingly, regarding the
functionality of Bregs, a study associated the production of IL-10 by CD24+ CD38+ Breg
cells as paramount for regulatory action by these cells.66 The fact that CD24+ CD38+ Breg
cells are increased and still autoimmunity prevails might indicate a functional impairment
related to the expression of IL-10. Since we did not evaluate IL-10-producing B cells, we are
not able to confirm this assumption.
pSS patients demonstrate biological signals that indicate B cell hyperactivation, including
serum polyclonal hypergammaglobulinemia, increased free light chains and autoantibodies
that can be present even before symptomatic manifestation.16,39 Our study is in line with these
data because the alterations found in B cells were characteristic of B cell activation.
Therefore, it is plausible that B cells are involved in pSS disease mechanisms.
The T cell profile of pSS demonstrates remarkable changes in the cells with follicular
phenotype (IL-21+ CD4 and CD8 T cells). This observation might signal a dysfunction
regarding GC reactions and the mechanisms of tolerance and B cell affinity maturation in
GC. In addition, it might point out the formation and dysregulation of ectopic GC-like
structures, common in pSS. In fact, this is supported by the lower numbers of CXCR5+ CD4
T cells in the periphery, that might be retained in affected organs and mediate B cell
activation in autoimmune inflammation site.
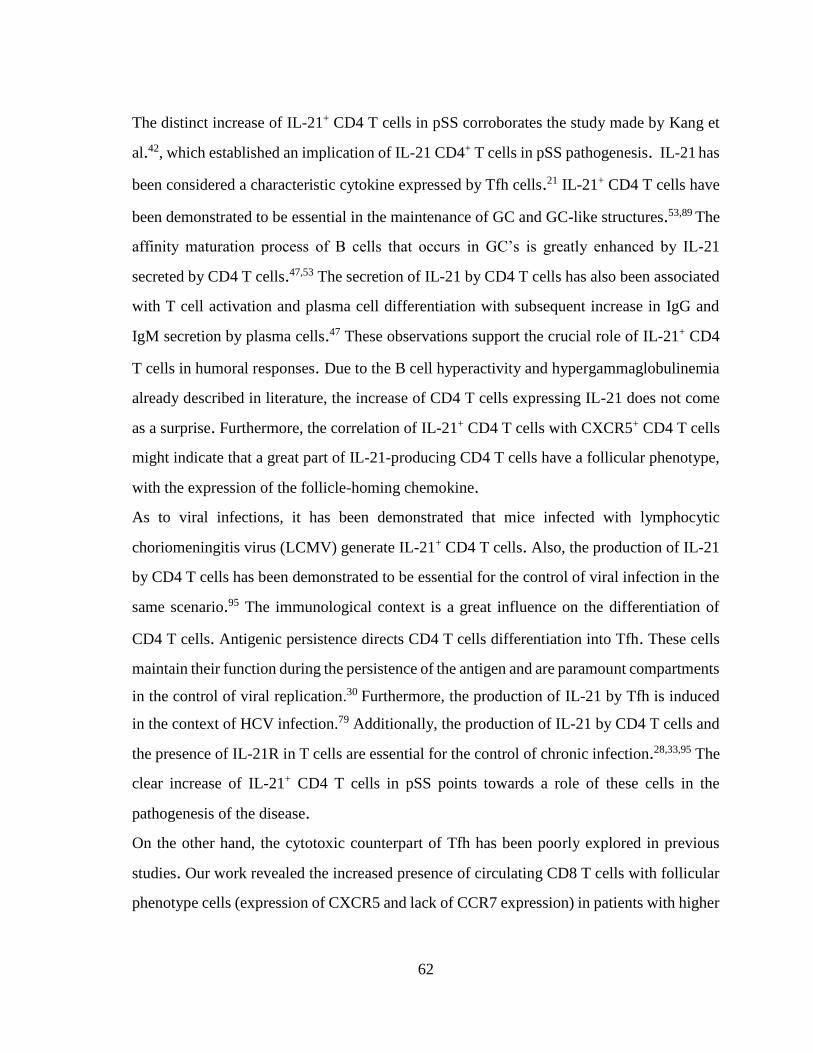
62
The distinct increase of IL-21+ CD4 T cells in pSS corroborates the study made by Kang et
al.42, which established an implication of IL-21 CD4+ T cells in pSS pathogenesis. IL-21 has
been considered a characteristic cytokine expressed by Tfh cells.21 IL-21+ CD4 T cells have
been demonstrated to be essential in the maintenance of GC and GC-like structures.53,89 The
affinity maturation process of B cells that occurs in GC’s is greatly enhanced by IL-21
secreted by CD4 T cells.47,53 The secretion of IL-21 by CD4 T cells has also been associated
with T cell activation and plasma cell differentiation with subsequent increase in IgG and
IgM secretion by plasma cells.47 These observations support the crucial role of IL-21+ CD4
T cells in humoral responses. Due to the B cell hyperactivity and hypergammaglobulinemia
already described in literature, the increase of CD4 T cells expressing IL-21 does not come
as a surprise. Furthermore, the correlation of IL-21+ CD4 T cells with CXCR5+ CD4 T cells
might indicate that a great part of IL-21-producing CD4 T cells have a follicular phenotype,
with the expression of the follicle-homing chemokine.
As to viral infections, it has been demonstrated that mice infected with lymphocytic
choriomeningitis virus (LCMV) generate IL-21+ CD4 T cells. Also, the production of IL-21
by CD4 T cells has been demonstrated to be essential for the control of viral infection in the
same scenario.95 The immunological context is a great influence on the differentiation of
CD4 T cells. Antigenic persistence directs CD4 T cells differentiation into Tfh. These cells
maintain their function during the persistence of the antigen and are paramount compartments
in the control of viral replication.30 Furthermore, the production of IL-21 by Tfh is induced
in the context of HCV infection.79 Additionally, the production of IL-21 by CD4 T cells and
the presence of IL-21R in T cells are essential for the control of chronic infection.28,33,95 The
clear increase of IL-21+ CD4 T cells in pSS points towards a role of these cells in the
pathogenesis of the disease.
On the other hand, the cytotoxic counterpart of Tfh has been poorly explored in previous
studies. Our work revealed the increased presence of circulating CD8 T cells with follicular
phenotype cells (expression of CXCR5 and lack of CCR7 expression) in patients with higher
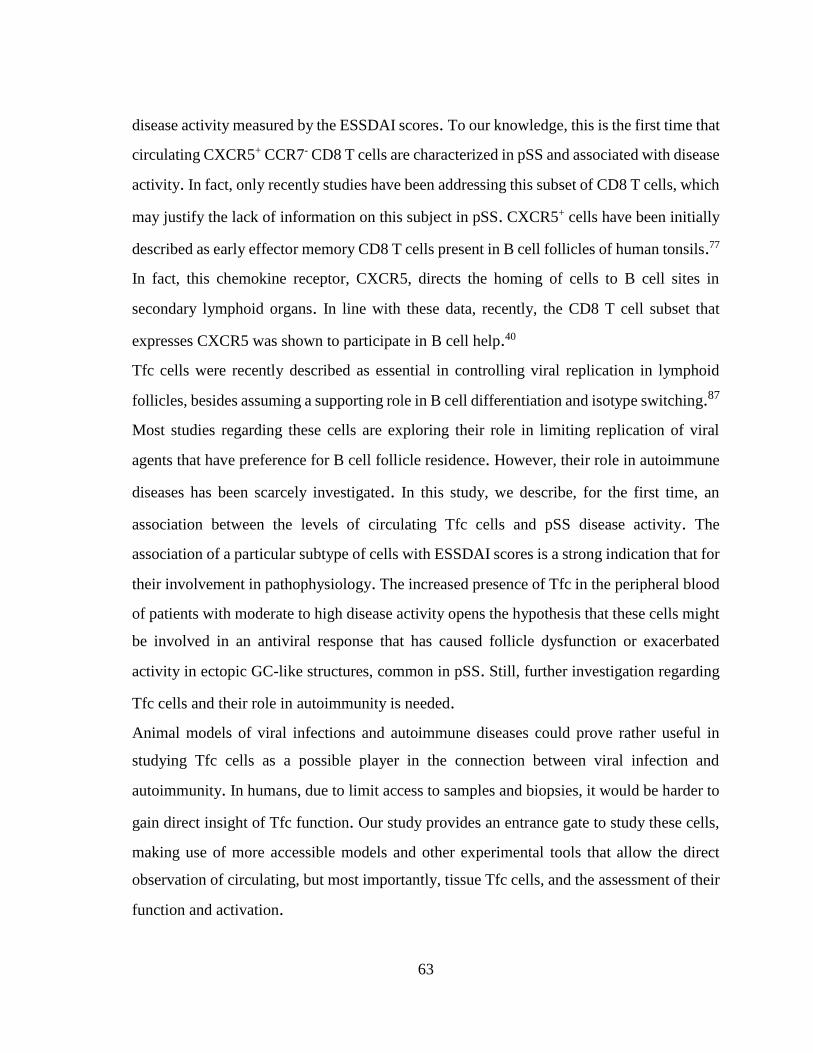
63
disease activity measured by the ESSDAI scores. To our knowledge, this is the first time that
circulating CXCR5+ CCR7- CD8 T cells are characterized in pSS and associated with disease
activity. In fact, only recently studies have been addressing this subset of CD8 T cells, which
may justify the lack of information on this subject in pSS. CXCR5+ cells have been initially
described as early effector memory CD8 T cells present in B cell follicles of human tonsils.77
In fact, this chemokine receptor, CXCR5, directs the homing of cells to B cell sites in
secondary lymphoid organs. In line with these data, recently, the CD8 T cell subset that
expresses CXCR5 was shown to participate in B cell help.40
Tfc cells were recently described as essential in controlling viral replication in lymphoid
follicles, besides assuming a supporting role in B cell differentiation and isotype switching.87
Most studies regarding these cells are exploring their role in limiting replication of viral
agents that have preference for B cell follicle residence. However, their role in autoimmune
diseases has been scarcely investigated. In this study, we describe, for the first time, an
association between the levels of circulating Tfc cells and pSS disease activity. The
association of a particular subtype of cells with ESSDAI scores is a strong indication that for
their involvement in pathophysiology. The increased presence of Tfc in the peripheral blood
of patients with moderate to high disease activity opens the hypothesis that these cells might
be involved in an antiviral response that has caused follicle dysfunction or exacerbated
activity in ectopic GC-like structures, common in pSS. Still, further investigation regarding
Tfc cells and their role in autoimmunity is needed.
Animal models of viral infections and autoimmune diseases could prove rather useful in
studying Tfc cells as a possible player in the connection between viral infection and
autoimmunity. In humans, due to limit access to samples and biopsies, it would be harder to
gain direct insight of Tfc function. Our study provides an entrance gate to study these cells,
making use of more accessible models and other experimental tools that allow the direct
observation of circulating, but most importantly, tissue Tfc cells, and the assessment of their
function and activation.
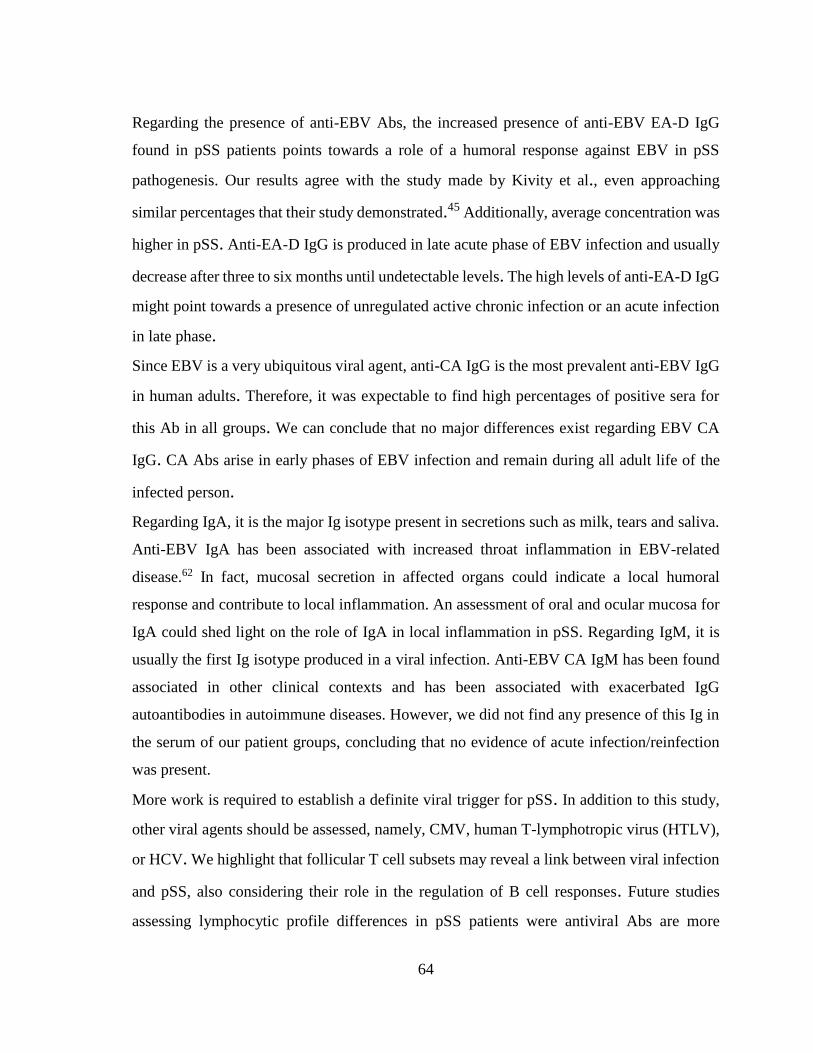
64
Regarding the presence of anti-EBV Abs, the increased presence of anti-EBV EA-D IgG
found in pSS patients points towards a role of a humoral response against EBV in pSS
pathogenesis. Our results agree with the study made by Kivity et al., even approaching
similar percentages that their study demonstrated.45 Additionally, average concentration was
higher in pSS. Anti-EA-D IgG is produced in late acute phase of EBV infection and usually
decrease after three to six months until undetectable levels. The high levels of anti-EA-D IgG
might point towards a presence of unregulated active chronic infection or an acute infection
in late phase.
Since EBV is a very ubiquitous viral agent, anti-CA IgG is the most prevalent anti-EBV IgG
in human adults. Therefore, it was expectable to find high percentages of positive sera for
this Ab in all groups. We can conclude that no major differences exist regarding EBV CA
IgG. CA Abs arise in early phases of EBV infection and remain during all adult life of the
infected person.
Regarding IgA, it is the major Ig isotype present in secretions such as milk, tears and saliva.
Anti-EBV IgA has been associated with increased throat inflammation in EBV-related
disease.62 In fact, mucosal secretion in affected organs could indicate a local humoral
response and contribute to local inflammation. An assessment of oral and ocular mucosa for
IgA could shed light on the role of IgA in local inflammation in pSS. Regarding IgM, it is
usually the first Ig isotype produced in a viral infection. Anti-EBV CA IgM has been found
associated in other clinical contexts and has been associated with exacerbated IgG
autoantibodies in autoimmune diseases. However, we did not find any presence of this Ig in
the serum of our patient groups, concluding that no evidence of acute infection/reinfection
was present.
More work is required to establish a definite viral trigger for pSS. In addition to this study,
other viral agents should be assessed, namely, CMV, human T-lymphotropic virus (HTLV),
or HCV. We highlight that follicular T cell subsets may reveal a link between viral infection
and pSS, also considering their role in the regulation of B cell responses. Future studies
assessing lymphocytic profile differences in pSS patients were antiviral Abs are more
65
prevalent could offer insight into the lymphocytic subsets participating in immune
pathogenesis. Additionally, the development of animal models can be paramount in the
understanding of follicular T cells roles in both antiviral and autoimmune contexts, allowing
the identification of similar mechanisms and differentiation patterns and elucidating the
breakdown of tolerance mechanisms in GC and GC-like structures.
66
5. Bibliographic references
1. ACTOR, Jeffrey K. - Cancer Immunology. Introductory Immunology. . ISSN 1533-
4406. 2014) 116–124. doi: 10.1016/B978-0-12-420030-2.00010-X.
2. AKIRA, Shizuo; HEMMI, Hiroaki - Recognition of pathogen-associated molecular
patterns by TLR family. Immunology Letters. . ISSN 01652478. 85:2 (2003) 85–95.
doi: 10.1016/S0165-2478(02)00228-6.
3. AKIRA, Shizuo; UEMATSU, Satoshi; TAKEUCHI, Osamu - Pathogen recognition and
innate immunity. Cell. . ISSN 00928674. 124:4 (2006) 783–801. doi:
10.1016/j.cell.2006.02.015.
4. ALAMANOS, Y. et al. - Epidemiology of primary Sjögren’s syndrome in north-west
Greece, 1982-2003. Rheumatology. . ISSN 14620324. 45:2 (2006) 187–191. doi:
10.1093/rheumatology/kei107.
5. ALETAHA, Daniel et al. - 2010 Rheumatoid Arthritis Classification Criteria. 62:9 (2010)
2569–2581. doi: 10.1002/art.27584.
6. ALUNNO, Alessia et al. - IL-17-producing CD4-CD8- T cells are expanded in the
peripheral blood, infiltrate salivary glands and are resistant to corticosteroids in patients
with primary Sj??gren’s syndrome. Annals of the Rheumatic Diseases. . ISSN
00034967. 72:2 (2013) 286–292. doi: 10.1136/annrheumdis-2012-201511.
7. BAKHSHI, A. et al. - Lymphocyte subsets in Sjogren’s syndrome: a quantitative analysis
using monoclonal antibodies and the fluorescence-activated cell sorter.
J.Clin.Lab.Immunol. 10:2 (1983) 63–69.
8. BARANOVSKI, Boris M. et al. - T Helper Subsets, Peripheral Plasticity, and the Acute
Phase Protein, α 1-Antitrypsin. BioMed Research International. . ISSN 23146141.
2015:2015). doi: 10.1155/2015/184574.
9. BAYETTO, K.; LOGAN, RM - Sjögren’s syndrome: a review of aetiology, pathogenesis,
diagnosis and management. Australian Dental Journal. . ISSN 00450421. 55:2010) 39–
47. doi: 10.1111/j.1834-7819.2010.01197.x.
10. BERKOWITZ, Aaron L.; SAMUELS, Martin A. - The neurology of Sjögren’s syndrome
67
and the rheumatology of peripheral neuropathy and myelitis. Practical Neurology. .
ISSN 14747758. 14:1 (2014) 14–22. doi: 10.1136/practneurol-2013-000651.
11. BLOCK, J. A; SEQUEIRA, W. - Raynaud’s phenomenon. Lancet. . ISSN 0140-6736.
357:9273 (2001) 2042–2048. doi: 10.1016/S0140-6736(00)05118-7.
12. BOHNHORST, J. Ø. et al. - Significantly depressed percentage of CD27+ (memory) B
cells among peripheral blood B cells in patients with primary Sjogren’s syndrome.
Scandinavian Journal of Immunology. . ISSN 0300-9475 (Print). 54:4 (2001) 421–
427. doi: 10.1046/j.1365-3083.2001.00989.x.
13. BOISE, Lawrence H. et al. - CD28 costimulation can promote T cell survival by
enhancing the expression of Bcl-xL. Immunity. . ISSN 10747613. 3:1 (1995) 87–98.
doi: 10.1016/1074-7613(95)90161-2.
14. BONILLA, Francisco A.; OETTGEN, Hans C. - Adaptive immunity. Journal of Allergy
and Clinical Immunology. . ISSN 00916749. 125:2 SUPPL. 2 (2010) S33–S40. doi:
10.1016/j.jaci.2009.09.017.
15. BRITO-ZERÓN, Pilar et al. - Sjögren syndrome. Nature Reviews Disease Primers. .
ISSN 2056676X. 2:July (2016) 1–20. doi: 10.1038/nrdp.2016.47.
16. BROKSTAD, Karl et al. - Prediction of Sjögren’s Syndrome Years Before Diagnosis and
Identification of Patients With Early Onset and Severe Disease Course by Autoantibody
Profiling. 67:9 (2015) 2427–2436. doi: 10.1002/art.39214.
17. CARVAJAL ALEGRIA, Guillermo et al. - Could Lymphocyte Profiling be Useful to
Diagnose Systemic Autoimmune Diseases? Clinical Reviews in Allergy and
Immunology. . ISSN 15590267. 53:2 (2017) 219–236. doi: 10.1007/s12016-017-8608-
5.
18. CHAUDHRY, Ashutosh et al. - Interleukin-10 signaling in regulatory T cells is required
for suppression of Th17 cell-mediated inflammation. Immunity. 34:4 (2011) 566–578.
doi: 10.1016/j.immuni.2011.03.018.Interleukin-10.
19. CHEN, Weiqian et al. - Biomarkers for Primary Sjögren’s Syndrome. Genomics,
Proteomics and Bioinformatics. . ISSN 22103244. 13:4 (2015) 219–223. doi:
10.1016/j.gpb.2015.06.002.
20. CHRISTODOULOU, Maria I. et al. - Foxp3+T-regulatory cells in Sjögren’s syndrome:
68
Correlation with the grade of the autoimmune lesion and certain adverse prognostic
factors. American Journal of Pathology. . ISSN 15252191. 173:5 (2008) 1389–1396.
doi: 10.2353/ajpath.2008.080246.
21. CHTANOVA, T. et al. - T Follicular Helper Cells Express a Distinctive Transcriptional
Profile, Reflecting Their Role as Non-Th1/Th2 Effector Cells That Provide Help for B
Cells. The Journal of Immunology. . ISSN 0022-1767. 173:1 (2004) 68–78. doi:
10.4049/jimmunol.173.1.68.
22. CORSIERO, Elisa et al. - Accumulation of self-reactive naïve and memory B cell reveals
sequential defects in B cell tolerance checkpoints in Sjögren’s Syndrome. PLoS ONE. .
ISSN 19326203. 9:12 (2014) 1–20. doi: 10.1371/journal.pone.0114575.
23. DAS, Abhishek et al. - IL-10 − Producing Regulatory B Cells in the Pathogenesis of
Chronic Hepatitis B Virus Infection. 2013). doi: 10.4049/jimmunol.1103139.
24. DOUGLAS, Linda - CPD : Facilitating timely diagnosis of Sjögren ’ s syndrome. Nature
Publishing Group. 2:1 (2018) 1–4. doi: 10.1038/bdjteam.2018.26.
25. EDWARDS, Jonathan C. W.; CAMBRIDGE, Geraldine - B-cell targeting in rheumatoid
arthritis and other autoimmune diseases. Nature Reviews Immunology. . ISSN
14741733. 6:5 (2006) 394–403. doi: 10.1038/nri1838.
26. EGERTON, Mark; SCOLLAY, Roland; SHORTMAN, Ken - Kinetics of mature T-cell
development in the thymus. Immunology. . ISSN 0027-8424. 87:April (1990) 2579–
2582. doi: 10.1073/pnas.87.7.2579.
27. EIBEL, Hermann et al. - B cell Biology: An Overview. Current Allergy and Asthma
Reports. . ISSN 1529-7322. 14:5 (2014) 434. doi: 10.1007/s11882-014-0434-8.
28. ELSAESSER, Heidi; SAUER, Karsten; BROOKS, David G. - IL-21 is required to
control chronic viral infection. Science. . ISSN 00368075. 324:5934 (2009) 1569–1572.
doi: 10.1126/science.1174182.
29. ERCOLINI, A. M.; MILLER, S. D. - The role of infections in autoimmune disease.
Clinical and Experimental Immunology. . ISSN 00099104. 155:1 (2009) 1–15. doi:
10.1111/j.1365-2249.2008.03834.x.
30. FAHEY, Laura M. et al. - Viral persistence redirects CD4 T cell differentiation toward
T follicular helper cells. The Journal of Experimental Medicine. . ISSN 0022-1007.
69
208:5 (2011) 987–999. doi: 10.1084/jem.20101773.
31. FAULKNER, Glenda C.; KRAJEWSKI, Andrew S.; CRAWFORD, Dorothy H. - The
ins and outs of EBV infection. Trends in Microbiology. . ISSN 0966842X. 8:4 (2000)
185–189. doi: 10.1016/S0966-842X(00)01742-X.
32. FLORES-BORJA, Fabian et al. - CD19+CD24hiCD38hi B Cells Exhibit Regulatory
Capacity in Healthy Individuals but Are Functionally Impaired in Systemic Lupus
Erythematosus Patients. Cell. 32 (2010) 129–140. doi: 10.1016/j.immuni.2009.11.009.
33. FRÖHLICH, Anja et al. - IL-21R on T cells is critical for sustained functionality and
control of chronic viral infection. Science. . ISSN 00368075. 324:5934 (2009) 1576–
1580. doi: 10.1126/science.1172815.
34. GOTTENBERG, Jacques Eric et al. - CD4 CD25highregulatory T cells are not impaired
in patients with primary Sjögren’s syndrome. Journal of Autoimmunity. . ISSN
08968411. 24:3 (2005) 235–242. doi: 10.1016/j.jaut.2005.01.015.
35. HANSEN, Arne et al. - Diminished peripheral blood memory B cells and accumulation
of memory B cells in the salivary glands of patients with Sjögren’s syndrome. Arthritis
and Rheumatism. . ISSN 00043591. 46:8 (2002) 2160–2171. doi: 10.1002/art.10445.
36. HOEBE, K.; JANSSEN, E.; BEUTLER, B. - The interface between innate and adaptive
immunity. Nat Immunol. . ISSN 1529-2908. 5:10 (2004) 971–974. doi: 10.1038/ni1004-
971.
37. IGOE, Ann; SCOFIELD, R. Hal - Autoimmunity and infection in Sjögren’s syndrome.
Current Opinion in Rheumatology. . ISSN 10408711. 25:4 (2013) 480–487. doi:
10.1097/BOR.0b013e32836200d2.
38. JANNIE BORST, Heinz Jacobst And Gaby Brouns - Composition and function of T-cell
receptor and B-cell receptor complexes on precursor lymphocytes. Current Opinion in
Immunology. [s.d.]).
39. JONSSON, R. - Autoantibodies Present Before Symptom Onset in Primary Sjögren
Syndrome. JAMA. 310:17 (2013) 1854–1855.
40. JUAN SHEN, XI LUO, QIONGLI WU, JUN HUANG, GUANYING XIAO,
LIANTANG WANG, BINYAN YANG, Li Huabin And Chang You Wu - A subset of
CXCR5+CD8+ T cells in the germinal centers from human tonsils and lymph nodes help
70
B cells produce immunoglobulins. Frontiers in Immunology. 9:2018) 2287.
41. JUNE, Carl H. et al. - The B7 and CD28 receptor families. Immunology Today. . ISSN
01675699. 15:7 (1994) 321–331. doi: 10.1016/0167-5699(94)90080-9.
42. KANG, Kwi et al. - Impact of interleukin-21 in the pathogenesis of primary Sjogren’s
syndrome: increased serum levels of interleukin-21 and its expression in the labial
salivary glands. Arthritis Research & Therapy. . ISSN 1478-6354. 13:5 (2011) R179.
doi: 10.1186/ar3504.
43. KIMURA, Hiroshi et al. - Quantitative Analysis of Epstein-Barr Virus Load by Using a
Real-Time PCR Assay. 37:1 (1999) 132–136.
44. KINDT, T. J., GOLDSBY, R. A., OSBORNE, B. A., & KUBY, J. - Kuby immunology.
7th. ed. [S.l.] : Macmillan Publishers Limited, 2007
45. KIVITY, Shaye et al. - Infection and autoimmunity in Sjogren’s syndrome: A clinical
study and comprehensive review. Journal of Autoimmunity. . ISSN 10959157.
51:2014) 17–22. doi: 10.1016/j.jaut.2014.02.008.
46. KOULOVA, Lydia et al. - The CD28 ligand B7/BB1 provides costimulatory signal for
alloactivation of CD4+ T cells. J Exp Med. . ISSN 00221007. 173:3 (1991) 759–762.
doi: 10.1084/jem.173.3.759.
47. KUCHEN, S. et al. - Essential Role of IL-21 in B Cell Activation, Expansion, and Plasma
Cell Generation during CD4+ T Cell-B Cell Collaboration. The Journal of
Immunology. . ISSN 0022-1767. 179:9 (2007) 5886–5896. doi:
10.4049/jimmunol.179.9.5886.
48. L. SKARE, Thelma; LIMA GODOI, Andressa De; O. FERREIRA, Valéria - Jaccoud
arthropathy in systemic lupus erythematosus: clinical and serological findings. Revista
da Associação Médica Brasileira. . ISSN 01044230. 58:4 (2012) 489–492. doi:
10.1590/S0104-42302012000400022.
49. LEMOINE, Sébastien et al. - Regulatory B cells in autoimmune diseases: How do they
work. Annals of the New York Academy of Sciences. . ISSN 17496632. 1173:33 (2009)
260–267. doi: 10.1111/j.1749-6632.2009.04651.x.
50. LERNER, M. R. et al. - Two small RNAs encoded by Epstein-Barr virus and complexed
with protein are precipitated by antibodies from patients with systemic lupus
71
erythematosus. Proceedings of the National Academy of Sciences. . ISSN 0027-8424.
78:2 (1981) 805–809. doi: 10.1073/pnas.78.2.805.
51. LI X, QIAN L, WANG G, ZHANG H, WANG X, CHEN K, ZHAI Z, LI Q, WANG Y,
Harris DC. - T regulatory cells are markedly diminished in diseased salivary glands of
patients with primary Sjögren’s syndrome. The Journal of rheumatology. 34:12 (2007)
2438–45.
52. LI, Xue Yi et al. - Role of the frequency of blood CD4 + CXCR5 + CCR6 + T cells in
autoimmunity in patients with Sj??gren’s syndrome. Biochemical and Biophysical
Research Communications. . ISSN 0006291X. 422:2 (2012) 238–244. doi:
10.1016/j.bbrc.2012.04.133.
53. LINTERMAN, Michelle A. et al. - IL-21 acts directly on B cells to regulate Bcl-6
expression and germinal center responses. The Journal of Experimental Medicine. .
ISSN 0022-1007. 207:2 (2010) 353–363. doi: 10.1084/jem.20091738.
54. LUSTGARTEN, Joseph; WAKS, Tova; ESHHAR, Zelig - CD4 and CD8 accessory
molecules function through interactions with major histocompatibility complex
molecules which are not directly associated with the T cell receptor‐antigen complex.
European Journal of Immunology. . ISSN 15214141. 21:10 (1991) 2507–2515. doi:
10.1002/eji.1830211030.
55. MACKAY, Fabienne; BROWNING, Jeffrey L. - BAFF: A fundamental survival factor
for B cells. Nature Reviews Immunology. . ISSN 14741741. 2:7 (2002) 465–475. doi:
10.1038/nri844.
56. MAITLAND, Norman et al. - Detection of cytomegalovirus and Epstein‐Barr virus in
labial salivary glands in Sjogren’s syndrome and non‐specific sialadenitis. Journal of
Oral Pathology & Medicine. . ISSN 16000714. 24:7 (1995) 293–298. doi:
10.1111/j.1600-0714.1995.tb01187.x.
57. MANDL T , BREDBERG A , JACOBSSON LT , MANTHORPE R, Henriksson G. -
CD4+ T-lymphocytopenia--a frequent finding in anti-SSA antibody seropositive patients
with primary Sjögren’s syndrome. The Journal of Rheumatology. 31:4 (2004) 726–
728.
58. MANOUSSAKIS, M. N. et al. - Rates of infiltration by macrophages and dendritic cells
72
and expression of interleukin-18 and interleukin-12 in the chronic inflammatory lesions
of Sjögren’s syndrome: Correlation with certain features of immune hyperactivity and
factors associated with h. Arthritis and Rheumatism. . ISSN 00043591. 56:12 (2007)
3977–3988. doi: 10.1002/art.23073.
59. MANOUSSAKIS, Menelaos N.; KAPSOGEORGOU, Efstathia K. - The role of intrinsic
epithelial activation in the pathogenesis of Sjögren’s syndrome. Journal of
Autoimmunity. . ISSN 08968411. 35:3 (2010) 219–224. doi:
10.1016/j.jaut.2010.06.011.
60. MANUSCRIPT, Author; NANOBIOMATERIALS, Biodegradable - NIH Public Access.
. ISSN 1053-8119. 6:8 (2013) 1111–1119. doi: 10.1021/nn300902w.Release.
61. MARIETTE, Xavier et al. - Detection of Epstein-Barr virus DNA by in Situ hybridization
and polymerase chain reaction in salivary gland biopsy specimens from patients with
Sjögren’s syndrome. The American Journal of Medicine. . ISSN 00029343. 90:3
(1991) 286–294. doi: 10.1016/0002-9343(91)80007-9.
62. MARKLUND, Gunnar et al. - IgA antibodies to Epstein-Barr virus in infectious
mononucleosis. Scandinavian Journal of Infectious Diseases. . ISSN 00365548. 18:2
(1986) 111–119. doi: 10.3109/00365548609032316.
63. MARRACK, Philippa et al. - The effect of thymus environment on T cell development
and tolerance. Cell. . ISSN 00928674. 53:4 (1988) 627–634. doi: 10.1016/0092-
8674(88)90578-8.
64. MAURI, Claudia et al. - Human regulatory B cells in health and disease : therapeutic
potential Find the latest version : Human regulatory B cells in health and disease :
therapeutic potential. 127:3 (2017) 772–779.
65. MAVRAGANI, Clio P.; MOUTSOPOULOS, Haralampos M. - Sjögren syndrome
Review. . ISSN 0820-3946. 186:15 (2014) 579–586. doi: 10.1503/cmaj.122037.
66. MICHEL, Laure et al. - Loss of IL-10 secretion by regulatory B lymphocytes in multiple
sclerosis patients. Journal of Translational Medicine. . ISSN 1479-5876. 9:Suppl 2
(2011) P25. doi: 10.1186/1479-5876-9-S2-P25.
67. MINGUENEAU, Michael et al. - Cytometry by time-of-flight immunophenotyping
identifies a blood Sjögren’s signature correlating with disease activity and glandular
73
inflammation. Journal of Allergy and Clinical Immunology. . ISSN 10976825. 137:6
(2016) 1809–1821e12. doi: 10.1016/j.jaci.2016.01.024.
68. MITSIAS, D. I. et al. - The Th1/Th2 cytokine balance changes with the progress of the
immunopathological lesion of Sjogren’s syndrome. Clinical and Experimental
Immunology. . ISSN 00099104. 128:3 (2002) 562–568. doi: 10.1046/j.1365-
2249.2002.01869.x.
69. MIYASAKA, Nobuyuki; YAMAOKA, Kunio; TATEISHI, Mutsuto - Possible
Involvement of Epstein-Barr Virus ( EBV ) in Polyclonal B-cell Activation in S jagren ’
s Syndrome. 1989) 427–432.
70. MOUTSOPOULUS, H. M. - Autoimmune epithelitis. Clinical Immunology &
Immunopathology. 72:2 (1994) 132–165.
71. NAVARRO, M. et al. - Intravenous Immune Globulin: Clinical Applications in the
Newborn. NeoReviews. . ISSN 1526-9906. 11:7 (2010) e370–e378. doi: 10.1542/neo.11-
7-e370.
72. PARNES, JR - Molecular-Biology and Function of Cd4 and Cd8. Advances in
Immunology. . ISSN 0065-2776. 44:1989) 265–311.
73. PASCHALE, Massimo DE - Serological diagnosis of Epstein-Barr virus infection:
Problems and solutions. World Journal of Virology. . ISSN 2220-3249. 1:1 (2012) 31.
doi: 10.5501/wjv.v1.i1.31.
74. PLEŠIVČNIK NOVLJAN, M. et al. - Incidence of primary Sjögren’s syndrome in
Slovenia. Annals of the Rheumatic Diseases. . ISSN 00034967. 63:7 (2004) 874–876.
doi: 10.1136/ard.2003.014027.
75. POOLE, Brian D. et al. - Epstein-Barr virus and molecular mimicry in systemic lupus
erythematosus. Autoimmunity. . ISSN 08916934. 39:1 (2006) 63–70. doi:
10.1080/08916930500484849.
76. QIN, Baodong et al. - Epidemiology of primary Sjögren’s syndrome: A systematic
review and meta-analysis. Annals of the Rheumatic Diseases. . ISSN 14682060. 74:11
(2015) 1983–1989. doi: 10.1136/annrheumdis-2014-205375.
77. QUIGLEY, Máire F. et al. - CXCR5+ CCR7- CD8 T cells are early effector memory
cells that infiltrate tonsil B cell follicles. European Journal of Immunology. . ISSN
74
00142980. 37:12 (2007) 3352–3362. doi: 10.1002/eji.200636746.
78. RAMOS-CASALS, Manuel et al. - Primary Sjögren syndrome in Spain: Clinical and
immunologic expression in 1010 patients. Medicine. . ISSN 00257974. 87:4 (2008) 210–
219. doi: 10.1097/MD.0b013e318181e6af.
79. RAZIORROUH, Bijan et al. - Virus-Specific CD4+ T Cells Have Functional and
Phenotypic Characteristics of Follicular T-Helper Cells in Patients with Acute and
Chronic HCV Infections. Gastroenterology. . ISSN 15280012. 150:3 (2016) 696–706e3.
doi: 10.1053/j.gastro.2015.11.005.
80. SAITO, I. et al. - Detection of Epstein-Barr virus DNA by polymerase chain reaction in
blood and tissue biopsies from patients with Sjogren’s syndrome. The Journal of
experimental medicine. . ISSN 0022-1007. 169:6 (1989) 2191–2198.
81. SEROR, Raphaèle et al. - EULAR Sjögren’s syndrome disease activity index (ESSDAI):
A user guide. RMD Open. . ISSN 20565933. 1:1 (2015) 1–9. doi: 10.1136/rmdopen-
2014-000022.
82. SHEARER, W. T. et al. - Lymphocyte subsets in healthy children from birth through 18
years of age: The pediatric AIDS clinical trials group P1009 study. Journal Of Allergy
And Clinical Immunology. . ISSN 0091-6749. 112:5 (2003) 973–980. doi:
10.1067/mai.2003.1778.
83. SMEDBY, Karin Ekström et al. - Autoimmune disorders and risk of non-Hodgkin
lymphoma subtypes: A pooled analysis within the InterLymph Consortium. Blood. .
ISSN 00064971. 111:8 (2008) 4029–4038. doi: 10.1182/blood-2007-10-119974.
84. STRAUS, Moderator Stephen E.; COHEN, Discussants Jeffrey I. - Epstein-Barr Virus
Infections : Biology , Pathogenesis , and Management. Annals of Internal Medicine.
118:1 (1993) 45–58.
85. SUDZIUS, Gintaras et al. - Activity of T-Helper Cells in Patients with Primary Sjögren’s
Syndrome. in Vivo. . ISSN 1791-7549. 27:2013) 263–268.
86. TATEISHI, M. et al. - Spontaneous production of Epstein-Barr virus by B
lymphoblastoid cell lines obtained from patients with Sjogren’s syndrome. Possible
involvement of a novel strain of Epstein-Barr virus in disease pathogenesis. Arthritis
Rheum. . ISSN 00043591. 36:6 (1993) 827–835.
75
87. VALENTINE, Kristen M. et al. - CD8 Follicular T Cells Promote B Cell Antibody Class
Switch in Autoimmune Disease. The Journal of Immunology. . ISSN 0022-1767. 201:1
(2018) 31–40. doi: 10.4049/jimmunol.1701079.
88. VITALI C, BOMBARDIERI S, JONSSON R, MOUTSOPOULOS HM, Alexander; AL.,
EL Et - Classification criteria for Sjögren’s syndrome: a revised version of the Erupean
criteria proposed by the American- European Consensus Group. Ann Rheum Dis.
61:2002) 554–8.
89. VOGELZANG, Alexis et al. - A Fundamental Role for Interleukin-21 in the Generation
of T Follicular Helper Cells. Immunity. . ISSN 10747613. 29:1 (2008) 127–137. doi:
10.1016/j.immuni.2008.06.001.
90. WANG, J. et al. - High frequencies of activated B cells and T follicular helper cells are
correlated with disease activity in patients with new-onset rheumatoid arthritis. Clinical
and Experimental Immunology. . ISSN 00099104. 174:2 (2013) 212–220. doi:
10.1111/cei.12162.
91. WATTS, T. H. - Staying Alive: T Cell Costimulation, CD28, and Bcl-xL. The Journal
of Immunology. . ISSN 0022-1767. 185:7 (2010) 3785–3787. doi:
10.4049/jimmunol.1090085.
92. WEN, Shumin; SHIMIZU, Norio - Association of Epstein-Barr Virus ( EBV ) with
Sjogren ’ s Syndrome Differential EBV Expression between Epithelial Cells and
Lymphocytes in Salivary Glands. American Journal of Pathology. 149:5 (1996) 1511–
1517.
93. WORLD MEDICAL ASSOCIATION - World Medical Association Declaration of
Helsinki. Bulletin of the world health organization. . ISSN 0042-9686. 79:4 (2001)
373–374. doi: S0042-96862001000400016 [pii].
94. YANG, Xue et al. - T follicular helper cells and regulatory B cells dynamics in systemic
lupus erythematosus. PLoS ONE. . ISSN 19326203. 9:2 (2014) 1–9. doi:
10.1371/journal.pone.0088441.
95. YI, John S.; DU, Ming; ZAJAC, Allan J. - A vital role for Interleukin-21 in the control
of a chronic viral infection. Science. . ISSN 00368075. 324:5934 (2009) 1572–1576. doi:
10.1126/science.1175194.

76
96. ZHANG, Sheng; ZHANG, Hongjun; ZHAO, Jiandong - The role of CD4 T cell help for
CD8 CTL activation. Biochemical and Biophysical Research Communications. .
ISSN 0006291X. 384:4 (2009) 405–408. doi: 10.1016/j.bbrc.2009.04.134.