Embed Size (px)
Citation preview

*[email protected]; phone 1-734-615-5290; fax 1-734-764-4292; http://www-personal.engin.umich.edu/~jerlynch/
Linear Classification of System Poles for Structural Damage Detection using Piezoelectric Active Sensors
Jerome P. Lynch*
Dept. of Civil and Environmental Engineering, University of Michigan, Ann Arbor, MI 48109-2125
ABSTRACT The identification of damage in structural systems, including characterization of damage location and severity, is of extreme interest to the structural engineering profession. To date, many damage detection methods have been proposed that utilize global structural response measurements in the time and frequency domains to hypothesize the existence of structural damage. The accuracy and robustness of current damage detection methodologies could be improved through the use of active sensors. Active sensors, such as piezoelectric pads, impart low-energy acoustic excitations into structural elements and can record the corresponding system behavior. In this study, a novel methodology utilizing the input-output behavior of actively sensed structural elements is proposed. The poles of ARX time-series models describing modal frequencies and damping ratios are plotted upon the discrete-time complex plane and Perceptron linear classifiers employed to determine if poles of the structural element in an unknown state (damaged or undamaged) can be separated with those of the undamaged structure. If poles of the unknown state are separable from those of the undamaged state, the system is diagnosed as damaged. A simple cantilevered aluminum plate damaged by hack saw cuts is actively sensed by piezoelectric pads to show the efficacy of the proposed damage detection methodology. Furthermore, the number of misclassified poles and the final value of the Perceptron criterion function can be shown to be correlated to the severity of the damage. Keywords: Wireless structural monitoring, active sensors, damage detection, pattern classification, Perceptron
1. INTRODUCTION Owners of civil structures are becoming increasingly aware of the benefits derived from routinely monitoring and maintaining their investments. For example, the Federal Highway Administration (FHWA) recognized in the early 1980’s that there was an alarming growth of aging bridges being rated as structurally deficient; by 1982, that category had grown to include more than 250,000 bridges1. Even though the FHWA has been able to reduce this number to 160,000 bridges today, wear and tear deterioration of bridges still remains a serious concern. Natural and man-made catastrophes serve as additional risks imposed on many civil structures. In 1994, the Northridge Earthquake caused over $20 billion of structural damage to the Los Angeles metropolitan area’s structural inventory2. Effective methods are readily available to rationally assess the health of a civil structure over its operational lifespan. Visual inspection, perhaps the oldest of evaluation methods, is by far the most common tool used to investigate a structure for ordinary operational damage. Also available are structural monitoring systems that can be used to continuously record the ambient and forced response of an instrumented structure. Even though structural monitoring systems are more expensive than visual inspections, they provide a wealth of quantitative data that fully describes a structure’s performance during external loading. Structural monitoring systems are popular in the western United States where local building codes often require their installation in structures exceeding code defined sizes3. Today, many academic and commercial researchers are exploring the improvement of structural monitoring systems to lower system costs and improve functionality. The convergence of wireless communications, embedded computing and sensors have created low-cost wireless structural monitoring systems capable of interrogating their own measurement data in near real-time4,5. Historically, structural monitoring systems have employed passive sensors that are only responsible for recording the response behavior of a structure. In contrast, active sensors are sensors equipped with capabilities to excite the systems in which they are installed while simultaneously recording the system responses. An active sensor familiar to the
Source: SPIE 11th Annual International Symposium on Smart Structures and Materials, San Diego, CA, USA, March 14-18, 2004

structural engineering community is the ultrasound transducer that emits ultrasonic pulses into structural elements while recording the internal reflection of the initial pulse. Material properties, such as Young’s modulus, can be accurately correlated to the time of flight between the initial and reflected pulses6. Piezoelectric materials are widely used for active sensing because their unique mechanical-electrical properties allow them to behave as actuators or sensors. When an electrical field is applied to a piezoelectric, it will expand along the axis of polarization; when mechanically stressed piezoelectric materials generate an internal voltage. Piezoelectric pads surface mounted to structural elements have been employed to actively sense structural systems with the intention of diagnosing damage in the element. For example, Wu and Chang have employed piezoelectric rings mounted to steel reinforcement bars to assess if they have debonded from the encasing concrete7. Others, including Park et al., have shown that the electrical impedance of piezoelectric pads mounted to masonry and steel structures exhibit detectable changes when damage is present in the vicinity of the piezoelectric8. The rapid attenuation of active sensor excitations within civil engineering materials (e.g. concrete) tends to keep their effective reach to areas in the vicinity of the excitation application point. As such, damage detection methods using active sensor data would only be capable of identifying damage in the immediate vicinity of the active sensor. The damage detection methods previously proposed for civil structures consider the global vibration characteristics of a structure to hypothesize the occurrence, location and severity of structural damage. Global response measures were considered because monitoring system costs prevented the installation of dense arrays of sensors in structures. Unfortunately, damage detection based on variations in global vibration characteristics have been shown to be difficult to apply to civil structure because their vibration characteristics are also strongly influenced by environment variations9. Wireless monitoring systems hold the potential to reduce system costs so that structures can be monitored by dense sensor arrays. High sensor densities in a structure would allow the monitoring systems to also focus on the behavior of structural subsystems such as structural elements (beams, columns and joints) to diagnose damage. Damage detection methods focused on local structural elements could reap many benefits from the use of active sensors. Active sensors represent a repeatable excitation that can illuminate high-order response modes of structural elements which are known to be less sensitive to variations in the structural environment than low-order global response modes used in traditional damage detection methods. This study proposes a new damage detection methodology using data obtained from actively sensed structural elements. The novel approach is based on system identification models calculated from input-output response data obtained from structural elements monitored by piezoelectric active sensors. Discrete-time transfer function poles of the system identification model can be plotted upon the discrete-time complex plane (z-plane). The complex plane is a powerful graphical tool since the location of poles on the plane are integrally tied to the frequencies and damping ratios of the dynamic response modes. Damage introduced in the structural system will cause changes in the modal frequencies and damping ratios resulting in the migration of poles in the complex plane. Pole migration patterns will be rigorously analyzed using pattern classification analysis methods; in particular, linear discriminant functions will be found to infer if poles of the structure in an unknown state are linearly separable from those of the undamaged structure thereby suggesting structural damage. A simple aluminum plate element with piezoelectric pads mounted to its surface will be used to illustrate the effectiveness of the proposed discrete domain pole classification methodology for damage detection. A series of cuts will be made in the plate to simulate fatigue cracking which is a common failure mechanism in steel structures as revealed by the 1994 Northridge earthquake where fatigue failure of welded steel moment resisting frame connections was observed10.
2. EXPERIMENTAL SETUP – ACTIVE SENSING OF AN ALUMINUM PLATE A cantilevered aluminum plate element has been selected to serve as a simple structural element to which active sensors can be mounted for both system excitation and measurement of corresponding responses. The aluminum plate is designed to be 28.6 cm by 6.8 cm in area and 0.3175 cm thick; plate dimensions are specifically chosen to ensure that acoustic waves would experience little attenuation over large spatial distances. To generate acoustic surface (Lamb) waves, two lead-zirconate-titanate (PZT) piezoelectric pads are attached to the plate surface with one pad intended to excite the plate system and the other to record its dynamic response to that excitation. A wireless active sensing unit prototype, proposed by Lynch et al., is utilized to command one piezoelectric pad and to record the response of the
system using the output from the other piezoelectric pad, effectively closing an active sensing feedback loop. A picture describing the cantilevered aluminum plate setup is shown in Fig. 1. Wireless active sensing units represent the convergence of sensing, actuation, mobile computing and low-cost wireless communications integrated in a single monitoring unit11. Intended to serve as computationally-independent nodes in structural monitoring systems, the wireless active sensing unit is designed to be capable of commanding active sensors, recording the response of structures using passive sensors and executing embedded procedures that interrogate the collected response data. When data collected by the wireless active sensing unit is needed by other nodes in the wireless monitoring system, it can be transmitted via the unit’s wireless communication channel. The design of the wireless active sensing unit for this study is based on designs of wireless sensing units previously proposed by Lynch, et al5. However, with active sensing effectively targeting high order response modes of structural elements, the wireless active sensing unit must be capable of commanding active sensors and collecting response data at much higher sampling rates than those possible using wireless sensing units. The design of the wireless active sensing unit can be divided into various functional modules. At the core of the wireless active sensing unit design is a powerful microcontroller, which will be responsible for the operation of the unit as well as the execution of embedded procedures. To serve as the unit core, the Motorola MPC555 PowerPC microcontroller is chosen for its extensive on-chip memory (both read only and random access memory), on-board floating point processor and, quick speed (20 MHz). To command active sensors, an actuation interface circuit is designed using off-the-shelf integrated circuit elements. The 12-bit Texas Instrument DAC7624 digital-to-analog converter (DAC) is the primary component of the actuation interface with additional instrumentation amplifiers included to increase the DAC range to +/- 5 V. The actuation interface is designed as actuator transparent and can accommodate any type of active sensor (piezoelectric, ultrasonic, impact hammers, etc.) and structural control actuator. To collect data simultaneously from multiple passive sensors interfaced to the unit, the internal multi-channel 10-bit analog-to-digital converter (ADC) of the MPC555 is employed. Both the actuation and sensing interfaces are controlled in real-time by the MPC555 core at sampling rates below 40 kHz. To comfortably store long command and response time-history records, 256 Kbytes of additional random access memory is included in the wireless active sensing unit core. For the transfer of data between the wireless active sensing unit and the wireless monitoring system, a low-power wireless modem operating on the 900 MHz unlicensed radio spectrum is chosen. The MaxStream XCite wireless modem is capable of transferring data at rates as high as 38,400 bits per second and for ranges as far as 300 m in open space (90 m on the interior of concrete structures). Using frequency hopping spread spectrum techniques, the radio is highly reliable and immune to narrow band interference. Another attractive feature of the MaxStream modem is that it only consumes 55 mA of electrical current when transmitting and 35 mA when receiving. Compared to other wireless modems commercially available, the XCite is a low-power option. A picture of the wireless active sensing unit is presented in Fig. 1.
28.6 cm
6.8 cm
ReceivingPiezoelectric
Element
TransmittingPiezoelectric
ElementAcoustic Surface Wave
6 cm
Active SensingFeedback Loop
System Response
Command Excitation
Wireless Active Sensing UnitPrototype
Fig. 1. Experimental setup of a cantilevered aluminum plate with piezoelectric active sensors attached

To simulate damage in the system, the aluminum plate will be cut between the two piezoelectric pads. The cut is intended to mimic cracks resulting from fatigue in metallic plate elements. Fatigue cracks have been of extreme interest to the structural engineering community since the 1994 Northridge earthquake where it was discovered steel moment resisting frames suffered widespread fatigue failures. The cause of the fatigue failure was ultimately attributed to the weld detailing of the connection10. A hack saw is used to introduce a cut perpendicular to the axial length of the cantilevered plate. The cut is introduced in multiple steps resulting in three cut lengths of 1, 2 and 3 cm (See Fig. 2). The width of the cut is approximately 1 mm which is wider than an ordinary fatigue crack.
3. SYSTEM IDENTIFICATION OF THE PLATE SYSTEM A mathematical description of an actively sensed structural system is needed to describe the system in both an undamaged and damaged structural state. Employing two piezoelectric elements, one as an actuator and another as a sensor, the input-output behavior of the structural system can be recorded and analyzed. Assuming the structural system to be linear and time-invariant, numerous system identification models can be calculated from the digitized input-output data12. From the available models, the autoregressive with exogenous input (ARX) time-series model is chosen because of its computational simplicity. An ARX model is a linear difference equation equating weighted observations of the system output, y(k), with those of the system input, u(k):
)()()1()()1()( 11 kenkubkubnkyakyaky bnan ba+−+−=−+−+ LL (1)
The weights on past observations of the system output are denoted as a while those of the input are denoted as b. In total, na observations of the system output and nb observations of the input are considered. The error inherent in the ARX model, e(k) is equivalent to the difference between the true system output, y(k) at step k and that predicted by the ARX model, )(ˆ ky :
)()1()()1()(ˆ 11 bnan nkubkubnkyakyakyba
−+−+−−+−−= LL (2) Discrete-time signals can be transformed to the complex domain and described by the complex variable, z, through the use of the Z-transform:
∑∞
∞−
−= kzkfzF )()( (3) The continuous domain analogy of the discrete-time complex variable, z, is the Laplace transform’s complex variable, s. To reveal the physical meaning of the complex variable, z, consider a discrete time signal which is equal to zero everywhere except at time step k=c. The Z-transform of this discrete time signal is equal to:
cZ
azzFckcka
kf −=⇒⎩⎨⎧
≠=
= )(0
)( (4)
Fig. 2. Aluminum plate element with two piezoelectric pads mounted and a 3 cm long 1 mm wide cut (simulated fatigue crack)
3 cm cut
This simple transformation reveals that the physical meaning of the inverse discrete-time complex variable, z-1, is simply a discrete time unit delay. Using this fact, the ARX time-series model can be transformed to the discrete-time complex domain by inspection (or by using the Z-transform defined in Equation (3)):
{ })()()()()()(
)()()1()()1()(1
11
1
11
zEzUzbzUzbzYzazYzazY
kenkubkubnkyakyakyZb
ba
a
a
ba
nn
nn
bnan
++=++
⇒+−+−=−+−+−−−− LL
LL (5)
Ignoring the residual error, e(k), of the ARX time-series model, a transfer function of the dynamic linear system can be written in the discrete-time complex domain, H(z):
a
a
b
ba
nn
nn
zazazbzb
zUzYzH −−
−−
++
+==
L
L1
1
11
1)()()( (6)
The transfer function, H(z), can be shown to be the Z-transform of the discrete-time response, h(k), of the dynamic system to a unit-pulse input. An important property of the Z-transform is that it reduces the convolution of time sequences in the time-domain to multiplication in the complex z domain. The roots of the polynomial equations of the transfer function denominator are termed the poles of the dynamic system. The number of poles in the ARX model discrete-time transfer function is equal to the number of ARX coefficients, na, on past observations of the system output. Representing the solution of the system characteristic equation, poles encapsulate the frequency, ω, and damping ratio, ξ, of each uncoupled response mode. For this reason, they are widely used in modern control theory where pole locations are intentionally moved through control feedback loops. A relationship between pole locations in the complex plane and modal frequency and damping can be written by exploiting the relationship between the continuous time complex variable, s, and the discrete-time complex variable, z:
θξωξωξωξω jjTTTjsT reeeeez nnnn ±−±−⎟
⎠⎞⎜
⎝⎛ −±−
====2
211
(7) where the variable T is the discrete time step. The poles of the transfer function can be plotted on the complex plane using the polar coordinates provided by Equation (7). Poles within the unit circle in the complex plane refer to stable poles of the system while poles falling outside of the unit circle destabilize the dynamic system. As will be shown in Fig. 3, contours of constant damping and frequency can be overlaid on the complex plane facilitating easy visual interpretation of mapped poles. Contours of constant damping all originate at z=1 and radiate out to termination points along the real axis. Constant frequency contours originate from the perimeter of the unit circle in equally spaced intervals. Mapping modal frequencies and damping ratios, the complex plane is a powerful and highly expressive domain in which to analyze structural systems in their undamaged and damaged states. As damage is introduced in a structural system, subtle changes in the system stiffness and damping will occur. These changes can be quantitatively described by the migration patterns of transfer function poles in the z-plane. During excitation of the piezoelectric-aluminum plate system and measurement of the system response, small random errors (e.g. Gaussian electrical circuit noise) from the wireless active sensing unit’s actuation and sensing interfaces could be injected into the input-output time-history data. These inaccuracies could lead to subtle errors in the calculation of the system transfer function as well as in the location of system poles in the complex domain. With these error sources difficult to quantify, an approach is taken where the structural system will be excited by a large number of independent input signals. By applying multiple input signals and recording the corresponding system response, a large statistical sampling of ARX models can be derived for an element in a given structural state. Instead of considering the location of individual poles, the damage detection method proposed in this study will consider the cluster of poles of the individual ARX models in the sampling set. This should provide the damage detection methodology greater robustness. To further minimize the inadvertent modeling of noise inherent in the data acquisition subsystem, the size of the ARX model, as defined by the number of a and b weighting coefficients, will be judiciously selected. Models too small do not fully characterize the system dynamics while models too large will model the behavior as well as measurement noise. A method of selecting the ARX model size based upon minimizing the norm of the model residual error when applied to a validation data set is adopted in this study; this approach finds an ARX model size of na = 21 and nb = 4 to be optimal11. For each structural state of the plate, 20 excitations will be applied to the system; all of the excitation signals are chosen to be zero mean white noise signals with varying levels of AC energy. Each input excitation record is stored in the

wireless active sensing unit so that the same white noise input signals can be applied for each structural state. Description of the white noise excitation signal set is summarized in Table 1. Each input excitation is set to a length of 4096 points and is sampled at 40 kHz. The 40 kHz is the maximum sampling rate possible using the wireless active sensing unit and will illuminate modes below the Nyquist frequency (20 kHz). Fig. 3 presents input excitation #17 (with a 1.1 V standard deviation) and the resulting system response measured on the second piezoelectric pad. Based on the system input and output, an ARX time-series model is calculated by the wireless active sensing unit core using a least-square solution to the parameter estimation problem. The response predicted by the ARX model is in good agreement with that experimentally observed. The coefficients of the ARX model determined for the response of the undamaged plate are then used to determine the locations of the poles of the input-output transfer function, H(z), in the discrete-time complex plane. The pole locations presented in the complex plane of Fig. 3 are denoted using X as a notation mark for each pole. The complete set of excitation signals are applied to the plate in its undamaged state. For each input-output time-history pair, an ARX transfer function is determined from which the poles of the system can be found. The poles are ordered by increasing frequency and plotted on the complex plane. Next, damage is introduced in the plate with a 1 cm long cut. Again, the same excitations set is applied to the system and the response recorded. Similar to that of the undamaged
0.055 0.06 0.065 0.07 0.075−2
0
2
Vol
tage
(V
)
Active Sensor Command Signal (1.1 V STD)
0.055 0.06 0.065 0.07 0.075−1
0
1
Vol
tage
(V
)
Recorded Response of Second Piezoelectric Pad
0.055 0.06 0.065 0.07 0.075−1
0
1
Time (sec)
Vol
tage
(V
)
ARX Predicted Response of Second Piezoelectric Pad
−1 −0.5 0 0.5 1−1
−0.8
−0.6
−0.4
−0.2
0
0.2
0.4
0.6
0.8
1
0.90.80.70.60.50.40.30.20.1
π/T
π/2T
9π/10T
2π/5T
4π/5T3π/10T
7π/10T
π/5T
3π/5T
π/10T
π/T
π/2T
9π/10T
2π/5T
4π/5T3π/10T
7π/10T
π/5T
3π/5T
π/10T
Real(z)
Imag
(z)
Location of ARX Model’s H(z) Poles
ξ =
ξ =
ξ =
ω =
ω =
ω =
(a) (b)
Fig. 3. (a) Active sensing excitation applied to the plate system and the corresponding system response (true and ARX predicted). (b) ARX model poles are also shown are denoted as “X” upon the complex z-plane
Table 1 – White noise input signals applied to the piezoelectric-aluminum plate system
Signal Index Mean STD Signal Index Mean STD 1 0 V 0.3 V 11 0 V 0.8V 2 0 V 0.3 V 12 0 V 0.8 V 3 0 V 0.4 V 13 0 V 0.9 V 4 0 V 0.4 V 14 0 V 0.9 V 5 0 V 0.5 V 15 0 V 1.0 V 6 0 V 0.5 V 16 0 V 1.0 V 7 0 V 0.65 V 17 0 V 1.1 V 8 0 V 0.65V 18 0 V 1.1 V 9 0 V 0.75 V 19 0 V 1.2 V
10 0 V 0.75V 20 0 V 1.2 V

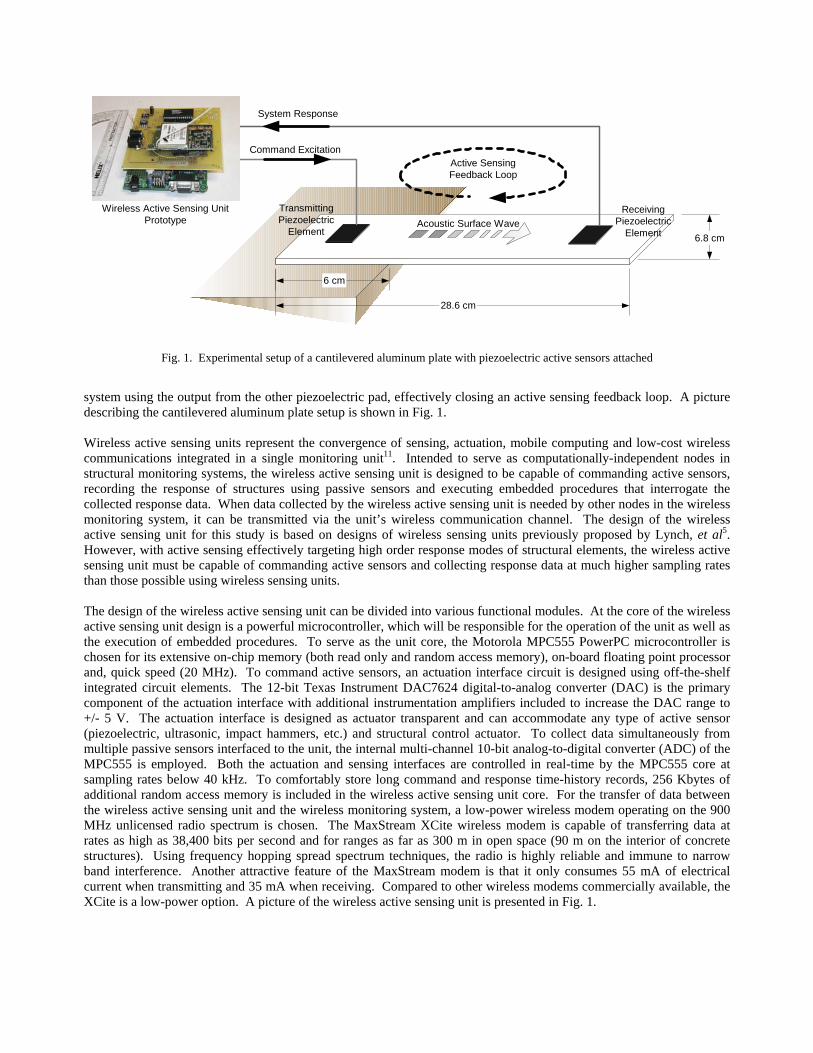
plate, ARX models and corresponding set of poles are calculated. This procedure is repeated for the remaining two damage states (cuts with lengths of 2 and 3 cm). In Fig. 4, the locations of the poles of each ARX model transfer function are plotted in the complex plane for both the undamaged and damaged (3 cm long cut) plate. For each structural state analyzed, the poles form natural pole clusters for each of the 21 poles. The first pole, denoted as Pole 1, is along the real axis and corresponds to a critically damped mode of the system response. The remaining 20 poles are 10 conjugate pairs representing lightly damped modes of the system and have been labeled as Pole 2 through Pole 21. If the locations of the discrete-time transfer function pole clusters are compared for the undamaged and damaged structure, it is evident that some of the poles have shifted. It is hypothesized that shifts in the pole clusters can be an effective harbinger of structural damage in the system. In order to devise an automated method for identifying cluster shifts and correlating them to damage, the theory of statistical pattern classification will be invoked.
4. LINEAR DECISION BOUNDARIES FOR PATTERN CLASSIFICATION Pattern classification is a broad field cutting across many engineering and scientific disciplines. At its foundation, pattern classification offers algorithmic procedures that can automate the cognitive process of classifying entities to categories. By considering the underlying statistics that distribute samples to various categories, class boundaries can be found. The use of pattern classification methods for damage detection is natural considering damage detection fundamentally seeks classifying a structure to one of two classes: damaged or undamaged. Over the past decade, many researchers have employed techniques from pattern classification to identify damage in structures. For example, Farrar et al. have proposed the use of Fisher linear discriminants for damage detection13. Their method transposes estimated Gaussian probability density functions of modal frequencies to a lower dimension space where a Bayes classifier can be applied for class designation. The Fisher linear discriminant provides a reduced dimension projection that will maximize the separation of class density distributions while simultaneously minimizing the with-in class scatter. The Fisher linear discriminant successfully identified the presence of damage in concrete bridge piers but was unable to correlate changes in the Fischer coordinate to the severity of the damage14. Mita has explored the application of Support Vector Machines to screen a structure for damage based on transient responses to piezoelectric excitations15. In contrast to Fisher linear discriminants, Support Vector Machines employ nonlinear mapping functions to convert feature vectors into higher dimensions where a linear boundary can be found that will separate the vectors into multiple class categories. Pattern classification has also been shown to be effective in diagnosing structural damage, by employing nearest-neighbor class estimation using the coefficients of auto-regressive (AR) time series model fit to ambient structural response data16.
−1 −0.5 0 0.5 1−1
−0.8
−0.6
−0.4
−0.2
0
0.2
0.4
0.6
0.8
1
0.90.80.70.60.50.40.30.20.1
π/T
π/2T
9π/10T
2π/5T
4π/5T3π/10T
7π/10T
π/5T
3π/5T
π/10T
π/T
π/2T
9π/10T
2π/5T
4π/5T3π/10T
7π/10T
π/5T
3π/5T
π/10T
Real(z)
Imag
(z)
Undamaged ARX Model H(z) Poles
−1 −0.5 0 0.5 1−1
−0.8
−0.6
−0.4
−0.2
0
0.2
0.4
0.6
0.8
1
0.90.80.70.60.50.40.30.20.1
π/T
π/2T
9π/10T
2π/5T
4π/5T3π/10T
7π/10T
π/5T
3π/5T
π/10T
π/T
π/2T
9π/10T
2π/5T
4π/5T3π/10T
7π/10T
π/5T
3π/5T
π/10T
Real(z)Im
ag(z
)
Damaged (3 cm Cut) ARX Model H(z) Poles
−1 −0.5 0 0.5 1−1
−0.8
−0.6
−0.4
−0.2
0
0.2
0.4
0.6
0.8
1
0.90.80.70.60.50.40.30.20.1
π/T
π/2T
9π/10T
2π/5T
4π/5T3π/10T
7π/10T
π/5T
3π/5T
π/10T
π/T
π/2T
9π/10T
2π/5T
4π/5T3π/10T
7π/10T
π/5T
3π/5T
π/10T
Real(z)
Imag
(z)
Undamaged ARX Model H(z) Poles
1
2
3
5
4
7
8
9
10
11
12
13
1416
15
6
17
18
19
21
20
1
2
3
5
46
7
9
81012
111315
1719
21
20
1816
14
Fig. 4. Pole locations for the undamaged and damaged aluminum plate system (poles are consecutively numbered)

Pattern classification provides methods to classify an unclassified feature vector, x, into one of i class categories, ωi. If the statistical distribution of the samples of a given class, p(x|ωi), and the prior probability of the class, P(ωi), are all known, Bayes formula can be used to classify an unknown feature vector17:
∑=
= i
kkk
jjj
Pxp
PxpxP
1
)()(
)()()(
ωω
ωωω
(8)
Unclassified feature vector, x, would be assigned to the category, ωi, with the greatest posterior probability, max{P(ωi|x)}. Surfaces in the feature vector space can be defined where the posterior probabilities of the maximum and next maximum class are equal to one another. These surfaces are defined as decision boundaries because feature vectors on one side would be classified by Bayes formula as class ωi while on the other side as class ωj. In many instances, the underlying statistics of the feature vectors of a given class, p(x|ωi), are unknown. For two-class problems with unknown probability densities functions, one tactic offered by pattern classification is to assume a form of the decision boundary a priori. A discriminant function, g(x), that mathematically describes the decision boundary, is often assumed to be a linear function of the feature vector space, x:
0)( =+= oT wxwxg (9)
where the vectors, w and wo, are termed the weight vector and bias respectively. To simplify Equation (9), a new feature vector, y, and weight vector, a, are defined:
{ } 01
)( ==⎭⎬⎫
⎩⎨⎧
= yax
wwxg TTo
(10)
By augmenting the initial feature space, x, with an additional dimension to derive the feature vector, y, the linear discriminant function has been simplified to a vector dot product expression. The new weight vector, a, defines a hyperplane through the origin in y-space which separates the two classes. Given the separating weight vector, the linear classifier can be utilized by forming the feature vector, y, and determining the cross product of a and y; if aTy > 0, classify x as category ω1 and if aTy < 0, then classify x as category ω2. A widely used approach to finding the weight vector, a, is the Perceptron gradient decent method. First feature vectors, x, known to correspond to two categories, ω1 and ω2, are assembled. For feature vectors corresponding to class ω1, the y-space feature vector is defined first as y = {1 xT}. For those of class ω2, the feature vector in y-space is formed as y = {-1 -xT}. By negating the feature vector of the second category, a weight vector which satisfies aTy > 0 for all defined y will be found. For a moment, consider the case where the initial feature vectors, x, are one dimensional scalar values as in Fig. 5. The transformation to two dimensional y-space moves the samples of the first category to y1 = 1 while those of category two are reflected about the y1 axis and are shifted to y1 = -1. The solution for a separating weight vector, a, is posed as a gradient descent problem with a(k) iteratively altered so as to minimize a criterion function, J:
X y2
y1
y1= 1
y1= -1Decision BoundaryClass 1 Class 2
1 2 3 40
⎭⎬⎫
⎩⎨⎧11
⎭⎬⎫
⎩⎨⎧
21
⎭⎬⎫
⎩⎨⎧−−
31
⎭⎬⎫
⎩⎨⎧−−
41
⎭⎬⎫
⎩⎨⎧−
=15.2
a
Fig. 5. Determination of linear decision boundaries using the Perceptron gradient descent method

Jkaka ∇−−= η)1()( (11) The Perceptron gradient decent method defines the criterion function as:
∑∈
−=Yy
T yaaJ )()( (12)
where Y is the set of misclassified augmented feature vectors, y. In Equation (11), η is the learning rate which is a scalar number that sets the rate of decent of the Perceptron criterion function. Minimizing this criterion function will provide the weighting vector, a, that best separates the two classes. If features corresponding to two classes can not be linearly separated, the minimized criterion function will be a nonzero number. In contrast, if the feature vectors are separable, a weighting vector can be found that sets the Perceptron criterion function equal to zero.
5. PATTERN CLASSIFICATION OF SYSTEM POLES FOR DAMAGE DETECTION As damage is introduced in the aluminum plate, the poles of calculated ARX time series models have been observed to shift locations on the complex plane. To infer the possibility of damage in the plate system based on pole migration patterns, pole clusters corresponding to the plate in an unknown state (damaged or undamaged) will be overlaid on the same complex plane with those poles corresponding to the undamaged plate. If the unknown state is undamaged, the pole clusters of the unknown state will be located in the same area as those of the undamaged plate. However, if damage is present in the plate, changes in modal frequencies and damping ratio associated with the damage will cause some pole clusters to not be aligned with those of the undamaged plate. To identify the existence of damage in the structural element, the amount of misalignment of pole clusters corresponding to the plate in an unknown state when compared to the poles of the undamaged plate must be quantified. Linear decision boundaries can be a useful tool for finding a measurable quantity that describes the misalignment of pole clusters. Linear decision boundaries will be employed to identify those pole clusters that have migrated to a point where the poles of the undamaged plate and those of the plate in an unknown state are linearly separable. Each of the 10 conjugate pole pairs will be individually analyzed for the plate in an unknown state to determine if they can be separated from their undamaged counterparts. In calculating linear decision boundaries, a feature vector, x, for each pole, P(z), is simply defined as the real and imaginary parts of the complex pole:
⎭⎬⎫
⎩⎨⎧
=))(Im())(Re(
zPzP
x (13)
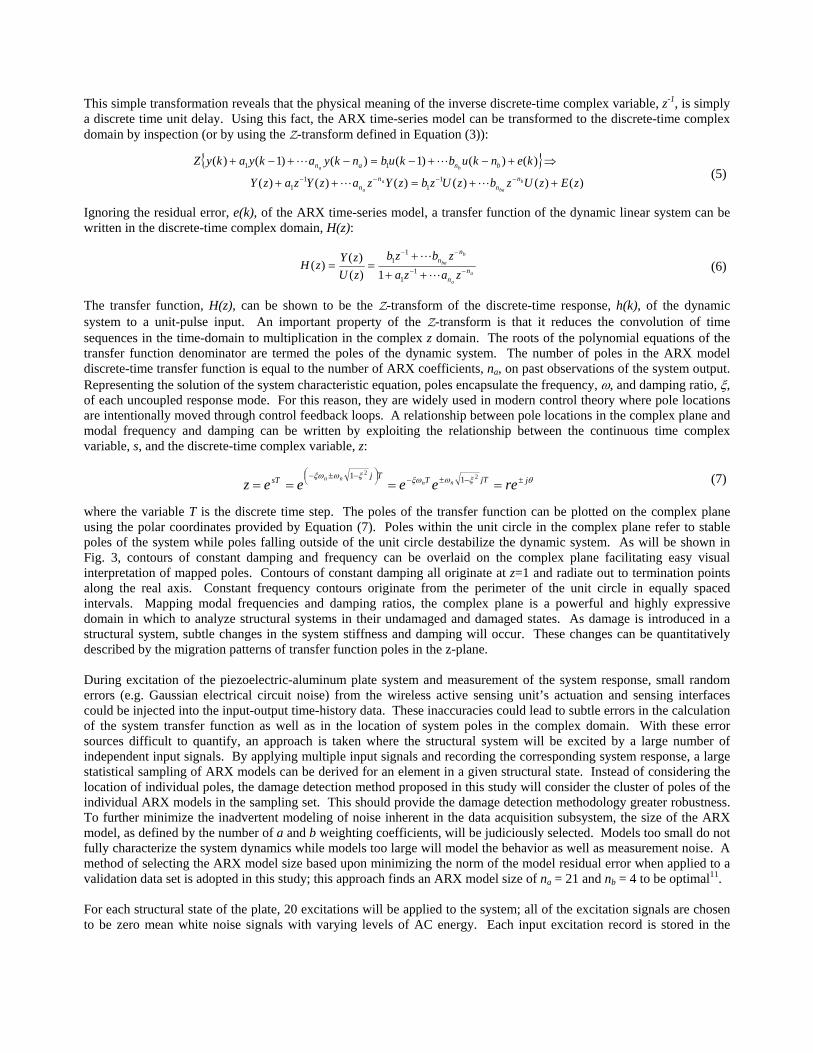
Poles of the undamaged structure will be denoted as class ω1, while those of the unknown structural state as class ω2. For each of the pole clusters, it is initially assumed they are separable and a linear decision boundary will be calculated using the Perceptron criterion function. The decision boundary determined will correspond to a straight line in the complex plane with poles on one side designated as class ω1 and on the other side as class ω2. For those pole clusters that are indeed linearly separable, the calculated linear decision boundary will perfectly classify the poles and the Perceptron criterion function would be minimized to zero. If two corresponding pole clusters are not perfectly separable, the final linear decision boundary will misclassify some poles and the minimized Perceptron criterion function will be nonzero. If the pole clusters are linearly separable, this would indicate a high probability of damage in the structural system. However, if none of the 20 pole clusters are found to be separable and the Perceptron criterion function is a large number, this would suggest the unknown state corresponds to an undamaged structure. The final value of the Perceptron function will provide a rough measure of how inseparable the clusters are. After a linear decision boundary is established for each plot, the final value of the Perceptron criterion function will be calculated for each pole cluster using Equation (12). The value of the criterion function for all 20 pole clusters will be summed and correlated to the level of damage severity to make a final decision on the health of the actively sensed plate system. To assess the efficacy of the proposed damage detection method, the analysis is first conducted on response data of the aluminum plate in its most severe damage state (3 cm long cut). The poles from the damaged and undamaged plate are superimposed on the same complex plane in Fig. 6. Linear decision boundaries using Perceptron gradient decent is determined for the even numbered pole clusters (the odd numbered pole clusters with negative imaginary terms are

symmetrically equivalent to the even numbered clusters; to keep the computational tasks to a minimum, they can be ignored). Three pole clusters (2, 12 and 18) are linearly separable between the damaged and undamaged structural states while pole cluster 16 is almost linearly separable with only two ARX model poles misclassified by the linear decision boundary. To gain a sense of an inseparable pole cluster, cluster 4 is shown in Fig. 6 with the linear decision boundary misclassifying 7 poles. The separability of 3 clusters and near separability of 1 additional cluster is consistent with the severe damage introduced into the aluminum plate system suggesting the proposed method can identify damage. Table 2 summarizes the number of misclassified samples and the final value of the Perceptron criterion function for each cluster number considered. The analysis is repeated for the two remaining damage cases to further confirm the method is an effective tool for damage detection. By considering cases of different damage levels, the proposed method will be studied to learn if it provides measures of damage severity in addition to damage identification. Fig. 7 presents the location of the ARX model poles on the complex plane for each of the two remaining damage cases compared to those of the undamaged structure. Upon each of these plots, the calculated Perceptron linear decision boundary is shown while the number of misclassifications and the final Perceptron criterion function value are documented in Table 2. When the plate is damaged with a 2 cm long cut, the number of misclassifications is slightly less than those of the 3 cm long cut. However, the sum of the final values of the Perceptron criterion function of each decision boundary is 36.79; this value is larger than the sum of the final Perceptron criterion functions found for the 3 cm long cut plate. Consistent with these trends, the total number of misclassifications and sum of the final values of the Perceptron criterion functions for the 1 cm cut plate are larger than those of the 2 cm and 3 cm cuts. In contrast to the 3 cm cut, only one pole cluster is totally separable by a linear decision boundary for each of the 1 cm and 2 cm cut damage states. The larger number of misclassifications, the greater criterion function sum and smaller numbers of completely linearly separable clusters suggest the poles of the 1 cm and 2 cm damages state are closer to those of the undamaged plate. Clearly the Perceptron linear classifiers can be an effective tool for detecting structural damage as well as assessing the severity of the damage. To validate the proposed damage detection methodology, an additional set of active sensor input-output signals are taken for the undamaged plate. This extra input-output signal set is denoted as a validation data set whose ARX model poles will be compared to the poles of the initial baseline undamaged ARX model set. In comparing the pole locations of the ARX models fit to the two separate undamaged data sets, it is anticipated that no pole clusters will be separable resulting in a large number of misclassifications and large Perceptron criterion function values. The results confirm that no
−1 −0.5 0 0.5 1−1
−0.8
−0.6
−0.4
−0.2
0
0.2
0.4
0.6
0.8
1
0.90.80.70.60.50.40.30.20.1
π/T
π/2T
9π/10T
2π/5T
4π/5T3π/10T
7π/10T
π/5T
3π/5T
π/10T
π/T
π/2T
9π/10T
2π/5T
4π/5T3π/10T
7π/10T
π/5T
3π/5T
π/10T
Real(z)
Imag
(z)
Undamaged (*) Poles versus Damaged (o) Poles
0.8 0.85 0.9 0.95
0.2
0.25
0.3
0.35
π/10T
Imag
(z)
Pole 2
0.7 0.75 0.80.58
0.6
0.62
0.64
0.66
0.68
3π/
Imag
(z)
Pole 4
−0.25 −0.2 −0.150.8
0.85
0.9
0.95
1
π/5T
Real(z)Im
ag(z
)
Pole 12
−0.8 −0.7 −0.6 −0.5
0.2
0.3
0.4
0.5
9π/10T
Real(z)
Imag
(z)
Pole 18
2
4 6
8 10 12 14
16
18
20
DecisionBoundaries
Damaged (Cut 3 cm)Undamaged
Fig. 6. Perceptron linear decision boundaries between undamaged and damaged (3 cm long cut) poles

clusters are separable and that the number of misclassifications is larger than those for any of the damaged cases. However, it should be noted the Perceptron criterion function for the undamaged plate compared to the baseline undamaged plate ARX model set is greater than that of the 2 cm and 3 cm cut plate, but smaller than that of the 1 cm cut plate.
6. CONCLUSIONS This paper has proposed a new method for detecting structural damage based on the input-output response data of an actively sensed structural element. The method identifies changes in the location of discrete-time transfer function poles upon the complex plane to infer changes in modal frequency and damping associated with damage. By including measures of modal damping, pole locations represent a more descriptive measure of the system dynamics than just modal frequencies. To quantify the migration of poles, linear classifiers are employed based upon a Perceptron gradient descent method. Linear decision boundaries are intended to measure the separability of pole clusters with clusters of a damaged system separable from those of an undamaged system. Using a simple cantilevered aluminum plate element actively sensed by surface mounted piezoelectric pads, the method is shown to be effective in identifying the presence of structural damage associated with three cuts of varying lengths. Furthermore, the number of misclassifications and the final value of the Perceptron criterion function were shown to be closely correlated to the severity of the structural damage. The method appears to be more effective than the Fisher linear discriminant which could not assess the level of damage severity14. The Perceptron methodology proposed in this study is similar to the Fisher linear discriminant method but considers modal damping in addition to modal frequencies. Furthermore, application of Perceptron
Table 2 – Decision boundary results for 3 damage cases (1, 2 and 3 cm long cuts)
Damaged (3 cm Cut) Damaged (2 cm Cut) Damaged (1 cm Cut) Validation Undamaged Pole Cluster Number
Num of Mis-classification
Criterion J
Num of Mis-classification
Criterion J
Num of Mis-classification
Criterion J
Num of Mis-classification
Criterion J
2 0 0 3 0.60 3 0.60 9 9.6347 4 7 0.84 0 0 0 0 12 4.2509 6 7 8.08 12 12.33 7 4.09 10 2.1149 8 4 2.10 7 1.92 12 14.57 9 1.0724
10 11 7.22 6 4.55 8 2.74 7 1.4601 12 0 0 4 1.28 6 3.92 12 1.6566 14 8 0.84 11 13.92 11 16.38 5 3.1235 16 2 1.49 2 1.00 3 2.92 10 15.2436 18 0 0 3 0.70 1 0.43 5 1.6084 20 5 2.39 2 0.50 10 13.99 6 1.8440
SUM 52 22.96 50 36.79 61 60.45 85 42.01
−1 −0.5 0 0.5 1−1
−0.8
−0.6
−0.4
−0.2
0
0.2
0.4
0.6
0.8
1
0.90.80.70.60.50.40.30.20.1
π/T
π/2T
9π/10T
2π/5T
4π/5T3π/10T
7π/10T
π/5T
3π/5T
π/10T
π/T
π/2T
9π/10T
2π/5T
4π/5T3π/10T
7π/10T
π/5T
3π/5T
π/10T
Real(z)
Imag
(z)
Undamaged (*) Poles versus Damaged (o) Poles
−1 −0.5 0 0.5 1−1
−0.8
−0.6
−0.4
−0.2
0
0.2
0.4
0.6
0.8
1
0.90.80.70.60.50.40.30.20.1
π/T
π/2T
9π/10T
2π/5T
4π/5T3π/10T
7π/10T
π/5T
3π/5T
π/10T
π/T
π/2T
9π/10T
2π/5T
4π/5T3π/10T
7π/10T
π/5T
3π/5T
π/10T
Real(z)Im
ag(z
)
Undamaged (*) Poles versus Damaged (o) Poles
−1 −0.5 0 0.5 1−1
−0.8
−0.6
−0.4
−0.2
0
0.2
0.4
0.6
0.8
1
0.90.80.70.60.50.40.30.20.1
π/T
π/2T
9π/10T
2π/5T
4π/5T3π/10T
7π/10T
π/5T
3π/5T
π/10T
π/T
π/2T
9π/10T
2π/5T
4π/5T3π/10T
7π/10T
π/5T
3π/5T
π/10T
Real(z)
Imag
(z)
Undamaged (*) Poles versus Validation Undamaged (o) Poles
(a) (b) (c)
Fig. 7. Perceptron decision boundaries for the (a) 2 cm cut and (b) 1 cm cut plates. (c) Method validation using a second undamaged plate data set compared to the initial undamaged plate data set

classifiers does not assume an underlying probability distribution of poles in the complex plane which might not be Gaussian. Future work is needed to explore further the applicability of the proposed damage detection methodology for use in more realistic structural systems such as steel elements and concrete connections. The universality of the approach is currently being explored through the use of different active sensors in realistic structural elements constructed of concrete. Improvements in the accuracy of the method could potentially be gained by improving the capabilities of the wireless active sensing unit used to command the active sensors. In particular, higher sampling rates are desired so that higher order modes are illuminated that might exhibit greater sensitivity to structural damage than those below 20 kHz.
ACKNOWLEDGEMENTS The author would like to express his gratitude to Arvind Sundararajan and Prof. Kincho Law of Stanford University and Drs. Hoon Sohn and Chuck Farrar of Los Alamos National Laboratory for providing assistance in the design and fabrication of the wireless active sensing unit prototype. The author would also like to acknowledge the support and encouragement of Dr. S.C. Liu of the National Science Foundation. This research is partially funded by the National Science Foundation under grant number CMS-9988909 and Los Alamos National Laboratory under contract number 75067-001-03.
REFERENCES
1. S. Chase and H. Ghasemi, “A vision for highway bridges for the 21st century,” Proceedings of the 4th International Workshop on
Structural Health Monitoring, Stanford, CA, pp. 205-213, 2003. 2. M. Celebi, R. A. Page and E. Safak. Monitoring earthquake shaking in buildings to reduce loss of life and property. Fact Sheet
068-03, United States Geological Survey (USGS), Menlo Park, CA, 2003. 3. International Conference of Building Officials (ICBO). 2001 California Building Code – California Code of Regulations. Title
24, Part 2, Volume 2, ICBO, Whittier, CA, 2002. 4. E. G. Straser and A. S. Kiremidjian. A modular, wireless damage monitoring system for structures. Report No. 128, John A.
Blume Earthquake Engineering Center, Department of Civil and Environmental Engineering, Stanford University, Stanford, CA, 1998.
5. J. P. Lynch. Decentralization of wireless monitoring and control technologies for smart civil structures. Report No. 140, John A. Blume Earthquake Engineering Center, Department of Civil and Environmental Engineering, Stanford University, Stanford, CA, 2002.
6. J. Krautkramer and H. Krautkramer. Ultrasonic Testing of Materials, Springer-Verlag, Berlin, Germany, 1990. 7. F. Wu and F. K. Chang, “A built-in active sensing diagnostic system for civil infrastructure systems,” Proceedings of 8th
International Symposium on Smart Structures and Materials, San Diego, CA, SPIE v. 4330, pp. 27-35, 2001. 8. G. Park, H. H. Cudney and D. J. Inman, “Impedance-based health monitoring of civil structural components.” Journal of
Infrastructure Systems, ASCE, 6(3): 153-160. 9. S. W. Doebling, C. R. Farrar, M. B. Prime and D. W. Shevitz. Damage identification and health monitoring of structural and
mechanical systems from changes in their vibration characteristics: a literature review. Report No. LA-13070-MS, Los Alamos National Laboratory, Los Alamos, NM, 1996.
10. P. B. Rosta, “Northridge Aftermath: Aftershocks Continue,” Engineering News Record (ENR), January 26, 2004. 11. J. P. Lynch, A. Sundararajan, K. H. Law, H. Sohn and C. R. Farrar, “Design of a wireless active sensing unit for structural health
monitoring,” Proceedings of NDE for Health Monitoring and Diagnostics, SPIE, San Diego, CA, 2004. 12. L. Ljung. System Identification: Theory for the User. Prentice Hall PTR, Upper Saddle River, NJ, 1999. 13. C. R. Farrar, D. A. Nix, T. A. Duffey, P. J. Cornwell and G. C. Pardoen, ”Damage identification with linear discriminant
operators,” Proceeding of the 17th International Modal Analysis Conference (IMAC), Orlando, FL, pp. 599-607, 1999. 14. C. R. Farrar, S. W. Doebling and D. A. Nix, “Vibration-based structural damage identification.” Philosophical Transactions of
the Royal Society: Mathematical, Physical and Engineering Science, 359(1778): 131-149. 15. R. Taniguchi and A. Mita, “Support Vector Machine based active damage detection method,” Proceedings of the 4th
International Workshop on Structural Health Monitoring, Stanford, CA, pp. 749-756, 2003. 16. H. Sohn and C. Farrar, “Damage diagnosis using time-series analysis of vibration signals,” Journal of Smart Materials and
Structures, IOP, 10(3): 446-451. 17. R. O. Duda, P. E. Hart and D. G. Stork. Pattern Classification. John Wiley & Sons, New York, NY, 2001.