Embed Size (px)
Citation preview
This article has been accepted for publication and undergone full peer review but has not been through the copyediting, typesetting, pagination and proofreading process which may lead to differences between this version and the Version of Record. Please cite this article as doi: 10.1002/2015GL065385
©2015 American Geophysical Union. All rights reserved.
Line of Sight Displacement from ALOS-2 Interferometry: Mw 7.8 Gorkha
Earthquake and Mw 7.3 Aftershock
Eric O. Lindsey1
Ryo Natsuaki2
Xiaohua Xu1
Masanobu Shimada2
Manabu, Hashimoto3
Diego Melgar4
David T. Sandwell1
1Institute for Geophysics and Planetary Physics, University of California, San Diego, USA
2Earth Observation Research Center, Japan Aerospace Exploration Agency (JAXA),
Tsukuba, Japan
3Disaster Prevention Research Institute, Kyoto University, Kyoto, Japan
4Seismological Laboratory, UC Berkeley, Berkeley, USA

©2015 American Geophysical Union. All rights reserved.
Abstract
Interferometric Synthetic Aperture Radar (InSAR) is a key tool for the analysis of
displacement and stress changes caused by large crustal earthquakes, particularly in remote
areas. A challenge for traditional InSAR has been its limited spatial and temporal coverage
especially for very large events, whose dimensions exceed the typical swath width of 70 –
100 km. This problem is addressed by the ALOS-2 satellite, whose PALSAR-2 instrument
operates in ScanSAR mode, enabling a repeat time of 2 weeks and a swath width of 350km.
Here, we present InSAR line-of-sight displacement data from ALOS-2/PALSAR-2
observations covering the Mw 7.8 Gorkha, Nepal earthquake and its Mw 7.3 aftershock that
were acquired within one week of each event. The data are made freely available and we
encourage their use in models of the fault slip and associated stress changes. The Mw 7.3
aftershock extended the rupture area of the mainshock toward the east, but also left a 20 km
gap where the fault has little or no co-seismic slip. We estimate this un-slipped fault patch
has the potential to generate a Mw 6.9 event.
Key Points
Observations of the Mw 7.8 Gorkha, Nepal earthquake and Mw 7.3 aftershock are
presented.
ALOS-2 provides burst-aligned ScanSAR interferometry with 350 km swath width.
Data from co- and post-seismic interferograms are available online for use in modeling
studies.
Keywords
ScanSAR interferometry, ALOS-2, PALSAR-2, InSAR, Gorkha Earthquake, Nepal
Index Terms
1209 Tectonic Deformation
1240 Satellite geodesy: results
1241 Satellite geodesy: technical issues

©2015 American Geophysical Union. All rights reserved.
1. Introduction
The Mw 7.8 Gorkha, Nepal earthquake and Mw 7.3 aftershock struck in a region with less
than optimal seismic and geodetic coverage [e.g. Ader et al., 2012]. The moment tensor
solution based on far-field seismic stations combined with the tectonics of the region suggests
thrust faulting on a shallow dipping fault (11˚) having a strike of 295˚ [USGS, 2015]. Initial
finite fault models based on methods of Ji et al., [2002] show 2-4 m of slip at ~15 km depth
over a zone extending ~150 km ESE of the hypocenter. The earthquake caused intense
ground shaking throughout much of Nepal and parts of India and China, resulting in over
8,000 deaths. Ground shaking in the Kathmandu basin was particularly intense as a result of
its proximity to the main rupture area and the effects of basin amplification and directivity,
causing many historical structures to collapse that had survived previous earthquakes [USGS,
2015].
Several Interferometric Synthetic Aperture Radar (InSAR) satellites were operational at
the time of the earthquake and continue to collect measurements of line-of-sight (LOS)
displacement. The Sentinel-1a satellite, operated by the European Space Agency (ESA)
collected C-band InSAR observations, which were processed and made available online by
the ESA Scientific Exploitation of Operational Missions project (SEOM - http://insarap.org).
The ALOS-2 satellite, operated by the Japan Aerospace Exploration Agency (JAXA),
collected L-band InSAR data, low-resolution images of which are presented at the JAXA site
(http://www.eorc.jaxa.jp/ALOS/en/) as well as the Geospatial Information Authority of Japan
(GSI – http://www.gsi.go.jp/cais/topic150429-index-e.html).
This study is focused on the extraction of LOS displacement from the ALOS-2/PALSAR-
2 instrument, with the objective to provide these observations to the modeling community, as
the raw data are not freely available and this is the first publication of ALOS-2 ScanSAR
InSAR. Rapid assessment of the acquired data is also important for scheduling of future
acquisitions. ALOS-2 operates in several modes, including traditional strip-mode SAR with a
swath width of 70km, and ScanSAR (Wide Swath), with a width of 350km. Although wide
swath is data is desirable, most interferograms are constructed from strip-mode data and
ScanSAR-to-ScanSAR interferometry is rare because it requires accurate burst alignment
between the reference and repeat orbit. This implies precise on-board timing to better than 70
milliseconds. This was first achieved with the ALOS-1 satellite in cases where the bursts
were aligned by chance [Tong et al., 2008]. ALOS-2 is the first L-band satellite to offer
burst-aligned ScanSAR interferometry as a standard operating mode, but during the
©2015 American Geophysical Union. All rights reserved.
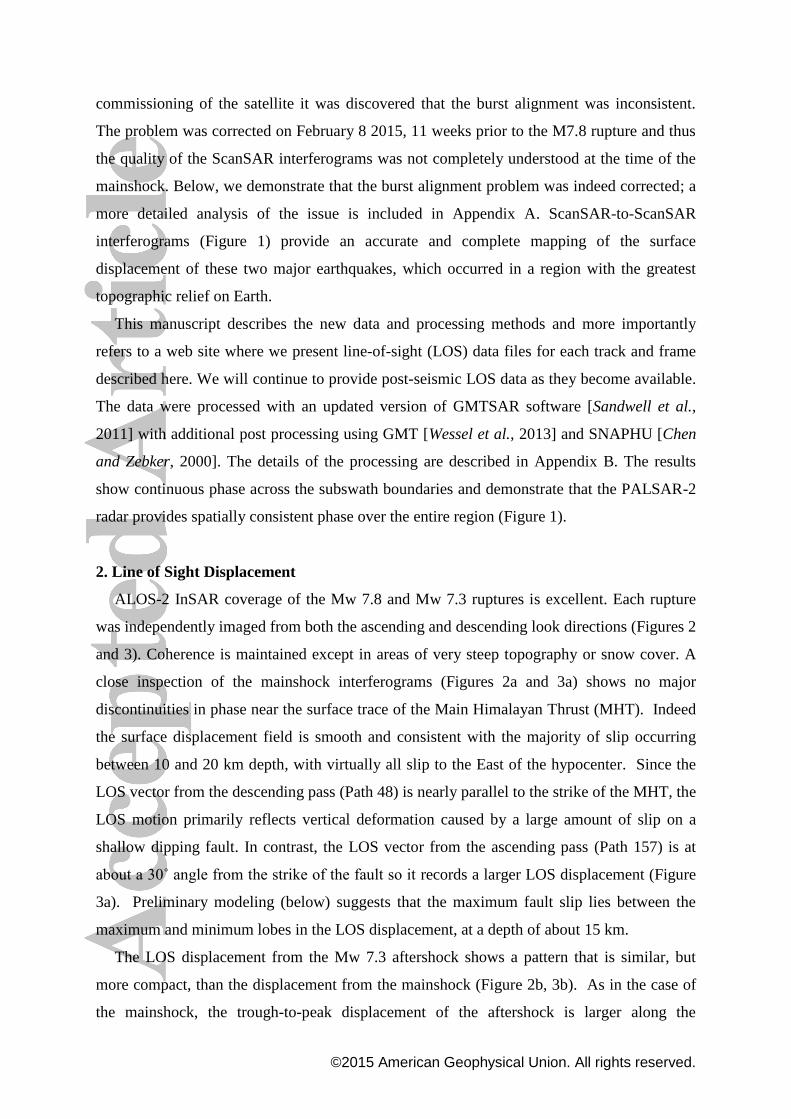
commissioning of the satellite it was discovered that the burst alignment was inconsistent.
The problem was corrected on February 8 2015, 11 weeks prior to the M7.8 rupture and thus
the quality of the ScanSAR interferograms was not completely understood at the time of the
mainshock. Below, we demonstrate that the burst alignment problem was indeed corrected; a
more detailed analysis of the issue is included in Appendix A. ScanSAR-to-ScanSAR
interferograms (Figure 1) provide an accurate and complete mapping of the surface
displacement of these two major earthquakes, which occurred in a region with the greatest
topographic relief on Earth.
This manuscript describes the new data and processing methods and more importantly
refers to a web site where we present line-of-sight (LOS) data files for each track and frame
described here. We will continue to provide post-seismic LOS data as they become available.
The data were processed with an updated version of GMTSAR software [Sandwell et al.,
2011] with additional post processing using GMT [Wessel et al., 2013] and SNAPHU [Chen
and Zebker, 2000]. The details of the processing are described in Appendix B. The results
show continuous phase across the subswath boundaries and demonstrate that the PALSAR-2
radar provides spatially consistent phase over the entire region (Figure 1).
2. Line of Sight Displacement
ALOS-2 InSAR coverage of the Mw 7.8 and Mw 7.3 ruptures is excellent. Each rupture
was independently imaged from both the ascending and descending look directions (Figures 2
and 3). Coherence is maintained except in areas of very steep topography or snow cover. A
close inspection of the mainshock interferograms (Figures 2a and 3a) shows no major
discontinuities in phase near the surface trace of the Main Himalayan Thrust (MHT). Indeed
the surface displacement field is smooth and consistent with the majority of slip occurring
between 10 and 20 km depth, with virtually all slip to the East of the hypocenter. Since the
LOS vector from the descending pass (Path 48) is nearly parallel to the strike of the MHT, the
LOS motion primarily reflects vertical deformation caused by a large amount of slip on a
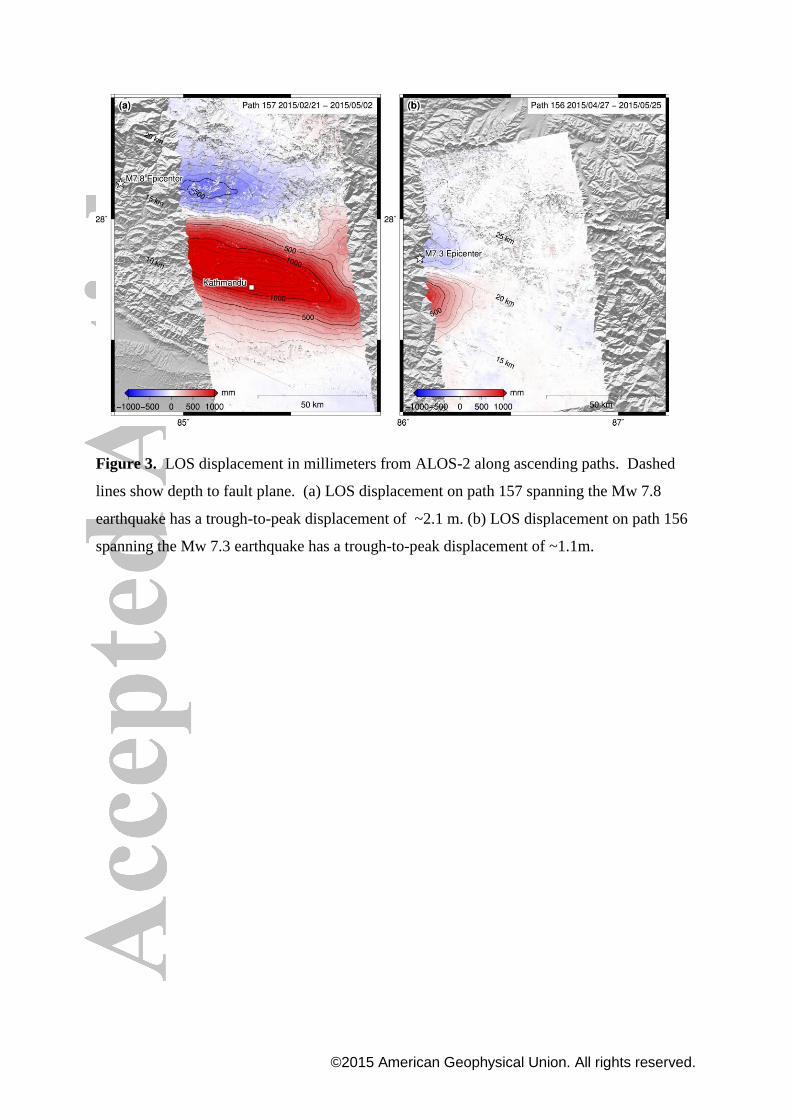
shallow dipping fault. In contrast, the LOS vector from the ascending pass (Path 157) is at
about a 30˚ angle from the strike of the fault so it records a larger LOS displacement (Figure
3a). Preliminary modeling (below) suggests that the maximum fault slip lies between the
maximum and minimum lobes in the LOS displacement, at a depth of about 15 km.
The LOS displacement from the Mw 7.3 aftershock shows a pattern that is similar, but
more compact, than the displacement from the mainshock (Figure 2b, 3b). As in the case of
the mainshock, the trough-to-peak displacement of the aftershock is larger along the

©2015 American Geophysical Union. All rights reserved.
ascending track than it is along the descending track, in agreement with a slip vector oriented
along dip. The low-to-high gradient in the displacement of the aftershock is larger than the
mainshock suggesting there is a slip concentration at depth. Most of the displacement from
the Mw 7.3 aftershock occurs near the eastern end of the displacement from the main rupture
suggesting it may have been triggered by a Coulomb stress concentration from the mainshock.
To better understand how the surface displacements relate to slip at depth, we inverted the
LOS displacements for descending and ascending tracks for both mainshock and aftershock.
We used the 1D layered Earth structure and inversion method of Melgar & Bock [2015]. We
assume a planar fault derived from the nodal plane of a W-phase moment tensor inversion
[USGS, 2015] with a strike of 295° and a dip of 11°. For the mainshock we discretized the
dislocation surface into 10x10 km subfaults, and for the aftershock into 5x5 km subfaults.
The LOS measurements are down-sampled using the QuadTree technique [Lohman & Simons,
2005]; the distribution of down-sampled data and residuals are shown in Figure S1. The
inverse problem is ill-posed, so the inversion is regularized by applying minimum norm
smoothing. The regularization parameter, which limits the level of roughness, is objectively
selected by using Akaike’s Bayesian Information Criterion [Yabuki & Matsu’Ura, 1992]. We
assume uniform uncertainties for the InSAR data, which therefore do not affect the
regularization. We consider the effect of inverting for slip using only the descending or
ascending tracks individually in Figure S2, and the effect of choosing a higher or lower
penalty on the model norm (greater or lesser smoothing) in Figure S3.
The results are shown in Figure 2d. Mainshock slip extends over an area ~170 km long
and between the 5 to 15 km depth contours, with peak slip of 5.5 – 6.5 m over a large asperity
just north of Kathmandu. Peak slip depends somewhat on the choice of regularization; see
Figure S3. Peak slip for the aftershock may be slightly larger but is less well constrained (5.5
– 10 m, depending on the regularization) and is concentrated on a very compact asperity
about 30 km in length. The aftershock slip area shows little to no overlap with the mainshock
slip. Notably, there is an area of little or no slip at 15-20 km depth between the two events.
This gap appears to be well constrained by the data irrespective of the value of the
regularization parameter (Figure S3).
3. Discussion and Conclusions
The displacement field for the interferogram and derived slip inversions spanning both the
mainshock and aftershock show an interesting pattern. While the aftershock extended the
rupture area of the mainshock toward the east, it did not completely fill the “gap” formed by

©2015 American Geophysical Union. All rights reserved.
the NE trending tongue in high slip. Thus, a large (20 km) area remains where the fault has
little or no co-seismic slip (Figure 2d). By scaling the area of the displacement field from the
Mw 7.3 rupture to the area of the un-ruptured zone, we estimate this un-slipped fault patch
has the potential to generate a Mw 6.9 event. Furthermore, the tongue of surface
displacement maps to a smaller asperity in the mainshock slip pattern at 20-25 km depth. If
this represents the down dip edge of the seismogenic zone, then there is potential for further
slip down dip of the patches broken thus far. It will be important to monitor this slip gap over
the coming years, a task that will be aided by the recently-installed continuous GPS site
GUMB [John Galetzka, personal communication, 2015]. If ALOS-2 continues operating in
the ScanSAR mode along path 048 with a 14 to 42-day repeat, it will be possible to acquire a
complete space-time map of this and other regions surrounding the rupture zone.
The ScanSAR InSAR capabilities of ALOS-2 prove to be a capable tool for monitoring
large continental earthquakes such as the Nepal sequence. The Himalayan region has the
largest relief on the Earth, is densely vegetated, and has snow-capped peaks. The L-band
radar enables adequate InSAR correlation in the vegetated areas, while tight baseline control
of the spacecraft to better than 120 m in these examples minimizes the unwanted phase due to
errors in the extreme topography. Finally, the onboard navigation is now accurate enough to
provide better than 70% overlap of the ScanSAR bursts between reference and repeat images.
This results in single interferograms 350 km wide that are able to completely image the
deformation resulting from these major events. This wide swath also enables a short 14-day
repeat interval that was able to collect images between the Mw 7.8 and Mw 7.3 events. Slip
models based on the deformation spanning the Mw 7.8 event can be used to estimate the
Coulomb stress that may have triggered the Mw 7.3 event. The slip gap observed between the
two ruptures (Figure 2d) can now be monitored for co-seismic slip or aseismic creep. Finally,
the large vertical displacement caused by this thrust event will also induce significant
viscoelastic deformation over the next years to decades that we hope will be accurately
imaged and modeled.
Appendix A. Burst Alignment
ALOS-2 is the first L-band SAR with routine InSAR acquisitions in the ScanSAR mode
[Kankaku et al., 2009]. The interferometric wide mode (WD1) has 5 subswaths to achieve an
overall ground swath width of 350 km, with characteristics provided in Table S1. The wide
swath makes it possible to completely image an area every 14 days instead of the 42-day
repeat interval that is needed for complete imaging in swath mode. There are two basic

©2015 American Geophysical Union. All rights reserved.
requirements for achieving accurate displacement maps from normal strip-mode InSAR. First
the along-track Doppler spectra of the reference and repeat images should have more than
about 50% overlap. Second, the perpendicular baseline distance between the reference and
repeat acquisitions should be smaller than about 20% of the critical baseline. ALOS-2 is well
within these limits so one can construct high quality strip-mode interferograms from all the
acquisitions. However, construction of high quality ScanSAR to ScanSAR interferograms
also requires that the bursts have more than 50% overlap on the ground. Poor quality
interferograms can be achieved when the burst overlap is as small as 20%.
To achieve this burst overlap the radar system must be triggered with an along-track
accuracy better than ~500m, which corresponds to a timing accuracy better than 70
milliseconds [Tong et al., 2010]. The autonomous navigation system aboard ALOS-2 was
designed to achieve horizontal baseline better than 500 m and along-track accuracy of 10 m
[Kankaku et al., 2009]. During the commissioning phase of the mission, accurate baseline
control was demonstrated with most perpendicular baselines less than 200 m. However the
initial interferograms usually had no burst overlap. JAXA implemented an adjustment to the
onboard navigation system in early February 2015 and adequate burst overlap has been
maintained since then. The first pass after the February 8 fix and prior to the Nepal
earthquakes was P048 on February 22. Subsequent pairs have burst overlap better than 70%,
as listed in Table A1.
We performed a systematic analysis of the burst overlap between acquisitions from before
and after February 8, 2015 for ten different locations worldwide, the results of which are
listed in Table S2. We found an approximately 365-day sinusoidal oscillation in the burst
overlap (Figure A1). The amplitude of the oscillation is greater than the 2100-pixel burst
spacing, so the values are wrapped onto the range (-1050, 1050). We fit a model of the form:
B D( ) = mod Asin 2p D-Do( ) /Téë ùû+1050,2100{ }-1050 (A1)
where B is the burst offset at day D, in days relative to date D0. The best-fitting parameters
are amplitude A = 3635 pixels, period T = 365 days, and zero phase date D0 = December 20,
2014.
Equation A1 can be used to predict interferometric pairs that are likely to have better than
20% burst overlap. In Figure A1, the dark grey box centered at 0 burst offset shows the dates
of acquisitions with a 95% chance of more than 20% burst overlap with acquisitions after

©2015 American Geophysical Union. All rights reserved.
February 8. The corresponding date ranges are July 22 – July 31, November 8 – November
17, December 16 – December 23, and January 20 – January 29. The lighter grey box centered
at a burst offset of -900 shows an example of acquisitions that will correlate with each other
but not with acquisitions after February 8.
Appendix B. InSAR processing and Phase Unwrapping
The ALOS-2 PALSAR-2 data were processed using an updated version of the GMTSAR
software [Sandwell et al., 2011] and the phase was unwrapped using SNAPHU software
[Chen & Zebker, 2000]. Interferograms used are given in Table A1. In all cases we started
with the Single Look Complex (SLC, L1.1) products with HH polarization, in CEOS format
as delivered from the AUIG User Interface Gateway (https://auig2.jaxa.jp/ips/home). For the
ScanSAR processing we began with the full aperture product. The ScanSAR interferograms
were low-pass filtered with a 0.5 gain at 500 m wavelength while a 200-m low-pass filter
was applied to the strip-mode data. Our strategy is to process each frame (along-track) or
subswath (across-track) independently in radar coordinates and assemble them in geographic
coordinates. We have found that phase will be nearly continuous across subswath boundaries
if an identical orbit and geometric model is used for all the components [Tong et al., 2010].
The small phase mismatch at the boundaries depends on the method used to align the
reference and repeat images. The geometric and orbital errors should only introduce an offset
and stretch in both the range and azimuth coordinates, which corresponds to estimating 4
parameters when fitting the sub-window cross correlation peaks. Because of ionospheric
distortions in azimuth, we also solve for an additional parameter that corresponds to the
stretch in azimuth as a function of azimuth, resulting in a 5-parameter model. If 6 or more
parameters are used, the coherence of the interferogram will increase slightly but the phase
will have a significant mismatch on frame or subswath boundaries.
We unwrapped each frame or subswath independently in radar coordinates using
SNAPHU software [Chen & Zebker, 2000] with an improved algorithm for masking of
decorrelated areas [Agram and Zebker, 2009]. We then geocoded the results and combined
the sub-swaths into a single interferogram by adding a multiple of 2 p to achieve matching
phase at the boundaries. For several of the subswaths there was also a phase discontinuity
across the snow-covered Himalaya Mountains. Again a multiple of 2 p was added to the
area of discontinuous phase to bring it into accordance with the multi-subswath interferogram.
After correcting the integer unwrapping errors, the frames or subswaths were combined using
the GMT function grdblend, which provides seamless blending in overlap areas. The final
©2015 American Geophysical Union. All rights reserved.
unwrapped phase was converted to line-of-sight (LOS) displacement using the appropriate
center wavelength. Several of the interferograms have large phase ramps related to orbit error
and/or ionospheric delays. We remove a ramp from the composite LOS data by estimating a
gradient far from the earthquake displacement; LOS data with no trend removed are also
provided. Data are median filtered onto 1km posting and are provided in an ASCII file
containing: longitude, latitude, elevation, look vector, LOS (mm) and uncertainty. In
addition, the GMT-format NetCDF grid files of geolocated LOS displacements and satellite
look vectors at 90-m posting are also available. All results are available at
http://topex.ucsd.edu/nepal and will be archived at UNAVCO.
Acknowledgements
We thank JAXA for rapid acquisition and distribution of the ScanSAR data especially
along track 048. The data were provided under PI investigations 1148: Geometric and
Interferometric CALVAL of ALOS-2 PALSAR and 1413: Unraveling present-day
deformation around the eastern and western syntaxes of the Himalayan range. The
development of the GMTSAR software and the ALOS-2 pre-processor was supported by
ConocoPhillips and the National Science Foundation through the Geoinformatics program
(EAR-1347204) and the GeoEarthScope program (EAR-1147435).
References
Ader, T., J. P. Avouac, J. Liu-Zeng, H. Lyon-Caen, L. Bollinger, J. Galetzka, J. Genrich, M.
Thomas, K. Chanard, S. N. Sapkota, S. Rajaure, P. Shrestha, L. Ding, M. Flouzat (2012),
Convergence rate across the Nepal Himalaya and interseismic coupling on the Main
Himalayan Thrust: Implications for seismic hazard. J. Geophys. Res. Solid Earth 117,
doi:10.1029/2011jb009071.
Agram, P. S. and H. A. Zebker (2009), Sparse Two-Dimensional Phase Unwrapping Using
Regular-Grid Methods, IEEE Trans. Geosci. Rem. Sensing Vol. 6, No. 2, pp. 327-331,
doi:10.1109/LGRS.2009.2012445.
Bertran-Ortiz, A., and H.A. Zebker (2007), ScanSAR-to-Stripmap Mode Interferometry
Processing Using ENVISAT/ASAR Data, IEEE Trans. Geosci. Rem. Sensing, Vol. 45, No.
11, pp. 3468-3480, doi:10.1109/TGRS.2007.895970.
Chen C. W. and H. A. Zebker (2000), Network approaches to two-dimensional phase
unwrapping: intractability and two new algorithms, J. Opt. Soc. Am. A, vol. 17, pp. 401-414
doi:10.1364/JOSAA.17.000401.

©2015 American Geophysical Union. All rights reserved.
Kankaku, Y., Osawa, Y., Suzuki, S., & Watanabe, T. (2009, August). The overview of the L-
band SAR onboard ALOS-2. In Proceedings of Progress in Electromagnetics Research
Symposium, Moscow.
Lohman, R. B., & Simons, M. (2005). Some thoughts on the use of InSAR data to constrain
models of surface deformation: Noise structure and data downsampling. Geochemistry,
Geophysics, Geosystems, 6(1).
Melgar, D., and Y. Bock (2015), Kinematic earthquake source inversion and tsunami runup
prediction with regional geophysical data, J. Geophys. Res. Solid Earth, 120,
doi:10.1002/2014JB011832.
Sandwell, D. T., R. Mellors, X. Tong, M. Wei, and P. Wessel (2011), Open radar
interferometry software for mapping surface deformation, Eos Trans. AGU, 92(28), 234,
doi:10.1029/2011EO280002.
Tong, X., D. T. Sandwell, and Y. Fialko (2010), Coseismic slip model of the 2008 Wenchuan
earthquake derived from joint inversion of interferometric synthetic aperture radar, GPS, and
field data, J. Geophys. Res., 115, B04314, doi:10.1029/2009JB006625.
USGS event page, http://earthquake.usgs.gov/earthquakes/eventpage/us20002926.
Wessel, P., W. H. F. Smith, R. Scharroo, J. F. Luis, and F. Wobbe (2013), Generic Mapping
Tools: Improved version released, EOS Trans. AGU, 94, 409-410,
doi:10.1002/2013EO450001.
Yabuki, T., & Matsu'Ura, M. (1992). Geodetic data inversion using a Bayesian information
criterion for spatial distribution of fault slip. Geophysical Journal International, 109(2), 363-
375.

©2015 American Geophysical Union. All rights reserved.
Table A1. Interferograms used in this study. ScanSAR burst overlap is computed according
to the formula 100*(nburst – az. shift)/nburst, using nburst for subswath 3 from Table S1.
©2015 American Geophysical Union. All rights reserved.
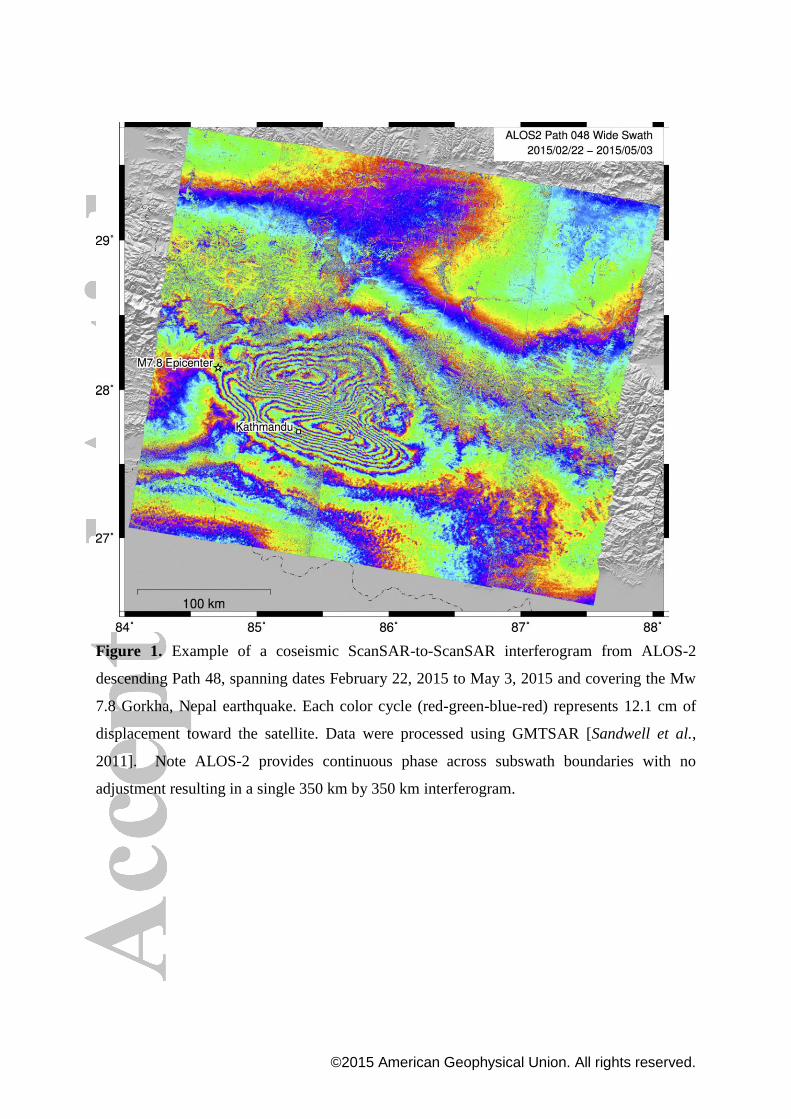
Figure 1. Example of a coseismic ScanSAR-to-ScanSAR interferogram from ALOS-2
descending Path 48, spanning dates February 22, 2015 to May 3, 2015 and covering the Mw
7.8 Gorkha, Nepal earthquake. Each color cycle (red-green-blue-red) represents 12.1 cm of
displacement toward the satellite. Data were processed using GMTSAR [Sandwell et al.,
2011]. Note ALOS-2 provides continuous phase across subswath boundaries with no
adjustment resulting in a single 350 km by 350 km interferogram.

©2015 American Geophysical Union. All rights reserved.
Figure 2. LOS displacement in millimeters for sub-area covered by ALOS-2 along
descending Path 48. Dashed lines show depth to fault plane, from the USGS W-phase
moment tensor solution nodal plane [USGS, 2015]. (a) LOS displacement for a time interval
spanning the Mw 7.8 earthquake. This represents mainly vertical motion with a trough-to-
peak amplitude of ~1.6m. (b) LOS displacement for a time interval spanning the Mw 7.3
aftershock. The trough-to-peak amplitude is ~1.1 m. (c) LOS displacement for a time
interval spanning both events. The overall extent of the combined rupture is ~170 km. (d)
Slip inversion of the LOS data from Paths 48 and 157 based on the modeling approach of
Melgar & Bock [2015]. Maximum slip is ~ 6 m. The shallow (<10km) slip feature is
preferred by data from Path 157 but does not appear to be required by the Path 48 data (see
Figures S2 and S3). There is a notable gap in slip centered approximately 20 km to the west
of the Mw 7.3 aftershock hypocenter.
©2015 American Geophysical Union. All rights reserved.
Figure 3. LOS displacement in millimeters from ALOS-2 along ascending paths. Dashed
lines show depth to fault plane. (a) LOS displacement on path 157 spanning the Mw 7.8
earthquake has a trough-to-peak displacement of ~2.1 m. (b) LOS displacement on path 156
spanning the Mw 7.3 earthquake has a trough-to-peak displacement of ~1.1m.

©2015 American Geophysical Union. All rights reserved.
Figure A1. Burst offset versus time for subswath 1. Other subswaths follow the same pattern
with a different y-axis scale. Circles are the observed burst offset between pre- and post-
February 8, 2015 acquisitions at ten different locations worldwide (values are provided in
Table S2). The modeled curve was computed using equation A1. Dark grey box shows
acquisitions that have a 95% chance of at least 20% burst overlap with post-February 8 data.
Lighter grey box shows some example acquisitions that have at least 20% burst overlap only
with each other.