Embed Size (px)
Citation preview

Equity and Fairness within Ad Valorem Real Property Taxes
Frances Plimmer, W.J. McCluskey,
and Owen Connellan © 2000
Lincoln Institute of Land Policy Working Paper
The findings and conclusions of this paper are not subject to detailed review and
do not necessarily reflect the official views and policies of the Lincoln Institute of Land Policy.
Please do not photocopy without permission of the authors. Contact the authors directly with all questions or requests for permission.
Lincoln Institute Product Code: WP00FP1


Lincoln Institute of Land Policy
The Lincoln Institute of Land Policy is a nonprofit and tax-exempt school organized in 1974, with a specialized mission to study and teach about land policy, including land economics and land taxation. The Lincoln Institute is supported by the Lincoln Foundation, which was established in 1947 by John C. Lincoln, a Cleveland industrialist. Mr. Lincoln drew inspiration from the ideas of Henry George, the nineteenth-century American political economist and social philosopher. The Institute aims to integrate the theory and practice of land policy and land-related taxation, and to promote better understanding of the fundamental forces that influence these policies, as well as the general processes of land use and development. The Institute’s programs focus on three topical areas: taxation of land and buildings; land markets; and land as common property. The Lincoln Institute assembles experts with different points of view to study, reflect, exchange insights, and work toward consensus in creating a more complete and systematic understanding of land use and tax policy. The Lincoln Institute itself has no institutional point of view. The Lincoln Institute offers challenging opportunities for interdisciplinary teaching, research and publishing. The research program produces new knowledge and assembles existing information in new forms. The education program incorporates research findings into courses, conference and workshops for both scholars and practitioners. The publications program produces books, policy focus reports, Land Lines bimonthly newsletter, and this series of working papers. The Lincoln Institute of Land Policy admits students of any race, color, national or ethnic origin, or gender to all rights, privileges, programs and activities generally accorded or made available to students at the school. It does not discriminate on the basis of race, color, national or ethnic origin, or gender in administration of its educational policies, admission policies, scholarship and fellowship programs, or other school-administered programs. The Lincoln Institute is an equal opportunity employer. For copies of the Lincoln Institute’s current catalog, Request for Proposals, or other information, please contact: Lincoln Institute of Land Policy Information Services 113 Brattle Street Cambridge, MA 02138-3400 Phone 617/661-3016 800/LAND-USE (526-3873) Fax 617/661-7235 800/LAND-944 (526-9444) Email [email protected] Web www.lincolninst.edu

Lincoln Institute of Land Policy Working Papers
Lincoln Institute working papers make available the results of new and continuing research. Although papers may be in early draft stages and subject to revision, they should strive for final publication in reputable scholarly or professional journals. To be accepted as a Lincoln Institute working paper, a manuscript must explicitly address one or more items on the Lincoln Institute’s current agenda, which currently focuses on three program areas: taxation of land and buildings; land markets; and land as common property. In addition, working papers must: �� build on rather than repeat earlier work—through new data and analysis, an original interpretation
of previously available data, or an innovative theory; �� demonstrate awareness of the most relevant previously published sources and, for empirical
papers, summarize the data and methods used; �� be coherently argued, logically organized and clearly written.
Submissions to the working paper series are subjected to informal review to ensure that each paper meets these basic standards without requiring that it be a completely finished product. We give the highest priority to manuscripts that explain in a straightforward manner the significance of their conclusions for public policy. However, the Lincoln Institute of Land Policy is a nonpartisan organization and strives to present a variety of viewpoints on the issues it addresses. The opinions expressed in working papers are therefore those of the author(s) and do not necessarily reflect the views of the Lincoln Institute. For more information about the Institute’s research program, please contact one of the following program area directors: Joan Youngman, Director Taxation of Land and Buildings Rosalind Greenstein, Director Land Markets Armando Carbonell, Director Land as Common Property Martim Smolka, Director Latin American Program Lincoln Institute of Land Policy 113 Brattle Street Cambridge, MA 02138-3400 Phone 617/661-3016 Fax 617/661-7235 Email [email protected] Web www.lincolninst.edu

Abstract
This working paper reports on inequitable and unfair aspects in the extant design and operation of domestic property taxation systems in the United Kingdom. It examines previous attempts in property tax applications to remedy such fiscal defects and reviews the future prospects of further amelioration. As a pilot venture, the results are evaluated based on an empirical investigation of two case studies: the first in Northern Ireland where a long-established rating system based on annual values is still operational; and the second in England and Wales where the more recent Council Tax is now in place, based on a banding system of capital values. Examples of inequities and unfairness are drawn from both studies, clearly pointing to the need for more frequent and regular revaluations and to recommendations for methodological and operational changes. These findings lead to the research team’s proposals for ongoing research, with an extension of its investigations into a far-reaching examination of the concepts and practice of “equity” and “fairness” within a wider geographical and cultural sphere and a more comprehensive context.
About the Authors
Frances Plimmer, Dip Est Man, MPhil, PhD, FRICS, IRRV, is a Reader in Applied Valuation at the University of Glamorgan, Wales. Dr. Plimmer is a Chartered Surveyor whose work experience began with the Valuation Office in Cardiff dealing with rating valuation cases. Since joining the University, she has researched extensively on rating principles and practice, in particular the fairness of UK real property taxes and has supervised post-graduate research on real property taxation system in other countries. She also researches into professional education and training for appraisers, and, in particular, the mutual recognition of professional qualifications as a device to achieve the free movement of professionals across national barriers. Dr. Plimmer has published and spoken extensively in the UK and internationally on both these areas of her research, each of which has demonstrated the importance of understanding professional and national culture in predicting and analyzing responses to externally-imposed regulations.
Contact Information: Frances Plimmer Centre for Research in the Built Environment University of Glamorgan Pontypridd, Rhondda Cynon Taff Wales, CF37 1DL United Kingdom. phone: +44 (0) 1443 482125 fax: +44 (0) 1443 482169 e-mail: [email protected] web site: www.glam.ac.uk
William McCluskey PGD Prop Inv, BSc (Hons), PhD, FRICS, ASVA, joined the University of Ulster in 1986 and is presently a Senior Lecturer in Real Estate and Valuation. He was appointed a Visiting Professor of Real Estate at the University of Lodz, Poland in 1996. Prior to joining the University he worked with the Valuation Office in London and then the Valuation Office in Northern Ireland where his main responsibilities involved the valuation of all types of property for property tax purposes. His main professional and academic interests are in the fields of real estate valuation and more specifically landed property tax systems, policy, computer assisted mass appraisal modeling and the application of geographic information systems. Within this context he has been involved in a number of international projects advising on ad valorem tax issues including Jamaica, Bermuda and South Africa. He has published widely within the research fields including journal papers, authored books, edited books and been a plenary speaker at a number of international conferences. Recently his
research has been to investigate the potential application of artificial intelligence and machine learning techniques within the mass appraisal environment.
Contact Information William McCluskey School of the Built Environment University of Ulster at Jordanstown Newtownabbey, County Antrim, Northern Ireland, BT37 0QB United Kingdom. phone: +44 (0) 1232 366567 fax: +44 (0) 1232 366826 e-mail: [email protected] web site: www.ulst.ac.uk
Owen Connellan BSc, FRICS, Dip Rating, is a Chartered Surveyor and Valuer who has specialized in rating and property taxation matters. He was engaged extensively in private professional practice and with commercial property organizations before subsequently pursuing an academic career. Currently he is a Research Fellow of Kingston University in England, where he was formerly Head of School of Surveying. He has written and lectured widely on real property matters in Britain and abroad. His present research interests include valuation methodology and the application of information technology to asset appraisal and property taxation.
Contact Information: School of Surveying Kingston University Knights Park Kingston-upon-Thames, Surrey England, KT1 2QJ, United Kingdom. phone: + 44 (0) 208 547 7070 fax: +44 (0) 208 547 7087 e-mail: [email protected]

Contents
Part 1: Executive Summary 1 Introduction 1 Northern Ireland Findings 1 England and Wales Findings 3 General Findings 4
Part 2: Introduction 6 Introduction 6 The Concepts of Equity and Fairness 7 Development and Recording of Previous Research 7 Current Lincoln Research Project 8
Part 3: Case Study 1—Northern Ireland 10 Rationale of a Residential Property Tax 10 Basis of Valuation 13 Data Sources 15 Effective Tax Rate Analysis 18 Redistributive Analysis 21 Conclusions of Case Study 31
Part IV: Case Study 2—The Council Tax in England and Wales 32 Sample Data 36 Analysis of Transactions within Bands 37 Rebanding 42 Liability 43 Tax Relatives 45 Ad Valorem Revaluation 46 Conclusions to Case Study 47
Park V: Policy Issues 49 Introduction 49 Administration 49 Banding 50 Revaluations 52 Automated Valuation Approaches 54 Property Tax Bases 55 Local Accountability 55 Final Observations 56 Further Research 57
References and Bibliography 59
Appendix: Background to the Council Tax 65 Local Taxation Reform in England and Wales 1990 65 Community Change 65 Failure of Community Change 66 Council Tax—Preparation 67 Council Tax—Levy 68 Council Tax—Liability 68 Council Tax—Personal Element 69 Council Tax—Property Element 69
List of Figures
Figure 1: Expenditure Functions of District Councils for 1996-97 11 Figure 2: District Council Sources of Income 1996-97 12 Figure 3: The Relative Distribution by House Types 18 Figure 4: Liability Changes for All 23 Figure 5: Liability Shifts—for All Properties 24 Figure 6: Liability Shifts—Detached Property 24 Figure 7: Liability Shifts—Semi-Detached Property 25 Figure 8: Liability Shifts—Terrace Properties 25 Figure 9: Average Ratios by Value Bands—All Properties 26 Figure 10: Distribution of All Properties by Value Bands 26 Figure 11: Average Ratio by Value Bands—Detached Properties 27 Figure 12: Distribution by Detached Properties by Value Bands 27 Figure 13: Average Ratio of Value Bands—Semi-Detached Properties 28 Figure 14: Distribution of Semi-Detached Properties by Value Bands 29 Figure 15: Average Ratio by Value Bands—Terrace Properties 29 Figure 16: Distribution of Terrace Properties by Value Bands 30 Figure 17: Local Authority Income (England) Budget Estimate 1999/2000 32 Figure 18: Local Authority Spending (England) 1999/2000 33 Figure 19: House Price Movements (England) 1995-1999 35 Figure 20: Transactions Below, within or Exceeding the Band Value Range 38 Figure 21: The Average Deficiency of Excess by Which the Sale Price Fails 40
to Fall within the Allocated Band Figure 22: Distribution of Rebanded Properties 42
List of Tables
Table 1: Value of Property in Terms of Net Annual Value (£m) 14 Table 2: Housing Stock by Tenure 15 Table 3: Sale Transactions for the Period 1993-1997 16 Table 4: Data Attributes 16 Table 5: Total Number of Properties by District Council Area 17 Table 6: Effective Tax Rates 19 Table 7: Sample Property Data 21 Table 8: Average Ratios by Value Band 30 Table 9: Value Bands in England and Scotland 34 Table 10: Value Bands in Wales 34 Table 11: Relativity of Council Tax Liability 35 Table 12: Comparison between the Spread of Properties in Each Band in 36
the Sample and in the Municipality Valuation List Table 13: The Analysis of the Sample for Each Band 38 Table 14: The Average Deficiency or Excess (shown as a percentage) by 40
which the Sale Price Fails to Fall within the Allocated Band. Table 15: Average Deficiencies and Excesses Together with Ranges of 41
Deficiencies and Excesses Table 16: Number of Transactions within 5% of the Bandings 41 Table 17: Variation in Numbers of Properties in Bands Following 42
a Revaluation (Rebanding) Table 18: Differences in Liability Followed by a Rebanding 44 Table 19: Revenues Raised in Bands Following a Rebanding 45 Table 20: Council Tax Liability Following an Ad Valorem Revaluation 46
1
Equity and Fairness within Ad Valorem Real Property Taxes
Part 1: Executive Summary
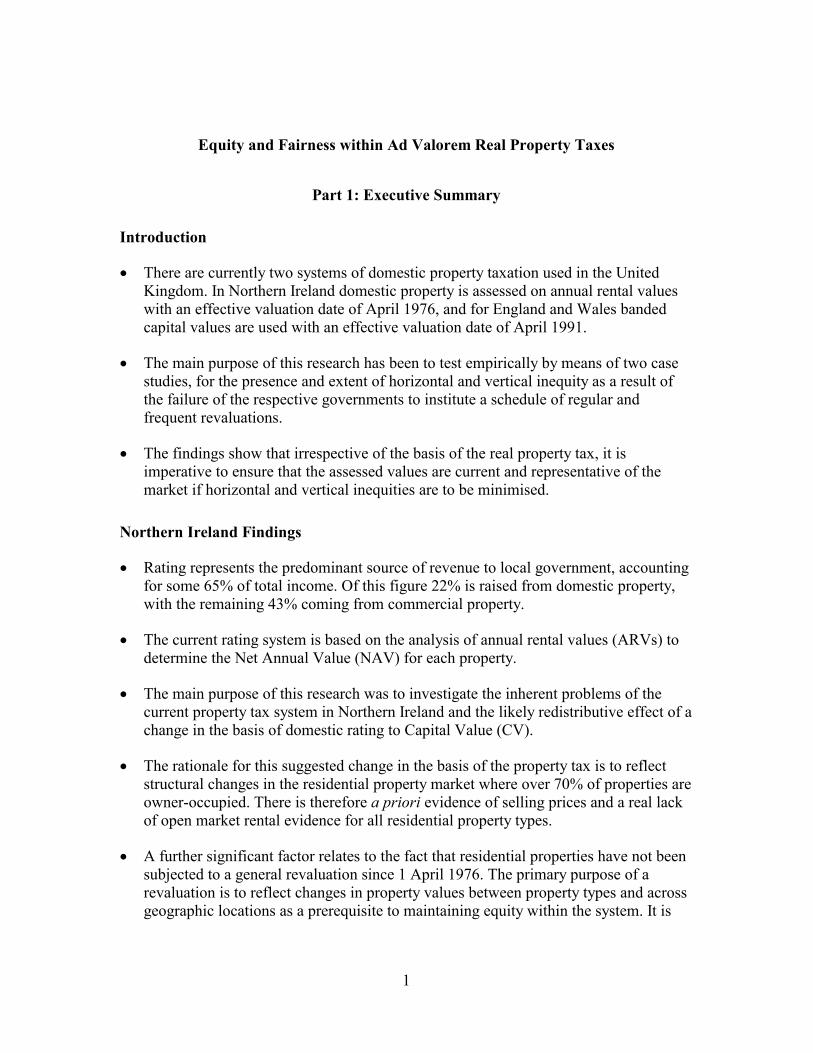
Introduction
�� There are currently two systems of domestic property taxation used in the United Kingdom. In Northern Ireland domestic property is assessed on annual rental values with an effective valuation date of April 1976, and for England and Wales banded capital values are used with an effective valuation date of April 1991.
�� The main purpose of this research has been to test empirically by means of two case studies, for the presence and extent of horizontal and vertical inequity as a result of the failure of the respective governments to institute a schedule of regular and frequent revaluations.
�� The findings show that irrespective of the basis of the real property tax, it is imperative to ensure that the assessed values are current and representative of the market if horizontal and vertical inequities are to be minimised.
Northern Ireland Findings
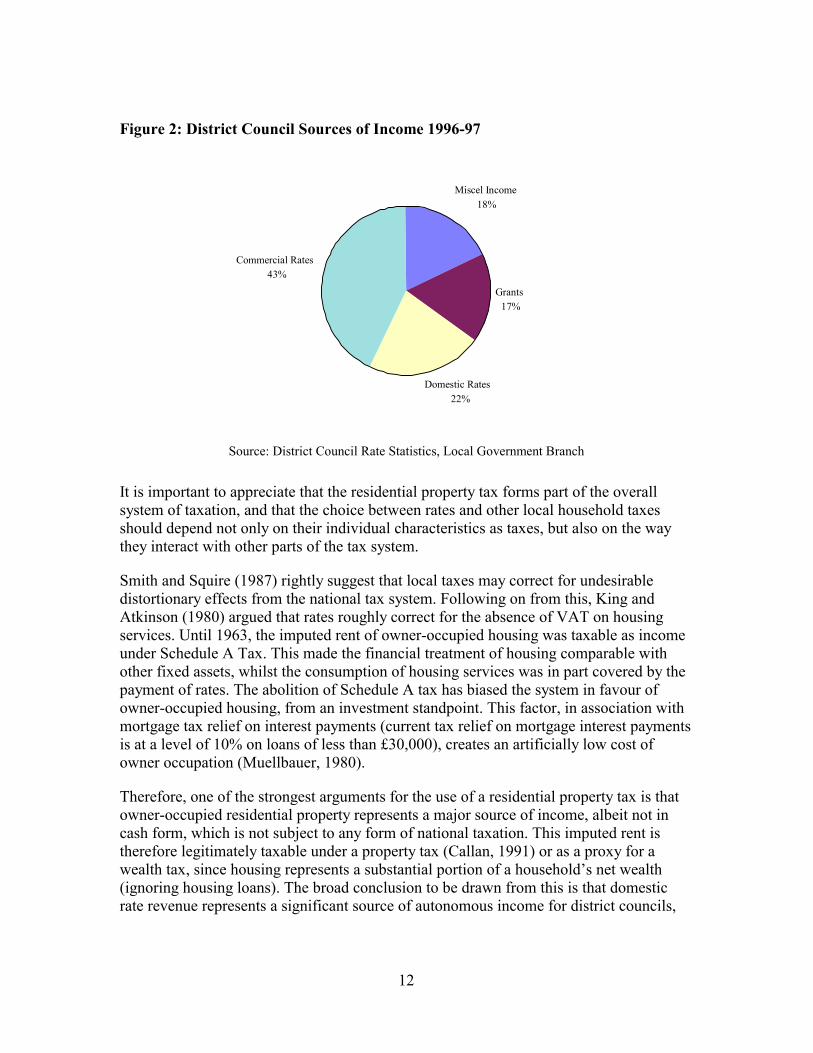
�� Rating represents the predominant source of revenue to local government, accounting for some 65% of total income. Of this figure 22% is raised from domestic property, with the remaining 43% coming from commercial property.
�� The current rating system is based on the analysis of annual rental values (ARVs) to determine the Net Annual Value (NAV) for each property.
�� The main purpose of this research was to investigate the inherent problems of the current property tax system in Northern Ireland and the likely redistributive effect of a change in the basis of domestic rating to Capital Value (CV).
�� The rationale for this suggested change in the basis of the property tax is to reflect structural changes in the residential property market where over 70% of properties are owner-occupied. There is therefore a priori evidence of selling prices and a real lack of open market rental evidence for all residential property types.
�� A further significant factor relates to the fact that residential properties have not been subjected to a general revaluation since 1 April 1976. The primary purpose of a revaluation is to reflect changes in property values between property types and across geographic locations as a prerequisite to maintaining equity within the system. It is
2
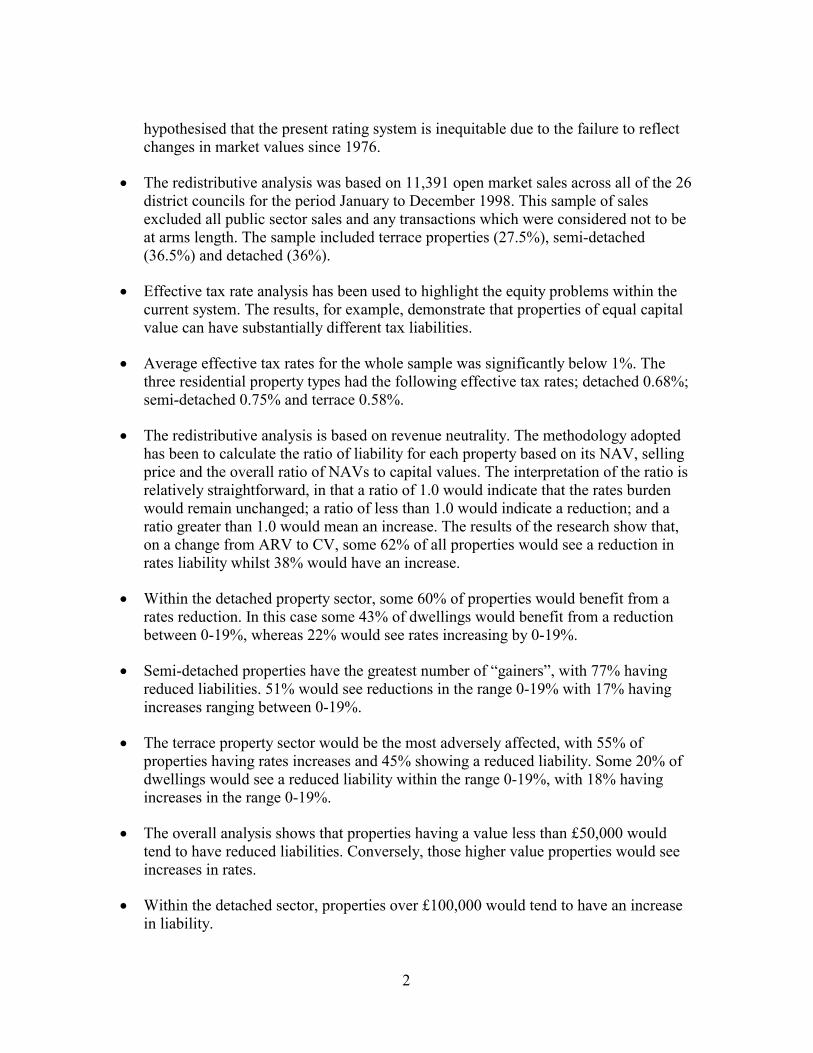
hypothesised that the present rating system is inequitable due to the failure to reflect changes in market values since 1976.
�� The redistributive analysis was based on 11,391 open market sales across all of the 26 district councils for the period January to December 1998. This sample of sales excluded all public sector sales and any transactions which were considered not to be at arms length. The sample included terrace properties (27.5%), semi-detached (36.5%) and detached (36%).
�� Effective tax rate analysis has been used to highlight the equity problems within the current system. The results, for example, demonstrate that properties of equal capital value can have substantially different tax liabilities.
�� Average effective tax rates for the whole sample was significantly below 1%. The three residential property types had the following effective tax rates; detached 0.68%; semi-detached 0.75% and terrace 0.58%.
�� The redistributive analysis is based on revenue neutrality. The methodology adopted has been to calculate the ratio of liability for each property based on its NAV, selling price and the overall ratio of NAVs to capital values. The interpretation of the ratio is relatively straightforward, in that a ratio of 1.0 would indicate that the rates burden would remain unchanged; a ratio of less than 1.0 would indicate a reduction; and a ratio greater than 1.0 would mean an increase. The results of the research show that, on a change from ARV to CV, some 62% of all properties would see a reduction in rates liability whilst 38% would have an increase.
�� Within the detached property sector, some 60% of properties would benefit from a rates reduction. In this case some 43% of dwellings would benefit from a reduction between 0-19%, whereas 22% would see rates increasing by 0-19%.
�� Semi-detached properties have the greatest number of “gainers”, with 77% having reduced liabilities. 51% would see reductions in the range 0-19% with 17% having increases ranging between 0-19%.
�� The terrace property sector would be the most adversely affected, with 55% of properties having rates increases and 45% showing a reduced liability. Some 20% of dwellings would see a reduced liability within the range 0-19%, with 18% having increases in the range 0-19%.
�� The overall analysis shows that properties having a value less than £50,000 would tend to have reduced liabilities. Conversely, those higher value properties would see increases in rates.
�� Within the detached sector, properties over £100,000 would tend to have an increase in liability.
3
�� For semi-detached dwellings the threshold figure is £90,000.
�� For the terrace sector, properties having a value in excess of £40,000 would tend to have increased rate liabilities.
England and Wales Findings
�� Local councils in England spent around £50 billion in 1998/99 on major services like education, police, fire and social services. Around £12 billion (24%) of council income which is used to finance these services comes from the residential property tax i.e. the Council Tax.
�� The current basis for taxing residential property in England and Wales is the Council Tax which is a banded system of capital values, introduced with effect from 1993, and with an assessed value date of 1991.
�� There is no precedent for the grouping of properties into different tax bands for the purpose of a property tax. It could be assumed, particularly in a capital value-based system, that an exact valuation can be applied and defended in relation to other neighbouring values.
�� The purpose of this research was to investigate whether the existing bands accurately reflect the current level of capital values and the extent to which a rebanding of properties would improve horizontal and vertical equity for taxpayers.
�� The existing system of banding is accompanied by an imposed relationship between the tax paid within the bands. Thus, those within the top band (H) pay twice the level of tax of those in the so-called average band (D) and those in the lowest band (A) pay two-third the level of tax paid by those in the so-called average band. The research also investigated the level to which this control affects the regressivity of the tax.
�� The UK government has anticipated that properties will shift within bands but considers that any shift between bands does not yet warrant a rebanding of properties. The research demonstrates that this is not the case.
�� The analysis was based on a sample of 720 open market transactions in south east Wales between 1997 and 1998. The distribution of properties within the bands reflects the overall distribution within bands for that Valuation List; however, results for the top band (H) are not based on a sufficient quantity of data to be reliable.
�� The analysis shows that, overall, only 55% of the total sample of properties are correctly banded. Of those incorrectly banded, 25% should appear in a lower band and 20% in a higher band. Greatest errors occur at the lower value bands.
4
�� A rebanding of the properties was undertaken (thus replicating a revaluation) and this showed an increase in the number of properties in the lowest band (A) of 586%. Other bands which recorded an increase in number were Bands E (9%), F (43%) and G (29%). Decreases (of 27%, 4%, and 19%) in number occurred in property bands B, C, and D (respectively).
�� Assuming revenue neutrality, the research also showed that, within the rebanded sample, 164 properties in the lowest three bands would see a reduction in tax liability (£50.48 for Band A, £48.81 for Band B and £50.70 for Band C), with a corresponding increase in tax liability within bands C, D and E for 106 properties (£45.63 for 39 properties in Band C, £49.45 for 36 properties in Band D and £94.23 for properties in Band E).
�� The relativity of tax liability (that those in Band A pay two-thirds of the tax paid by the so-called average band (D) and that those in the highest band (H) pay twice that of the tax paid by the so-called average band) does not reflect the value bands (in Wales Band A does not exceed £30,000; Band D ranges from £51,001 to £66,000 and Band H exceeds £240,001), thus ensuring that a greater proportion of the tax is paid by those occupying the lower value properties.
�� Banding, as currently implemented in England and Wales, fails to optimise horizontal and vertical equity. A revaluation is required to ensure that existing bands more accurately distribute tax liability based on current property values and that the imposition of relativities on liability between different bands should be abolished if the regressive nature of the tax is to be moderated.
General Findings
�� Given the fixed nature of real property, it provides a stable base upon which to impose a local tax. Layfield (1976) commented ‘rating has become deeply embedded in the taxation and local government systems and up to now no substitute has been found acceptable’. It is important to realise that, as the tax is a function of assessed values, it is imperative in the interests of equity that the assessed values are accurate, current and capable of being understood by the taxpayer. It is also vital that relative assessed values reflect accurately relative tax liabilities.
�� The open market value of property changes over time to reflect supply and demand characteristics, buyer perspectives, general economic activity and inter-regional differences. There is therefore a need to ensure that assessed values are kept in line with market price movements otherwise disparities and inequities result.
�� Within the Northern Ireland context, because the last general domestic revaluation was in 1976 (based on 1973/74 values), there is a growing need to undertake a revaluation based on open market capital values.

5
�� Within England and Wales, the complexity and volatility of the UK housing market has meant that the 1991 assessed values for Council Tax bandings no longer reflect the current capital values of properties. In addition, the regulated weighting of liability between the bands results in a highly regressive tax system.
�� Banding as a system of dealing with a volatile and complex property market has its advantages (particularly important for the UK government in 1991, when the failure of the Community Charge or Poll Tax caused an urgent need for a more socially-acceptable tax base), but sophisticated technologies exist to deal with such a property market and banding has no major advantage over a true ad valorem tax base.
�� The only way that both property systems will be assured a successful future will be if taxpayers see a clear, distinct and continuous relationship between the open market value of their house and its assessed value or tax band. Such a relationship will only be established if the value of properties are regularly and frequently reassessed.
�� The general conclusions of our research indicate the urgent need to have regular and frequent revaluations at, say, three yearly intervals in order to optimise equity and fairness in the UK.
6
Part II: Introduction
Introduction
Dissatisfaction with the system of local government finance in the United Kingdom is no new phenomenon; complaints about rating are as old as rating itself. There has been a steady stream of official studies for rates reform since the end of the Second World War (Smith and Squire, 1987). Much of the dissatisfaction with the present system no doubt arises because rates are the only tax at the disposal of local authorities and are highly perceptible and conspicuous.
Following the failure of the Community Charge (or Poll Tax) introduced into mainland United Kingdom (UK) in 1990, domestic rating in Great Britain (England, Scotland and Wales) has been replaced by the Council Tax with effect from 1993. In contrast, Northern Ireland uniquely retains a rental value-based domestic rating system. This report contains case studies of the taxation of domestic property from the Province of Northern Ireland and from the Principality of Wales. It is the broad purpose of this paper to investigate some of the failures of the systems of domestic property taxation in terms of fairness and equity and to make recommendations as to the future of local domestic property taxation for both the Province and the Principality.
The advantages and disadvantages of the annual rental value system of domestic rating have been fully expounded in numerous academic papers, government reports and green papers. The disadvantages have tended to include the arbitrary nature and lack of uniformity in valuations (O’Brien, 1989); the inelasticity of the tax base in raising revenue (Page, 1980; Layfield, 1976); the disincentive on property owners to improve their property (Trotman-Dickenson, 1996); the fact that rating assessments on similar property vary between different rating areas and even spatially within areas (Department of the Environment, 1981; Ridge and Smith, 1991); that there is a tenuous link between benefits received and the rates payable (Crawford and Dawson, 1982); rates have traditionally been viewed as regressive and having little correlation to ability to pay (McDowell, 1990); and the incomprehensibility of the basis of the tax on hypothetical rental values for tax payers (IRRV, 1997).
Equally, the advantages have been fully elaborated upon as including, certainty and predictability of yield (Layfield, 1976; Elder, 1993); difficulties of avoidance and evasion (IRRV, 1997); the openness and transparency of the system which facilitates a flexibility of operation in terms of appeals, granting of reliefs and exemptions (Layfield, 1976); the general efficiency of the administration system (Sandford, 1992); the fact that the ad valorem nature of the tax enables the community to recoup some element of the values it creates (Trotman-Dickenson, 1996).
A number of alternatives have been suggested as possible replacements including local income tax, local sales tax, site value rating and a poll tax (DOE, 1986; Ridge and Smith,
7
1991). The latter option has been tried with a singular lack of success, being introduced, first in Scotland in 1989 and in England and Wales in 1990. Following civil unrest, it was subsequently replaced, in April 1993, with a hybrid personal/property tax, i.e. the Council Tax. The UK variant of the poll tax, the Community Charge, is an illustration of a tax totally at odds with the culture of the taxpaying public on which it was imposed (Plimmer, 1994).
The Concepts of Equity and Fairness
Woolery (1989) suggests that the terms “equity” and “fairness” are often used synonymously in tax literature. However, from the perspective of property taxation, a distinction should be made. In general terms, “fairness” should be related to the legislation upon which the tax is promulgated. In other words, the legislation should specify whether different types of property are to be taxed at different percentages of market value or whether different groups of ‘taxpayer’ are to be given some form of preferential treatment, such as reliefs, rebates or exemptions.
On the other hand, “equity” or more specifically “assessment equity”, is a measure of how well the property tax system is administered in terms of assessed values. “Equity” can be considered from two different viewpoints. Firstly, there is horizontal equity, which prescribes that two identical properties having the same value should have the same assessed value, and secondly, vertical equity which states that, for example, a property having a value of twice that of another property should have twice the assessed value. Vertical inequities can either be regressive, when high-valued properties are under-assessed relative to low-valued properties, or progressive, when the opposite holds true (De Cesare and Ruddock, 1998). Both these constructs have an important bearing on the actual distribution of the tax liability (ignoring any tax reliefs, etc.) (IAAO, 1997).
In the case of any taxation system, it is the acceptance of the process and its underlying basis by those who are taxed which is vital to ensure any kind of success, including the achievement of an acceptable level of revenue compared to the cost involved in administering the tax. It is, therefore, with evidence of the failure of horizontal and vertical equity and perceptions of unfairness that taxation systems will fall into disrepute, with far reaching consequences. It is, for example, widely accepted (e.g. Farrington, 1992) that the failure of the Community Charge (or Poll Tax) was one of the major causes of the downfall of Margaret Thatcher as the British Prime Minister in 1991.
Development and Recording of Previous Research
Previous research, as developed and recorded in various papers and books, has been presented and published in academic and professional press as follows:
Connellan, O. P., and Plimmer, F., (1996) Is market value a desirable basis for property taxation? Paper presented at the ERES Conference, Northern Ireland.
8
Connellan, O. P., McCluskey, W. J., Vickers, A., (1998) The Surveyor’s Role in Land Value Taxation Paper presented of the XXI International Congress (FIG’98) at Brighton, England. Lichfield, N., and Connellan, O. P., (1997) Land Value and Community Betterment Taxation in Britain: History, Achievements and Prospects. Cambridge, Mass. Lincoln Institute of Land Policy. McCluskey, W. J. (1991) Comparative Property Tax Systems. Gower Publishing Company. England, UK. McCluskey, W. J., Plimmer, F., Connellan O. P. (1997) Landed Property Tax—the best of all possible worlds? Paper presented at The Royal Institution of Chartered Surveyors’ Cutting Edge Conference, Dublin. http://www.rics.org.uk/research/conferences/cutpdf/plimmer.PDF McCluskey, W. J., Plimmer, F., Connellan O. P. (1998) Taxation of Landed Property Tax—Fairness to the Taxpayer, presented at the Joint Conference of the European Real Estate Society and the American Real Estate and Urban Economics Association, Maastricht, The Netherlands.
McCluskey, W. J,, Plimmer, F., Connellan O. P. (1998) Ad Valorem Property Tax: Issues of fairness and equity. Assessment Journal Vol 5, No 3 pp.47-55.
Plimmer, F. (1998) Rating Law and Valuation. Addison Wesley Longman. Essex, England.
Plimmer, F., McCluskey, W. J., Connellan O. P. (1998) Inequities in Property Taxation. Paper presented at the International Conference of the International Association of Assessing Officers, Orlando, Florida. USA.
Plimmer, F., McCluskey, W. J., Connellan O. P. (1999) Reform of UK Local Government Domestic Taxes, Property Management, MCB University Press. UK. Vol 17 No 4 pp.336-352.
Current Lincoln Research Project
This paper reports on the interim stage of a long-term project: thus, it lays the foundation for a more far-reaching examination of the issues of “equity” and “fairness” within a wider geographical sphere and a more comprehensive cultural and real property tax context. The research is investigating economic, efficient and effective ways of taxation via real property bases, while assuming adherence to classical precepts of taxation (Adam Smith) in the light of what is socially-acceptable to the taxpaying public in any regime.
9
Underlying this theme are the following objectives:
�� promoting understanding and transparency of the real property taxation system;
�� identifying inequities and possible solutions;
�� identifying taxpayers’ feelings of unfairness and possible remedies; and
�� encouraging taxpayer “acceptability” of real property taxes.
This research is the culmination of a series of research initiatives by the respective authors into various aspects of real property taxes which have focused on issues of “equity” and “fairness”. In addition to the current sponsorship by the Lincoln Institute, this work has been supported by grants from The Royal Institution of Chartered Surveyors and with backing from the Universities of Ulster, Glamorgan and Kingston.
On the 24 February 1999, the brief from the Lincoln Institute was confirmed as follows:
“This study will explore concepts of equity (horizontal and vertical) and fairness within ad valorem real property taxes. It will consider models to measure inequity such as effective and nominal tax rates; techniques to address equity such as regular revaluations, basis of value (i.e. market value), and effective tax rates; and case studies in Northern Ireland, England and/or Wales to demonstrate equity problems and highlight possible solutions.”
Accordingly, Part III of this report provides details of the first of two empirical case studies. The first case study is an investigation into the ad valorem Annual Rental Value taxation system of residential properties in Northern Ireland, which retains a valuation date of 1976. Part IV contains the second empirical case study which critically examines the banded Council Tax system introduced in England and Wales in 1993 based on sample data.
Part V of this report provides a commentary on the policy issues underlying the taxation systems in the UK, and reasoned conclusions and recommendations, as well as details of the proposed further development of this research.
10
Part III: Case Study 1—Northern Ireland
The hypothesis to be tested in this part of the research is that the current domestic rating system based on net annual values which is applied in the Province no longer meets the requirements of horizontal equity and fairness imperative within an ad valorem property tax system.
This part of the working paper has two principal objectives: firstly, to consider the rationale for the retention of a residential property tax as part of the system of local government finance in Northern Ireland and secondly, to measure the redistributive effect of a change in the basis of the tax from annual rental value to capital value. With regard to the latter objective, a two-stage analysis is undertaken, the first stage being to measure effective tax rates at the level of district councils for detached, semi-detached and terrace properties; the second stage being to analyse the impact of a shift in the basis from annual rental value to capital value for all district councils utilising discrete property values.
Rationale of a residential property tax
Until 1921, local government in Northern Ireland was on precisely the same footing, legal and administrative, as local government in the Republic of Ireland. With the enactment of the Government of Ireland Act 1920, responsibility for the control of local bodies in the six counties (Antrim, Armagh, Derry, Down, Fermanagh and Tyrone) passed to the Stormont government.
In the early 1970s the MacRory Review body reported on a radical system of local government reform, which came into force with the passing of the Local Government Act 1972, and remains to the present day. In essence, the reform provided for the delivery of major services on a province-wide basis, including housing, education, health, planning, roads, water and sewerage. The narrow range of services and functions remaining were to become the responsibility of newly-formed district councils.
The local government structure in Northern Ireland comprises 26 single tier district councils which have responsibility for the provision of essentially local services, including street cleansing, refuse collection, environmental health, building control, recreational facilities, parks and public space. In the financial year 1996/97 district councils spent approximately £287 million.
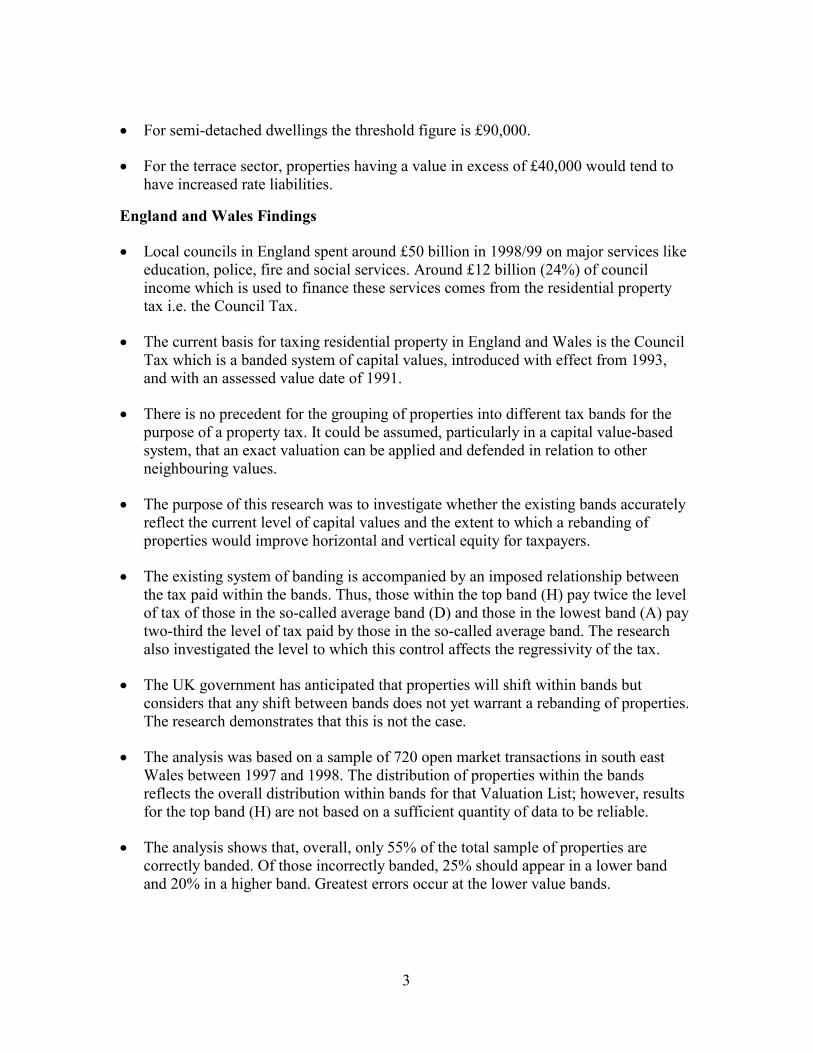
Figure 1 illustrates a breakdown of the total expenditure and highlights that approximately one half of revenue collected was spent on the provision and maintenance of leisure facilities and refuse collection.

11
Figure 1: Expenditure Functions of District Councils for 1996-97
Leisure26%
Community Services9%
Tourism3%
Refuse Collection26%
Environmental Health7%
Property6%
Miscel17%
Licensing6%
Source: District Council Rate Statistics, Local Government Branch
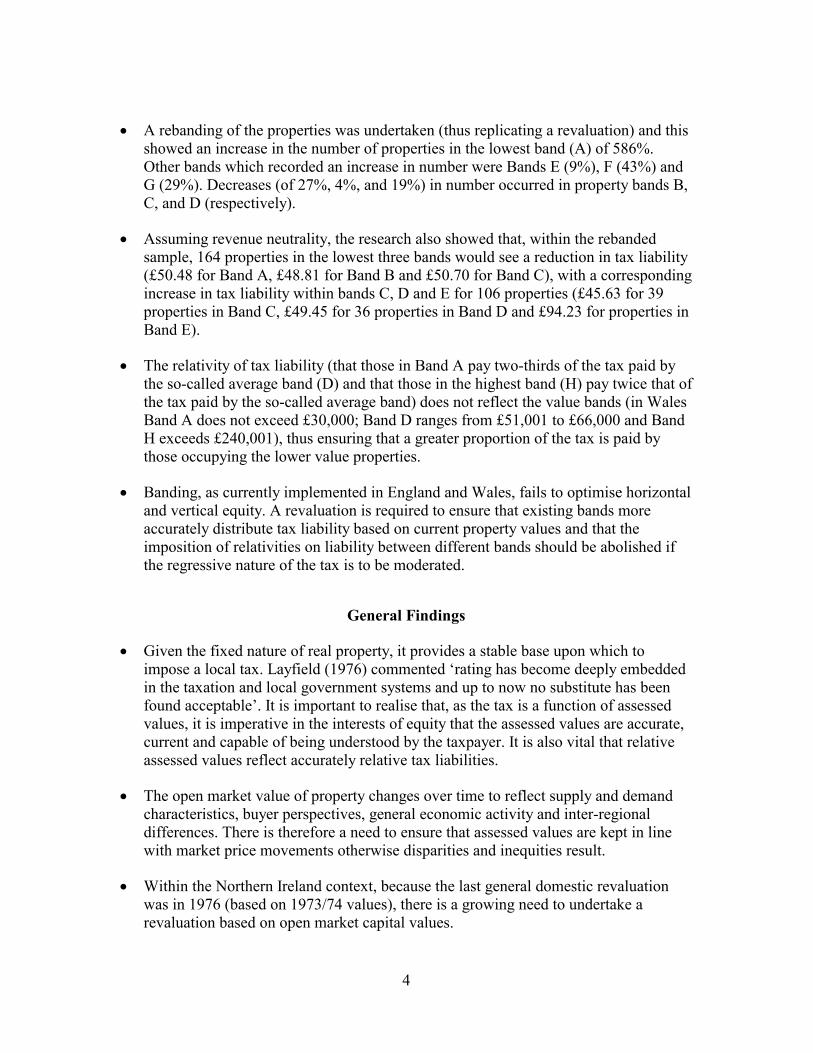
The sources available for the financing of these services are primarily from rates (both domestic and non-domestic), charges (for services) and equalisation grants from the centre. The actual rate burden for the province is determined by reference to the total rate-relevant expenditure, which includes the provision of centralised services funded by central government by means of general rate support which, for 1996/97 amounted to 80.71%. In reality, domestic and non-domestic rates are obliged to cover the remaining 19.29%. Figure 2 gives average percentage figures for revenue sources across all 26 district councils.
12
Figure 2: District Council Sources of Income 1996-97
Miscel Income18%
Grants17%
Domestic Rates22%
Commercial Rates43%
Source: District Council Rate Statistics, Local Government Branch
It is important to appreciate that the residential property tax forms part of the overall system of taxation, and that the choice between rates and other local household taxes should depend not only on their individual characteristics as taxes, but also on the way they interact with other parts of the tax system.
Smith and Squire (1987) rightly suggest that local taxes may correct for undesirable distortionary effects from the national tax system. Following on from this, King and Atkinson (1980) argued that rates roughly correct for the absence of VAT on housing services. Until 1963, the imputed rent of owner-occupied housing was taxable as income under Schedule A Tax. This made the financial treatment of housing comparable with other fixed assets, whilst the consumption of housing services was in part covered by the payment of rates. The abolition of Schedule A tax has biased the system in favour of owner-occupied housing, from an investment standpoint. This factor, in association with mortgage tax relief on interest payments (current tax relief on mortgage interest payments is at a level of 10% on loans of less than £30,000), creates an artificially low cost of owner occupation (Muellbauer, 1980).
Therefore, one of the strongest arguments for the use of a residential property tax is that owner-occupied residential property represents a major source of income, albeit not in cash form, which is not subject to any form of national taxation. This imputed rent is therefore legitimately taxable under a property tax (Callan, 1991) or as a proxy for a wealth tax, since housing represents a substantial portion of a household’s net wealth (ignoring housing loans). The broad conclusion to be drawn from this is that domestic rate revenue represents a significant source of autonomous income for district councils,
13
with no real alternative being capable of achieving the same level of revenue generation and overall acceptability (Layfield, 1976).
Basis of Valuation
Rates in Great Britain became an ad valorem property tax i.e. with no reference to income within the tax base, as a result of the Statute of Elizabeth passed in 1601, which is often regarded as the starting point of the modern rating system. In 1840, with the coming into force of the Poor Rate Exemption Act, the basis of rates was finally settled as being on the annual value of land and buildings.
In Ireland, the Valuation (Ireland) Act 1852 also firmly established the basis of valuation for buildings as annual values, referred to in the legislation as the net annual value (NAV). This legislation currently remains in force in the Republic, whereas for Northern Ireland some minor changes to the definition were contained in the Rates (Northern Ireland) Order 1972 and then consolidated in the 1977 Rates (Northern Ireland) Order.
Net annual value is currently defined as:
“…the rent for which, one year with another, the hereditament might, in its actual state, be reasonably expected to let from year to year, the probable average annual cost of repairs, insurance and other expenses (if any) necessary to maintain the hereditament in its actual state, and all rates, taxes or other public charges (if any), being paid by the tenant.” (Schedule 12 Part 1, The Rates (Northern Ireland) Order 1977).
Therefore the fundamental principle which was established back in the mid-nineteenth century was that each ratepayer should contribute towards the cost of local services in accordance with the rental value of their property.
A central feature of the Province’s ad valorem property tax relates to the lack of buoyancy in the system. The absence of buoyancy is not inherent within the system, but results from the administrative failure to implement procedures of regularly updating property values.
One of the most significant structural features of an ad valorem property tax is the cycle of reassessment, because valuation is at the heart of the operation of the tax. Rates do not have automatic expandability, unlike income tax revenue, which automatically increases without a change in the rates of tax. The only mechanisms which permit an increase in rate revenue is a change in the rate in the pound, ceteris paribus to maintain the local authorities’ real level of revenue and the implementation of regular and frequent revaluations of the tax base.
It should be remembered that the essential objective of the tax is to distribute the cost of local government services between occupiers of property pro rata on the assessed value of those properties. Any uncorrected disparities in assessed values will create unfairness.
14
Such disparities arise from two sources; firstly, assessment error which is the result of an incorrect valuation and which can be rectified through the appeal provisions and secondly, frequent changes in the underlying values of property which can only be reflected by a general revaluation.
The objective of a revaluation is the realignment of property tax values between properties and if correctly applied should minimise the horizontal inequity of the tax. The essence of the assessment process is essentially the achievement of uniformity. In the absence of a regular and frequent process of revaluations, distortions occur in terms of tax paid between similar property, between different property types and across geographical areas. The magnitude of these distortions in relation to under-payment and over-payment are a function of property price movements between revaluations.
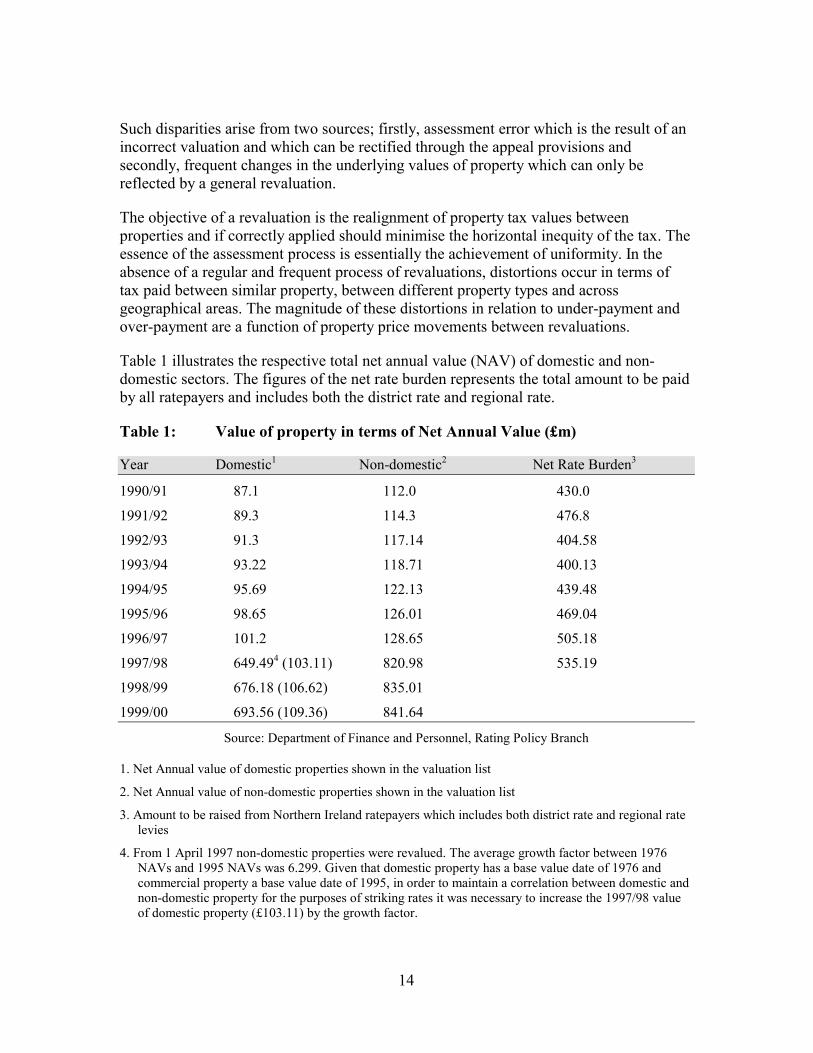
Table 1 illustrates the respective total net annual value (NAV) of domestic and non-domestic sectors. The figures of the net rate burden represents the total amount to be paid by all ratepayers and includes both the district rate and regional rate.
Table 1: Value of property in terms of Net Annual Value (£m)
Year Domestic1 Non-domestic2 Net Rate Burden3
1990/91 87.1 112.0 430.0
1991/92 89.3 114.3 476.8
1992/93 91.3 117.14 404.58
1993/94 93.22 118.71 400.13
1994/95 95.69 122.13 439.48
1995/96 98.65 126.01 469.04
1996/97 101.2 128.65 505.18
1997/98 649.494 (103.11) 820.98 535.19
1998/99 676.18 (106.62) 835.01
1999/00 693.56 (109.36) 841.64
Source: Department of Finance and Personnel, Rating Policy Branch
1. Net Annual value of domestic properties shown in the valuation list
2. Net Annual value of non-domestic properties shown in the valuation list
3. Amount to be raised from Northern Ireland ratepayers which includes both district rate and regional rate levies
4. From 1 April 1997 non-domestic properties were revalued. The average growth factor between 1976 NAVs and 1995 NAVs was 6.299. Given that domestic property has a base value date of 1976 and commercial property a base value date of 1995, in order to maintain a correlation between domestic and non-domestic property for the purposes of striking rates it was necessary to increase the 1997/98 value of domestic property (£103.11) by the growth factor.
15
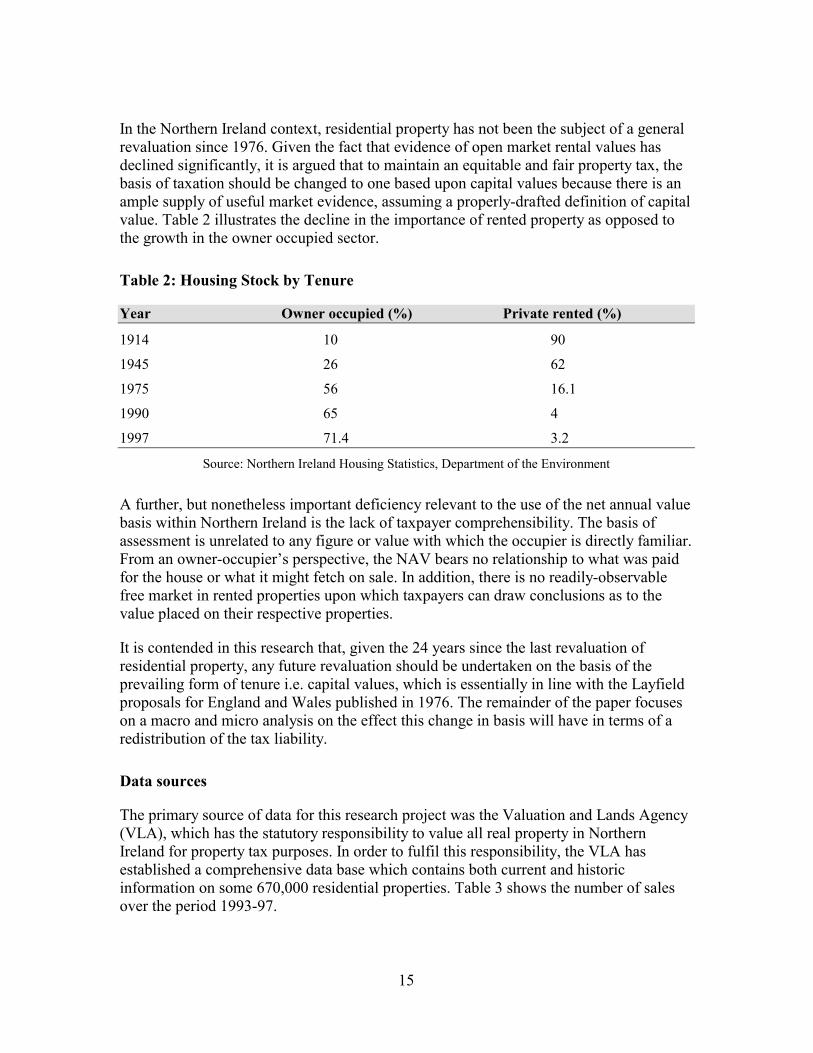
In the Northern Ireland context, residential property has not been the subject of a general revaluation since 1976. Given the fact that evidence of open market rental values has declined significantly, it is argued that to maintain an equitable and fair property tax, the basis of taxation should be changed to one based upon capital values because there is an ample supply of useful market evidence, assuming a properly-drafted definition of capital value. Table 2 illustrates the decline in the importance of rented property as opposed to the growth in the owner occupied sector.
Table 2: Housing Stock by Tenure
Year Owner occupied (%) Private rented (%)
1914 10 90
1945 26 62
1975 56 16.1
1990 65 4
1997 71.4 3.2
Source: Northern Ireland Housing Statistics, Department of the Environment
A further, but nonetheless important deficiency relevant to the use of the net annual value basis within Northern Ireland is the lack of taxpayer comprehensibility. The basis of assessment is unrelated to any figure or value with which the occupier is directly familiar. From an owner-occupier’s perspective, the NAV bears no relationship to what was paid for the house or what it might fetch on sale. In addition, there is no readily-observable free market in rented properties upon which taxpayers can draw conclusions as to the value placed on their respective properties.
It is contended in this research that, given the 24 years since the last revaluation of residential property, any future revaluation should be undertaken on the basis of the prevailing form of tenure i.e. capital values, which is essentially in line with the Layfield proposals for England and Wales published in 1976. The remainder of the paper focuses on a macro and micro analysis on the effect this change in basis will have in terms of a redistribution of the tax liability.
Data sources
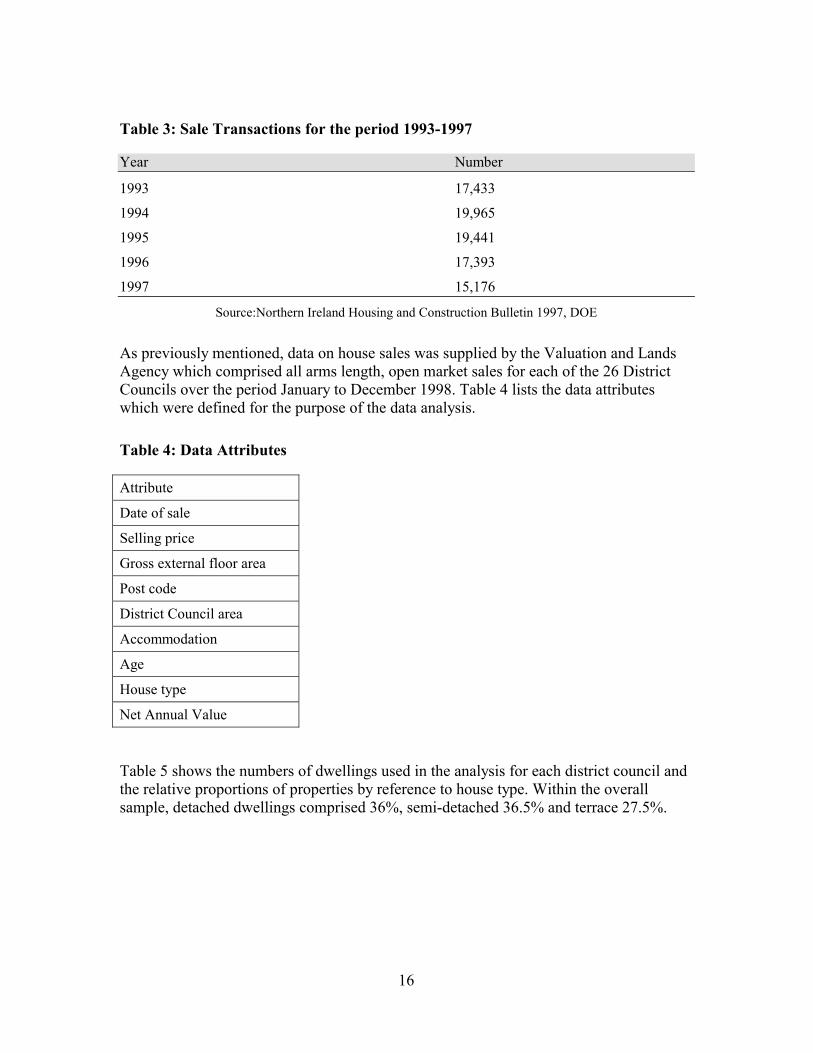
The primary source of data for this research project was the Valuation and Lands Agency (VLA), which has the statutory responsibility to value all real property in Northern Ireland for property tax purposes. In order to fulfil this responsibility, the VLA has established a comprehensive data base which contains both current and historic information on some 670,000 residential properties. Table 3 shows the number of sales over the period 1993-97.
16
Table 3: Sale Transactions for the period 1993-1997
Year Number
1993 17,433
1994 19,965
1995 19,441
1996 17,393
1997 15,176
Source:Northern Ireland Housing and Construction Bulletin 1997, DOE
As previously mentioned, data on house sales was supplied by the Valuation and Lands Agency which comprised all arms length, open market sales for each of the 26 District Councils over the period January to December 1998. Table 4 lists the data attributes which were defined for the purpose of the data analysis.
Table 4: Data Attributes
Attribute
Date of sale
Selling price
Gross external floor area
Post code
District Council area
Accommodation
Age
House type
Net Annual Value
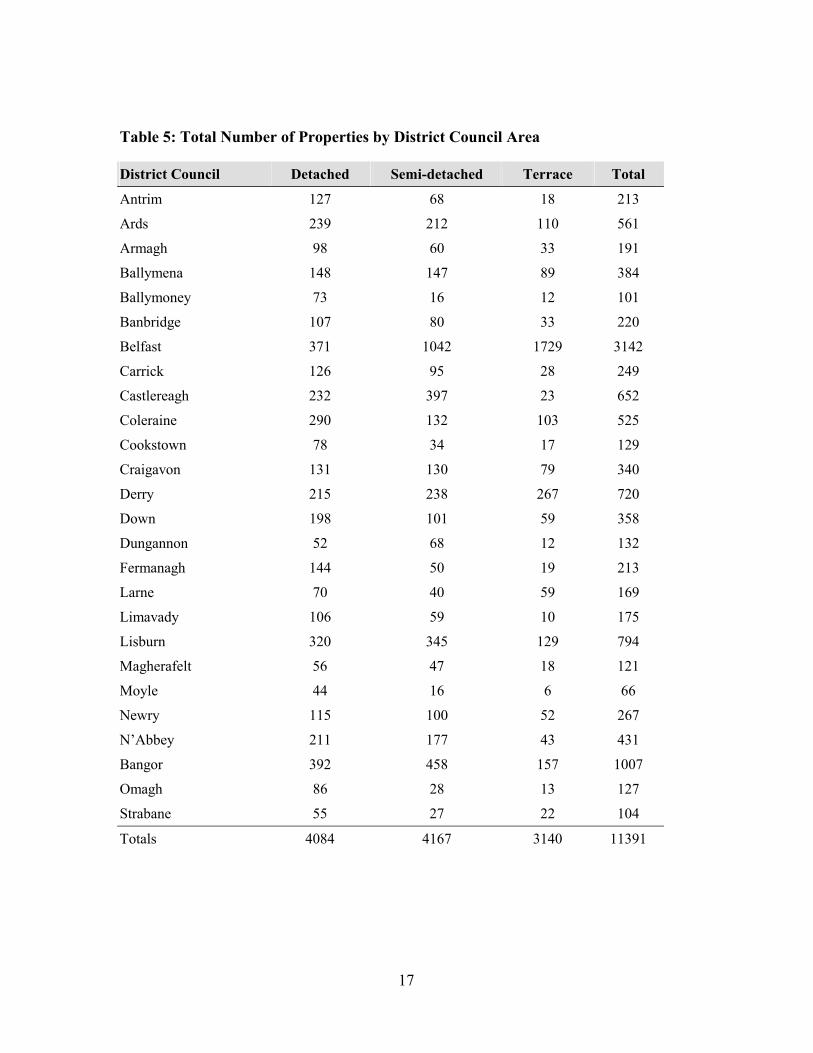
Table 5 shows the numbers of dwellings used in the analysis for each district council and the relative proportions of properties by reference to house type. Within the overall sample, detached dwellings comprised 36%, semi-detached 36.5% and terrace 27.5%.
17
Table 5: Total Number of Properties by District Council Area
District Council Detached Semi-detached Terrace Total
Antrim 127 68 18 213
Ards 239 212 110 561
Armagh 98 60 33 191
Ballymena 148 147 89 384
Ballymoney 73 16 12 101
Banbridge 107 80 33 220
Belfast 371 1042 1729 3142
Carrick 126 95 28 249
Castlereagh 232 397 23 652
Coleraine 290 132 103 525
Cookstown 78 34 17 129
Craigavon 131 130 79 340
Derry 215 238 267 720
Down 198 101 59 358
Dungannon 52 68 12 132
Fermanagh 144 50 19 213
Larne 70 40 59 169
Limavady 106 59 10 175
Lisburn 320 345 129 794
Magherafelt 56 47 18 121
Moyle 44 16 6 66
Newry 115 100 52 267
N’Abbey 211 177 43 431
Bangor 392 458 157 1007
Omagh 86 28 13 127
Strabane 55 27 22 104
Totals 4084 4167 3140 11391
18
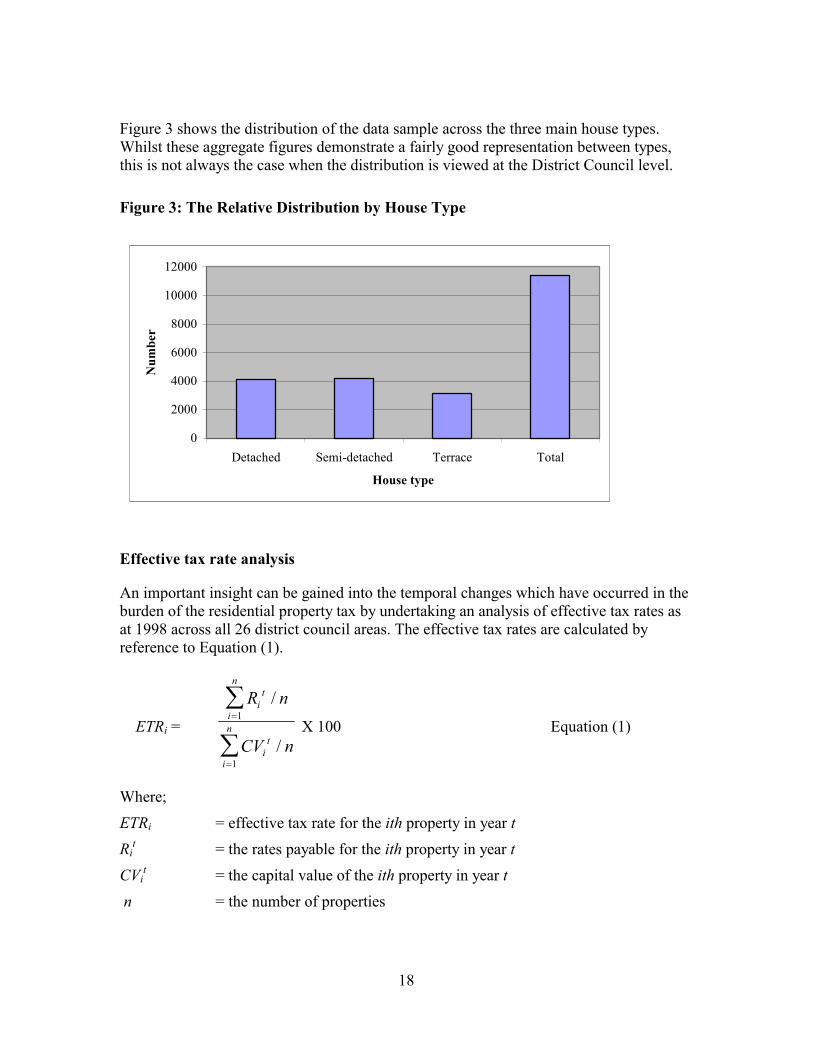
Figure 3 shows the distribution of the data sample across the three main house types. Whilst these aggregate figures demonstrate a fairly good representation between types, this is not always the case when the distribution is viewed at the District Council level.
Figure 3: The Relative Distribution by House Type
Effective tax rate analysis
An important insight can be gained into the temporal changes which have occurred in the burden of the residential property tax by undertaking an analysis of effective tax rates as at 1998 across all 26 district council areas. The effective tax rates are calculated by reference to Equation (1).
ETRi =
R n
CV n
it
i
n
it
i
n
/
/
�
�
�
�
1
1
X 100 Equation (1)
Where;
ETRi = effective tax rate for the ith property in year t Ri
t = the rates payable for the ith property in year t
CVit = the capital value of the ith property in year t
n = the number of properties
0
2000
4000
6000
8000
10000
12000
Detached Semi-detached Terrace Total
House type
Num
ber

19
In essence, the effective tax rate provides a measure of the relationship between actual tax liability and property value, in this case capital value. In addition, the ratio provides a useful indication of both assessment uniformity and equity within the tax system, as properties having the same value, within the same rating area should have the same tax liability.
To facilitate this research, actual selling prices have been used as proxies for assessed market values. On this point, Lizieri et al. (1989) have suggested that the use of selling prices was subject to a number of limitations, including the fact that the sale price might reflect factors that are specific to the property, the vendor and/or purchaser. Often personal preferences can cause purchasers to pay a price above that which could have been expected in the open market.
Whilst the use of selling price could be considered as possibly suspect in a number of marginal cases, in the majority of sales the price actually paid would be the market value of the subject property. Accordingly, for the purposes of this study, individual sale prices were scrutinised and any found to be ‘suspect’ were removed. The resultant effective tax rates for the three property sectors across district council areas are given in Table 6.
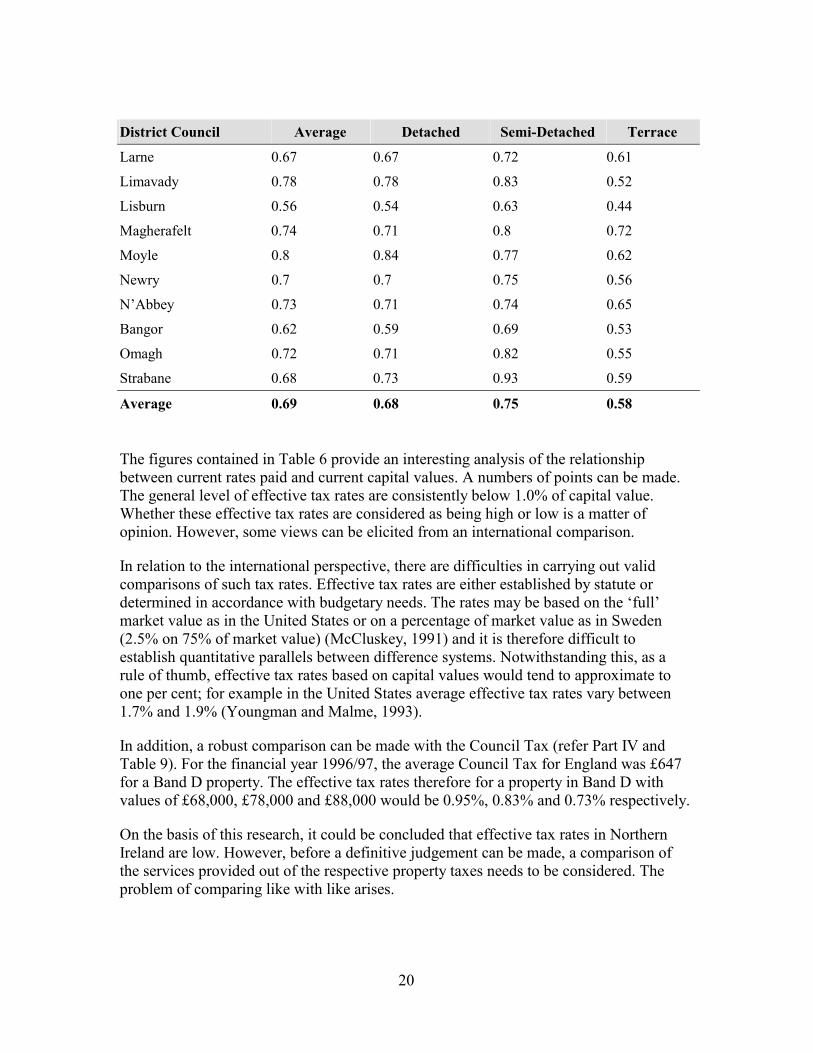
Table 6: Effective Tax Rates (%)
District Council Average Detached Semi-Detached Terrace
Antrim 0.66 0.66 0.69 0.64
Ards 0.61 0.58 0.71 0.53
Armagh 0.76 0.74 0.85 0.61
Ballymena 0.67 0.68 0.72 0.52
Ballymoney 0.8 0.81 0.85 0.66
Banbridge 0.72 0.71 0.77 0.61
Belfast 0.55 0.51 0.61 0.51
Carrick 0.77 0.78 0.82 0.58
Castlereagh 0.52 0.49 0.55 0.46
Coleraine 0.71 0.74 0.76 0.63
Cookstown 0.69 0.7 0.73 0.53
Craigavon 0.8 0.74 0.89 0.8
Derry 0.76 0.79 0.82 0.66
Down 0.64 0.63 0.73 0.57
Dungannon 0.65 0.6 0.72 0.59
Fermanagh 0.61 0.6 0.68 0.51
20
District Council Average Detached Semi-Detached Terrace
Larne 0.67 0.67 0.72 0.61
Limavady 0.78 0.78 0.83 0.52
Lisburn 0.56 0.54 0.63 0.44
Magherafelt 0.74 0.71 0.8 0.72
Moyle 0.8 0.84 0.77 0.62
Newry 0.7 0.7 0.75 0.56
N’Abbey 0.73 0.71 0.74 0.65
Bangor 0.62 0.59 0.69 0.53
Omagh 0.72 0.71 0.82 0.55
Strabane 0.68 0.73 0.93 0.59
Average 0.69 0.68 0.75 0.58
The figures contained in Table 6 provide an interesting analysis of the relationship between current rates paid and current capital values. A numbers of points can be made. The general level of effective tax rates are consistently below 1.0% of capital value. Whether these effective tax rates are considered as being high or low is a matter of opinion. However, some views can be elicited from an international comparison.
In relation to the international perspective, there are difficulties in carrying out valid comparisons of such tax rates. Effective tax rates are either established by statute or determined in accordance with budgetary needs. The rates may be based on the ‘full’ market value as in the United States or on a percentage of market value as in Sweden (2.5% on 75% of market value) (McCluskey, 1991) and it is therefore difficult to establish quantitative parallels between difference systems. Notwithstanding this, as a rule of thumb, effective tax rates based on capital values would tend to approximate to one per cent; for example in the United States average effective tax rates vary between 1.7% and 1.9% (Youngman and Malme, 1993).
In addition, a robust comparison can be made with the Council Tax (refer Part IV and Table 9). For the financial year 1996/97, the average Council Tax for England was £647 for a Band D property. The effective tax rates therefore for a property in Band D with values of £68,000, £78,000 and £88,000 would be 0.95%, 0.83% and 0.73% respectively.
On the basis of this research, it could be concluded that effective tax rates in Northern Ireland are low. However, before a definitive judgement can be made, a comparison of the services provided out of the respective property taxes needs to be considered. The problem of comparing like with like arises.
21
There is a significant variation between effective tax rates within each property sector: for example, the figures range from 0.49% to 0.84% in the detached sector; 0.55% to 0.93 for semi-detached property and 0.44% to 0.80% for terrace property. Interestingly, the terrace sector exhibits the lowest overall average effective tax rate, which results partly from the modest assessed values within this sector and the result of significant capital value increases. From an initial review of these figures it would be possible to conclude that the impact of a change to rating based on capital values would result in a significant increase in liabilities for the terrace sector.
Whilst these results are based on aggregated values, they do give a clear indication of the ratio of rate liability to capital value between property types at the Province-wide level. They highlight a number of key concerns where the rates liability is based on out-dated annual rental values. For a more in-depth consideration, the following section of this paper investigates the impact of a change to capital value rating.
Redistributive Analysis
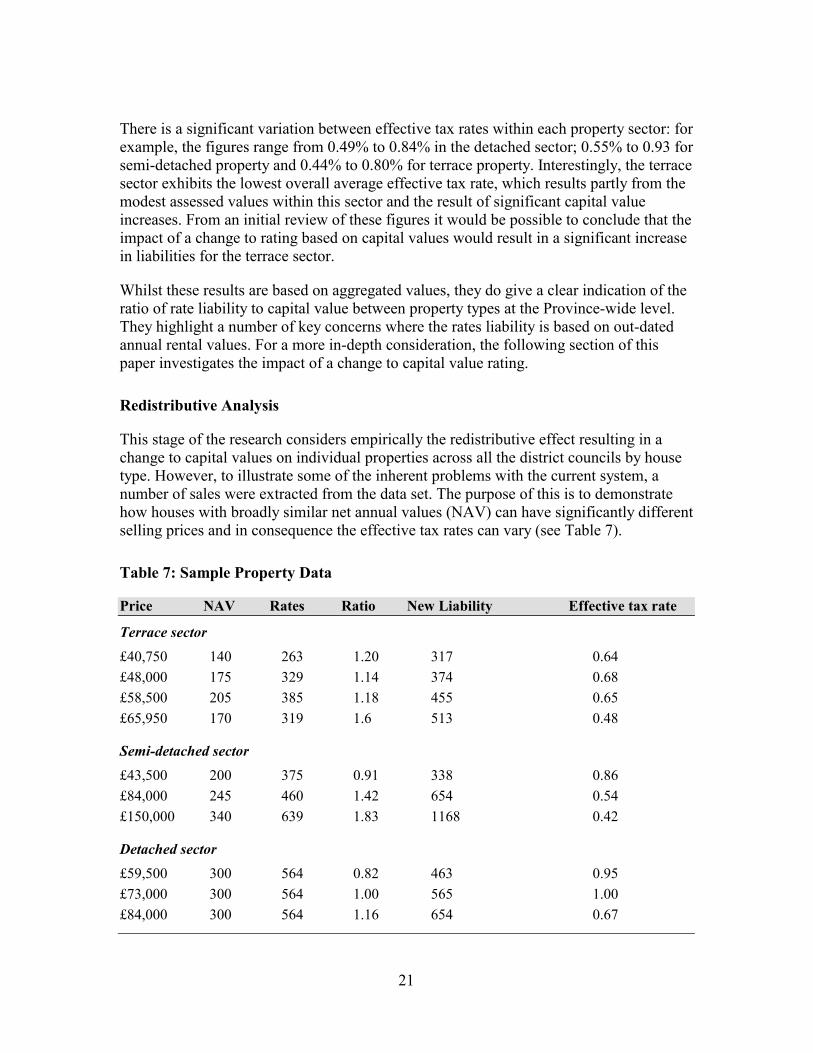
This stage of the research considers empirically the redistributive effect resulting in a change to capital values on individual properties across all the district councils by house type. However, to illustrate some of the inherent problems with the current system, a number of sales were extracted from the data set. The purpose of this is to demonstrate how houses with broadly similar net annual values (NAV) can have significantly different selling prices and in consequence the effective tax rates can vary (see Table 7).
Table 7: Sample Property Data
Price NAV Rates Ratio New Liability Effective tax rate
Terrace sector
£40,750 140 263 1.20 317 0.64 £48,000 175 329 1.14 374 0.68 £58,500 205 385 1.18 455 0.65 £65,950 170 319 1.6 513 0.48
Semi-detached sector
£43,500 200 375 0.91 338 0.86 £84,000 245 460 1.42 654 0.54 £150,000 340 639 1.83 1168 0.42
Detached sector
£59,500 300 564 0.82 463 0.95 £73,000 300 564 1.00 565 1.00 £84,000 300 564 1.16 654 0.67
22
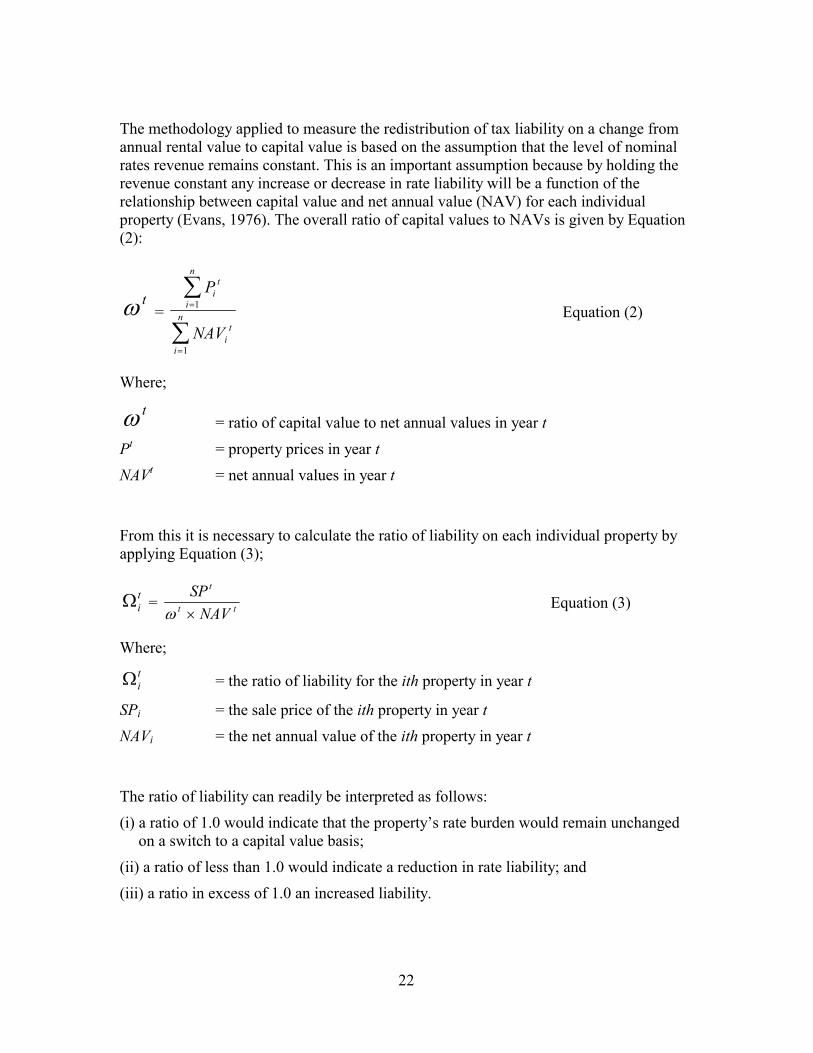
The methodology applied to measure the redistribution of tax liability on a change from annual rental value to capital value is based on the assumption that the level of nominal rates revenue remains constant. This is an important assumption because by holding the revenue constant any increase or decrease in rate liability will be a function of the relationship between capital value and net annual value (NAV) for each individual property (Evans, 1976). The overall ratio of capital values to NAVs is given by Equation (2):
�t
= P
NAV
it
i
n
it
i
n�
�
�
�
1
1
Equation (2)
Where;
�t
= ratio of capital value to net annual values in year t
Pt = property prices in year t NAVt = net annual values in year t
From this it is necessary to calculate the ratio of liability on each individual property by applying Equation (3);
�it =
SPNAV
t
t t� �
Equation (3)
Where;
�it = the ratio of liability for the ith property in year t
SPi = the sale price of the ith property in year t
NAVi = the net annual value of the ith property in year t
The ratio of liability can readily be interpreted as follows: (i) a ratio of 1.0 would indicate that the property’s rate burden would remain unchanged
on a switch to a capital value basis; (ii) a ratio of less than 1.0 would indicate a reduction in rate liability; and (iii) a ratio in excess of 1.0 an increased liability.

23
Figure 4 illustrates on the basis of the ratio analysis the impact in terms of the new rates liability on a change to capital value rating. Some 38% of all properties would see an increase in their rates liability whilst 62% would have a reduction. Within this general ‘winners’ and ‘losers’ scenario, the sector most affected by increased liability is terraced properties, where 55% would see rates bills rising. On the basis of the existing analysis, the semi-detached sector will be the main gainer, where 77% of properties will have reduced liabilities.
Figure 4: Liability Changes for All Properties by House Type
These results are broadly in line with two previous studies which researched the effects of a change from gross rateable values to capital values in England (Evans, 1976; and Lizieri et al., 1989). In the research by Evans, the results showed that 55% of properties would attract reductions whilst in the Lizieri et al. study 52% would have reduced liabilities.
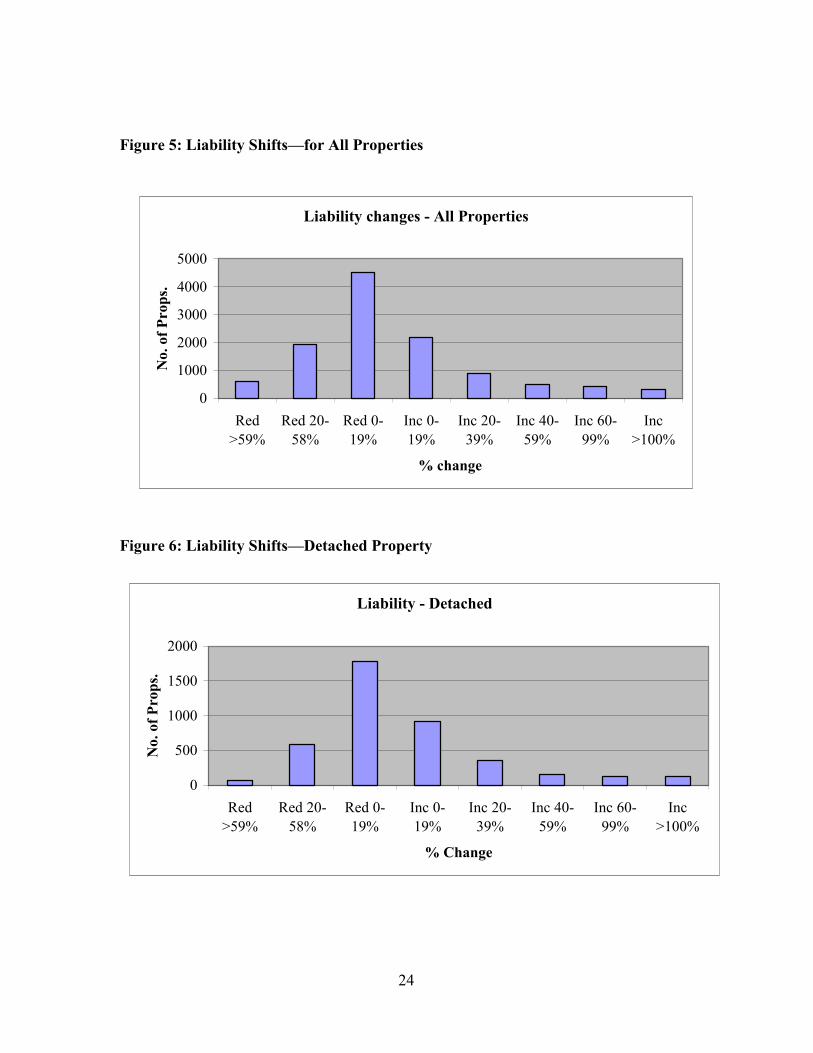
Figures 5-8 show the change in liabilities for all properties and then on a sector basis. This aspect of the analysis highlights the magnitude of liability changes based on a range of bands. Approximately 4,519 (or 40%) properties would attract a reduction of between 0-19%, whilst 19% (2,172 dwellings) would see increased liabilities within the same range.
0102030405060708090
All Detached Semi-detached
Terrace
Property type
%
Increase (%)Reduction (%)
24
Figure 5: Liability Shifts—for All Properties
Figure 6: Liability Shifts—Detached Property
Liability changes - All Properties
0
1000
2000
3000
4000
5000
Red>59%
Red 20-58%
Red 0-19%
Inc 0-19%
Inc 20-39%
Inc 40-59%
Inc 60-99%
Inc>100%
% change
No.
of P
rops
.
Liability - Detached
0
500
1000
1500
2000
Red>59%
Red 20-58%
Red 0-19%
Inc 0-19%
Inc 20-39%
Inc 40-59%
Inc 60-99%
Inc>100%
% Change
No.
of P
rops
.

25
Figure 7: Liability Shifts—Semi-Detached Property
Figure 8: Liability Shifts—Terrace Property
The aggregation of properties into value bands highlights the broad effect an increase in capital value has on the ratio of liability. Figure 9 shows the average ratios per value band for all properties and demonstrates quite clearly that, as the value of the property increases so does the ratio. A ratio of 1 or less results in either a no change or a reduction in actual liability; therefore, properties below £50,000 will, on average, tend to attract reduced liabilities, whereas properties over the same figure will on average have increased rates.
Liability - Semi-Detached
0
500
1000
1500
2000
2500
Red >59% Red 20-58%
Red 0-19% Inc 0-19% Inc 20-39%
Inc 40-59%
Inc 60-99%
Inc >100%
% Change
No.
of P
rops
.
Liability - Terrace
0100200300400500600700
Red >59% Red 20-58%
Red 0-19%
Inc 0-19% Inc 20-39%
Inc 40-59%
Inc 60-99%
Inc>100%
% Change
No.
of P
rops
.

26
The overall average ratio for the entire data set is 1.17, which is to some extent skewed by virtue of the fact that several properties would be attracting quite substantial increases. Generally however, lower valued properties particularly those with a value of less than £20,000 would see a reduction.
Figure 9 illustrates the average ratios by value bands of all properties in the data set.
Figure 9: Average Ratios by Value Bands—All Properties
Figure 10 shows the distribution of the entire data set across the various value bands with the concentration of properties within the £40,000-£70,000 price range.
Figure 10: Distribution of All Properties by Value Bands
00.5
11.5
22.5
3
<2000
0
2000
1-300
00
3000
1-400
00
4000
1-500
00
5000
1-600
00
6000
1-700
00
7000
1-800
00
8000
1-900
00
9000
1-100
000
1000
01-11
0000
1100
01-12
0000
1200
01-13
0000
1300
01-15
0000
1500
01-18
0000
>1800
01
Value Bands
Ave
rage
rat
io
0500
10001500200025003000
<2000
0
2000
1-300
00
3000
1-400
00
4000
1-500
00
5000
1-600
00
6000
1-700
00
7000
1-800
00
8000
1-900
00
9000
1-100
000
1000
01-11
0000
1100
01-12
0000
1200
01-13
0000
1300
01-15
0000
1500
01-18
0000
>1800
01
Value bands
Num
ber

27
Figure 11 shows that for most of the value bands the ratio is around 1. It is only when property values start to exceed £100,000 that the ratios start to increase with the consequent increase in rates liability. This would indicate that the larger and more expensive detached properties are currently under-paying rates.
Figure 11: Average Ratio by Value Bands—Detached Properties
As one would expect the relative distribution of detached properties according to value is more skewed towards the higher valued bands (see Figure 12).
Figure 12: Distribution of Detached Properties by Value Bands
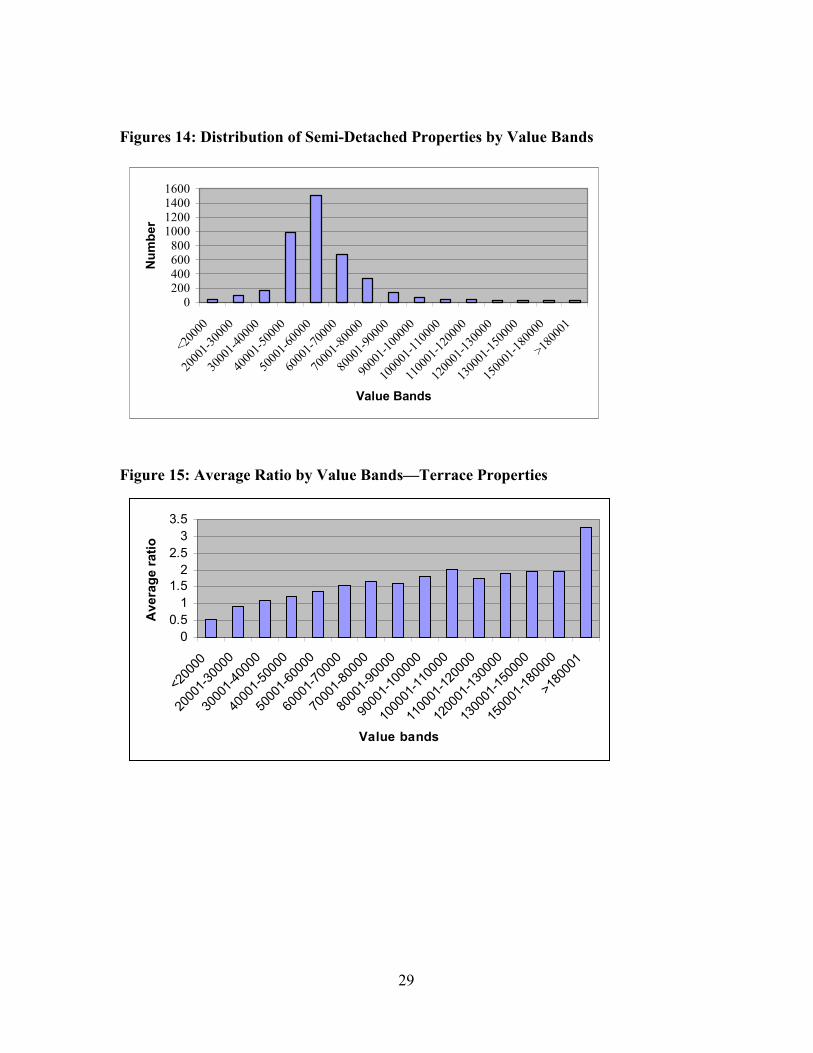
The trend shown in Figure 13 is for semi-detached properties. In this case, it is properties with values in excess of £80,000 which will see an increase in rates liability.
00.20.40.60.8
11.21.41.61.8
<2000
0
2000
1-300
00
3000
1-400
00
4000
1-500
00
5000
1-600
00
6000
1-700
00
7000
1-800
00
8000
1-900
00
9000
1-100
000
1000
01-11
0000
1100
01-12
0000
1200
01-13
0000
1300
01-15
0000
1500
01-18
0000
>1800
01
Value Bands
Ave
rage
Rat
io
0100200300400500600700800
<2000
0
2000
1-300
00
3000
1-400
00
4000
1-500
00
5000
1-600
00
6000
1-700
00
7000
1-800
00
8000
1-900
00
9000
1-100
000
1000
01-11
0000
1100
01-12
0000
1200
01-13
0000
1300
01-15
0000
1500
01-18
0000
>1800
01
Value Bands
Num
ber
0
0.5
1
1.5
2
2.5
<2000
0
2000
1-300
00
3000
1-400
00
4000
1-500
00
5000
1-600
00
6000
1-700
00
7000
1-800
00
8000
1-900
00
9000
1-100
000
1000
01-11
0000
1100
01-12
0000
1200
01-13
0000
1300
01-15
0000
1500
01-18
0000
>1800
01
Value Bands
Ave
rage
Rat
io
28
Figure 13: Average Ratio by Value Bands—Semi-Detached Properties
For terrace property, on average houses with a value below £40,000 will attract reductions whilst rate increase for properties with a value in excess of this figure. Refer Figure 14 for semi-detached properties by value bands, Figure 15 for the average ratio by value bands for terraced properties and Figure 16 for the distribution of terraced properties by value bands.
29
Figures 14: Distribution of Semi-Detached Properties by Value Bands
Figure 15: Average Ratio by Value Bands—Terrace Properties
0200400600800
1000120014001600
<2000
0
2000
1-300
00
3000
1-400
00
4000
1-500
00
5000
1-600
00
6000
1-700
00
7000
1-800
00
8000
1-900
00
9000
1-100
000
1000
01-11
0000
1100
01-12
0000
1200
01-13
0000
1300
01-15
0000
1500
01-18
0000
>1800
01
Value Bands
Num
ber
00.5
11.5
22.5
33.5
<2000
0
2000
1-300
00
3000
1-400
00
4000
1-500
00
5000
1-600
00
6000
1-700
00
7000
1-800
00
8000
1-900
00
9000
1-100
000
1000
01-11
0000
1100
01-12
0000
1200
01-13
0000
1300
01-15
0000
1500
01-18
0000
>1800
01
Value bands
Ave
rage
ratio
30
Figure 16: Distribution of Terrace Properties by Value Bands
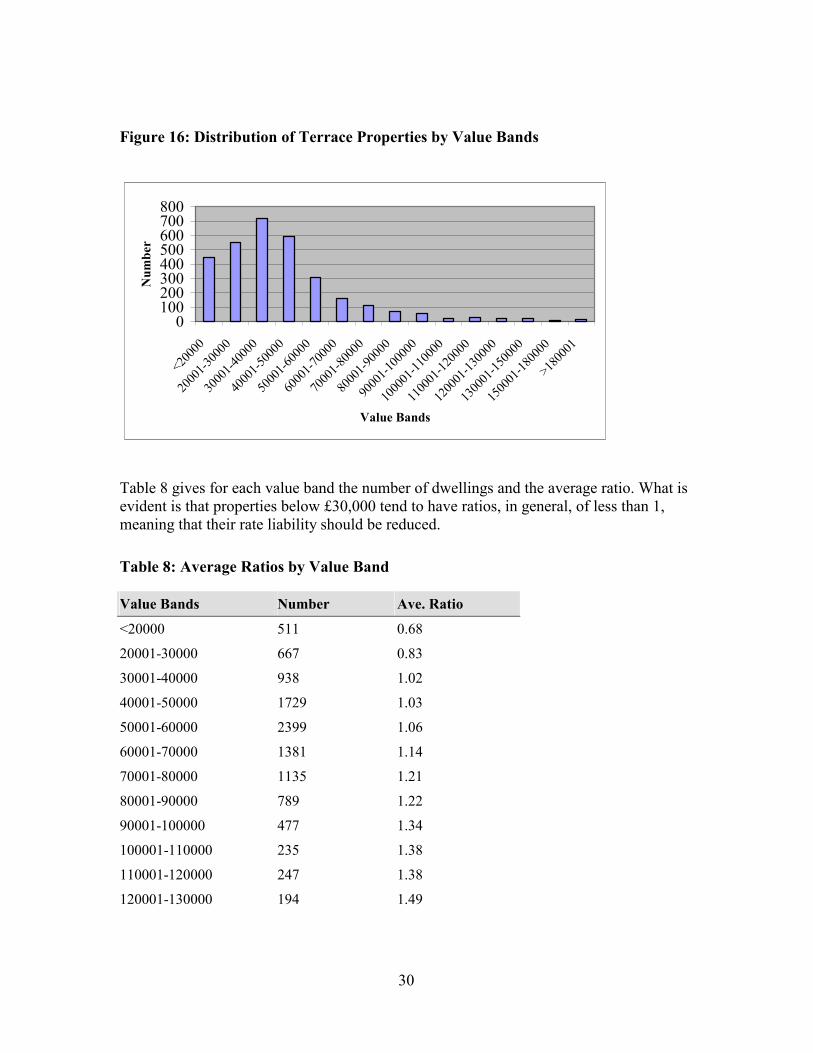
Table 8 gives for each value band the number of dwellings and the average ratio. What is evident is that properties below £30,000 tend to have ratios, in general, of less than 1, meaning that their rate liability should be reduced.
Table 8: Average Ratios by Value Band
Value Bands Number Ave. Ratio
<20000 511 0.68
20001-30000 667 0.83
30001-40000 938 1.02
40001-50000 1729 1.03
50001-60000 2399 1.06
60001-70000 1381 1.14
70001-80000 1135 1.21
80001-90000 789 1.22
90001-100000 477 1.34
100001-110000 235 1.38
110001-120000 247 1.38
120001-130000 194 1.49
0100200300400500600700800
<2000
0
2000
1-300
00
3000
1-400
00
4000
1-500
00
5000
1-600
00
6000
1-700
00
7000
1-800
00
8000
1-900
00
9000
1-100
000
1000
01-11
0000
1100
01-12
0000
1200
01-13
0000
1300
01-15
0000
1500
01-18
0000
>1800
01
Value Bands
Num
ber
31
Value Bands Number Ave. Ratio
130001-150000 260 1.55
150001-180000 181 1.62
>180001 253 2.56
Conclusions of Case Study
Rates represent the only tax available to district councils within Northern Ireland. Given the fixed nature of real property, it provides a stable base upon which to impose a local tax. Layfield (1976) commented ‘rating has become deeply embedded in the taxation and local government systems and up to now no substitute has been found acceptable’. However, it is important to realise that, as the tax is a function of assessed values, it is imperative in the interests of fairness and equity that the values are both accurate and current and are capable of being understood by the taxpayers. The basis of the property tax is of ultimate importance to the financial stability of local government and to the confidence of the taxpaying public in administrative equity. It should, therefore, be closely correlated to the availability and quality of data. In this context, continued reliance on annual rental values is untenable and subsequent revaluations of the domestic sector should reflect the prevailing capital nature of the residential market.
This research has measured at the macro level (all 26 district councils) effective tax rates across the three main property types. The analysis has demonstrated that within the existing rating system, there is a significant issue in relation to the relativities between actual tax liabilities and the capital value of property and this has important implications in terms of both horizontal and vertical equity. The presence or otherwise of these two canons of taxation give a measure of the overall fairness of the system.
Given the fact that the last domestic revaluation was in 1976, it is not surprising that this research has identified a significant absence of equity within the current system. In addressing this issue, the research investigated at the discrete property level, the likely impact of a shift in the basis of the tax from rental values to capital values. Current rate liabilities based on net annual values (NAV) were compared to ‘new’ liabilities under an ad valorem capital value regime. It is clear that under a capital value basis there would be a significant redistribution of the rates burden resulting primarily from the lag between revaluation dates and the growth in property capital values.
Generally, terrace properties have relatively low NAVs but have experienced substantial levels of capital growth since the valuation date and, thus, will be most affected. In addition, detached dwellings with capital values towards the upper end will equally face significant increases. However, the results and broad conclusions drawn from the work would be indicative of province-wide shifts. Notwithstanding this, given the levels of redistribution likely, a further project looking at several other district councils is to be undertaken. Overall, the analysis has demonstrated that the anomalies currently present in

32
the ‘old’ rating system could be addressed with a redistribution of the tax burden which would ultimately lead to a much fairer property tax regime.
33
Part IV: Case Study 2—The Council Tax in England and Wales
The hypothesis to be tested in this part of the research is that the current banding system of the Council Tax based on 1991 values has not fulfilled the expectation of horizontal and vertical equity imperative within a banded ad valorem tax. Based on a sample of data, this research demonstrates the urgent need for a revaluation (or at least rebanding) in order to ensure horizontal and vertical equities and continued confidence and stability in local government finance.
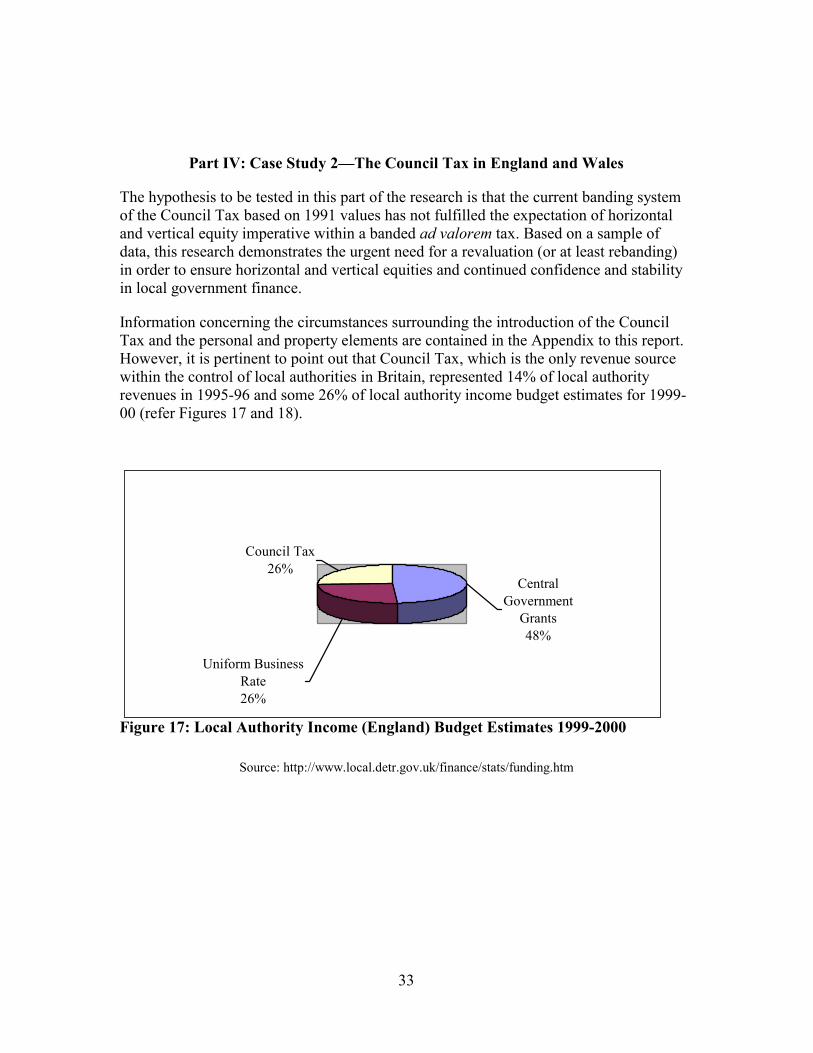
Information concerning the circumstances surrounding the introduction of the Council Tax and the personal and property elements are contained in the Appendix to this report. However, it is pertinent to point out that Council Tax, which is the only revenue source within the control of local authorities in Britain, represented 14% of local authority revenues in 1995-96 and some 26% of local authority income budget estimates for 1999-00 (refer Figures 17 and 18).
Figure 17: Local Authority Income (England) Budget Estimates 1999-2000
Source: http://www.local.detr.gov.uk/finance/stats/funding.htm
Council Tax26%
Central Government
Grants48%
Uniform Business Rate26%
34
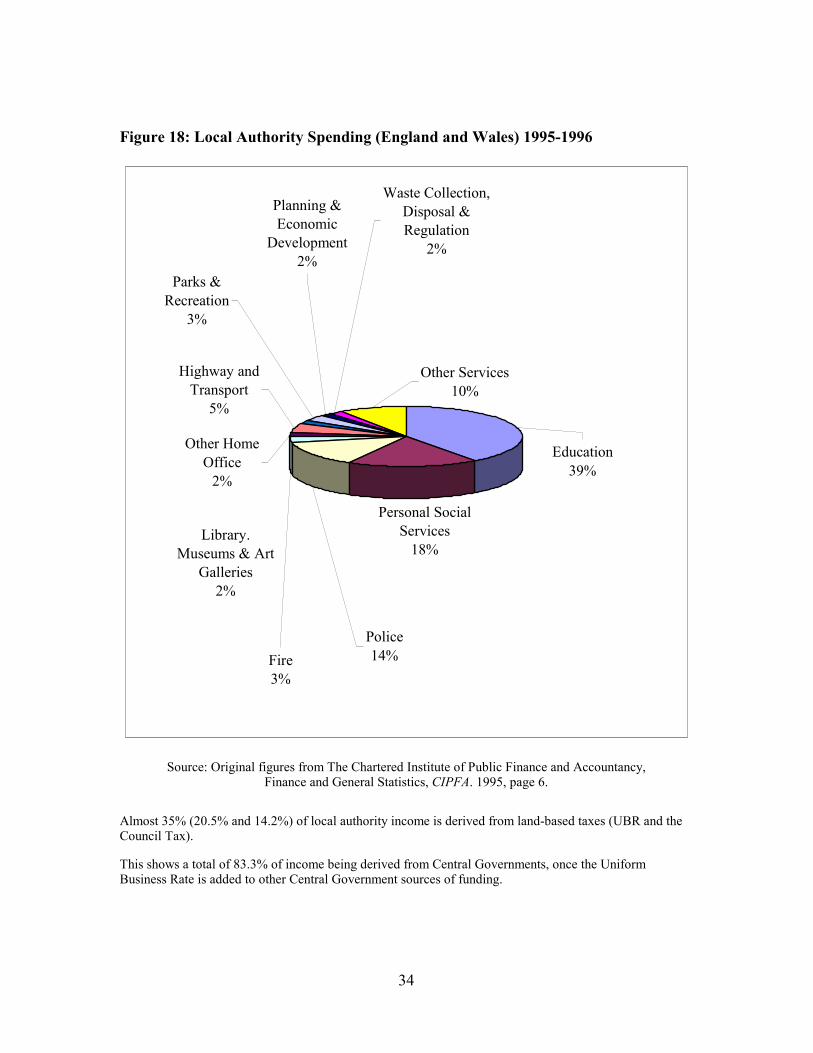
Figure 18: Local Authority Spending (England and Wales) 1995-1996
Personal Social Services
18%
Highway and Transport
5%
Other Services10%
Other Home Office
2%
Library. Museums & Art
Galleries2%
Fire3%
Police14%
Parks & Recreation
3%
Planning & Economic
Development2%
Waste Collection, Disposal & Regulation
2%
Education39%
Source: Original figures from The Chartered Institute of Public Finance and Accountancy, Finance and General Statistics, CIPFA. 1995, page 6.
Almost 35% (20.5% and 14.2%) of local authority income is derived from land-based taxes (UBR and the Council Tax).
This shows a total of 83.3% of income being derived from Central Governments, once the Uniform Business Rate is added to other Central Government sources of funding.

35
The Council Tax, which was introduced with effect from 1 April 1993, was based on the 1991 capital values of residential properties in England and Wales. Strictly speaking, properties were not “valued,” they were merely placed into one of eight value bands. The value bands for England and Scotland appear as Table 9 and the value bands for Wales are produced in Table 10.
Table 9: Value Bands in England and Scotland
Valuation Band Range of Values
Band A Not exceeding £40,000
Band B Exceeding £40,000 but not exceeding £52,000
Band C Exceeding £52,000 but not exceeding £68,000
Band D Exceeding £68,000 but not exceeding £88,000
Band E Exceeding £88,000 but not exceeding £120,000
Band F Exceeding £120,000 but not exceeding £160,000
Band G Exceeding £160,000 but not exceeding £320,000
Band H Exceeding £320,000
Table 10: Value Bands in Wales
Valuation Band Range of Values
Band A Not exceeding £30,000
Band B Exceeding £30,000 but not exceeding £39,000
Band C Exceeding £39,000 but not exceeding £51,000
Band D Exceeding £51,000 but not exceeding £66,000
Band E Exceeding £66,000 but not exceeding £90,000
Band F Exceeding £90,000 but not exceeding £120,000
Band G Exceeding £120,000 but not exceeding £240,000
Band H Exceeding £240,000
Thus, for Wales, all properties with capital values of £30,000 or below as at 1 April 1991 are placed into Band A and all properties with capital value exceeding £240,000 as at 1 April 1991 are placed into Band H.
Further, central government controls the relativity between the levels of Council Tax paid by the occupiers of properties within these bands. Thus, occupiers of Band A properties
36
pay two-thirds of the level of tax required of the so-called average Band D properties; and occupiers of Band H properties pay twice the level of tax required by the so-called average Band D (refer Table 11).
Table 11: Relativity of Council Tax Liability
Band A Band B Band C Band D Band E Band F Band G Band H
6 7 8 9 11 13 15 18
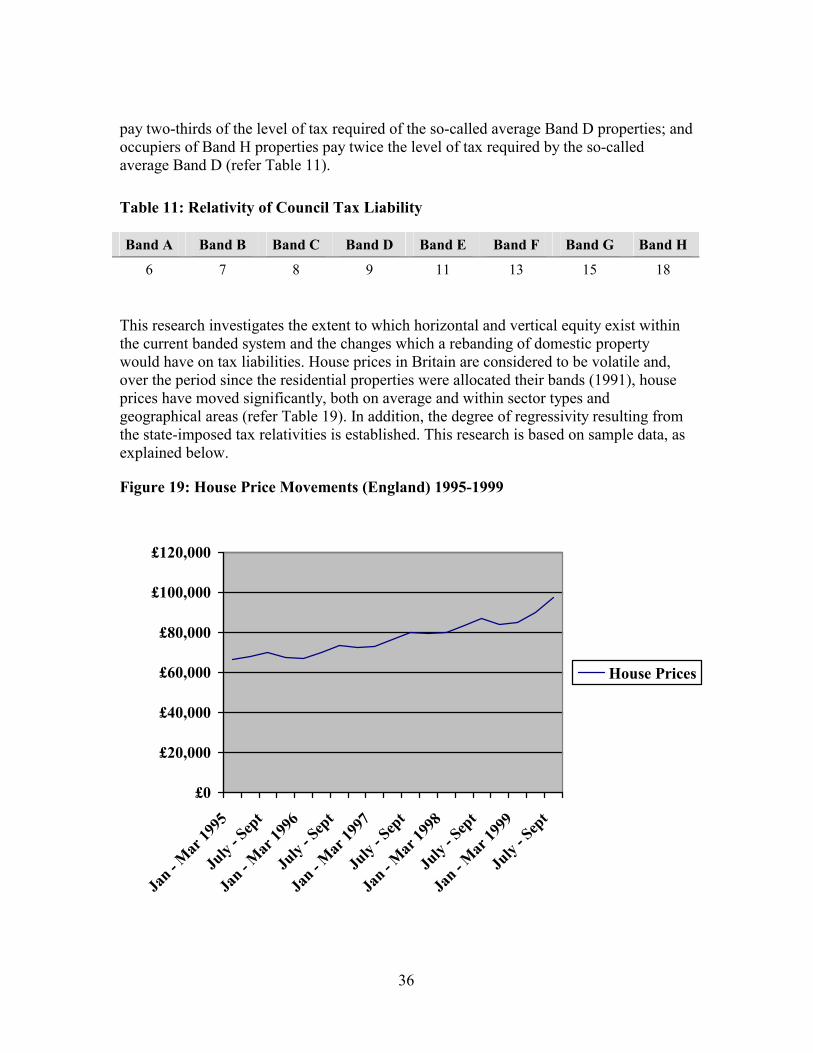
This research investigates the extent to which horizontal and vertical equity exist within the current banded system and the changes which a rebanding of domestic property would have on tax liabilities. House prices in Britain are considered to be volatile and, over the period since the residential properties were allocated their bands (1991), house prices have moved significantly, both on average and within sector types and geographical areas (refer Table 19). In addition, the degree of regressivity resulting from the state-imposed tax relativities is established. This research is based on sample data, as explained below.
Figure 19: House Price Movements (England) 1995-1999
£0
£20,000
£40,000
£60,000
£80,000
£100,000
£120,000
Jan - M
ar 19
95
July
- Sep
t
Jan - M
ar 19
96
July
- Sep
t
Jan - M
ar 19
97
July
- Sep
t
Jan - M
ar 19
98
July
- Sep
t
Jan - M
ar 19
99
July
- Sep
t
House Prices
37
Sample Data
A sample of 696 residential open market transactions for an urban local authority area in south east Wales (Newport Borough Council) were recorded, to which were added an additional 24 transactions from a neighbouring municipality (Cardiff County Council) which were perceived to be necessary to ensure a more representative spread of transactions over the various value bands. All of the transactions took place over a two year period (1997-98), when the valuation date for the bandings of properties was between six and seven years earlier.
Thus, a total of 720 transactions were analysed and, when compared to the total taxable properties in the one of the municipalities (Newport Borough Council), represents a sample of 1.26% of the transactions of taxable properties for that authority. In order to ensure that this small sample of properties is representative of the range of properties within the municipality, the number of the sampled properties within each band were compared to the total number of properties within each band in the municipality. It was decided that where the sample percentage in each banding differed to that shown in the municipality banding by an amount less than 5%, then the analysis of that banding within the sample would be treated reliable. As is shown in Table 12, in only two cases did the percentage of sample properties differ from the overall municipality range of banded properties (as shown in the valuation list) by more than 5%.
Table 12: Comparison between the Spread of Properties in Each Band in the Sample and in the Municipality Valuation List
Municipality % Sample % Sample +/- municipal % Limitations
Band A 15.31% 1.94% -13.37% under-represented in sample
Band B 32.20% 33.47% +1.27% acceptable limit
Band C 20.26% 26.39% +6.13% over-represented in sample
Band D 16.18% 20.42% +4.24% acceptable limit
Band E 8.62% 10.42% +1.79% acceptable limit
Band F 4.21% 4.17% -0.04% acceptable limit
Band G 2.91% 2.92% +0.01% acceptable limit
Band H 0.32% 0.28% -0.04% acceptable limit

38
There is a 13.37% under-representation of Band A properties (Band A comprises 1.94% of the sample, whereas for the municipality, Band A properties are 15.31% of the total shown in the valuation list). Properties in Band C in the sample are over-represented by 6.13% (26.39% in the sample and 20.26% in the valuation list). It may be that this does not materially affect the analysis or the conclusions.
It should also be recognised that, despite the similarity in the percentage of Band H properties in both the sample (0.32%) and the municipality valuation list (0.28%), there are only two properties in this value band in the sample. Any conclusions drawn from the analysis of Band H sample properties must, therefore, also be recognised as unreliable.
Thus, the sample data is likely to provide useful and reliable statistical information for the range of properties, with the possible exception of the two extremes, Bands A and H, both of which are under-represented although for completeness of information, details of the analysis of these two bands are also included in this report.
Analysis of Transactions within Bands
The aim of the analysis is to establish the extent to which the residential properties within the sample area are appropriately banded (and therefore their occupiers appropriately taxed) for the purposes of the Council Tax. All properties were allocated appropriate bands as at 1 April 1991 values and there has not been (nor is there any intention to introduced) a revaluation of properties or a reallocation of properties within bands. The hypothesis of the research is that regular and frequent revaluations are necessary to ensure horizontal and vertical equity within an ad valorem tax, and that banding of property values does not obviate the need for such revaluations.
Thus, sale prices of properties achieved between 1997 and 1998 were compared with their existing council tax valuation bands to identify if and to what extent sales prices failed to match valuation bands.
A direct comparison of (1997-98) sales prices and property value bands shows that, overall, only 55% of the total sample of properties are correctly banded. Of the 45% of the properties which are incorrectly banded, (180) 25% should be entered into a lower value band, and (143) 20% should be entered at a higher value band. The results of the analysis of the sample, for each Band, are as shown in Table 13 and Figure 20.
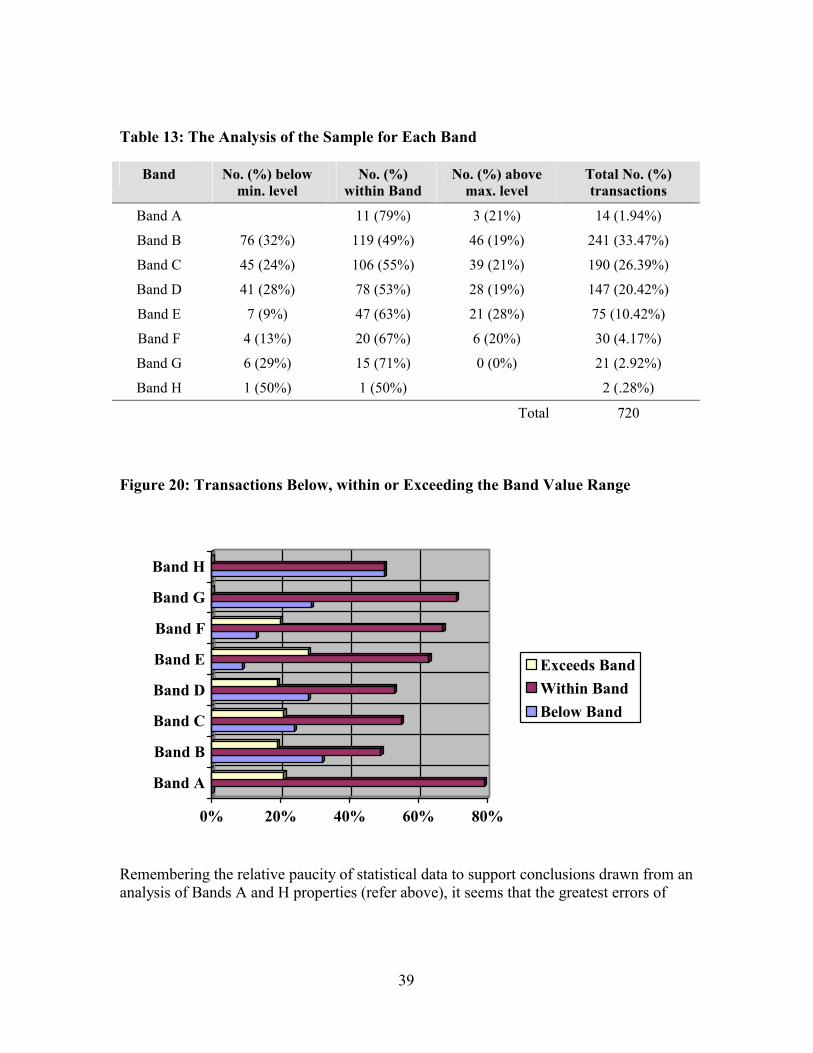
39
Table 13: The Analysis of the Sample for Each Band
Band No. (%) below min. level
No. (%) within Band
No. (%) above max. level
Total No. (%) transactions
Band A 11 (79%) 3 (21%) 14 (1.94%)
Band B 76 (32%) 119 (49%) 46 (19%) 241 (33.47%)
Band C 45 (24%) 106 (55%) 39 (21%) 190 (26.39%)
Band D 41 (28%) 78 (53%) 28 (19%) 147 (20.42%)
Band E 7 (9%) 47 (63%) 21 (28%) 75 (10.42%)
Band F 4 (13%) 20 (67%) 6 (20%) 30 (4.17%)
Band G 6 (29%) 15 (71%) 0 (0%) 21 (2.92%)
Band H 1 (50%) 1 (50%) 2 (.28%)
Total 720
Figure 20: Transactions Below, within or Exceeding the Band Value Range
Remembering the relative paucity of statistical data to support conclusions drawn from an analysis of Bands A and H properties (refer above), it seems that the greatest errors of
0% 20% 40% 60% 80%
Band A
Band B
Band C
Band D
Band E
Band F
Band G
Band H
Exceeds BandWithin BandBelow Band
40
banding occur at the lower end of the value bands, with only 49% of properties being correctly valued at Band B and 71% of properties being correctly valued at Band G.
Of course, it is not possible for properties within Band A to be under-valued (the minimum value within Band A is £0). Similarly, it is not possible for properties within Band H to be over-valued (in Wales, the range of Band H values encompasses all values in excess of £240,000) (refer Table 10 and Figure 20).
Thus, there is substantial inequality within the existing liability to Council Tax within England and Wales, based on this sample survey. The results further demonstrate the failure of the government’s assertion that the principle of banding will allow property values to move within bands and thereby obviate the need for a revaluation (or rebanding) of residential property for Council Tax purposes.
However, the extent to which properties are under- or over-valued can also be analysed. It might be anticipated that minor errors in under- or over-valuation are the natural consequence of such a long period since the original (and only) banding of properties. However, analysis reveals significant variations in the sale prices compared to the original (1991) valuations or bandings.
It has been assumed that the original valuations or bandings were correct. Despite the rapid production of these original valuation bands, their relative cheapness and the unusual involvement of the private sector in the process, there was a system of quality control administered by the valuation office (refer Plimmer, 1998). Although there were a few very public errors made, both in identifying certain dwellings and in allocating appropriate bands, it is generally accepted (certainly by central government) that the banding for council tax purposes was accurate. Of course, with the volatility of the residential property market in the UK, property prices can be expected to change rapidly over a relatively short period of time and it may be that the analysis demonstrates this “natural” market-led shift in values (refer Figure 19). However, this merely reinforces the need for regular and frequent revaluations to ensure that taxable values reflect current open market prices as closely as possible.
The extent to which sale prices are out of step with banded values can be demonstrated by an analysis of the amount by which sale prices are lower than or exceed the banded values. Table 14 and Figure 21 demonstrate the average deficiency or excess (shown as a percentage) by which the sale price fails to fall within the allocated band.

41
Table 14: The Average Deficiency or Excess (shown as a percentage) by which the Sale Price Fails to Fall within the Allocated Band
Average Deficiency % Average Excess %
Band A 6%
Band B 15% 10%
Band C 14% 13%
Band D 12% 11%
Band E 20% 22%
Band F 14% 12%
Band G 11% nil
Band H 45%
Figure 21: The Average Deficiency or Excess (shown as a graph) by which the Sale Price Fails to Fall within the Allocated Band
Remember that it is not possible for properties in Band A to fall below the lowest level of that band (it being £0) nor is it possible for properties in Band H to exceed the upper limit of that band. It should also be noted that, because there are only two transactions within Band H, the results cannot be considered statistically significant.
Nevertheless, the overall sample size of the Band H properties (at 0.28%) is similar to that for the municipality as a whole (0.32%) and the fact that any property has sold at a
05
1015202530354045
BandA
BandB
BandC
BandD
BandE
BandF
BandG
BandH
Deficiency %Excess %
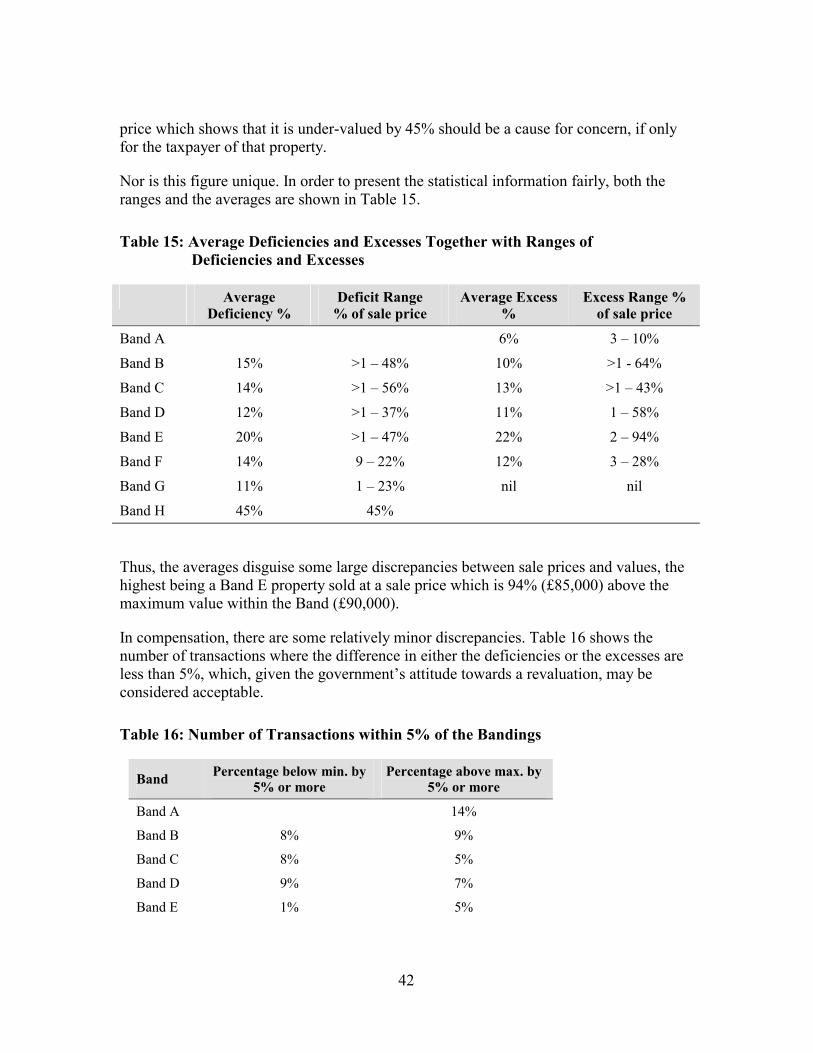
42
price which shows that it is under-valued by 45% should be a cause for concern, if only for the taxpayer of that property.
Nor is this figure unique. In order to present the statistical information fairly, both the ranges and the averages are shown in Table 15.
Table 15: Average Deficiencies and Excesses Together with Ranges of Deficiencies and Excesses
Average Deficiency %
Deficit Range % of sale price
Average Excess %
Excess Range % of sale price
Band A 6% 3 – 10%
Band B 15% >1 – 48% 10% >1 - 64%
Band C 14% >1 – 56% 13% >1 – 43%
Band D 12% >1 – 37% 11% 1 – 58%
Band E 20% >1 – 47% 22% 2 – 94%
Band F 14% 9 – 22% 12% 3 – 28%
Band G 11% 1 – 23% nil nil
Band H 45% 45%
Thus, the averages disguise some large discrepancies between sale prices and values, the highest being a Band E property sold at a sale price which is 94% (£85,000) above the maximum value within the Band (£90,000).
In compensation, there are some relatively minor discrepancies. Table 16 shows the number of transactions where the difference in either the deficiencies or the excesses are less than 5%, which, given the government’s attitude towards a revaluation, may be considered acceptable.
Table 16: Number of Transactions within 5% of the Bandings
Band Percentage below min. by 5% or more
Percentage above max. by 5% or more
Band A 14%
Band B 8% 9%
Band C 8% 5%
Band D 9% 7%
Band E 1% 5%

43
Band F 0 10%
Band G 10% 0
Band H 0
Rebanding
The rebanding of the sample data, based on their sale prices, produced the distribution illustrated in Figure 22 and Table 17, when compared to the existing bandings.
Figure 22: Distribution of Rebanded Properties
Table 17: Variation in Numbers of Properties in Bands Following a Rebanding
Band Rebanded Total Original Total Variation %
A 96 14 586% increase
B 170 241 27% decrease
C 182 190 4% decrease
D 119 147 19% decrease
E 82 75 9% increase
F 43 30 43% increase
G 27 21 29% increase
0
50
100
150
200
250
300
BandA
BandB
BandC
BandD
BandE
BandF
BandG
BandH
RebandedOriginal
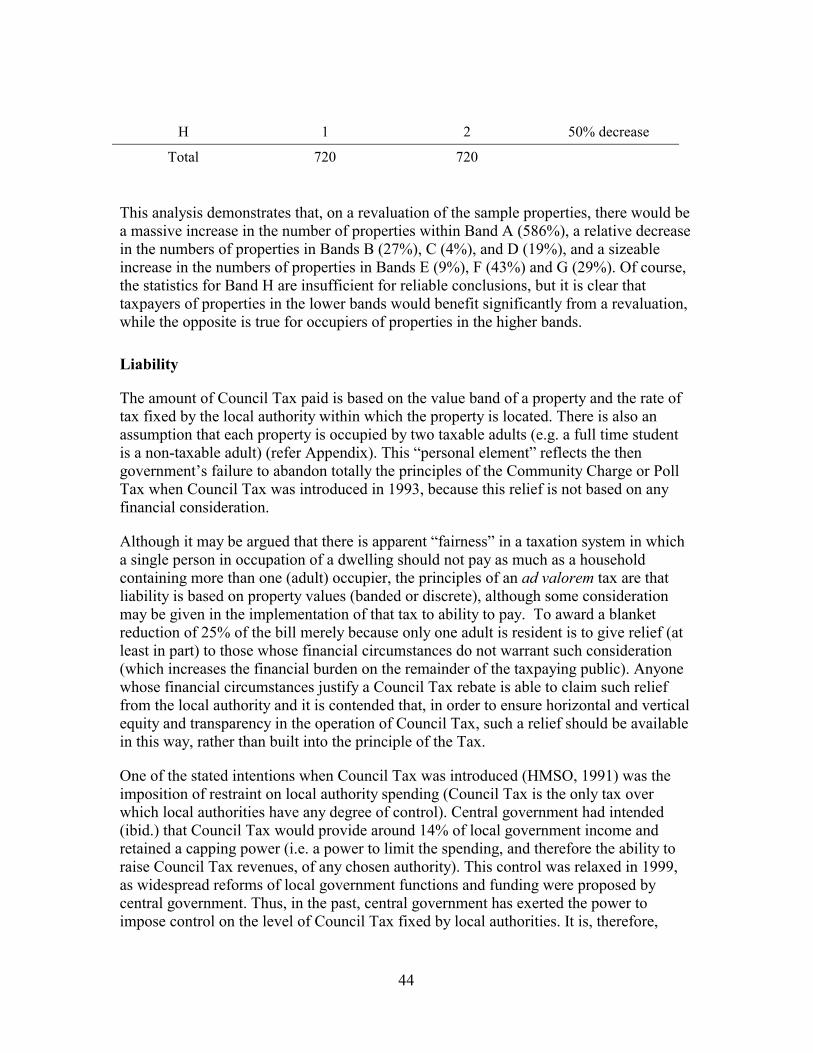
44
H 1 2 50% decrease
Total 720 720
This analysis demonstrates that, on a revaluation of the sample properties, there would be a massive increase in the number of properties within Band A (586%), a relative decrease in the numbers of properties in Bands B (27%), C (4%), and D (19%), and a sizeable increase in the numbers of properties in Bands E (9%), F (43%) and G (29%). Of course, the statistics for Band H are insufficient for reliable conclusions, but it is clear that taxpayers of properties in the lower bands would benefit significantly from a revaluation, while the opposite is true for occupiers of properties in the higher bands.
Liability
The amount of Council Tax paid is based on the value band of a property and the rate of tax fixed by the local authority within which the property is located. There is also an assumption that each property is occupied by two taxable adults (e.g. a full time student is a non-taxable adult) (refer Appendix). This “personal element” reflects the then government’s failure to abandon totally the principles of the Community Charge or Poll Tax when Council Tax was introduced in 1993, because this relief is not based on any financial consideration.
Although it may be argued that there is apparent “fairness” in a taxation system in which a single person in occupation of a dwelling should not pay as much as a household containing more than one (adult) occupier, the principles of an ad valorem tax are that liability is based on property values (banded or discrete), although some consideration may be given in the implementation of that tax to ability to pay. To award a blanket reduction of 25% of the bill merely because only one adult is resident is to give relief (at least in part) to those whose financial circumstances do not warrant such consideration (which increases the financial burden on the remainder of the taxpaying public). Anyone whose financial circumstances justify a Council Tax rebate is able to claim such relief from the local authority and it is contended that, in order to ensure horizontal and vertical equity and transparency in the operation of Council Tax, such a relief should be available in this way, rather than built into the principle of the Tax.
One of the stated intentions when Council Tax was introduced (HMSO, 1991) was the imposition of restraint on local authority spending (Council Tax is the only tax over which local authorities have any degree of control). Central government had intended (ibid.) that Council Tax would provide around 14% of local government income and retained a capping power (i.e. a power to limit the spending, and therefore the ability to raise Council Tax revenues, of any chosen authority). This control was relaxed in 1999, as widespread reforms of local government functions and funding were proposed by central government. Thus, in the past, central government has exerted the power to impose control on the level of Council Tax fixed by local authorities. It is, therefore,

45
interesting to discover that the level of tax raised on the sample data in 1997 – 98 represents a 33% increase on that level of tax raised in 1993–94 (the first year Council Tax was imposed).
Similarly, the level of tax raised is dependent upon the spending plans of the local authority. Thus even if a revaluation were to take place, the same total amount of revenue would be raised by the local authority. Having established that, based on the level of Council Tax paid in the local authority area in 1997–98, a total of £282,068.11 would have been raised on the sample properties, the results of rebanding the sample properties demonstrates that an total decrease of only 0.00048% (£137.49) would have been lost. Thus, overall, there would need to be an insignificant change in the level of Council Tax imposed i.e. the amount levied within each tax band.
However, the shift of properties from one tax band to another could make dramatic differences to the size of the tax bills received by many occupiers. Tables 17 and 18 illustrate how, once the sample properties are re-banded based on their 1997-98 sale prices, liability to tax alters, with Band A seeing an increase of 85 properties (some 586%), each becoming liable for an average Council Tax bill reduction of £50.48.
Table 18: Differences in Liability Following a Revaluation (Rebanding)
Band (reconstituted) 1997-98 Tax Decreased Bill
(Average) Increase Bill
(Average)
A £273.85 85 (£50.48)
B £319.50 43 (£48.81)
3 (£45.81)
C £365.13 36 (£50.70)
39 (£45.63)
D £410.78 4 (£91.28)
36 (£49.45)
E £502.06 3 (£91.29)
31 (£94.23)
F £593.35 6 (£91.28)
17 (£96.66)
G £684.63 1 ((£136.93)
11 (£107.88)
H £821.56 nil nil
In addition, Table 18 demonstrates that 43 properties within Band B would face reduced rate bills (with only 3 having increases). At the middle to higher value bands, 36
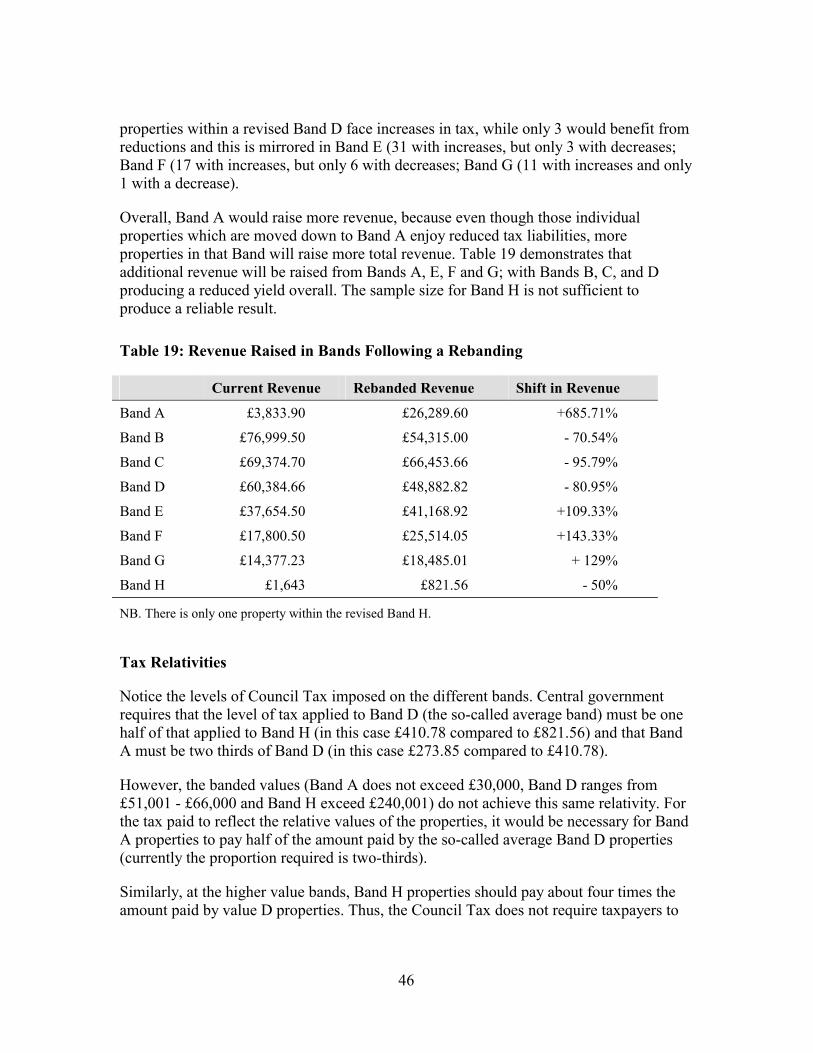
46
properties within a revised Band D face increases in tax, while only 3 would benefit from reductions and this is mirrored in Band E (31 with increases, but only 3 with decreases; Band F (17 with increases, but only 6 with decreases; Band G (11 with increases and only 1 with a decrease).
Overall, Band A would raise more revenue, because even though those individual properties which are moved down to Band A enjoy reduced tax liabilities, more properties in that Band will raise more total revenue. Table 19 demonstrates that additional revenue will be raised from Bands A, E, F and G; with Bands B, C, and D producing a reduced yield overall. The sample size for Band H is not sufficient to produce a reliable result.
Table 19: Revenue Raised in Bands Following a Rebanding
Current Revenue Rebanded Revenue Shift in Revenue
Band A £3,833.90 £26,289.60 +685.71%
Band B £76,999.50 £54,315.00 - 70.54%
Band C £69,374.70 £66,453.66 - 95.79%
Band D £60,384.66 £48,882.82 - 80.95%
Band E £37,654.50 £41,168.92 +109.33%
Band F £17,800.50 £25,514.05 +143.33%
Band G £14,377.23 £18,485.01 + 129%
Band H £1,643 £821.56 - 50%
NB. There is only one property within the revised Band H.
Tax Relativities
Notice the levels of Council Tax imposed on the different bands. Central government requires that the level of tax applied to Band D (the so-called average band) must be one half of that applied to Band H (in this case £410.78 compared to £821.56) and that Band A must be two thirds of Band D (in this case £273.85 compared to £410.78).
However, the banded values (Band A does not exceed £30,000, Band D ranges from £51,001 - £66,000 and Band H exceed £240,001) do not achieve this same relativity. For the tax paid to reflect the relative values of the properties, it would be necessary for Band A properties to pay half of the amount paid by the so-called average Band D properties (currently the proportion required is two-thirds).
Similarly, at the higher value bands, Band H properties should pay about four times the amount paid by value D properties. Thus, the Council Tax does not require taxpayers to
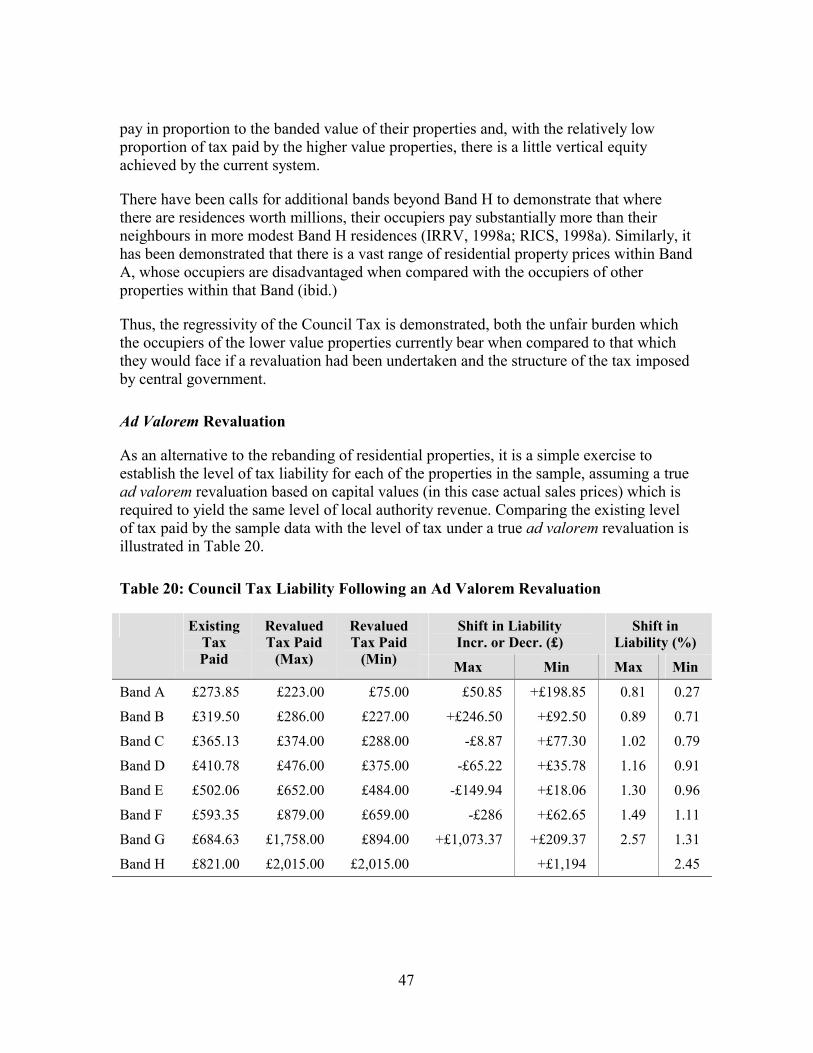
47
pay in proportion to the banded value of their properties and, with the relatively low proportion of tax paid by the higher value properties, there is a little vertical equity achieved by the current system.
There have been calls for additional bands beyond Band H to demonstrate that where there are residences worth millions, their occupiers pay substantially more than their neighbours in more modest Band H residences (IRRV, 1998a; RICS, 1998a). Similarly, it has been demonstrated that there is a vast range of residential property prices within Band A, whose occupiers are disadvantaged when compared with the occupiers of other properties within that Band (ibid.)
Thus, the regressivity of the Council Tax is demonstrated, both the unfair burden which the occupiers of the lower value properties currently bear when compared to that which they would face if a revaluation had been undertaken and the structure of the tax imposed by central government.
Ad Valorem Revaluation
As an alternative to the rebanding of residential properties, it is a simple exercise to establish the level of tax liability for each of the properties in the sample, assuming a true ad valorem revaluation based on capital values (in this case actual sales prices) which is required to yield the same level of local authority revenue. Comparing the existing level of tax paid by the sample data with the level of tax under a true ad valorem revaluation is illustrated in Table 20.
Table 20: Council Tax Liability Following an Ad Valorem Revaluation
Shift in Liability Incr. or Decr. (£)
Shift in Liability (%)
Existing Tax Paid
Revalued Tax Paid
(Max)
Revalued Tax Paid
(Min) Max Min Max Min
Band A £273.85 £223.00 £75.00 £50.85 +£198.85 0.81 0.27
Band B £319.50 £286.00 £227.00 +£246.50 +£92.50 0.89 0.71
Band C £365.13 £374.00 £288.00 -£8.87 +£77.30 1.02 0.79
Band D £410.78 £476.00 £375.00 -£65.22 +£35.78 1.16 0.91
Band E £502.06 £652.00 £484.00 -£149.94 +£18.06 1.30 0.96
Band F £593.35 £879.00 £659.00 -£286 +£62.65 1.49 1.11
Band G £684.63 £1,758.00 £894.00 +£1,073.37 +£209.37 2.57 1.31
Band H £821.00 £2,015.00 £2,015.00 +£1,194 2.45

48
Analysis demonstrates that, following an ad valorem revaluation for properties sold up to £30,000 (Band A), the annual tax bill is reduced from a flat £319.50 for each property to a range of £75-£223, depending on the actual value. At the higher end of the value scale, properties in Band G would pay between £894-£1,758 per annum, with the highest value property facing a tax bill of £2,015 (as compared with a rebanded tax level of £821 per annum).
It would be reasonable to expect the more valuable properties to face an increased liability under an ad valorem-based revaluation, assuming the same level of revenue is to be raised. Nevertheless, it is the impact of an ad valorem revaluation at the lower end of the scale which demonstrates the severity of the regression of the existing banded system of Council Tax. Properties within revised Bands A and B would all benefit from the liability reductions resulting from a true ad valorem tax base, paying between 0.81% and 0.27% of a rebanded Band A and between 0.89% and 0.71% of a rebanded Band B tax rate.
Conclusions to Case Study
The hypothesis of the research is that regular and frequent revaluations are necessary to ensure horizontal equity within an ad valorem tax, and that banding of property values does not obviate the need for such revaluations. The research has demonstrated that if a rebanding were to be undertaken, based on existing bands and as at a valuation date of 1997-98, significant shifts in properties from one band to another would result, with the corresponding changes in tax liability.
This research is based on sample data and, in some cases, the results must be of limited use. Nevertheless, these limitations have been clearly identified and conclusions drawn reflect this. Obviously, access to a greater volume of data would have enabled additional analysis to be undertaken and stronger conclusions drawn.
However, it is clear that the existing bands are not robust enough to reflect the significant shifts in the residential property market of south east Wales over such a large period of time since the 1991 valuation date and it is evident that it is the poorest (defined as those who occupying the least valuable properties) who would benefit most from a revaluation—the corollary being that it is the richest (defined as those who occupy the most valuable property) who are benefiting from the failure to revalue the tax base.
“Fairness” (defined as “perceived as fair by the public” (HMSO, 1991)) was one the criteria on which the Council Tax was based. “Fairness” implies a range of parities including horizontal equity and vertical equity. It is evident from the analysis that the existing Council Tax bandings no longer maintain horizontal equity and original levels of vertical equity (which has always been capable of improvement) now demonstrate increased regressivity and unfairness.
49
The perception of the public is that the Council Tax is a tax based on property values and therefore, (unlike its predecessor), that there are safeguards built in to protect the poorest (those living in the lower value properties). This is true to the extent that those whose income is insufficient to pay their bills receive state support. (There is also the automatic reduction of 25% of the bill for those taxpayers who live alone, regardless of their income or the value of their properties.) However, as time continues to pass and property values continue to change, the unfairness in terms of both horizontal and vertical equity of the existing bands will become increasingly obvious.
Nor is a shift in the upper and lower levels of the bands sufficient to resolve this problem. There are properties in the data sample currently included as Band E properties which, on rebanding, enter Band C. Only a complete revaluation, and ideally the introduction of a system of frequent and regular revaluations based on a true ad valorem will resolve this issue.
Banding of properties was, in 1991, a useful and pragmatic solution to a social and fiscal crisis. However, over-optimism of its ability to provide a stable and reliable tax base which is based on property prices in a volatile housing market means that the banded system has been stretched to the limit and the British public has demonstrated (Plimmer, 1994 and 1998) that it will not accept a blatantly unfair taxation system.
The current British government, which is in the middle of a major legislative programme of reform (including reforms of local government finance), fails to perceive reform or even a rebanding for Council Tax as a priority. The sophisticated techniques and the necessary technology exist within the UK to undertake a true ad valorem revaluation of domestic property (for example, McCluskey 1996 and 1997) and to maintain such a tax base with a computerised three-yearly programme of revaluations. Indeed, the Valuation Office Agency undertakes similar work for quinquennial revaluations of non-domestic property. Such a reform would place the domestic tax base (and thereby a significant portion of local authority income) on a secure and reliable footing, ensuring and demonstrating optimum horizontal and vertical equity for the taxpayers of the country.
Acknowledgements:
The authors acknowledge, with thanks, the support of Darlows of Newport and Michael Traynor & Company, Cardiff in the collection of data for this research.
50
Part V: Policy Issues
Introduction
This part of the report addresses a number of policy issues which have been identified through the research. Although the preceding case studies deal with different kinds of ad valorem tax systems, it is evident that similar problems have emerged. In considering the reform of rating in Northern Ireland, the experiences of seven years of the Council Tax within the remainder of the UK must be recognised. Also relevant, is the political aspect, and the views and intentions of central government which are discussed, in the light of informed comment.
Administration
The rating system in Northern Ireland and the Council Tax in the rest of the United Kingdom have proven to be success stories in terms of administration. Both systems are, by and large, accepted by those liable to the tax, as evidenced by the relatively low levels of non-payment (for 1998/99 the collection rate for England was 95.6% and for Northern Ireland 98.9%). The general view is that simplicity and fairness should lead to an efficient system: if billing and collection is straightforward then administrative costs can be kept at a minimum. Equally, if taxpayers perceive the bills to be “fair,” the need for expensive appeal and enforcement measures can also be minimised.
Since 1993, the previous UK administration argued that the Council Tax has operated successfully from the administration and collection viewpoint of local and central authorities but with the advent of a new Labour Government in 1997 and there was an election pledge to “modernise local government” to be fulfilled. Consequently, in early 1998 the Government published a series of Green Papers (discussion documents) inviting comments and debate on its proposals for modernising local government in this country.
As far as Council Tax is concerned, central government’s view is well documented:
The council tax is working well as a local tax. It has been widely accepted and is generally well understood…. While there are always opportunities for improvement, there are no fundamental problems that need attention. The Government has decided that raising standards of council services and making councils more accountable to the people they serve are more pressing priorities, and that any adjustments to council tax should be make at a later date. (DETR, 1998c)
The council tax has proved simple to administer…. Collection rates for the council tax are considerably higher than they were for the community charge. (DETR, 1999b)

51
Indeed, English local authorities have collected 95.6% of Council Tax payable for 1998/99 which represents an improvement of 0.1% over collection figures for the same period last year (DETR, 1999a).
Banding
The New Oxford Dictionary (1998) defines banding as ‘the division of something into a series of ranges or categories (used especially in financial contexts)’ and gives as a fiscal example: ‘the earnings-related banding of contributions.’
There are two other examples that can be drawn, with particular reference to property appraisal practice in the UK. We are, in this paper, concerned with the banding of capital values of domestic properties for Council Tax purposes (which has already been described in detail in the above case study) but the Valuation and Appraisal Manual (the so-called “Red Book” produced by The Royal Institution of Chartered Surveyors, RICS, 1995) does take on board another recommended practice of ‘banding’ in a quite different sphere (refer ibid. in Guidance Note 5.4.2), thus:
It is frequently difficult, if not impossible, to put a precise life on a building or group of buildings and Valuers may, therefore have to resort to ‘banding’ of lives. Information should be available to identify buildings which are unlikely to remain beyond, say, 20 years, and at the other extreme buildings with a life of more than, say, 50 years should be noted as having a life of ‘not less than 50 years’. It is apparent that the Valuer’s task is made easier by the use of broad bands and in the majority of cases it is likely these will meet the company’s requirements.
It is pertinent now to consider the theory underpinning the adoption of banding as compared with the alternative of assessing discrete figures:
�� it makes the Valuer’s task easier (refer ibid.);
�� it is a quicker process, when timing is important, as with the required rapid imposition of the Council Tax (HMSO, 1991; Lawson, 1991;
�� it is a cheaper process, when costing is important, which was clearly a determining factor in the selected operation of the Council Tax as a solution to domestic rating problems (HMSO, 1991);
�� it is a robust system that should be capable of containing value movements within its broad framework and therefore could extend the useful life of the initial Council Tax bands;
�� the appeal challenge from Council Taxpayers is lessened because banding affords a less precise area of valuation dispute; and
52
�� it allows for a process of competitive tendering by using the expertise of the private sector.
Indeed, speed, cost and ease of production were all reasons given for the banding of properties when the Council Tax was introduced in 1993 (HMSO, 1991). The urgent need to replace the Community Charge, which had resulted in social unrest, civil disobedience and the beginning of a culture of non-payment of tax, silenced those critics who advocated a true ad valorem capital revaluation and pacified those who found errors in banding.
Nevertheless, such an urgency has now passed and despite the government’s large programme of reform, it continues to recognise the advantages of banding property values for tax purposes:
The strength of a property based tax rests on the robustness of the valuation of property on which it is levied. Council tax was designed to avoid the problems of the earlier rates system by placing properties into wide valuation bands. The banding system means that there have to be major changes in relative property prices before significant numbers of households are being unfairly treated. This makes it possible to extend the period between expensive and potentially disruptive revaluations, particularly as the cost of a revaluation is over £100 million. (DETR, 1998)
However, there is the general difficulty, common with most banding exercises, of accurate band allocation when dealing with any subject items that are ‘on the cusp’ between bands. But, pragmatically, it is a reasonable assumption that, in Council Tax banding, the benefit of any doubt should be given by the valuer/appraiser to the taxpayer in terms of allocating to the lower rather than the higher band.
Incidentally, a similar practical stance is also taken by the UK’s Inland Revenue in dealing with income tax matters, where the taxpayer is given the benefit of rounding down sourced income items and rounding up tax credits.
The Council Tax was introduced within eighteen months of the announcement of a replacement for the Community Charge, and, at the time of its introduction, the arguments supporting banding i.e. that it was a quick, cheap and practical means of providing a capital value tax base, were strongly propounded by the politicians.
Since then, the Council Tax has largely been accepted as a residential tax and is expected to endure for an extensive period. Criticisms from informed commentators, however, concentrate on the implementation of the tax. This was part of the response from the Institute of Revenues, Rating and Valuation (IRRV) to the government’s consultation document:
53
Splitting Band A into two or more bands would have the potential to reduce the Council Tax bills of those living in the properties with the lowest values. There is a strong positive correlation between residency in the lowest council tax band and receipt of council tax benefit. As a result, splitting Band A would be very likely to reduce the total cost of council tax benefit, which is currently borne by the Exchequer.
There is also merit in altering the ratios of taxes paid by taxpayers in different bands. Currently, a taxpayer in a Band H property pays three times the level of Council Tax paid by a resident in a Band A property, yet their property is worth at least eight times as much. (IRRV 1998).
The RICS’s response echoed the IRRV’s concern:
What is quite undeniable is that the banding exercise carried out when the Council Tax was introduced is now becoming tainted with inaccuracy…due to the increasing value of certain types of residential accommodation when compared with others in the same geographical locus and, in some cases, a general reduction in value of other types of accommodation often due to economic influences…. Seven years is a very long time in any market, and especially so in the volatile and reactive residential housing market.
It is particularly galling for a Council Tax payer to see a neighbouring house which has been substantially extended and modernised, and thus greatly increased in value, remaining in the same band as his or her own which may not have undergone such a change. The comments by such persons is that the system needs changing or, more likely, that a revaluation is overdue. Such a revaluation would go a long way to obviating many of the criticisms levelled at the current Valuation lists, and it is accordingly recommended that early consideration be given to such an exercise. (RICS, 1998)
Thus, criticisms centre on the details of the structure of the Council Tax. But as the second case study within this report indicates, the initial allocations for banding now have reached a questionable “sell by date” and the arguments for an ad valorem revaluation or at least a rebanding are looming large.
But what that form of revaluation or rebanding should take is still moot and we argue in this paper that it is time to take advantage of the available modern technology of mass appraisal which is well established in other parts of the world. This could entail a discrete valuation process, easily subsumable into a wider range of band allocations, with the added opportunity of frequent updating at minimised cost and effort. Vertical equity also demands a greater link between relative banded values and the level of tax imposed on those bands in order to reduce the currently high level of regression.
54
Revaluations
If real property values never changed in the market, then reassessment of a property tax base would never need to be performed. But, in the real world property, values do change; the magnitude and frequency of these changes varying between property types. In addition, there are inter-regional and intra-regional variations which can only be reflected by reassessment.
Revaluation lags is one of the most significant problems associated with the ad valorem property tax. No matter how well the property tax is designed, unless this defect in implementation is remedied, the tax will have significant undesirable effects. The nature of the landed property tax requires an accurate and up-to-date valuation list/roll. Failure to meet either of these two criteria impinges upon the quality of the tax in terms of achieving horizontal and vertical equity. In addition, if assessed values have little relationship to current values, the principle of uniformity is contravened and the objective of endeavouring to achieve uniform effective tax rates is not attainable.
Central government has accepted (DETR, 1999) that a revaluation:
…should not be used to increase the average council tax bill…. The revaluation would be purely and simply to bring property values up-to-date. A revaluation would of course provide an opportunity to reconsider the relative bills for different bands. At this stage, the Government has no views on whether any changes are justified…. Although a revaluation would not shift the total tax yield or average tax bill nationally, it would inevitably have an impact on individual local authorities…. Such changes are likely to influence the willingness of local voters to support council tax increases. These are inevitable consequences of a revaluation but they are not arguments against revaluation itself, if and when one is required in the interests of fairness to council tax payers generally.
In relation to the two case studies, there is clear evidence of the problems associated with the failure of the respective governments to institute a programme of revaluations. IRRV published research in 1995 that explored the need for regular revaluations for Council Tax properties. This research identified five main reasons for regular valuation:
�� failure to revalue leads to inequity between Council Tax payers;
�� failure to revalue leads to inequity between local authorities;
�� as property prices move away from their April 1991 values, the confidence that council tax payers have in the tax will be undermined;
�� as time goes on, it becomes harder to place accurate values on new properties, especially those of unusual design or construction;
55
�� it becomes increasingly difficult to place values on properties situated in areas that have markedly changed since April 1991.
The Government does however concede that ‘a revaluation is bound to be needed at some stage.’ Experience since the 1973 revaluation for non-domestic rates demonstrates that it is very difficult for Governments to admit that that point in time has come.
It has been suggested that a revaluation would also take a minimum of two years to complete and implement, once the decision is taken by Ministers to proceed. Thus, if ministers wait until there is a high level of public criticism of Council Tax valuations before deciding to initiate a revaluation, it would take two years to take effective action to counter those criticisms, during which time public discontent would be likely to grow. This underlines the need to commit to revaluations on a regular basis in primary legislation (as has been the case for non-domestic rates since 1990 in England and Wales).
Automated valuation approaches
To apply a system of ad valorem property taxation requires a commitment by government to ensure that the property values upon which the tax liability is predicated represents true values within the market. There is, therefore, a responsibility placed upon government to ensure that assessed values are periodically updated to reflect the movements and variations in property values since the last revaluation.
The scale and cost of the revaluation task has often been the excuse relied upon by the UK government to delay, cancel or postpone general revaluations. In Northern Ireland, the track record for regular revaluations is not particularly good; revaluations for domestic property took place in 1939, 1956 with the last one being in 1976; England and Wales has faired little better having revaluations in 1933, 1956, 1963, 1973 and the last in 1991. Whilst accurate figures for the total cost or unit cost of a general revaluation are not available, there are, however, indications as to the likely cost. Government figures suggest that to undertake a domestic revaluation of around 22 million houses would cost in the region of £100 million. Given figures like this, it is not surprising that revaluations are not considered a major priority.
It is now considered as international best practice that the assessment function be as highly automated as possible. There has been considerable progress in the research and development of computer assisted mass appraisal (CAMA) systems (for example, McCluskey and Adair, 1997) with the sole purpose to assist valuers in undertaking mass valuations. Mass appraisal techniques rely primarily on multiple regression approaches; however, other systems have been developed utilising adaptive estimation procedures, comparable sales analysis, artificial neural networks, expert systems and genetic algorithms.

56
Many countries including the United States, Canada, Hong Kong, Australia and Singapore employ a variety of techniques and processes aimed specifically at reducing the time and cost of revaluations whilst maintaining a high degree of valuation accuracy. CAMA systems create the environment to revalue large numbers of properties quickly and thereby reducing the time span between revaluations. It is clearly imperative that such systems be utilised within Northern Ireland and the rest of the United Kingdom.
Property tax bases
As the property tax is an ad valorem, tax it is important that the choice of tax base be directly linked to the predominant form of land tenure and land holding, because as property transaction evidence is central to the assessment process, it is important that the basis of valuation be directly related to the market. For example, if residential property is transacted in terms of capital value it is logical that the basis of assessment also be based on capital value. Indeed, if it is not based on the prevailing form of tenure, issues of comparables and the comprehensibility of the system for the taxpayer become problems.
Following on from this, it would make sense that if the pattern of holding, say commercial property, is by means of rental agreements, then this would be the optimal property tax basis. This ensures that there is sufficient primary open market transaction evidence upon which to base the assessments objectively. This in turn provides the necessary evidential support for any challenges to the assessed values.
If one accepts that the optimal basis for the property tax should be highly correlated with the basis of transacting property, then from the perspective of Northern Ireland, the domestic property tax is non-optimal. In this case, residential property is bought and sold on the capital market, owner occupation is in the region of 70% with open market rental evidence being less than 4%. The current domestic property tax is based on rental evidence therefore, the conclusions of this research indicate that if a revaluation is to be undertaken, the basis of valuation should change to reflect the market evidence. In other words, the system should replace annual rental values with capital values.
The decision was made for the rest of the United Kingdom when the Council Tax was introduced and capital values for residential property exist alongside annual rental values for non-domestic property. What is lacking is the political will to produce a reliable, stable and up-to-date tax base.
Local Accountability
Despite the stated aim of local accountability in the 1991 reforms which resulted in the Council Tax (HMSO, 1991), the current UK government has no intention of permitting local authorities to make big increases in Council Tax which would (some argue) make people more aware of the activities of the local authority.

57
Thus, despite the presentation of the Council Tax as a local authority tax, there continues to be strong control exercised over its level by central government. Indeed, even though central government’s “capping” provisions (which limit local authority spending and thereby the level by which Council Tax can be increased) have been suspended for 1999-2000, their need will be reviewed in the light of the levels of Council Tax fixed by local authority over a two year period.
The Government has an interest in the level of council tax and a responsibility to local taxpayers. It will not shirk this responsibility and will retain the powers to step in and protect local taxpayers from excessive increases if necessary. (DETR, 1999b)
Final observations
The Government’s political response to the current Council Tax situation is to leave well alone, despite some pre-election posturing over the need for fairer revisions. The striving for administrative efficiency in terms of the collectability of the tax seems to take clear precedence over any issues of inequity in its operation or unfairness to taxpayers, as indicated in the invitation to respond to its Green Paper consultation document.
Professional opinion seems to unite on the need for revisions to the rigidity of the extant banding system in order to curb (but not necessarily to cure) its inherent regressivity. Furthermore, the principle of frequent revaluations is undeniably logical for any professional valuer trying to maintain a sound standard of assessment practice and for any taxpayer who sees house prices rise and fall but no change in the relative tax bills.
It is appropriate that the two leading representative Institutions have made the revaluation case in their submissions but, unfortunately, it would seem that the Government is content to avoid the issue (perhaps on the grounds of expense or greater priorities), rather than to face up to the necessity of a fairer valuation base.
From the social viewpoint until there is more public disquiet over the incidence of the tax, it seems unlikely that there will be any initiative from the Government to make any radical change in the status quo.
Reform within Northern Ireland has no doubt been delayed as the political debate surrounding the peace process takes centre stage. Similarly, with the establishment of a devolved government and power-sharing, there are many major issues facing the politicians and priorities need to be established.
However, if the matter of reforming the source of local authority finance is not addressed urgently, then the stability of local authorities as a tier of government in the Province could become suspect. A revaluation on a revised tax base would take some two years to implement, even with modern technology. This process must be set in motion as a matter of urgency.
58
The current UK government (DETR, 1999b) has linked the problems of revaluation and banding together:
When a revaluation is required, this will provide an opportunity to consider council tax bands. Decisions about whether there should be new valuation bands, or different ratios between bands, will be based on the fairness of the existing bands at that time rather than as a means of increasing tax yield from the current council tax base…the current valuation base remains broadly acceptable and is likely to remain so for the next few years. It has not, therefore, planned to carry out a revaluation in the course of this Parliament. It will carry out a revaluation during the next Parliament if it proves necessary.
This paper has demonstrated the importance of regular and frequent revaluations within the UK, by investigating two very different systems for taxing residential properties. The research will continue to investigate issues of unfairness and inequity within property taxation systems and publish the results as appropriate.
Further Research
The extension of the research, which is planned from mid-2000, will be to undertake an international investigation of aspects of equity and fairness by posing the following questions:
�� what is understood by “equity” and “fairness” by the interested parties within the real property taxation systems implemented by each country under examination?
�� to what extent are equity measures adopted within the various administration systems?
�� what are the characteristics of the appraisal methods used and what are their relevance to the objective of taxation equity?
�� does the basis of the system allow for the quantification of assessment equity and does such identification necessarily lead to rectification of defaulting standards?
�� within the context of the system, what are the benefits of measuring equity?
�� what criteria can be used to identify “fairness” in real property taxation, according to the perception of the taxpayers from different cultures?
The methodology for the future development of this research will consist of:
�� an on-going literature search, conducted as a desk study, from a base of the literature surveys already undertaken by the research team;
59
�� investigative techniques to elicit views, opinions and facts from concerned bodies in order to evaluate the efficiency and equity of the tax base and the fairness of the tax impositions upon the taxpayers;
�� the investigations will focus on the concepts of equity (horizontal and vertical) and fairness within ad valorem real property taxes and the cultural influences which affect the perception of “fairness” within different cultural environments; and
�� evaluative models to measure inequity, such as effective and nominal tax rates and techniques to address equity, such as regular revaluations, the basis of value (i.e. market value) and effective tax rates.
In pursuit of this development, the research team is seeking access to a large volume of property data with which to produce evidence to demonstrate how the banded Council Tax can provide improved equity and fairness to taxpayers.
In addition, the research will centre on perceived fairness of property valuation systems around the world, in order to identify factors by which the operation of the property tax system can be objectively and efficiently measured. In this approach, we are reminded of the approach reported by Verbrugge (1997) who stated that to make property taxation more acceptable and accepted, the taxpayer must be regarded as a “customer” and, further, that in all cases, the taxpayer should be considered as a respected “client”, even in difficult circumstances. Who, after all, is paying the bill?
60
References and Bibliography
Beaumont, M. S. (1992) Optimal property taxation in California. Review of Urban and Regional Development Studies. pp. 162-178. USA.
Beaumont, M. S. (1994) The Property Tax in California: Acquisition Value Taxation and Parcel Taxes. Paper presented to the Property Taxation Committee of the National Tax Association in Charleston, South Carolina, USA.
Callan, T. (1991) Property Tax: Principles and Policy Options, ESRI Policy Research Series, Paper No. 12, Dublin, Ireland.
Connellan, O. P., and Plimmer, F. (1996) Is market value a desirable basis for property taxation? Paper presented at the ERES Conference, Northern Ireland, UK.
Connellan, O. P., McCluskey, W. J., Vickers, A. (1998) The Surveyor’s Role in Land Value Taxation. Paper presented at the FIG (International Federation of Geometers) XXI International Congress, Brighton, UK.
Crawford, M. and Dawson, D. (1982) Are Rates the Right Tax for Local Government? Lloyds Bank Review, July, pp.15-35. UK.
Davies, K. (1984) Law of Compulsory Purchase and Compensation. Butterworths, UK.
De Cesare, C. and Ruddock, L. (1998) A New Approach to the Analysis of Assessment Equity, Appraisal Journal, March/April, pp. 57-69. USA.
Department of the Environment (1981) Alternatives to Domestic Rates, Cmnd 8449, HMSO, London, UK.
Department of the Environment (1986) Paying for Local Government, Cmnd 9714, HMSO, London, UK.
Department of the Environment (1997) Northern Ireland Housing and Construction Bulletin. London, UK.
Department of the Environment, Transport and the Regions (1998a) Modernising local government: Improving local financial accountability, DETR, London, UK.
Department of the Environment, Transport and the Regions (1998b) Modernising local government: Business rates, DETR, London, UK.
Department of the Environment, Transport and the Regions (1998c) Modernising local government: in touch with the people, DETR, July, London, UK.

61
Department of the Environment, Transport and the Regions (1999a) Council Tax and Non-Domestic Rates Collection Results 1998/99 http://porch.ccta.gov.uk/coi/coipress.nsf/?open
Department of the Environment, Transport and the Regions (1999b) Government’s Response to the Environment, Transport and Regional Affairs Committee’s Report http://www.loca-regions.detr.gov.uk/response/lgfin/index.htm July.
Elder, B. L. (1993) Residential Property as a Basis for local Taxation, paper presented at the Fourth Australian Real Estate Educator’s Conference, Auckland, New Zealand.
Evans, A. (1976), Commentary on the Effect of Changing the Basis of Rating Domestic Property, Layfield Report, Appendix 10 9/B8. UK.
Farrington, C. (1992) Director’s Notes, Insight Journal of the Institute of Revenues Rating and Valuation, UK, April. p. 2.
Giles, C., and Ridge, M. (1993) Right this time? An analysis of the first year’s Council Tax figures. Institute of Fiscal Studies. London, UK.
HMSO (1992) Council Tax (Contents of Valuation Lists) Regulations 1992 (SI 1992 No. 553) Her Majesty’s Stationery Office, London, UK.
HMSO (1992) Council Tax (Liability for Owners) Regulations 1992 (SI 1992 No. 551) Her Majesty’s Stationery Office, London, UK.
HMSO (1992) Council Tax (Situation and Valuation of Dwellings) Regulations 1992 (SI 1992 No. 550) Her Majesty’s Stationery Office, London, UK.
HMSO (1992) Council Tax (Exempt Dwellings) Order (1992) (SI 1992 No 558) (as amended) Her Majesty’s Stationery Office, London, UK.
HMSO (1993) Council Tax (Alteration of Lists and Appeals) Regulations 1993 (SI 1993 No. 290) Her Majesty’s Stationery Office, London, UK.
HMSO (1993) Council Tax: Practice Note No. 9 - Recovery and Enforcement (Revised September 1993) (prepared by the Department of the Environment, the Welsh Office, and associations of local authorities) Her Majesty’s Stationery Office, London, UK.
HMSO (1994) Council Tax: Practice Note No. 5 - Administration (including billing and collection (Revised April 1994) (prepared by the Department of the Environment, the Welsh Office, and associations of local authorities) Her Majesty’s Stationery Office, London, UK.
HMSO (1976) Local Government Finance: Report of the Committee of Inquiry Her Majesty’s Stationery Office, Cmnd 6453 (The Layfield Report). London, UK.
62
HMSO (1981) Alternatives to Domestic Rates Her Majesty’s Stationery Office, Cmnd 8449. London, UK.
HMSO, (1983) Rates—proposals for rate limitation and reform of the rating system Her Majesty’s Stationery Office, London, UK.
HMSO (1986). Paying for Local Government. Her Majesty’s Stationery Office, Cmnd 9714. London, UK.
HMSO (1991) A new tax for Local Government. Her Majesty’s Stationery Office, London, UK.
HMSO (1994) Council Tax (Alteration of Lists and Appeals) (Amendment) Regulations 1994 (SI 1994 No. 1746) Her Majesty’s Stationery Office, London, UK.
HMSO (1998) Modernising Local Government: Improving Local Financial Accountability. Department of Environment, Transport and Regions. London, UK.
IAAO (1997) Standard on Property Tax Policy, International Association of Assessing Officers, Chicago, USA.
Institute of Revenues Rating and Valuation (1998a) IRRV Response to DETR Consultation Paper on improving local financial accountability, Institute of Revenues Rating and Valuation, London, UK.
Institute of Revenues Rating and Valuation (1998b) IRRV Response to DETR Consultation Paper on Business Rates, Institute of Revenues Rating and Valuation, London, UK.
Institute of Revenues Rating and Valuation (1997) Principles for Local Government Finance. The Institute of Revenues Rating and Valuation, London, UK.
International Association of Assessing Officers (1997) Property Standard on Property Tax Policy Standard—Draft 4. International Association of Assessing Officers. Chicago, USA.
Inland Revenue Commissioners v Clay & Buchanan [1914] 3 KB 466 [1914] 1 KB 339.
King, M. A. and Atkinson, A. B. (1980) Housing Policy, Taxation and Reform, Midland Bank Review, Spring, UK.
Lawson, David. (1991) Westminster Watch Estates Gazette [1991] 30EG22.
Layfield Committee, (1976) Report of the Committee of Inquiry into Local Government Finance, Cmnd 6453, HMSO, London, UK.
63
Lichfield, N., and O. P. Connellan. (1997) Land Value and Community Betterment Taxation in Britain: History, Achievements and Prospects. Lincoln Institute of Land Policy. Cambridge, Mass USA.
Lizieri, C., Hattersley, W. H. and Chandler, J. (1989) The Use of Capital Values for Domestic Rating in England and Wales: A Research Report, Institute of Revenues, Rating and Valuation, London, UK.
McCluskey, W.J. (1991) Comparative Property Tax Systems. Gower Publishing Company. UK.
McCluskey, W. J. (1996) Predictive Accuracy of Machine Learning Models for Mass Appraisal of Residential Property, New Zealand Valuers’ Journal, July, pp. 41 - 47.
McCluskey, W. J. (1997) A critical review of computer assisted mass appraisal techniques in McCluskey, W. J. and Adair, A. S. (Eds), Computer Assisted Mass Appraisal: An International Review, Ashgate Publishing Company, Aldershot, UK. pp. 1-25.
McCluskey, W. J., Plimmer, F., Connellan O. P. (1997) Landed Property Tax – the best of all possible worlds? Paper presented at The Royal Institution of Chartered Surveyors’ Cutting Edge Conference, Dublin. Ireland. http://www.rics.org.uk/research/conferences/
McCluskey, W. J., Plimmer, F., Connellan O. P. (1998) Inequities in Property Taxation, presented at the International Conference of the International Association of Assessing Officers, Orlando, Florida, USA.
McCluskey, W. J., Plimmer, F., Connellan O. P. (1998) Ad Valorem Property Tax: Issues of fairness and equity. Assessment Journal Vol 5, No 3 pp.47-55.
McCluskey, W. J, Plimmer, F., Connellan O. P. (1998) Taxation of Landed Property Tax—Fairness to the Taxpayer, presented at the Joint Conference of the European Real Estate Society and the American Real Estate and Urban Economics Association, Maastricht, The Netherlands.
McCluskey, W. J., Plimmer, F., Connellan O. P. (1999). Reform of UK Local Government Domestic Taxes, Journal of Property Management, Vol 17 No 4 pp. 336 – 352.
McDowell, M. (1990) Property Taxation and Local Authority Finance, Irish Business and Administrative Research, Vol. 11, pp. 1-12.
Morch-Lassen, G., and Pedersen, J. (1994) Computerised Property Valuation and Taxation. in Denmark. Paper presented to the International Conference on Property Taxation - the Way Forward. Dublin, Ireland.

64
Muellbauer, J. (1980) The Great British Housing Disaster and Economic Policy, IPPR, London, UK.
Mushkin, S. J., and Bird, R.M. (1972). Public Prices: An Overview. in Public Prices for Public Products, ed. S. J. Mushkin. Urban Institute. Washington D.C., USA.
Netzer, D. (1966) Economics of the Property Tax. The Brookings Institution,
Washington D.C., USA.
O,Brien, M. H. (1989) Whatever Happened to Rates? A Study of Irish Tax Policy on Domestic Dwellings, Administration, Vol. 37, pp. 334-351.
O’Hagan, J., McBride, P., and Sanfey, P. (1985), Local Government Finance: The Irish Experience, British Tax Review, Vol. 4, pp. 235-254.
Page, C. S. (1980) Rates - The Right Tax for Local Government, Rating and Valuation Reporter, October, pp. 229-234.
Plimmer, F. (1994) Five Years of Local Government Taxation in Britain, Paper presented to the International Conference on Property Taxation - the Way Forward. Dublin, Ireland.
Plimmer, F. (1998) Rating Law and Valuation. Addison Wesley Longman, Essex, UK.
Ridge, M. and Smith, S. (1990) Local Government Finance: The 1990 Reforms, Institute for Fiscal Studies, London, UK.
Ridge, M. and Smith, S. (1991) Local taxation: The Options and the Arguments, Commentary No. 22, Institute for Fiscal Studies, London, UK.
Royal Institution of Chartered Surveyors (1995) RICS Appraisal and Valuation Manual, (The Red Book) The Royal Institution of Chartered Surveyors, London, UK.
Royal Institution of Chartered Surveyors (1998) Modernising local government: Improving local financial accountability - Comments from the Royal Institution of Chartered Surveyors, The Royal Institution of Chartered Surveyors, London, UK.
Sandford, C. (1992) Economics of Public Finance, Pergamon Press, Oxford, UK.
Smith, A. (1776) The Wealth of Nations, University of Chicago Press. Chicago, USA.
Smith, S. R. and Squire, D. L. (1987) Local Taxes and Local Government, Report Series No. 25, Institute for Fiscal Studies, London, UK.
Trocette Property Co. Ltd. v. Greater London Council [1973] 27 P&CR 256.

65
Trotman-Dickenson, D. I. (1996) Economics of the Public Sector, Macmillan, London.
Verbrugge, H. (1997) Collection and Enforcement. Paper presented at Conference on Designing Local Government for South Africa. University of South Africa, Pretoria, South Africa.
Wagner, R. E. (1991) Charging for Government: User Charges and Earmarked Taxes in Principle and Practice. Routledge. London, UK.
Ward, M., Zebedee, J. (1990) Guide to the Community Charge Institute of Housing, SHAC and CPAG, London, UK.
Wilks, H. M. (1975) Some reflections on the second valuation of Whitstable. Land & Liberty Press Ltd., London, UK.
Woolery, A. (1989) Property Tax Principles and Practice. Cambridge: The Land Reform Training Institute in association with the Lincoln Institute of Land Policy. USA.
Youngman, J. M. (1997) Henry George, Property Rights, and Taxation. In Land Use and Taxation, ed. Brown, J. H., Lincoln Institute of Land Policy. Cambridge, USA.
Youngman, J. M., and Malme, J. H. (1994) An International Survey of Taxes on Land and Buildings. Kluwer Law and Taxation Publishers. The Netherlands.
66
Appendix—Background to the Council Tax
Local Taxation Reform in England and Wales 1990
In April 1990, following years of criticisms of the pre-1990 system of local property taxation (see, for example, HMSO, 1976; HMSO, 1981; HMSO, 1983), wide-ranging consultations, sundry discussion documents and various proposals (ibid.), the British government introduced a radical reform of local landed property taxes in England and Wales.
The major changes involved removing the property tax on commercial property from the control of municipal authorities and creating a national non-domestic rate, fixed by central government but levied, collected and spent by local authorities. This reform was accompanied by the first revaluation of the taxable non-domestic properties in seventeen years and, since 1990, quinquennial revaluations of the tax base have been implemented.
Despite pressure to return this tax to municipal control, it remains largely unaltered. Issues relating to the taxation of non-domestic property are not considered further in this paper (but see Plimmer, 1998).
Community Charge
The second major change was the introduction of a poll tax system, called the Community Charge, which replaced an annual property tax on domestic property with effect from 1 April 1990 (HMSO, 1986). The Community Charge was fixed by municipal authorities which imposed a flat rate tax on each adult resident in their area. Few exemptions were allowed (these included the severely mentally disabled and those in closed religious orders) and, as a concession to those with low or no income, a reduced 20% payment was required from students and those entitled to state benefit.
Taxpayers were identified, initially, through the electoral register, as well as from other sources e.g. all students enrolled for tertiary education were automatically notified to the Community Charge Registration Officer by the college authorities. This registration process resulted in the irrefutable claim that the Community Charge was a tax on the right to vote.
There was a property aspect to the tax, in that all Community Charge payers had to be resident within the local authority; also owners of second homes (i.e. a dwelling which was not the principal private residence of the owner, nor of anyone else) attracted a measure of the Charge. However, there was no relationship between the value of property and the amount of tax paid. (For further details, refer Plimmer, 1998; Ward and Zebedee, 1990).

67
The Community Charge was, therefore, a tax on the person, with no regard at all for the ability to pay of the individual and the British taxpayers (the Community Charge had, in fact, been introduced in Scotland in 1989) rejected it because of its inherent unfairness—it failed to reflect any measure of ability to pay at either end of the scale and even the 20% concession made to the poorest in the country imposed severe hardship.
Failure of the Community Charge
The Community Charge represented a significant shift from the original (1601) concept of “rates” as a means of raising money from the wealthy to support the poor, to the ‘everyone pays something’ philosophy characteristic of Margaret Thatcher’s period as prime minister. It was a rather curious and ill-fated solution to what was largely a political rather than a land taxation problem. It had been widely recognised that residential properties, previously valued to an annual rental value as at 1973, could not be revalued on that basis. The system of residential tenure in Britain had changed since 1973 to one of predominantly owner-occupation, and therefore there was a paucity of rental evidence on which to base a revaluation. It seemed logical therefore that the necessary reform should be merely one of a change of tax base from annual rental value to one of capital value (refer for example, Layfield Committee, 1976).
However, the political circumstances of the 1980s included a strong Conservative government pledged to control the nation’s economy and thereby reduce the levels of spiralling inflation. Without control over the massive spending power of local authorities, many of whom were run by Labour councillors, central Conservative government attempts to manage the country’s spending were thwarted by policies introduced by local authorities.
By removing a major source of finance from local authority hands, by requiring local authorities to administer an exceedingly unpopular tax on voters (many hundreds of thousands of which “disappeared” as a result of the Community Charge) and by limiting the level of Community Charge imposed (the only tax left in local authority hands), the Conservative government succeeded in its efforts to control local authority spending and, thereby, the nations’ inflation and economy.
Indeed, the full implications of the long-term effects of the poll tax are still being realised. The 1991 census figures were abandoned because some 1.2 million people were unaccounted for. One of the official reasons for this is the attempt by significant numbers of citizens to evade the Community Charge by failing to register as voters. It is also understood that municipal tax collectors check the winners of the UK’s national lottery against Community Charge payers to identify tax evaders.
The Community Charge had been introduced with a number of laudable aims:

68
�� technical adequacy—the importance of cost-effective administration, proper financial control; predictable yield; perceptibility of payment and compatibility with the overall national taxation system;
�� fairness—this was presented in the “green paper” which proposed the tax (HMSO, 1986) in terms of the “beneficial principle” and the “redistributive principle”, with the move from property-based services (e.g. utility and fire services) towards more personal services (e.g. education and social services) currently being provided by local authorities;
�� local democratic accountability—this required a widening of the taxpaying base, ensuring that a substantial number of electors had a direct financial interest in the decisions of their local authority and a clear linkage between changes in expenditure and changes in the local tax billing.
In principle, it is hard to argue that these aims were misguided. However, despite the warning given by its own consultation documents that “…the tax would be hard to enforce…expensive to run and complicated…,” the political decision was made that “These problems are not insuperable” (HMSO, 1986).
The public outcry, hostility against and political repercussions of the Community Charge and the defeat of Margaret Thatcher in the Conservative Party leadership election, resulted in Michael Heseltine (the then Secretary of State for the Environment) being given the task of providing an acceptable replacement for the Community Charge within just six months of its introduction.
Council Tax—Preparation
The consultation paper which set out the proposals for the Council Tax identified five principles (HMSO, 1991) which would underpin the replacement for the Community Charge. These are:
�� Accountability—ensuring that local taxpayers see a link between what they are required to pay and what their local authority is spending;
�� Fairness—not defined, except that the new tax should be “perceived as fair by the public”;
�� Ease of collection—administrative arrangements for collection and enforcement should be as straight forward as possible. The costs of administration should be reasonable in relation to its yield;
�� Equitable distribution of burden—the principle that most adults should make some contribution was, in the opinion of the consultation document, “widely accepted”;
�� Restraint—tax bills should not become too high, either because of unreasonable levels of spending by local authorities or because the system imposed a disproportionately high burden on any individual or household compared with others.

69
It was also intended that domestic taxpayers should meet a lower level of local authority expenditure under the Council Tax than under the Community Charge (i.e. about 14% for Council Tax rather than 25% for Community Charge) and that this new balance should be maintained in the longer term.
The Council Tax was introduced in the Local Government Finance Act 1992 (LGFA 1992) which provides for certain local authorities to levy and collect the Council Tax. The Council Tax is something of a hybrid tax in that it has two elements: a personal element, which makes up half of the bill; and a property element which makes up the second half of the bill. The Council Tax, therefore, betrays its predecessors (rates and the Community Charge) in that it is, in part, a tax on the value of the property and, in part, a tax on the number of individuals resident. It is, therefore, evident, that the so-called Thatcherite principle of everyone paying something had not been abandoned.
Council Tax—Levy
The Council Tax is fixed by each local authority for each financial year (1 April to 31 March). It is reported to the relevant Secretary of State and is published in the local press. Until 1999, central government retained the power to “cap” the spending of those local authorities which, in the view of central government, had fixed an excessive level of Council Tax. In this way, central government was able to encouraged or require restraint on behalf of the taxpaying public, despite the (stated) improved accountability link between the Council Tax payers and the municipal electorate.
Council Tax now represents about 24% of the income source for local authorities and remains the only tax which is (since 1991) solely under the control of the municipalities (see Figure 17). Thus, any flexibility which municipalities have in terms of the nature and level of services to be provided within a local authority area exists only within this income source (refer also Figure 18).
Council Tax—Liability
Liability for the Council Tax continues to rest with the “occupier”, who is responsible for paying a single bill for the household. The legislation in fact provides for a hierarchy, depending on the nature of the occupier’s interest in the property (s. 6, LGFA 1992). Thus, first priority is given to:
�� residents with a freehold interest in the property; next are �� residents with a leasehold interest; next are statutory or secure tenants; next are �� residents with a contractual licence to occupy; then come �� residents with no legal interest in the property; and finally
70
�� the owner (i.e. the person with a material interest in the whole or any part of the dwelling where at least part of the dwelling is not subject to a material interest inferior to his interest).
Thus, as with the pre-1990 rating system, liability for the Council Tax rests with the occupier, regardless of legal interest or, where there is no occupier, the owner.
There are also categories of dwelling where the owner rather than any occupier is liable for the Council Tax and these are dwellings where there is no single household and therefore collection may prove difficult (and, by implication, expensive). Such dwellings include nursing homes, houses of religious communities, and houses in multiple occupation (s. 8 (1) LGFA 1992 and the Council Tax (Liability for Owners) Regulations 1992).
Council Tax—Personal Element
The Council Tax takes into account the number of adults in each household by assuming a basic number of two (taxable) adults per dwelling. The personal element accounts for half of the tax bill and, where there are less than two (taxable) adults resident, a discount of 50% of the personal element is made (i.e. 25% of the entire bill). No additional amount of tax is charged where there are more than two (taxable) adults resident.
The most common number of adults per household is two (HMSO, 1991) and it was considered (ibid.) that by specifying two as the assumed number of adults, the number of households which would qualify for discounts would be minimised. It was also recognised (ibid.) that only a small minority of the adult population would not be taxed in this way, because the number of people who are third and subsequent adults living in households is only about four million.
For the purposes of the Council Tax, certain adults are “disregarded” and these include people who are severely mentally impaired, students, patients in hospitals and care workers. Where a dwelling is occupied by such adults or where they comprise one of the two occupying adults, their presence is “disregarded” for the purposes of calculating the personal element. Thus, where a property is occupied by two adults one of whom is a full-time student, only one adult is recognised within the Council Tax system and a 25% discount in the entire bill made.
Council Tax—Property Element
Half of the Council Tax bill relates to the value of the property occupied (or owned) by the taxpayer. Listing officers (valuation officers employed by the Valuation Office Agency and renamed for Council Tax purposes) were responsible for allocating each property to one of eight value bands and, with the exception of any variation in the
71
personal element, all households of dwellings within the same local authority area receive the same tax bill.
There are separate bands for England, Scotland and for Wales, (although the bands for England and Scotland are identical). The value bands and the relative liability of dwellings between these bands were established by Central Government (refer Tables 9 - 11).
A “dwelling” for Council Tax purposes is defined in relation the national non-domestic rate legislation and in relation to pre-1990 legislation, so that taxable units attract either the Council Tax or the national non-domestic rate liability.
Basis of Valuation The basis of valuation is capital value, subject to certain assumptions (para. 6 (1) Council Tax (Situation and Valuation of Dwellings) Regulations 1992). Thus:
…the value of any dwelling shall be taken to be the amount which, on the assumptions mentioned…below, the dwelling might reasonably have been expected to realise if it had been sold in the open market by a willing vendor on the 1st April 1991.
The assumptions are:
a. that the sale was with vacant possession;
b. that the interest sold was the freehold, or in the case of a flat, a lease for 99 years at a nominal rent;
c. that the dwelling was sold free from any rent charge or other encumbrance;
d. that the size, layout and character of the dwelling, and the physical state of the locality, were the same as at the date the valuation was made;
e. that the dwelling was in a state of reasonable repair;
f. in the case of a dwelling the owner or occupier of which is entitled to use common parts, that those parts were in a like state of repair and the purchaser would be liable to contribute towards the cost of keeping them in such a state;
g. in the case of a dwelling which has been adapted for occupation by a disabled person, that the fixtures which are designed to make the dwelling suitable for use by a physically disabled person, and which add to the value of the dwelling were not included in the dwelling;
72
h. that the use of the dwelling would be permanently restricted to use as a private dwelling; and
i. that the dwelling had no development value other than the value attributed to the permitted development.
The definition of ‘value’ cited above is similar to that used as the basis for compensation following compulsory acquisition (under s. 5 of the Land Compensation Act 1961) which provides for compensation for land taken following compulsory acquisition to be based on “the amount which the land if sold in the open market by a willing seller might be expected to realise.”
From British compensation and other cases where similar phraseology has been used, the definition of the value of a dwelling for the purposes of Council Tax can be further explained.
“In the open market” has been held (IRC v. Clay and Buchanan (1914)) to mean that the property is “offered under conditions enabling every person desirous of purchasing to come in and make an offer”. In particular, the words “willing seller” have been the subject of interpretation in case law. Thus, “a ‘willing seller’ is ‘one who is a free agent’, not ‘a person willing to sell his property without reserve for any price he can obtain for it’” (ibid.). A “willing seller” is “…assumed to be willing to sell at the best price which he can reasonable get in the open market.” (Trocette Property Co. v. Greater London Council (1974))
A price which the land is expected to realise’ implies a reference to ‘the expectations of properly qualified persons who have taken pains to inform themselves of all the particulars ascertainable about the property, and its capabilities, the demand for it and the likely buyers’—in short, the professional opinion of competent valuers [appraisers]. (ibid. cited by Davies, 1984).
Alterations of the List The Council Tax (Situation and Valuation of Dwellings) Regulations 1992 (reg. 6 (3)) seeks to ensure that, where such alterations are made, the value of the dwelling is assessed subject to assumptions which ensure that the alteration in banding reflects only the effect on property prices from the date of the original reason or event which gave rise to the alteration.
However, opportunities to alter the entry of the property once the list has come into operation are so limited that this has been of little consequence to date.
73
Valuation List There is one valuation list for each local authority area (called a billing authority area) and the Listing Officer (the Valuation Officer, re-named for Council Tax purposes) was required to compile and maintain a valuation list for each billing area. The contents of the list are to comply with the Council Tax (Contents of Valuation Lists) Regulations 1992. The Valuation Lists were compiled (i.e. came into force) on 1 April 1993 and are to be maintained as long as necessary. There is currently no provision for up-dating the list or revaluing the tax base, which is currently valued as at 1 April 1991.
Banding Strictly speaking, dwellings were not “valued” for the purposes of the Council Tax. Instead, all dwellings which liable to Council Tax are placing in one of eight value bands. The bands which have not been altered since the tax was introduced are (s. 5 (2) LGFA 1992), are illustrated in Table 9 (Bands for England and Scotland) and Table 10 (Bands for Wales).
The value bands were constructed around the average property values in the respective countries, and therefore, reflect the relatively low value of residential properties in Wales compared to England and Scotland.
In addition to controlling the value bands, central government has also specified the relative burden of council tax between the bands, (s. 5 (1) 1992) as shown in Table 11.
The numbers represent the relative proportions of the Council Tax bill which are paid by taxpayers whose properties fall within the different bands. Thus, taxpayers who live in Band A properties pay two thirds of the amount paid by taxpayers who live in Band D properties (6/9) and taxpayers who live in Band H properties pay twice of the amount paid by taxpayers who live in Band D properties (18/9). (Band D is widely presented as being the “average” tax band.)
Initially, it was proposed that bands should be regularly reviewed, to take into account changes in house prices, and it was proposed that the Department of the Environment (now the Department of Environment, Transport and the Regions (DETR)) would reserve the power to order an area revaluation in cases where there had been significant differential movement in the values of different kinds of dwellings.
However, there is no indication (February, 2000) that there is any political will to introduce a revaluation or even a review of bands. The values are now nine years out of date and the residential property market in Britain continues to be volatile, with recent press reports indicating significant increases in capital value in dwellings in certain parts of the country.
Only a complete revaluation will reflect the shift in residential prices over the past nine years between the different regions of the country and between the variations in prices

74
between the different kinds of dwellings taxed. Evidence of the urgent need for such a revaluation based on a sample of sales of dwellings in South East Wales is presented as Part IV in this report.
Appeals Appeals against liability and against the allocation of a dwelling to its band are to the valuation tribunal (Council Tax (Alteration of Lists and Appeals) Regulations 1993). No alteration can be made to the Valuation List unless, since the band was first shown as applicable to the dwelling, unless:
(i) there has been a material increase in the value of the dwelling and a relevant transaction has subsequently taken place;
(ii) there has been a material reduction in the value of the dwelling (unless caused by demolition work which is part of other operations in progress);
(iii) the dwelling has ceased to be a composite hereditament; or
(iv) in the case of a dwelling which is a composite hereditament, there is an increase or decrease in its domestic use;
(v) a different valuation band should originally have been determined as applicable to the dwelling or that the band shown in the list was not that originally determined; or
(vi) an order of the valuation tribunal or High Court requires an alteration. (reg. 4 (1) and (2) Council Tax (Alteration of Lists and Appeals) Regulations, as amended by the Council Tax (Alteration of Lists and Appeals) (Amendment) Regulations 1994).
People on Low Incomes It was the stated intention (HMSO, 1991) that: “people on low incomes are not called on to make a disproportionate contribution to local taxation.”
Thus, a system of council tax benefits has been incorporated into the social security acts. Local authorities administer the scheme which ensures that for individuals or couples on income support or equivalent levels of income, rebates meet 100% of their liability under the Council Tax.
Local Authority’s Discretion to fix tax It was intended (HMSO, 1991) that local authorities would retain discretion to set their budgets above or below the standard level determined by central government, subject to the restraints imposed by central government which operate at that time, so that
75
efficiencies which result in savings and additional expenditure which increases the level of Council Tax imposed should be clearly visible to the taxpaying electorate.
Thus, central government’s intention was that the level of Council Tax would clearly relate to the spending decisions of the local authority and that the local authority would become directly accountable to its taxpayers.
Central government has ensured that any variation in spending falls proportionately on the bills of all the taxpayers in the area and, in its recent (spring 1999) decision to suspend its power to cap the spending of local authorities (effectively limiting their power to increase Council Tax – still only about 24% of their revenue), accountability between taxpayer and tax spender has increased.
For more details about the Council Tax, refer to Martin Ward’s Council Tax Handbook, (1993) produced by the Child Poverty Action Group, London, UK.