Embed Size (px)
Citation preview
PHYSIOTHERMODYNAMICS OF LUBRICANT
APPLICATION TO HOT DIE SURFACES
DISSERTATION
Presented in Partial Fulfillment of the Requirements for
the Degree of Doctor of Philosophy in the Graduate
School of The Ohio State University
By
Lin Yang, M.S.
* * * *
The Ohio State University
2005
Dissertation Committee:
Dr. Rajiv Shivpuri, Adviser
Dr. Jose M. Castro
Dr. Tunc Aldemir
Approved By
Adviser
Industrial and Systems Engineering
Graduate Program
ii
ABSTRACT
The hot forging process is one of the manufacturing processes where metal is pressed,
pounded or squeezed under great pressure into high strength parts. Before the billet is
forged, lubricant is applied to heated dies to promote the flow of metal, to reduce friction
and wear, and to aid in the release of the finished part. The most commonly used
lubricant in the hot forging process is water-based graphite and it is applied to dies by
spraying large numbers of atomized lubricant droplets through nozzles. An understanding
of film formation and heat transfer of a single droplet colliding on a heated wall will
result in more precise control of spray to obtain required film patterns and heat transfer.
The precision of spray control will, in turn, reduce energy consumption and pollution in
the hot forging process through reduction of billet pre-heat temperature and enhancement
of lubricant wetting with the die.
Interactions between the die surface and droplets of water based graphite lubricant are the
subjects of this study. First, the spreading of droplets which impact on the die surface is
modeled based on Navier-Stokes equations and this model is solved using a commercial
CFD code, Flow-3D. Special attention is paid to the influence of lubricant dilution ratio,
lubricant properties, droplet parameters, and die surface temperature on the formation of
the lubricant film in this model. A non-dimension analysis of the simulation results

iii
provides an insight into the physical phenomena and the model is validated through
controlled experiments using a high speed camera.
The lubricant film is formed after all the residue liquid on the heated die surface is dried
off. The evaporation time of the droplets is not only a productivity index in hot metal
processing but also an important factor for product quality and life of the die. This study
presents an analytical model to predict the evaporation time of a droplet impacted on a
die surface, heated to temperatures beyond Leidenfrost point, beyond which are the
working temperatures for hot forging dies. Calculated evaporation times from the model
are compared with experimental measurements and agree well in a right magnitude.
A methodology for calculating the heat transfer coefficients in lubricant sprays is then
presented. The heat transfer characteristics of the lubricants at various thermo-physical
regimes on the hot surface are determined using single droplet experiments. The results
of these experiments are used along with equations based on a non-dimensional and
averaging approach to predict heat transfer coefficients for a complicated spray. Finally,
the outcomes of dynamic interactions between lubricant droplets and heated die surface
are categorized as bounce off, wetting and breakup, based on the coupling of Weber
number (We) and die surface temperature. These characteristic outcomes of droplets with
different dilution ratio are mapped through the experimental results.
iv
Predictions by both the fluid dynamic model and the dryoff model agree well with the
results obtained in experiments. Results from single droplet studies show that both Weber
number (We) and die surface temperature play an important role on the lubricant wetting,
dryoff and heat transfer on the die. Selection of lubricant dilution ratio has also been
shown to be important on interactions between sprayed lubricants and the die surface.

v
DEDICATION
Dedicated to my parents and my wife.
vi
ACKNOWLEDGMENTS
First and foremost I would like to thank Dr. Rajiv Shivpuri, my adviser, for his support,
guidance and above all, encouragement throughout the years of my PhD program. I have
learned knowledge and the way to obtain knowledge under his instructions that has
prepared me to make more contributions to the future. I am also grateful in earnest for his
continuous solicitude for the hard times my family experienced during my doctoral study.
I thank other members of my dissertation committee, Dr. Jose M. Castro and Dr. Tunc
Aldemir for their scientific inputs and advice, as well as the member of my general exam
committee, Dr. Steve MacEachern for his valuable comments and suggestions.
I also owe thanks to our group members, Wenfeng Zhang, Yuanjie Wu, Chun Liu,
Meixing ji, Yijun Zhu, Yongning Mao, and Xiaomin Cheng, for their academic help and
friendship. Thanks also go to Dr. Jiang Hua, Dr. Satish Kini, Dr. Ziqiang Sheng, and Dr.
Sailesh Babu for their kindly supports and helpful suggestions.
Finally, I wish I could express my sincere gratitude to my wife, Xiaoxia for her long
suffering, unremitting support and solid love.

vii
VITA
May 22, 1972 Born - Guizhou, P.R. China
1992 B.S., Manufacturing Engineering, Beijing
University of Aeronautics and Astronautics,
Beijing, P.R. China
1992 – 1995 M.S., Mechanical Engineering, Tianjin University,
Tianjin, P.R. China
1995 – 1999 Engineer and Manager, Motorola Inc., Tianjin, P.R.
China
1999 – 2000 Consultant, Qihang Management Consulting Co.,
LTD., Shanghai, P.R. China
2000 – 2001 Manager, Sina Mas Group, Shanghai, P.R. China
2001 – 2005 Graduate Research Associate, Department of
Industrial, Welding and Systems Engineering, The
Ohio State University
PUBLICATIONS
Yang, L., Liu, C., Shivpuri, R.: Physiothermodynamics of Lubricant Deposition on Hot
Die Surfaces, Annals of the CIRP, 54/1, 2005.
Yang, L., Liu, C., Shivpuri, R.: Comprehensive Approach to Film Formation, Pollution
and Heat Transfer in Hot Die Lubrication, Proceedings of the ICTP, 2005
viii
FIELDS OF STUDY
Major Field: Industrial & Systems Engineering
Major Area: Manufacturing
Minor I: Reliability Engineering
Minor II: Statistical Quality Control
ix
TABLE OF CONTENTS
Page
ABSTRACT ....................................................................................................................... ii
DEDICATION................................................................................................................... v
ACKNOWLEDGMENTS ............................................................................................... vi
VITA................................................................................................................................. vii
LIST OF TABLES ......................................................................................................... xiii
LIST OF FIGURES ....................................................................................................... xiv
LIST OF NOMENCLATURES ................................................................................... xvii
Chapter
1. INTRODUCTION......................................................................................................... 1
1.1 Project Background ................................................................................................... 2
1.1.1 Energy Analysis of a Typical Hot Forging Process ........................................... 4
1.1.2 Influence of Lubrication on Energy Consumption ............................................ 5
1.1.3 Technological Strategy to Reduce Energy ....................................................... 17
1.2 Objective of the Research ....................................................................................... 19
1.3 Approach and Methodology of the Research.......................................................... 20
1.4 Dissertation Outline ................................................................................................ 23
2. BACKGROUND AND LITERATURE REVIEW .................................................. 25
2.1 Governing Equations .............................................................................................. 28
2.2 Free Surface Modeling ............................................................................................ 34
2.3 Literature Review.................................................................................................... 36
2.3.1 Droplet-Surface Interaction ............................................................................. 36
2.3.2 Spray-Surface Interaction ................................................................................ 41
x
3. LUBRICANT SPREAD IN THE SPRAYING OF HOT DIE SURFACES .......... 44
3.1 Introduction ............................................................................................................. 44
3.2 Theoretical Analysis ............................................................................................... 51
3.2.1 Governing Equations ....................................................................................... 51
3.2.2 Initial and Boundary Conditions ...................................................................... 54
3.2.3 Scaling.............................................................................................................. 60
3.3 Numerical Solution – FLOW-3D Simulation ......................................................... 64
3.3.1 Fraction Function, Fractional Volume and Fractional Area ............................ 65
3.3.2 The Governing Equations in Flow-3D Format ................................................ 70
3.3.3 Numerical Approximations .............................................................................. 71
3.4 Experimental Setup ................................................................................................. 76
3.5 Measurement of the Lubricant Properties ............................................................... 77
3.5.1 Surface Tension ............................................................................................... 78
3.5.2 Viscosity .......................................................................................................... 82
3.5.3 Results of the Lubricant Properties .................................................................. 83
3.6 CFD Simulation ...................................................................................................... 86
3.7 Results and Discussions .......................................................................................... 87
3.8 Summary of the Chapter ....................................................................................... 100
4. MODELING OF THE LUBRICANT DRYOFF BEYOND LEIDENFROST
POINT ............................................................................................................................ 101
4.1 Introduction ........................................................................................................... 102
4.2 Droplet Impact on a Hot Surface .......................................................................... 106
4.3 Fluid Dynamic Model ........................................................................................... 108
4.4 Quasi-steady Dryoff Model .................................................................................. 109
4.4.1 Model Description ......................................................................................... 109
xi
4.4.2 Governing Equations ..................................................................................... 111
4.4.3 Analytical Solution ........................................................................................ 113
4.5 Experiment Setup .................................................................................................. 118
4.6 Results and Discussion ......................................................................................... 119
4.7 Summary of the Chapter ....................................................................................... 128
5. PHYSIOTHERMODYNAMICS OF LUBRICANT DEPOSITION ................... 129
5.1 Introduction ........................................................................................................... 129
5.2 Droplet Impact on a Hot Surface .......................................................................... 132
5.3 Experimental Results ............................................................................................ 134
5.3.1 Heat flux......................................................................................................... 136
5.3.2 Critical Heat Flux (CHF) and Leidenfrost ..................................................... 136
5.3.3 Heat Transfer and Dryoff ............................................................................... 139
5.3.4 Effect of Drop Dynamics on Heat Transfer ................................................... 141
5.4 Application to Sprays ............................................................................................ 142
5.4.1 Methodology for Plain-orifice Atomizers ...................................................... 142
5.4.2 Case Study: Hot Forging Lubrication ............................................................ 144
5.5 Summary of the Chapter ....................................................................................... 146
6. COMPREHENSIVE APPROACH TO FILM FORMATION, POLLUTION AND
HEAT TRANSFER IN HOT DIE LUBRICATION ................................................. 148
6.1 Introduction ........................................................................................................... 149
6.2 Factors Affecting Lubrication in Hot Forging ...................................................... 152
6.3 Bouncing, Wetting and Breaking up ..................................................................... 155
6.4 Heat Flux During Lubricant Spraying .................................................................. 163
6.5 Summary of the Chapter ....................................................................................... 167
xii
7. CONCLUSIONS AND FUTURE WORK .............................................................. 170
7.1 Conclusions ........................................................................................................... 170
7.2 Research Significance and Contribution ............................................................... 172
7.3 Suggested Future Work......................................................................................... 173
LIST OF REFERENCES ............................................................................................. 175
xiii
LIST OF TABLES
Table Page
Table 1.1. Forging process and energy flow ...................... Error! Bookmark not defined.
Table 1.2. Simulation results (Load in kN)....................................................................... 16
Table 3.1. Measured properties of lubricants .................................................................... 85
Table 3.2. Material constants for different dilution rations for equation
log(We) B A )log( max ...................................................................................... 99
xiv
LIST OF FIGURES
Figure Page
Fig. 1.1. A typical hot forging process flow. ...................................................................... 3
Fig. 1.2. Energy flow of the hot forging process. .............. Error! Bookmark not defined.
Fig. 1.3. Energy analysis for a spike forging process. ........................................................ 8
Fig. 1.4. Energy drivers for a spike forging process. .......................................................... 9
Fig. 1.5. Schematic of the cavity filling. ........................................................................... 10
Fig. 1.6. The initial configuration of the billet upsetting simulation. ............................... 13
Fig. 1.7. Temperature= 1100oC, m=0.3, H=8.12 mm. Flood spraying. ............................ 14
Fig. 1.8. Temperature= 1100oC, m1=0.7, m2=0.1; H=15.09 mm. Controlled lubrication.
................................................................................................................................... 15
Fig. 1.9. Energy saving strategy for hot forging based on innovative lubrication
technology. ................................................................................................................ 18
Fig. 1.10. Spray modeling processes. ............................................................................... 21
Fig. 2.1. Factors influencing lubricant deposition and die cooling. ................................. 27
Fig. 3.1. The Cylindrical Coordinate description of lubricant droplet on a solid surface. 52
Fig. 3.2. The boundary condition of free moving surface. ............................................... 57
Fig. 3.3. Typical values of the VOF function F in the droplet model. ............................. 67
Fig. 3.4. Fractional area/volume method (FAVOR). ........................................................ 69
Fig. 3.5. Schematic experiment setup. .............................................................................. 78
xv
Fig. 3.6. Generation of single droplets by a droplet generator. ........................................ 81
Fig. 3.7. Capillary action method...................................................................................... 82
Fig. 3.8. Viscosity measurement based on ASTM 445-01. .............................................. 84
Fig. 3.9. The configuration and meshing of the simulation. ............................................. 88
Fig. 3.10. simulation results of lubricant 1:1 with 4mm diameter droplet at impact
velocity 10cm/s. ........................................................................................................ 89
Fig. 3.11. Simulation results of lubricant 1:1 with 4mm diameter droplet at impact
velocity 100cm/s. ...................................................................................................... 90
Fig. 3.12. Experimental results of max v.s. TD. We = 27. ............................................... 92
Fig. 3.13. Experiment and simulation results of lubricants, max v.s. Re. ........................ 93
Fig. 3.14. Experiment and simulation results of lubricants, max v.s. We. ....................... 94
Fig. 3.15. Experiment and simulation results of lubricants, log( max ) v.s. log(Re). ........ 97
Fig. 3.16. Experiment and simulation results of lubricants, log( max ) v.s. log(We). ....... 98
Fig. 4.1. Dryoff process of a lubricant droplet at film boiling: (a)- (c) fluid dynamic
process, (d). quasi-steady dryoff process. ............................................................... 105
Fig. 4.2. Boiling curve of a droplet deposited on a hot solid surface. ........................... 107
Fig. 4.3. Modeling of the quasi-steady dryoff of a lubricant droplet. ............................ 110
Fig. 4.4. Schematic experiment setup. ........................................................................... 120
Fig. 4.5. Averaged thickness of the vapor layer as a function of temperature and Weber
number. ................................................................................................................... 122
Fig 4.6. Averaged mass loss rate as a function of temperature and Weber number. ...... 125
xvi
Fig. 4.7. Dryoff time of a droplet with initial diameter d0=3mm.................................... 127
Fig. 5.1. Boiling curve of a droplet deposited on a hot solid surface. ........................... 133
Fig. 5.2. Schematic experiment setup. ........................................................................... 135
Fig. 5.3. Measured average heat flux for water and lubricant with different dilution ratio
at quasisteady state. ................................................................................................. 137
Fig. 5.4. Heat transfer coefficient for lubricant mixtures with different dilution ratios. 138
Fig. 5.5. Measured dryoff time curves for water and lubricant with different dilution
ratios. ....................................................................................................................... 140
Fig. 5.6. Predicted heat transfer coefficient for lubricant sprays with different dilution
ratios. ....................................................................................................................... 145
Fig. 6.1. Excessive consumption of lubricant and significant pollution from lubrication.
................................................................................................................................. 150
Fig. 6.2. Factors influencing lubricant deposition and die cooling. ............................... 153
Fig. 6.3. Regimes of different phenomena of a lubricant droplet impinging on heat die
surface comparing with water. (a). 1:20 Lubricant, (b). 1:5 Lubricant, (c). 1:1
Lubricant, (d). 5:3 Lubricant. .................................................................................. 162
Fig. 6.4. Temperature history and heat transfer coefficients in the first 2 seconds. ....... 166
xvii
LIST OF NOMENCLATURES
A areas (m
2) / fractional area ratio
b body force acceleration (m/s2)
Cp specific heat (W/kg K)
d droplet diameter (m)
D~~
rate of deformation tensor
F fluid fraction function
g gravity acceleration (m/s2)
h heat transfer coefficient (W/m2/K)
H height (m)
Hf latent heat of fusion (W/kg)
HV latent heat of vaporization (W/kg)
k thermal conductivity (W/m)
Lp latent heat of pressure change
L~~
velocity gradient tensor
m friction coefficient
n̂ unit normal vector
p pressure (N/m2)
Pr Prandtl number
r radial displacement
R radius (m)
Re Reynolds number
s arc length (m)
Ste Stefan number
t time (s)
t̂ unit tangent vector
T temperature (K)
v velocity (m/s)
Vf fractional volume ratio
V0 initial droplet velocity (m/s)
We Weber number
z axial displacement

xviii
Greek symbols
contact angle/ thermal diffusivity
(m2/s)
surface tension (N/m)
δ vapor layer thickness (μm)
angular displacement
curvature of the surface
dynamic viscosity (N s/m2)
kinematic viscosity (m2/s)
max spreading coefficient
density (kg/m3)
~~ sheer stress tensor
Prefixs
spacing of a distance or time
Subscripts
D die surface
i the i-th cell in r direction
j the j-th cell in z direction
m melt
n the n-th time level
r r direction
w wall
z z direction
θ θ direction
max maximum value
0 initial value
1
CHAPTER 1
1. INTRODUCTION
The forging process is one of the manufacturing processes where metal is pressed,
pounded or squeezed under great pressure into high strength parts. The forging industry
in the U.S. was roughly $12 billion in 1997 (DOD National Security Assessment).
Roughly 15% of the total sales value of its products is allocated to energy, an estimated
50 trillion BTUs per year. The environmental impact of the use of graphite (in hot
forging) is estimated to add over 20% to the product cost. These costs include both direct
costs related to cleaning and disposal and indirect costs related to immediate and long-
term health costs of employees.
To improve energy efficiency and the working environment in hot forging processes, we
consider lubrication as the key strategy to achieve this goal. The hot forging process is
performed by preheating the metal to a desired temperature (above its recrystallization
point) before it is worked. The billet is forged only after lubricant is applied to dies to
promote the flow of metal, to reduce friction and wear, and to aid in the release of the
finished part. The most commonly used lubricant in the hot forging process is water-
based graphite and it is applied to dies by spraying large numbers of atomized lubricant
droplets through nozzles. The mode of spray not only influences lubricant wetting on the
2
die, but also determines the thermal effects on the die surface. An understanding of film
formation and heat transfer of a single droplet colliding with a heated wall will result in
more precise control of spray to obtain required film patterns and heat transfer. The
precision of spray control will thus reduce energy consumption and pollution in the hot
forging process through reduction of billet pre-heat temperature and enhancement of
lubricant wetting with the die.
1.1 Project Background
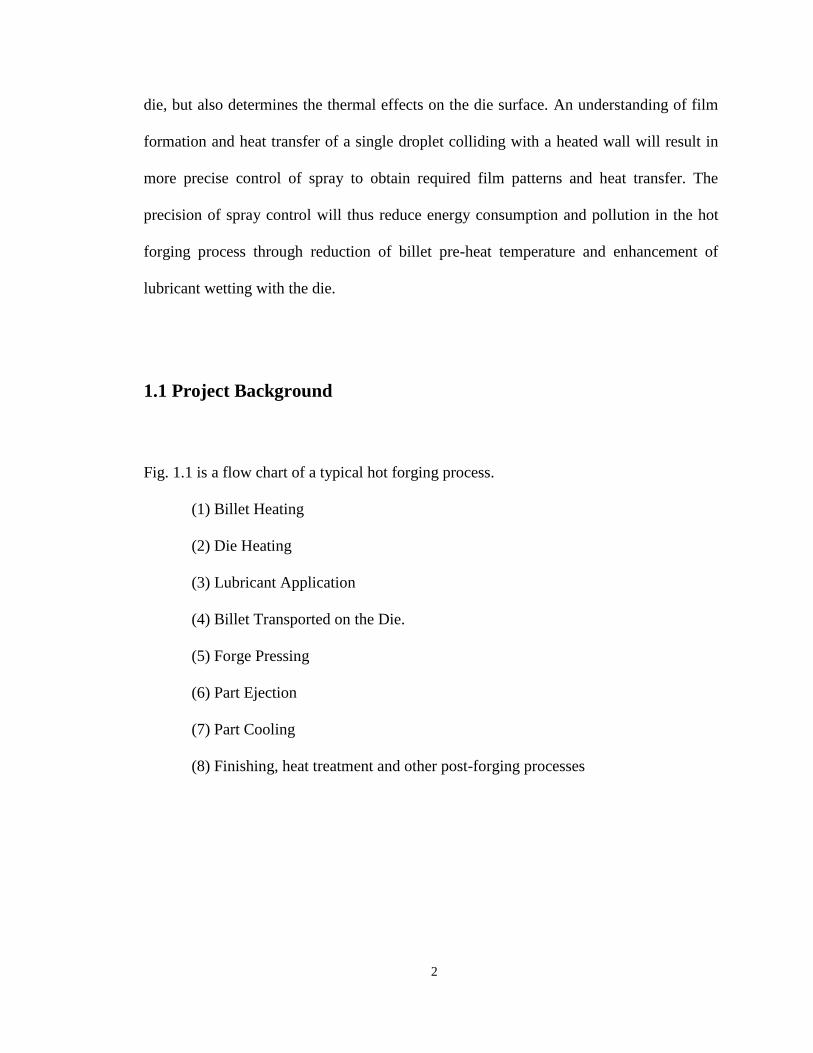
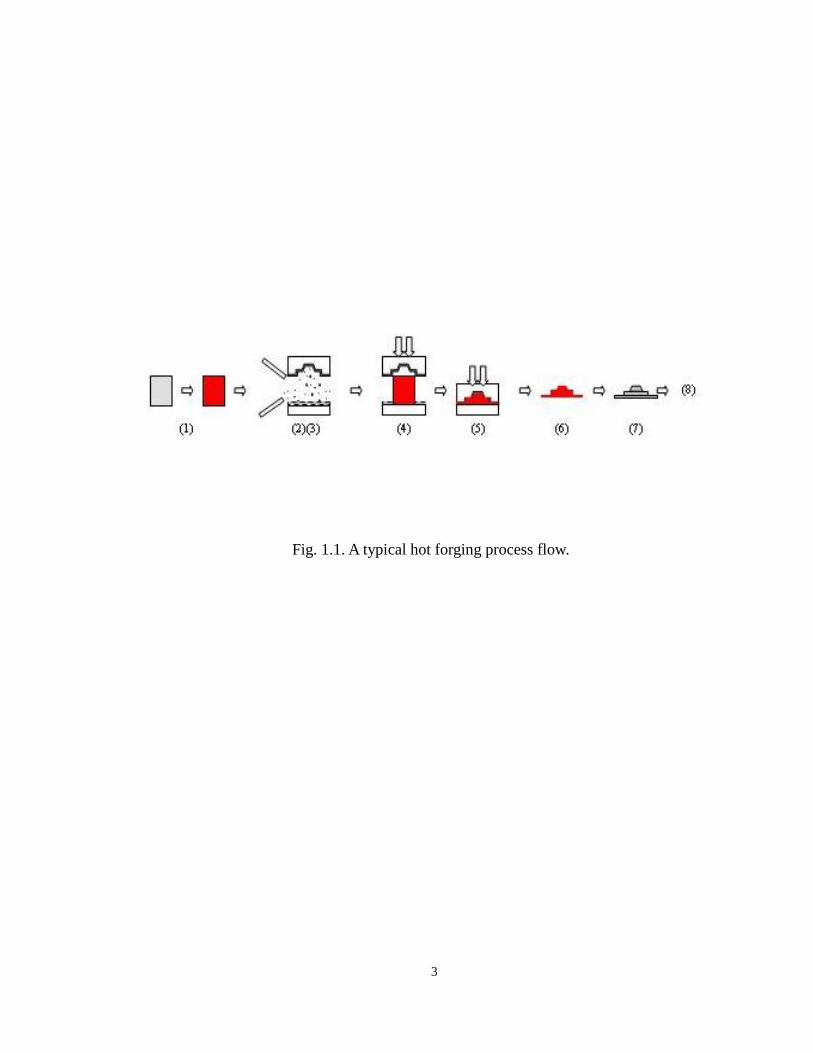
Fig. 1.1 is a flow chart of a typical hot forging process.
(1) Billet Heating
(2) Die Heating
(3) Lubricant Application
(4) Billet Transported on the Die.
(5) Forge Pressing
(6) Part Ejection
(7) Part Cooling
(8) Finishing, heat treatment and other post-forging processes
3
Fig. 1.1. A typical hot forging process flow.
4
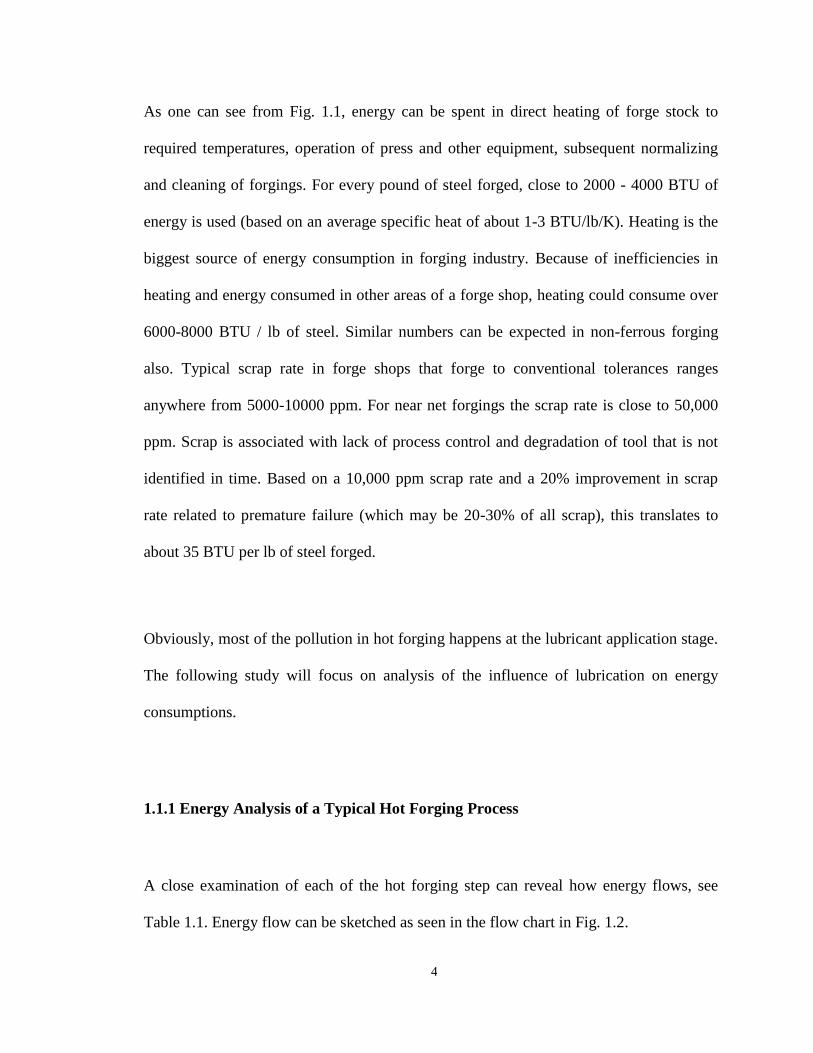
As one can see from Fig. 1.1, energy can be spent in direct heating of forge stock to
required temperatures, operation of press and other equipment, subsequent normalizing
and cleaning of forgings. For every pound of steel forged, close to 2000 - 4000 BTU of
energy is used (based on an average specific heat of about 1-3 BTU/lb/K). Heating is the
biggest source of energy consumption in forging industry. Because of inefficiencies in
heating and energy consumed in other areas of a forge shop, heating could consume over
6000-8000 BTU / lb of steel. Similar numbers can be expected in non-ferrous forging
also. Typical scrap rate in forge shops that forge to conventional tolerances ranges
anywhere from 5000-10000 ppm. For near net forgings the scrap rate is close to 50,000
ppm. Scrap is associated with lack of process control and degradation of tool that is not
identified in time. Based on a 10,000 ppm scrap rate and a 20% improvement in scrap
rate related to premature failure (which may be 20-30% of all scrap), this translates to
about 35 BTU per lb of steel forged.
Obviously, most of the pollution in hot forging happens at the lubricant application stage.
The following study will focus on analysis of the influence of lubrication on energy
consumptions.
1.1.1 Energy Analysis of a Typical Hot Forging Process
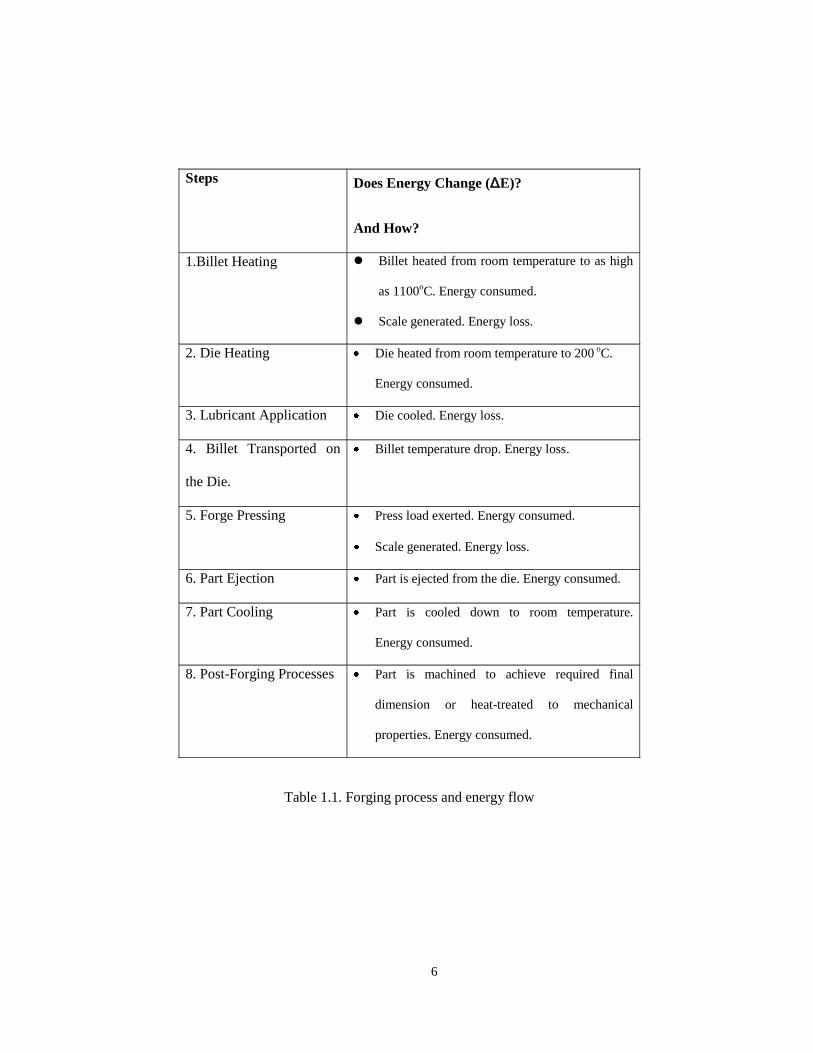
A close examination of each of the hot forging step can reveal how energy flows, see
Table 1.1. Energy flow can be sketched as seen in the flow chart in Fig. 1.2.
5
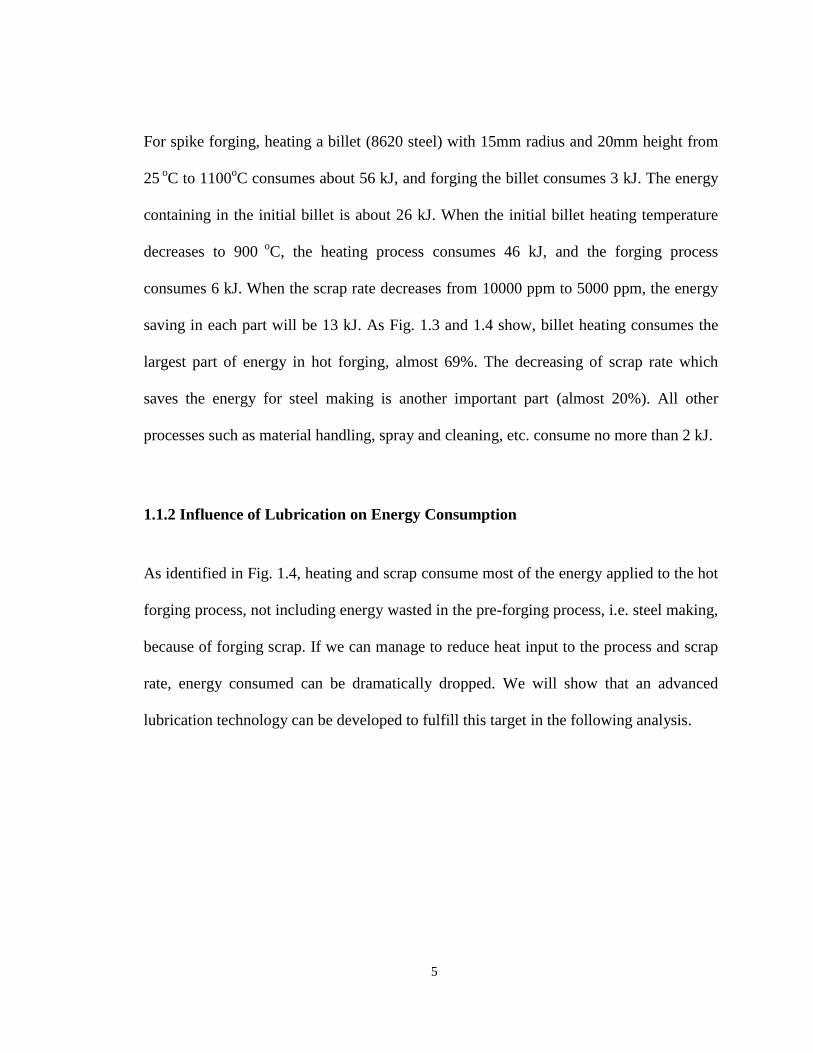
For spike forging, heating a billet (8620 steel) with 15mm radius and 20mm height from
25 oC to 1100
oC consumes about 56 kJ, and forging the billet consumes 3 kJ. The energy
containing in the initial billet is about 26 kJ. When the initial billet heating temperature
decreases to 900 o
C, the heating process consumes 46 kJ, and the forging process
consumes 6 kJ. When the scrap rate decreases from 10000 ppm to 5000 ppm, the energy
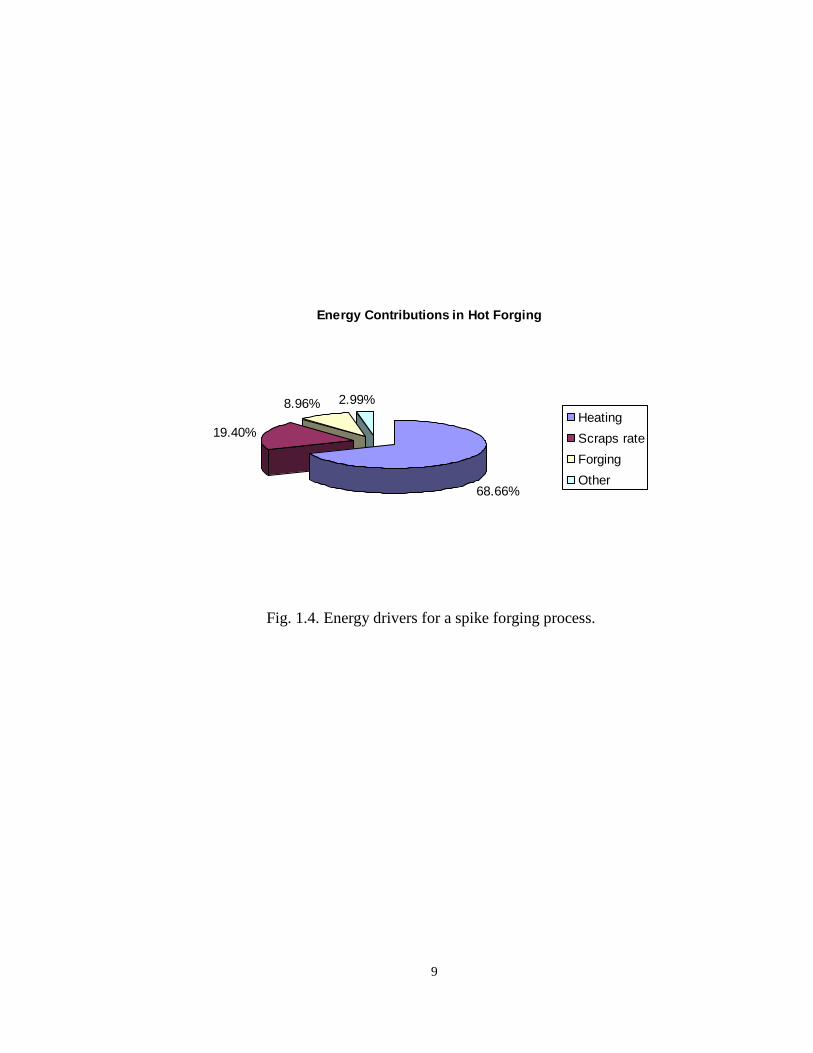
saving in each part will be 13 kJ. As Fig. 1.3 and 1.4 show, billet heating consumes the
largest part of energy in hot forging, almost 69%. The decreasing of scrap rate which
saves the energy for steel making is another important part (almost 20%). All other
processes such as material handling, spray and cleaning, etc. consume no more than 2 kJ.
1.1.2 Influence of Lubrication on Energy Consumption
As identified in Fig. 1.4, heating and scrap consume most of the energy applied to the hot
forging process, not including energy wasted in the pre-forging process, i.e. steel making,
because of forging scrap. If we can manage to reduce heat input to the process and scrap
rate, energy consumed can be dramatically dropped. We will show that an advanced
lubrication technology can be developed to fulfill this target in the following analysis.
6
Steps Does Energy Change (ΔE)?
And How?
1.Billet Heating Billet heated from room temperature to as high
as 1100oC. Energy consumed.
Scale generated. Energy loss.
2. Die Heating Die heated from room temperature to 200 oC.
Energy consumed.
3. Lubricant Application Die cooled. Energy loss.
4. Billet Transported on
the Die.
Billet temperature drop. Energy loss.
5. Forge Pressing Press load exerted. Energy consumed.
Scale generated. Energy loss.
6. Part Ejection Part is ejected from the die. Energy consumed.
7. Part Cooling Part is cooled down to room temperature.
Energy consumed.
8. Post-Forging Processes Part is machined to achieve required final
dimension or heat-treated to mechanical
properties. Energy consumed.
Table 1.1. Forging process and energy flow

7
Fig. 1.2. Energy flow of the hot forging process

8
0
1 0
2 0
3 0
4 0
5 0
Ener gy ( kJ)
Heating Scraps rate Forging Other
Ener gy Cont r i but i ons
Energy Anal ysi s of Hot Forgi ng
Fig. 1.3. Energy analysis for a spike forging process.
9
Energy Contributions in Hot Forging
68.66%
19.40%
8.96% 2.99%
Heating
Scraps rate
Forging
Other
Fig. 1.4. Energy drivers for a spike forging process.

10
Fig. 1.5. Schematic of the cavity filling.
11
During spike forging, the metal flows in two directions, one is the flash direction and the
other is the direction to fill the cavity. Generally metal flows more easily into flash
because of less resistance. Under-fill of the cavity produces majority of the scrap. In
order to fill the cavity, the typical method in industry, is to reduce the “h” in Fig. 1.5 and
make more flash. More flash means more volume of the initial billet, and hence more
heating energy. Moreover, flash also increases the press load, and this may result in the
die life reduction and increase in the energy consumed by the press punch.
We can find a way to reduce the flash, pre-heated temperature of the billet and press load
using the tribology theory. By controlling lubricant deposition patterns to increase the
metal flow resistance on some necessary positions on the die surface, while reducing
resistances on other positions, more metal can be forced to flow into the cavity. From the
analysis of the FEM simulation results, we can infer that this technology is feasible in the
energy saving.
We selected AISI 8620 as the billet material. The diameter is 40 mm and the height is 20
mm. Only half of the billet is shown in Fig. 1.6 due to symmetrical geometry.
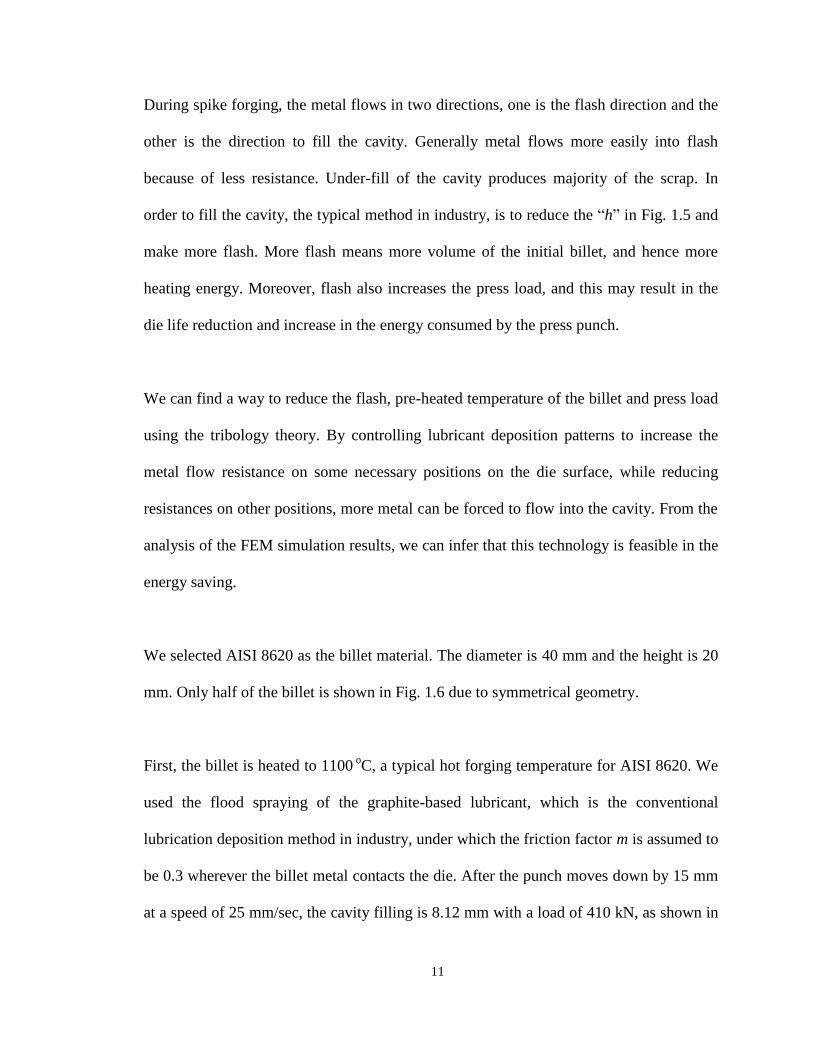
First, the billet is heated to 1100 oC, a typical hot forging temperature for AISI 8620. We
used the flood spraying of the graphite-based lubricant, which is the conventional
lubrication deposition method in industry, under which the friction factor m is assumed to
be 0.3 wherever the billet metal contacts the die. After the punch moves down by 15 mm
at a speed of 25 mm/sec, the cavity filling is 8.12 mm with a load of 410 kN, as shown in

12
Fig. 1.7. This means that if we use conventional lubricant deposition, the capacity of the
cavity filling for the designed cavity is 8.12 mm under the specified forging conditions.
Controlled lubricant was used by increasing the metal flow resistance on the punch
surface by setting the friction factor of 0.7, and setting the friction factor as 0.1 on the
cavity surface. The simulation is then run under the same forging conditions as Fig. 1.7.
The result is shown in Fig. 1.8 and the filling length increases to 15.09 mm. Comparing
this result with Fig. 1.7, we can see that the filling capacity increase a lot using this
innovational lubricant deposition method.
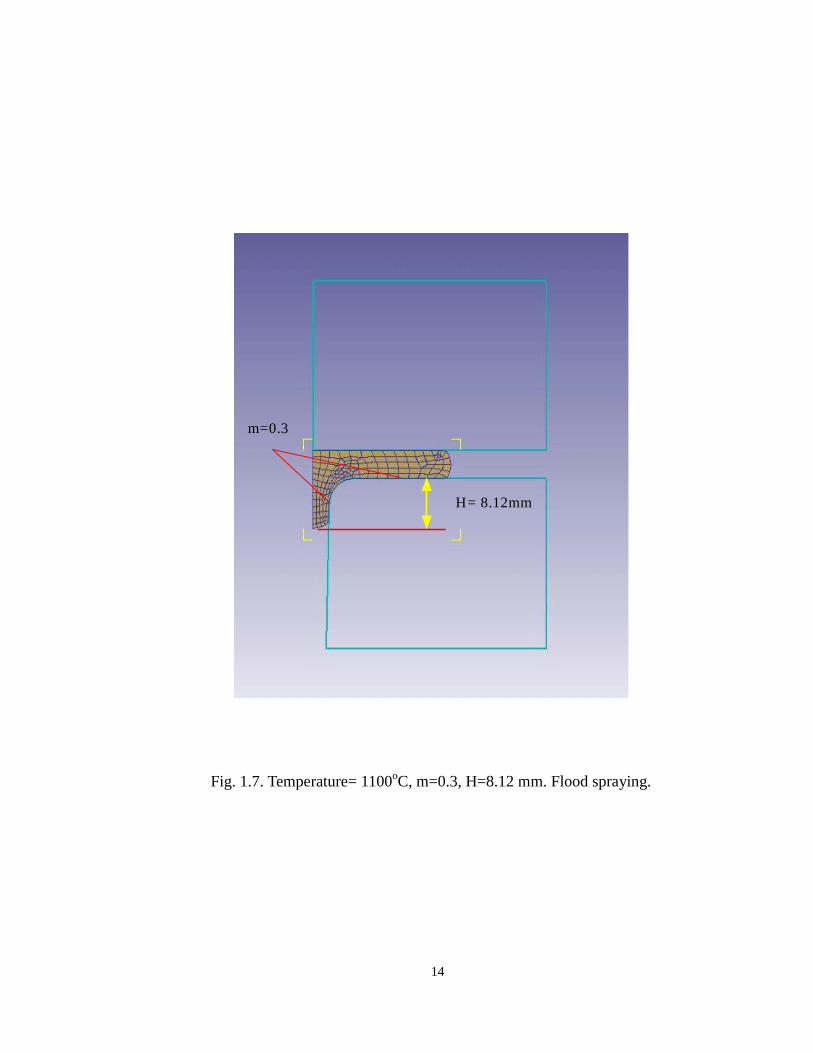
The filling length is fixed at 8.12 mm and simulations have been done at billet
temperatures of 1000oC and 900
oC for both flood spraying and controlled lubrication.
The forging load is calculated and results are summarized in Table 1.2.
From Table 1.2, we can see that if one uses the innovational lubricant deposition method
to achieve the same cavity filling as the conventional method, the billet temperature can
be reduced from 1100oC to 900
oC at the same load. Thus, around 15% of heating energy
can be saved. This controllable lubrication technology can hence reduce by a large
amount of the energy usage in the hot forging process.

13
Fig. 1.6. The initial configuration of the billet upsetting simulation.
14
H= 8.12mm
m=0.3
Fig. 1.7. Temperature= 1100oC, m=0.3, H=8.12 mm. Flood spraying.

15
m=0.7
m=0.1H=15.09mm
Fig. 1.8. Temperature= 1100oC, m1=0.7, m2=0.1; H=15.09 mm. Controlled lubrication.
16
Billet Temp.
(C)
The load (kN) when the filling reaches 8.18 mm
Conventional Innovational
1100 410 235
1000 570 300
900 810 440
Table 1.2. Simulation results (Load in kN)
17
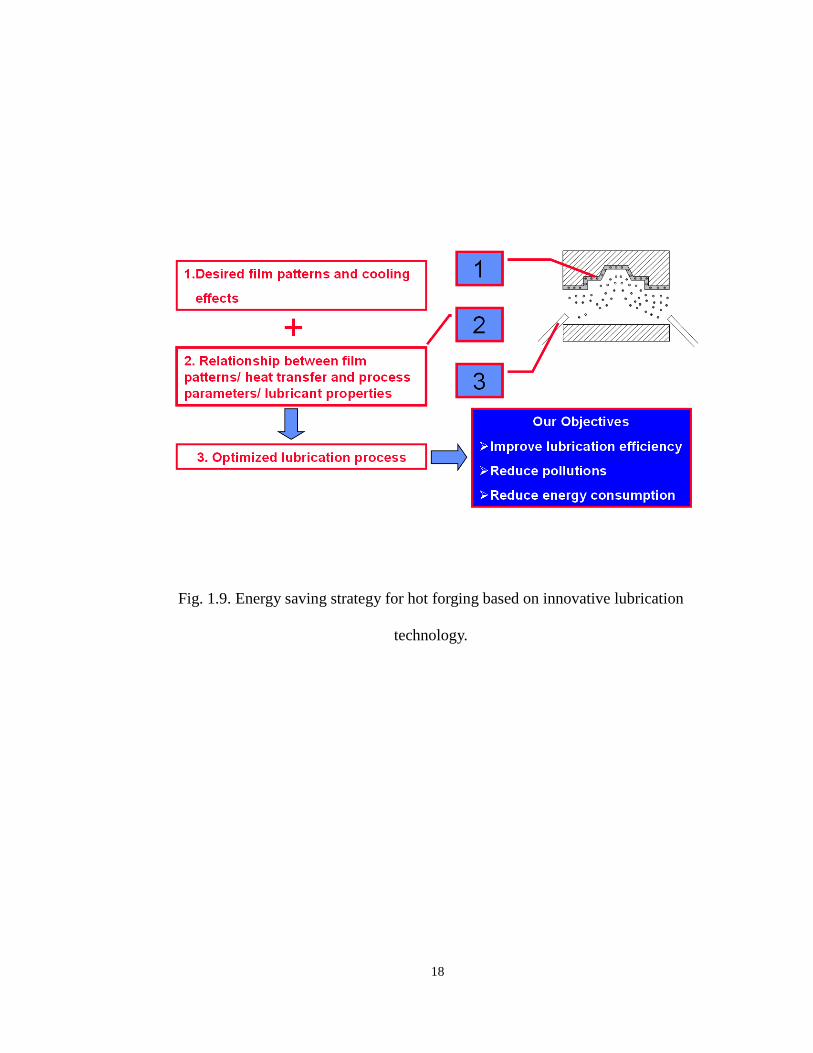
1.1.3 Technological Strategy to Reduce Energy
As discussed above, technologies of innovative controllable lubrication introduce
significant energy reduction in hot forging, without considering indirect saving such as
die life improvement. However, two critical questions come up:
What is the optimized lubrication pattern which produces most energy saving?
How do we apply the lubricant on dies to obtain desired lubricant patterns?
These two questions compose our energy saving strategy as shown in Fig. 1.9. Three
parts are related to each other in this strategy:
Setup desired film patterns;
Establish relationship between film patterns/ heat transfer and process parameters/
lubricant properties;
Optimize lubricant process to achieve our energy saving and pollution reduction
goals.
This strategy is broken down to detailed tasks on which a road map is based.
This research has been focused on the second part of the strategy, i.e., to find relationship
influences of the lubricant properties and the method of lubricant application on the film
formation and thermal behavior when the lubricant is applied to the die.
18
Fig. 1.9. Energy saving strategy for hot forging based on innovative lubrication
technology.

19
1.2 Objective of the Research
In order to obtain required lubricant patterns and thermal management through a
controlled spray process, the objective of this research is to build models that relate the
formation of lubricant film and heat transfer phenomena of the die to lubricant properties
and lubricant application characteristics.
A lubricant spray consists of tens of thousands of droplets which interact with the die,
forming a lubricant film and taking away heat of the die. The objective of this research
can be achieved by starting from droplet studies in which we focus on physical
phenomena are focused. The single droplet studies reveal physical mechanisms of the
lubricant spray and formed the basis of the selection of the spray parameters. After the
droplet mechanism has been understood, the lubricant film formation and heat transfer of
the spray can be predicted using knowledge of the spray generation. This spray modeling
process is shown in Fig. 1.10.
A part of the objective of this research is also to validate the adequacy of the models.
Extensive experimental work is needed to achieve this goal. The results from the
experimental measurements are compared to the corresponding output from the analytical
and simulation models to verify that the models adequately represent the actual lubricant
droplet-die interaction process.
20
1.3 Approach and Methodology of the Research
In order to develop the required models and validate them, the research is divided into
two parts, the analytical/simulation part and the experimental part. The analytical part is
to build models through governing equations and solve them numerically or analytically.
In the experimental part, measurements of the film formation and heat transfer are
collected in order to validate the mathematical models and to build an empirical heat
transfer coefficient model. These two parts are interwoven with each other and the final
models are based on both the parts..
The first model that this study has developed is the isothermal model for lubricant spread
on the die surface. This model aims at investigating the dynamics and spread of a
lubricant droplet on the hot die surface. The model starts with general mass and
momentum equations. The second step is to make justified assumptions pertaining to the
problem. The initial and boundary conditions of the model are then identified. After the
problem is defined, the general equations are simplified based on the assumptions and
conditions. Simplified equations are then numerically solve.

21
Fig. 1.10. Spray modeling processes.
22
The second model developed is the dryoff model in which the die surface is heated to its
working temperature (temperatures beyond so-called Leidenfrost point of the lubricants).
The assumption of the model is that the lubricant droplet begins to evaporate only after
the droplet deformation is stabilized and the kinetic energy has been completely
consumed. The mass and momentum balance equations are simplified and analytically
solved in the modeling. The dryoff times are predicted from the model for different
droplet impacts and compared with experimental results.
The experimental section of the research aims to validate the modeling criteria that are
used in the analytical/simulation modeling parts. Two categories of experimental data are
collected and compared to the analytical/simulation results. The first category is related
to the film formation. The second category of experimental data is related to heat transfer.
The experiments of heat transfer are conducted to build an empirical heat transfer
coefficient model and to map regions of physiothermodynamics of lubricant deposition
on the hot die.
Both parts of the above research are carried out using a non-dimensional concept. For
example, droplet diameter and velocity, the most dominant factors, are expressed by
Reynolds number and Weber number. Thus, instead of using the micron scale of droplet
size, we conduct experiments and simulations based on a millimeter scale dimension,
which is much more convenient to handle and accurate to measure.
23
After droplet models are built, they are used to predict the heat transfer of a spray. The
rationality of the prediction is tested by the controlled spray experiments for lubricant.
1.4 Dissertation Outline
A brief description of each chapter in this dissertation is given below:
Chapter 1 gives a brief introduction and outlines the rationale and motivation behind this
work along with the objectives and the research approach.
Chapter 2 contains background information about the general form of governing
equations and their relevance to the droplet study. This chapter also includes a thorough
review of previous studies which have been carried out in the past.
Chapter 3 presents the isothermal numerical model based on the VOF finite difference
approach for investigation of the dynamics and spread of the lubricant droplet on the hot
die surface.
Chapter 4 presents an analytical model to estimate the evaporation time of a droplet
impact on a die surface heated to temperature beyond Leidenfrost point.
24
Chapter 5 studies experimentally the effect of lubricant properties, dilution ratio, spraying
parameters and the transient nature of the hot surface on the heat transfer. The study of
droplets is extended to spray applications. A case study has been done to predict heat
transfer coefficient of a complicated spray.
Chapter 6 presents outcomes of the droplet-surface interaction based on experimental
studies. This chapter also presents results of heat flux in spray tests with graphite
suspensions in water. The experimental results are included to demonstrate an approach
to study the effect of the lubricant properties, dilution ratio, spraying parameters on the
pollution and energy consumption.
Chapter 7 summarizes research objectives and contributions of this work and presents the
proposed scope for future work.
25
CHAPTER 2
2. BACKGROUND AND LITERATURE REVIEW
Widespread use of spray in industrial applications such as spray combustion, spray
drying, spray coating, injection printing, etc, has stimulated many experimental and
analytical studies associated with droplet and sprays. Generally, there are three principal
areas among these studies. The first area is droplet or spray generation. The generation of
droplets in most industrial applications involves the breakup of liquid, i.e., atomization.
Atomization is probably the most widely used process for droplet generation [1]. In the
forging industry, lubrication sprays are produced by discharging diluted lubricant through
a nozzle, or pressure atomizer, through which the applied pressure is converted into
kinetic energy and surface energy of the droplet. Other atomizers such as rotary atomizer
[2], ultrasonic atomizer [3] and electrical droplet generator [4] are also encountered in
industry. The second area is aerodynamics and evaporation of droplets suspended in air
or chambers. Studies [5-6] in this area are extensively conducted related to internal
combustion engines because the control of the droplet size and dispersal of the droplets in
the combustion chamber is an important phenomenon. The third area concentrates on
droplet deformation and heat transfer or phase changes on a surface. Fields such as spray
26
painting, spray coating and spray cooling are all related to this research area. Lubrication
spray in hot forging is one of the third category fields that need knowledge about
deformation and heat transfer of droplets impacting on a surface.
Lubrication in hot forging starts by the insertion of spray nozzles between the upper and
lower dies just after a formed part is taken from the dies. Lubricant is sprayed to required
thickness on the dies. The next billet can be seated on the die only after the dies are
cooled to the desired temperature, i.e., 300-350oC for H13 dies, and the lubricant
completely dries off. The time needed to cool the dies and deposit lubricant normally
takes the majority of each forging cycle, which varies from several seconds to tens of
seconds depending on the part size. Hence the efficiency of cooling and deposition
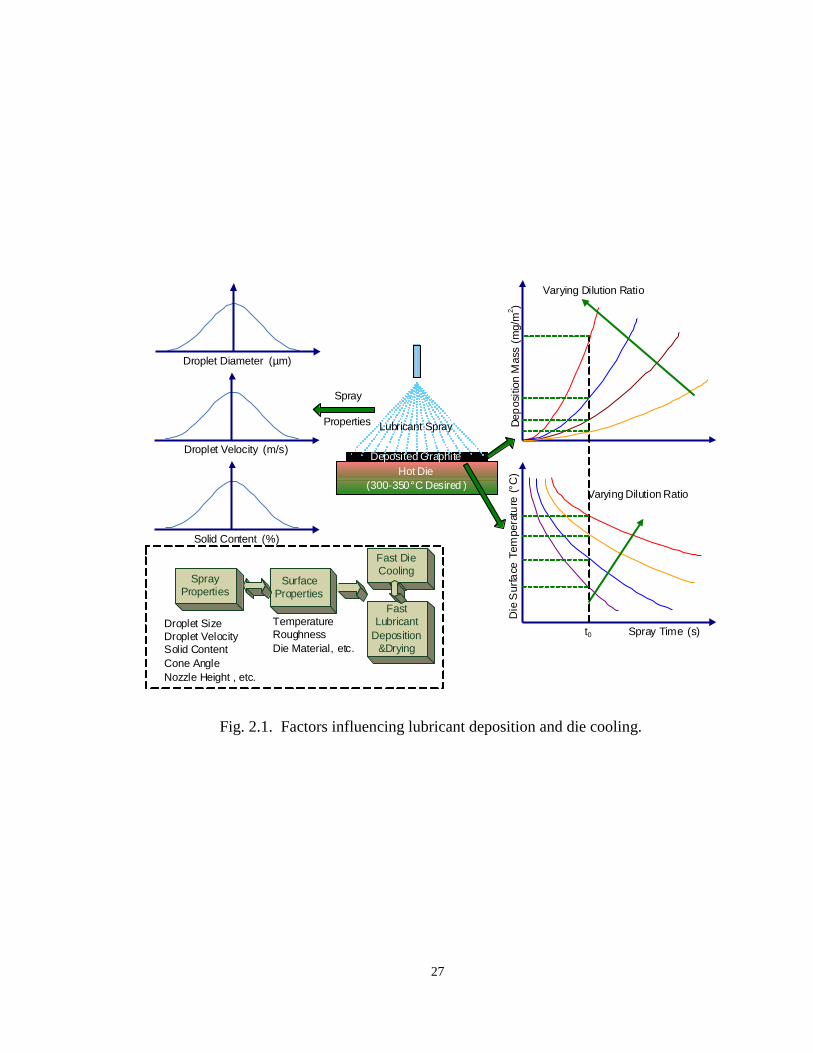
greatly influences the productivity of the forging process. As schematically shown in Fig.
2.1, there are many factors which influence die cooling and lubricant deposition for a
given lubricant spray duration. The factors are categorized into two groups: die surface
properties and spray properties. The die surface properties include the initial temperature,
roughness and die geometry. The spray properties involve droplet size, droplet velocity,
dilution ratio or solid content, spray cone angle and nozzle height, just to name a few.
Therefore, we need to estimate and predict the effects of changing spray parameters such
as droplet size, impaction velocity, etc., and lubricant properties on the deposition
patterns and heat transfer during the sprays on the die. Analysis of single droplet impact
on a hot flat die is a fundamental study to fulfill this purpose.
27
Hot Die
(300-350°C Desired )
Lubricant Spray
Deposited Graphite
Dep
osi
tion
Mass
(m
g/m
2)
Spray Time (s)
Die
Surfa
ce T
em
pera
ture
(°C
)
Varying Dilution Ratio
Varying Dilution Ratio
t0
Droplet Diameter (µm)
Droplet Velocity (m/s)
Solid Content (%)
Spray
Properties
Spray
PropertiesSurface
Properties
Fast Die
Cooling
Fast
Lubricant
Deposition
&Drying
Droplet Size
Droplet Velocity
Solid Content
Cone Angle
Nozzle Height , etc.
Temperature
Roughness
Die Material, etc.
Fig. 2.1. Factors influencing lubricant deposition and die cooling.
28
Thanks to the advances in computational power and commercial CFD codes, research of
droplet in fields such as combustion engine, inkjet printing and thermal deposition, has
made a lot of progress during the last few decades. However, very little research has been
done in the field of hot forging and the fundamental aspects of the problem have received
very little attention by the researchers in this field.
In modeling lubricant droplet in a hot forging process, many issues have to be addressed.
Among these issues, the two most important are droplet flow at impaction, and thermal
analysis of the cooling effect. In this chapter, we will first review the governing equations
of the fluid flow and heat transfer, and then the previous studies on droplet-surface
interactions. Studies on spray cooling are also reviewed.
2.1 Governing Equations
Fluid flow modeling is used to predict flow patterns when a droplet collides with a die so
that we may obtain a better insight into the fluid flow behavior of the lubricant, thus
improving its deposition. This has a significant impact on the metal flow in metal
forming due to controlled lubrication, and therefore achievement of better quality parts
and longer life dies. The conservation of mass and conservation of momentum are always
applied as general governing equations for a droplet impacting on a wall.
29
One of the important roles of the lubricant is to chill down the temperature of the die so
that the die maintains required hardness and toughness. When sprayed on the die surface,
which usually reaches a temperature as high as 700oC, the lubricant takes heat from the
die by conduction, convection and radiation, the three mechanisms of heat transfer. Large
amount of heat loss is also caused by the phase change of the lubricant too. When the
temperature of the die climbs over the so called Leidenfrost point, the area of the heat
transfer surface is covered with a stable blanket of steam, preventing contact between the
heat transfer surface and the spreading liquid. This is discussed in detail in chapter 3.
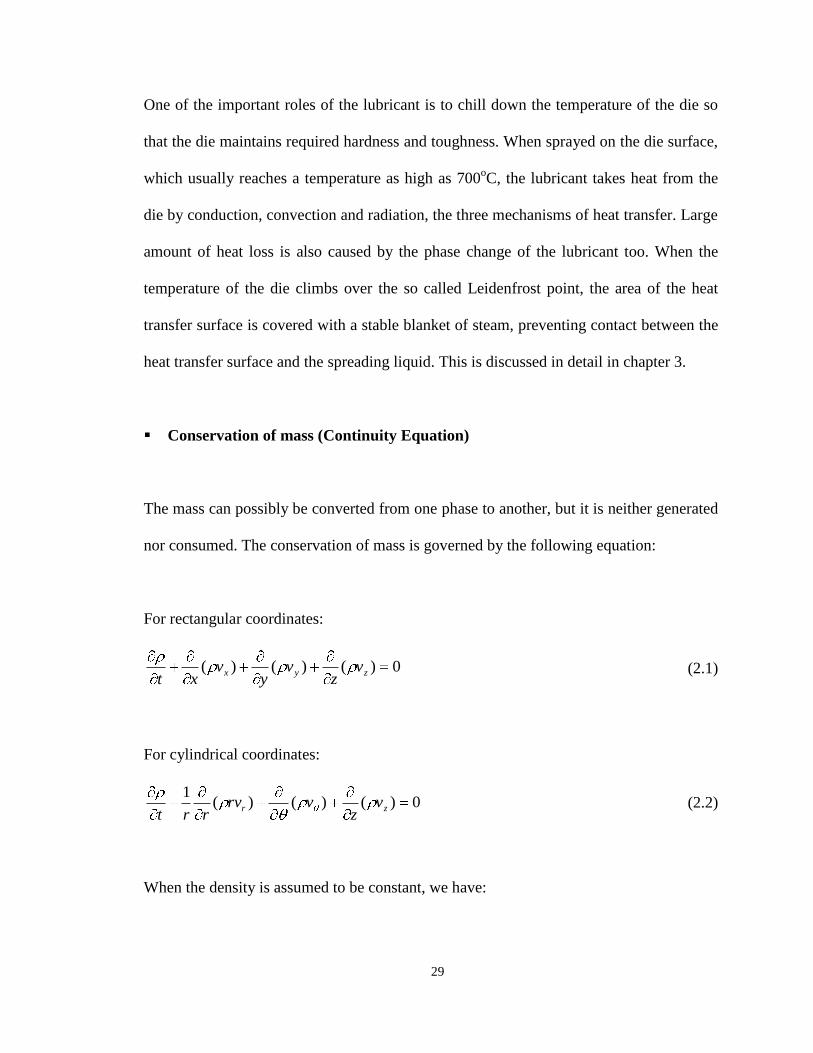
Conservation of mass (Continuity Equation)
The mass can possibly be converted from one phase to another, but it is neither generated
nor consumed. The conservation of mass is governed by the following equation:
For rectangular coordinates:
0)()()( zyx vz
vy
vxt
(2.1)
For cylindrical coordinates:
0)()()(1
zr vz
vrvrrt
(2.2)
When the density is assumed to be constant, we have:

30
For rectangular coordinates:
0z
v
y
v
x
v zyx (2.3)
For cylindrical coordinates:
0)(1
z
vvrv
rr
zr (2.4)
Conservation of momentum
All fluid flow must follow Newton’s second law of motion. Considering the surface force
and body force exerted on the fluid, the general momentum balance equations in terms of
Newton’s second law of motion are:
For rectangular coordinates,
x
zxyxxxx
z
x
y
x
x
x bzyxx
p
z
vv
y
vv
x
vv
t
v (2.5a)
y
zyyyxyy
z
y
y
y
x
yb
zyxy
p
z
vv
y
vv
x
vv
t
v (2.5b)
zzzyzxzz
zz
yz
xz b
zyxz
p
z
vv
y
vv
x
vv
t
v (2.5c)
31
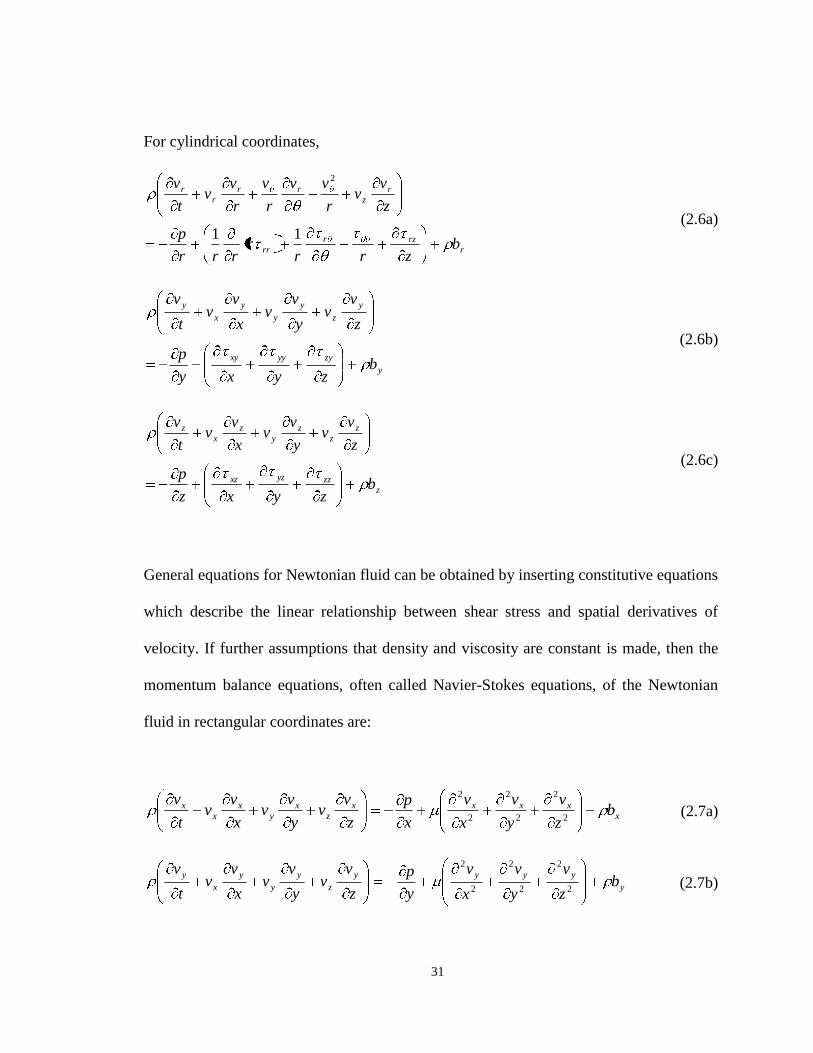
For cylindrical coordinates,
r
rzr
rr
r
z
rr
r
r
bzrr
rrrr
p
z
vv
r
vv
r
v
r
vv
t
v
11
2
(2.6a)
y
zyyyxy
y
z
y
y
y
x
y
bzyxy
p
z
vv
y
vv
x
vv
t
v
(2.6b)
z
zzyzxz
z
z
z
y
z
x
z
bzyxz
p
z
vv
y
vv
x
vv
t
v
(2.6c)
General equations for Newtonian fluid can be obtained by inserting constitutive equations
which describe the linear relationship between shear stress and spatial derivatives of
velocity. If further assumptions that density and viscosity are constant is made, then the
momentum balance equations, often called Navier-Stokes equations, of the Newtonian
fluid in rectangular coordinates are:
x
xxxx
z
x
y
x
x
x bz
v
y
v
x
v
x
p
z
vv
y
vv
x
vv
t
v2
2
2
2
2
2
(2.7a)
y
yyyy
z
y
y
y
x
yb
z
v
y
v
x
v
y
p
z
vv
y
vv
x
vv
t
v2
2
2
2
2
2
(2.7b)
32
zzzzz
zz
yz
xz b
z
v
y
v
x
v
z
p
z
vv
y
vv
x
vv
t
v2
2
2
2
2
2
(2.7c)
For cylindrical coordinates,
rrr
r
rz
rrr
r
bz
vv
r
v
rrv
rrrr
p
z
vv
r
vv
r
v
r
vv
t
v
2
2
22
2
2
2
211
(2.8a)
bz
vv
r
v
rrv
rrr
p
r
z
vv
r
vvv
r
v
r
vv
t
v
r
zr
r
2
2
22
2
2
2111
(2.8b)
zzzz
zz
zzr
z
bz
vv
rr
vr
rrz
p
z
vv
v
r
v
r
vv
t
v
2
2
2
2
2
11
(2.8c)
Conservation of Energy
The general form of the governing equation for heat transport is in terms of the energy
conservation law, the first law of thermodynamics. By balancing the kinetic energy,
internal energy, heat change and the work done by the mechanical forces, we have the
energy conservation equation in material derivative form:
33
RDTkDt
DpL
Dt
DTc pp
:)( (2.9)
where the D/Dt is called the material derivative.
In Cartesian coordinates system
zv
yv
xv
tDt
Dzyx
(2.10)
When the density is constant, the term Dt
DpLp in Equation (2.9) drops out because the
work of volume change equals zero. If the thermal conductivity of the material is
constant and isotropic, Equation (2.7) reduces to:
RDTkDt
DTc p
:2 (2.11)
If a Newtonian fluid is considered, the equation can be further reduced to:
RTkDt
DTc p
22 (2.12)
where is the scalar strain rate.

34
In rectangular coordinates, Equation (2.11) is written in the form:
Rz
v
x
v
y
v
z
v
x
v
y
v
z
v
y
v
x
v
z
T
y
T
x
Tk
z
Tv
y
Tv
x
Tv
t
Tc
xzzyyx
zyx
zyxp
222
222
2
2
2
2
2
2
2 (2.13)
In Cylindrical coordinates:
Rz
v
r
vv
rz
v
r
v
rr
v
r
z
vv
v
rr
v
z
TT
rr
Tr
rrk
z
Tv
T
r
v
r
Tv
t
Tc
rzzr
zr
r
zrp
222
222
2
2
2
2
2
11
12
11 (2.14)
2.2 Free Surface Modeling
When a droplet impacts on the die surface, the liquid surface position changes with time.
The droplet-surface interaction problem involves moving boundaries and the position and
shape of the liquid surface must be determined as part of the solution. The process of
determining the moving boundary is often called free surface modeling. The momentum
balance technique is one of the widely used computational techniques for modeling flow
free surface problems. The standard approach is to numerically solve the Navier-Stokes
35
equations as embodied in the Marker-and-Cell (MAC), Simplified Marker and Cell
(SMAC), and the Solution Algorithm - Volume of Fluid method (SOLA-VOF).
Harlow and Welch developed the MAC technique in 1965 [7]. The technique is for the
numerical investigation of the time-dependent flow of an incompressible fluid, the
boundary of which is partially confined and partially free. The solution technique makes
use of finite difference approximations applied to the full Navier-Stokes equations. The
primary dependent variables are the pressure and the velocity. The space is divided into a
number of subdivisions, called cells, which are usually rectangular. A set of marker
particles, which do not participate in the calculation, is introduced to the system to
represent the location of the fluid at any instant. They will move according to the velocity
components in their vicinities. A cell with no marker particle is considered to contain no
fluid. A cell with markers, but having a neighboring cell with no markers, is defined as
containing a free surface. All the other cells with particles are considered to be filled with
fluid. SMAC, developed in 1970 by A.A. Amsden and F.H. Harlow [8], uses the same
Eulerian mesh and marker particles, with time advancement through finite intervals to
obtain the solution. It is a simplified version of MAC. This more efficient solution
technique is implemented by not explicitly calculating the pressure and instead using a
pseudopressure. Instead of depicting the fluid configuration with a set of marker particles,
the VOF method [9] defines a volume of fluid fraction function F. F of value one is for a
cell full of fluid, while a zero value would indicate that the cell is empty, and between
one and zero means a cell containing a free surface. In addition to defining which cells
contain a free surface, the VOF method also defines where fluid is located in a boundary
36
cell. The normal direction to the boundary lies in the direction in which the value of F
changes most rapidly.
2.3 Literature Review
This review is categorized into two groups: studies on droplet-surface interaction and
those on spray-surface interaction. There are many theoretical, modeling and
experimental studies during the last decade on the phenomena related to droplet
deformation and thermal behavior when it hits on a wall. However, although some
studies have been conducted on lubricant spray in die casting and metal rolling, limited
research has been done in hot forging processes. Most of the studies concentrated on the
effects of atomization methods and spray operating parameters on the cooling effects.
Even fewer studies on spray cooling of the die used water-based graphite which
introduces film formation and complicates the thermal behavior of the spray.
2.3.1 Droplet-Surface Interaction
The methods of studies of droplet impact on a solid surface were chosen by the
researchers according to the phenomena they were interested in. Phenomena with only
fluid dynamics considered were studied mostly by analytical models and numerical
solutions. The numerical calculations were normally validated by experimental results in
most of the cases. Heat transfer without phase change was also analytically modelled by
37
some of the researchers. Only convection and conduction between two phases, liquid and
solid, were included in these models. Experimental methods were utilized most often
when phase change was involved in the problems studied.
Numerically Modeling
Harlow and Shannon [10] were the first to use Marker-and-Cell (MAC), a finite
differential method mentioned above, to solve momentum equations for droplet impact
on a surface. They neglected surface tension and viscous effects to simplify the problem.
However, this assumption is only applicable at the early stage of impact when inertial
effects dominate. Trapaga and Szekely [11] numerically modeled deformation process of
liquid-metal droplet impact on a solid plate using combined MAC and Volume of Fluid
(VOF) methods to track the droplet surface. Bussmann et al. [12] developed a three-
dimensional fluid flow code to simulate water droplet impact on an inclined substrate and
a step, not considering heat transfer and phase change during droplet impact. Their model
was based on RIPPLE, a 2D fixed-grid Eulerian code developed specifically for free
surface flows with surface tension. They modeled surface tension as a volume force
exerted on fluid near the free surface. The temporal variation of contact angles at the
leading and trailing edges of the droplet was considered in their studies. Their simulation
results agreed well with their photographic data. Fluid dynamics and solidification of the
tin droplet impact on a flat stainless plate was modeled in a study by Pasandideh-Fard et
al. [13]. They applied complete numerical solution of the Navier-Stokes and energy
equations to model the droplet deformation and solidification and heat transfer in the
38
substrate. The heat transfer coefficient at the droplet-surface interaction was evaluated by
matching the temperature calculated numerically from the model with measurements.
They concluded that the effect of solidification on droplet impact dynamics was
negligible if 1Pr/Ste , where Ste is Stefan number ( fiwm HTTCSte /)( , ), and Pr
is Prandtl number ( /Pr ). Pasandideh-Fard et al. [14] also studied the impact of
droplet on a stainless steel surface which was heated from 50oC to 120
oC, a controlled
temperature range low enough to prevent boiling in the droplet. VOF code was applied to
calculate the shape of droplet and substrate temperature during impact. The results of
experiments and numerical calculations agreed well. According to their results, they
concluded that for fixed Reynolds number (Re) cooling effectiveness increases with
Weber number (We).
Some other researchers utilized deforming meshes instead of the fixed-grid mentioned
above to numerically solve their models. Fukai et al. [15] presented a finite element
technique to model the droplet spreading process. All effects in momentum conservation
equations, i.e., inertial, viscous, gravitational and surface tension effects, were considered
in their model. Two liquids, water and liquid tin, were utilized in the simulation based on
the Lagarangian model and significant differences of the flow field were observed for
droplets of these two liquids. Zhao et al. [40] extended Fukai’s study to model both fluid
dynamics and heat transfer during the impact of liquid droplet on a substrate. However,
only heat transfer of convection and conduction were included and phase change
phenomena were ignored to facilitate the modeling of heat transfer. They concluded that
the maximum splat thickness might occur at the periphery of the splat where mass

39
accumulation was observed. The heat transfer results showed that temperature at the
spreading front is substantially lower than the temperature at the splat center in a molten
metal droplet.
Experimental Studies
Because most of the droplet applications in industry involve complex phase change
phenomena, the analytical modeling of the droplet-surface is not enough to thoroughly
understand the droplet-surface interactions. Experimental studies are often the only way
to evaluate thermal behavior of a droplet impact on a super-heated solid surface [16 – 19]
Mundo et al. [20] examined three liquids with different viscosities and surface tensions to
formulate an empirical model describing the deposition and splashing process. They used
a two-component phase Doppler anemometer to characterize the size and velocity of the
secondary droplets. The results showed that the outcome of an impact, splashing or
deposition, depended on the Reynolds number (Re) and Ohnesorge number (Oh).
Most other experimental studies focused on the influence of heating of the solid surface
on the droplet-collision process. Understanding the influence of surface temperature on
droplet-collision dynamics for a particular fluid requires the mapping of various boiling
regimes. The droplet-evaporation lifetime as a function of surface temperature can be
used to delineate different heat-transfer regimes, thus providing a mechanism to better
understand the influence of surface temperature on droplet-collision dynamics. Tamura

40
and Tanasawa [21] examined a droplet gently deposited on a surface and found that the
total droplet-evaporation lifetime would decrease with increasing surface temperature
until a minimum evaporation time was obtained. The Leidenfrost temperature occurred
where the total evaporation lifetime of the droplet reached a local maximum. For
temperatures greater than the Leidenfrost temperature (film boiling), the droplet-
evaporation lifetime will monotonically decrease with further increases in surface
temperature. Wachters and Westerling [22] investigated water-droplet impact on a heated
surface. In their experiments, a polished gold surface maintained at 400oC was used.
Three distinct regions were identified, each a function of the impact Weber number (We).
Makino & Michiyoshi [23] performed a water-droplet-impact study using four different
impact surfaces, namely, copper, brass, carbon steel and stainless steel. The surface
temperature was varied from 80 to 450oC and a correlation for the contact period was
obtained for all surfaces. Karl and Frohn [24] experimentally examined the mechanical
interaction processes of small droplet impact on hot solid surface heated to a temperature
well above Leidenfrost temperature. The experiments were conducted with the methods
using mono-disperse droplet streams in combination with a standard video camera. A
minimum impinging angle for droplet break-off was identified for small impact angle in
their study.
41
2.3.2 Spray-Surface Interaction
Although some studies have been conducted on lubricant spray in die casting and metal
rolling, limited research has been done in hot forging processes. Most of the studies
concentrated on the effects of atomization methods and spray operating parameters on the
cooling effects. Even fewer studies on spray cooling of the die used water-based graphite
which introduces film formation and complicates the thermal behavior of the spray.
Tseng et al. [25] examined the roll cooling system used in steel rolling mills and its
effects on the roll life by combined experimental and numerical methods. The heat
transfer coefficient was evaluated experimentally and then utilized for numerical
simulation of the rolling processes. Their results led to the conclusion that uniform
cooling minimized the cyclic stress or the resultant fatigue stress and thus extended roll
life. Horsky et al. [26] conducted cooling experiments to evaluate the heat transfer
coefficient on a steel plate heated up to 630oC which was cooled by water sprays with a
set of nozzles. The heat transfer coefficient data showed that the heat transfer drops for
pressures higher than 6 bar and the magnitude of the heat transfer coefficient for the
scaled surfaces was of approximately 1000 W/m2K lower than that for the polished
surfaces. Bariani et al. [27] developed an experimental and FE simulation combined
method to estimate the heat transfer coefficient at the tool surface during cooling and
deformation phases in hot forging processes. The heat transfer coefficient at the interface
of spray- surface was inversely analyzed by minimizing the difference of the temperature
values generated in FE model and those measured in the experiments. The heat transfer
42
coefficients were examined during cooling phases as a function of spraying parameters.
Bariani et al. [28] used this inverse calculation approach to evaluate the effect of feed
pressure and flow rate of the spray on the heat transfer coefficient between heated flat
dies and coolant experimentally. They compared the results from two different sprays:
the downward spray from the overhead nozzle and the upward spray from the beneath
nozzle. They concluded that increase of the feeding pressure and the flow rate enhanced
the heat transfer coefficient for the both spray configurations. Some of the other studies
obtained the similar conclusion that a higher liquid flux density, defined as average liquid
flow rate per unit area, provides a higher heat transfer coefficient for a given surface
temperature [29 - 31].
In fact, very little work has been done on mechanisms of cooling and film formation on
the die in hot forging from the droplet aspect. Interesting issues are introduced in this
research for a typical droplet of hot forging lubricant comparing with those of the droplet
in previous studies: 1) there are a large number of solid particles, i.e., graphite in several
to tens of microns, dispersed and initially suspended inside a droplet, 2) evaporation with
formation of bubbles inside the droplet is a significant process. Solid particles evolve into
film deposited on the die after the liquid is vaporized. These particles not only influence
fluid mechanics during droplet impact but also complicate heat transfer and evaporation,
an intractable process itself even in the absence of particles.

43
Hence, the main purpose of this research was to establish a model to estimate effects of
changing parameters such as droplet size, impaction velocity and lubricant properties on
the deposition patterns during droplet hitting the die at a wide range of temperature.

44
CHAPTER 3
3. LUBRICANT SPREAD IN THE SPRAYING OF HOT DIE SURFACES
This chapter proposes an isothermal numerical model based on the VOF finite difference
approach for investigating the dynamics and spread of lubricant droplet on hot die
surface. The lubricant properties for this model are calculated in simple capillary
experiments. This model is validated by comparing with spreading results from single
droplet experiments at different lubricant dilution ratios (lubricant properties) and droplet
kinetics. It is found that the isothermal assumption is valid for surface temperatures
where no-steam forms, less than the Leidenfrost temperatures. It is also found that a
simple linear relationship exists in the logarithmic scale between the spread factor and the
Weber number for dilution ratios less than equal to unity (for dilute suspensions).
3.1 Introduction
In the hot forging processes, the dies are lubricated and cooled by spraying dilute water
based lubricants on the heated die surfaces. This spray is produced by atomizing
lubricants into small droplets using spray devices with pressurized air. The lubricant is
45
often a fine suspension of fine graphite particles in water, with surfactants and binders
added to aid in the spreading and formation of adherent lubricant films. In addition, this
lubricant spray is used to maintain the thermal conditions of the die surface suitable for
metal flow in deep cavities. As the phenomena of spraying, spreading and film formation
are poorly understood, the lubricant is often applied in large quantities resulting in
excessive cooling of the surface, and excess graphite in the die cavities, and the
atmosphere. While excessive chilling of die surfaces causes poor metal flow and filling of
die cavities, excess graphite leads to air and ground water pollution. Consequently,
understanding the ideal spraying conditions for lubricant spread and film formation has
become critical to both the manufacturing and lubrication community.
The important factors governing the mechanics and thermodynamics of the spray
deposition can be categorized into three groups: those related to the hot die surface, those
related to the lubricant properties, and those related to the spray characteristics. The
factors related to die surface include the initial surface temperature, its roughness, its
geometry (cavity design) and surface treatments (such as diffusion treatments or coatings).
Important lubricant properties include surface tension and viscosity. Lastly, the spray
characteristics involve droplet size, droplet velocity, dilution ratio (or solid content) and,
spray cone angle and nozzle height. Composition of the lubricant and the selection of the
spray parameters are often determined by the lubrication and cooling needs of the
intended application.

46
The primary objective of this study is to develop a model that captures the mechanics of
lubricant spread as the spray droplets impact the hot die surface. This spread governs the
thickness of the resultant film and the heat transfer from the hot die surface. Such a
model would enable optimal design of the lubrication process and consequently,
significant reduction in the graphite related pollution.
This phenomenon of wetting and spreading in spray lubrication in hot forging is difficult
to study and model due to the following reasons:
The spray consists of very fine droplets with random distribution of size (tens to
hundreds of microns in diameter) and velocity (several to tens meters per second).
A methodology must be adopted to quantify the spray characteristics.
The lubricant properties and dilution ratios (amount of water added to dilute the
liquid) affect the physics of the droplet mechanics. They vary considerably from
application to application. This model must include these properties and
parameters.
The physics and thermodynamics of the spreading phenomenon are complicated
by its transient and evolving nature. The lubricant droplet impacts the hot die
surface at temperatures between 250 to 450oC. At these temperatures steam forms
first, followed by nucleate boiling, convective cooling and dry-off (evaporation).
47
It may be very difficult, if not impossible, to develop a single model that can
represent all these phenomena.
In order to make the problem solvable, it was decided to make several assumptions and
limit the scope of the model. First, it was decided to represent the spray by the Sauder
Mean Diameter (an average diameter for log-normal distribution). This assumption will
permit the spray to be represented by single droplet experiments. Second, it was decided
to use non-dimensional numbers, using the similarity principle, to quantify the physics of
the process. These numbers will enable the simple model to represent many physical
conditions (lubricant properties, droplet diameters, impact velocities etc.). Third, it was
decided to limit this study to lower surface temperatures where two phase flow is not
present. Finally, it was decided to develop a numerical model that will permit application
of the governing equations to complicated geometries and boundary conditions.
The phenomenon of a droplet impact on hot surface has been studied by many
researchers since the classical work of Leindenfrost. Most of the previous work is on
water droplets and the heat transfer resulting from the evaporation and boiling of the
liquid. The study of the droplet spread during impact has applications to painting, thermal
spray coatings, rapid solidification, lubrication etc. Earlier studies were mainly
experimental with high speed or flash photography used to capture droplet dynamics [32-
37]. An interesting study was carried out by Makino and Michiyoshi [23] with water
droplets on heated surfaces (350oC). They found that for temperatures below Liedenfrost
(<200oC), the droplet spread factor became independent of surface temperature. In 1991,
48
Chandra and Avedisian [38] used flash photography to capture dynamics of n-heptane
droplet (about 1.5 mm) on heated (24 to 260oC) stainless steel surface at. Weber numbers
kept fixed at 43. They also found that for lower temperatures, below Leidenfrost point,
the spread factor became independent of surface temperature. Recently, Manzello and
Yang [39] studied the impact dynamics of water diluted sodium acetate trihydrate droplet
(diameter 2.7 mm) on a stainless steel heated surface (from 20 to 340oC). They confirmed
the previous findings that below 230 o
C (below Leidenfrost point) the droplet spread did
not depend on the surface temperature. From these studies with water and other liquids it
can be concluded that in the nucleate boiling and convection boiling regimes, the droplet
spread is mainly governed by the droplet dynamics and independent of surface
temperature and heat transfer. This may be due to small dry-off times (high heat transfer)
at these temperatures with no-steam formation. This results in inertia and viscous forces
to dominate the droplet spread.
Development of numerical models for droplet impact on a solid surface has also received
much attention. For example, Harlow and Shannon [7] were the first to use Marker-and-
Cell (MAC), a finite differential method, to solve momentum equations for droplet
impact on a surface. They neglected surface tension and viscous effects for the simple of
the problem. However, this assumption only applies at the early stage of impact when
inertial effects dominate. Trapaga and Szekely [11] numerically modeled the deformation
process of a liquid-metal droplet on impact with a solid plate using combined MAC and
Volume of Fluid (VOF) methods to track the droplet surface changes. Bussmann et al.
[12] developed a three-dimensional fluid flow model to simulate water droplet impact on
49
an inclined substrate and a geometrical step; not considering heat transfer and phase
change during droplet impact. Their model was based on RIPPLE, a 2D fixed-grid
Eulerian code developed specifically for free surface flows with surface tension. They
modeled surface tension as a volume force exerted on the fluid near the free surface. The
temporal variation of contact angles at the leading and trailing edges of the droplet was
considered in their studies. Their simulation results agreed with their photographic data.
Fluid dynamic and solidification of the molten tin droplet impact on a flat stainless plate
was modeled by Pasandideh-Fard et al [13]. They applied the numerical solution of
Navier-Stokes and energy equations to model the droplet deformation and solidification,
and heat transfer in the substrate. The heat transfer coefficient at the droplet-surface
interaction was evaluated by matching the temperature calculated numerically from the
model with measurements. They concluded that the effect of solidification on droplet
impact dynamics was negligible if the factor 1Pr/Ste , where Ste is Stefan number
( fwmp HTTCSte /)( 0, ), and Pr is Prandtl number ( /Pr ). Pasandideh-Fard et al.
[14] also studied the impact of droplet on a stainless steel surface which was heated from
50oC to 120
oC, a controlled temperature range low enough to prevent boiling in the
droplet. VOF code was applied to calculate the shape of droplet and substrate temperature
during impact. The results of experiments and numerical calculations agreed well.
According to their results, they concluded that for fixed Reynolds number Re cooling
effectiveness increases with Weber number We.
Other researchers utilized deforming meshes instead of fixed-grid techniques to
numerically solve their models. Fukai et al. [15] presented a finite element technique to
50
model the droplet spreading process. All the factors in momentum conservation equations,
such as inertia, viscosity, gravity and surface tension, were considered in their model.
Two liquids, water and liquid tin, were utilized in their simulation based on the
Lagarangian description. Significant differences of the flow field were observed for
droplets of these two liquid. Zhao et al. [40] extended Fukai’s study to model both fluid
dynamics and heat transfer during the impact of liquid droplet on a substrate. However,
only heat transfer of convection and conduction were included and phase change
phenomena were ignored to facilitate the modeling of heat transfer. They concluded that
the maximum splat thickness might occur at the periphery of the splat where mass
accumulation was observed. The heat transfer results showed that temperature at the
spreading front is substantially lower than the temperature at the splat center in a molten
metal droplet.
In this chapter, an isothermal finite difference VOF based numerical model is proposed
for studying droplet dynamics and spread. The isothermal assumption is based on the
demonstration by previous researchers that for temperatures lower than Leidenfrost, the
droplet spread is independent of surface temperature. Hence, heat transfer plays a minor
role in the mechanics of spread in this temperature range where the heat transfer is very
high and dry-off times short. The physical constants for this model are determined by
simple single droplet experiments. The model is applied to different lubricant dilution
ratios, surface temperatures and range droplet kinetics (Weber numbers). The predictions
of the model are validated by comparing with results of single droplet experiments.

51
3.2 Theoretical Analysis
The complexity of the fluid dynamical aspects of droplet impact on a solid surface is
exemplified by the extreme deformation of the droplet surface occurring within very
short time scale. The model presented here simulates the impact of a liquid droplet on a
solid from the moment that the lubricant droplet comes into contact with the die surface
and proceeding until the droplet becomes rest after the spreading process is completed or
it is terminated at any desired time. The numerical solution based on VOF method is
subsequently presented.
3.2.1 Governing Equations
As shown in the Fig. 3.1, for the ease of problem description and boundary condition
writing, the cylindrical coordinates are used to define the conservation equations. Any
point of the droplet can be described by r, z, and θ, which are the radial, axial and
azimuthal coordinates.
Conservation of Mass
As we have discussed in Chapter 2, the equation of mass balance for cylindrical
coordinates can be written as:
0)()()(1
zr vz
vrvrrt
(3.1)

52
r
z
),,(111
zrA
o
Fig. 3.1. The Cylindrical Coordinate description of lubricant droplet on a solid surface.
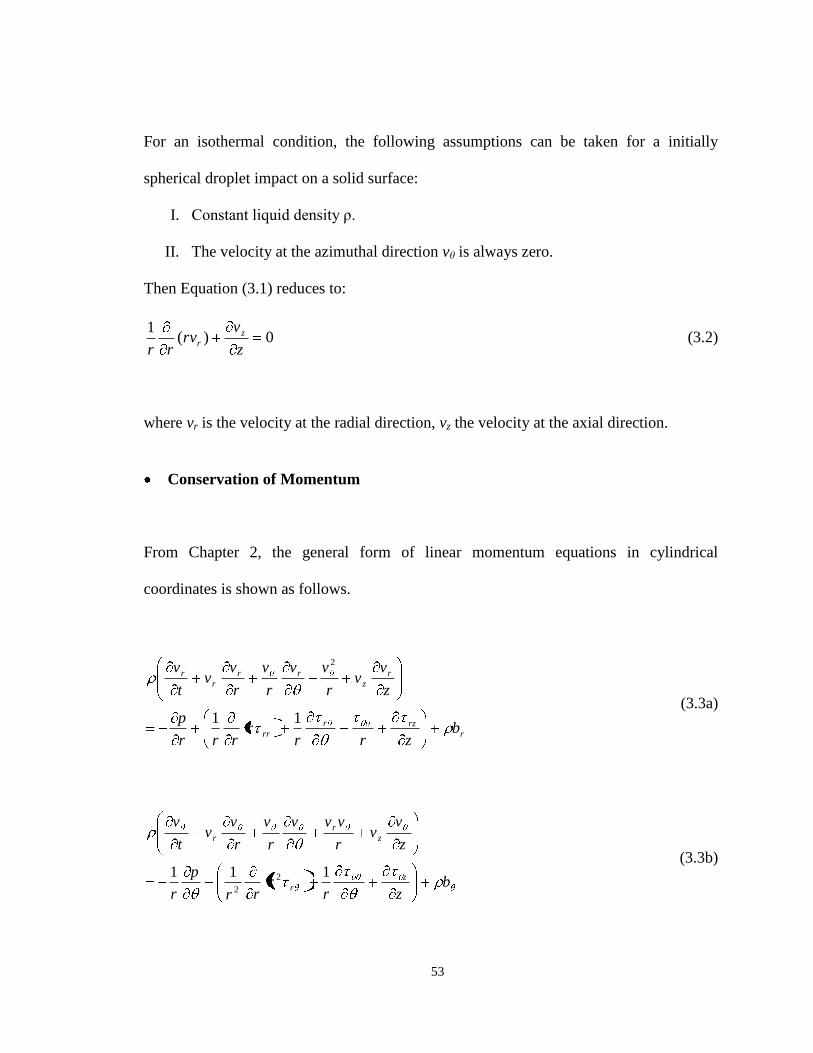
53
For an isothermal condition, the following assumptions can be taken for a initially
spherical droplet impact on a solid surface:
I. Constant liquid density ρ.
II. The velocity at the azimuthal direction vθ is always zero.
Then Equation (3.1) reduces to:
0)(1
z
vrv
rr
zr (3.2)
where vr is the velocity at the radial direction, vz the velocity at the axial direction.
Conservation of Momentum
From Chapter 2, the general form of linear momentum equations in cylindrical
coordinates is shown as follows.
r
rzr
rr
r
z
rr
r
r
bzrr
rrrr
p
z
vv
r
vv
r
v
r
vv
t
v
11
2
(3.3a)
bzr
rrr
p
r
z
vv
r
vvv
r
v
r
vv
t
v
z
r
z
r
r
111 2
2
(3.3b)
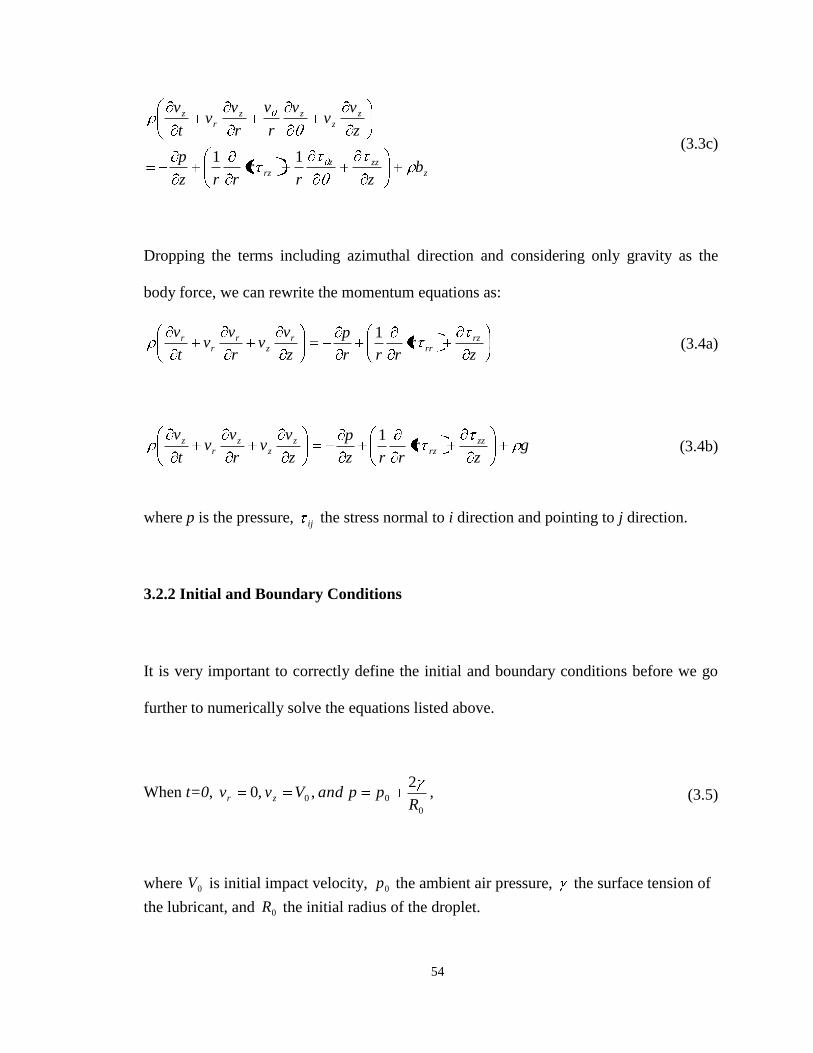
54
z
zzz
rz
z
z
zz
r
z
bzr
rrrz
p
z
vv
v
r
v
r
vv
t
v
11 (3.3c)
Dropping the terms including azimuthal direction and considering only gravity as the
body force, we can rewrite the momentum equations as:
zr
rrr
p
z
vv
r
vv
t
v rzrr
rz
rr
r 1 (3.4a)
gz
rrrz
p
z
vv
r
vv
t
v zzrz
zz
zr
z 1 (3.4b)
where p is the pressure, ij the stress normal to i direction and pointing to j direction.
3.2.2 Initial and Boundary Conditions
It is very important to correctly define the initial and boundary conditions before we go
further to numerically solve the equations listed above.
When t=0, 0
00
2 , ,0
RppandVvv zr , (3.5)
where 0V is initial impact velocity, 0p the ambient air pressure, the surface tension of
the lubricant, and 0R the initial radius of the droplet.
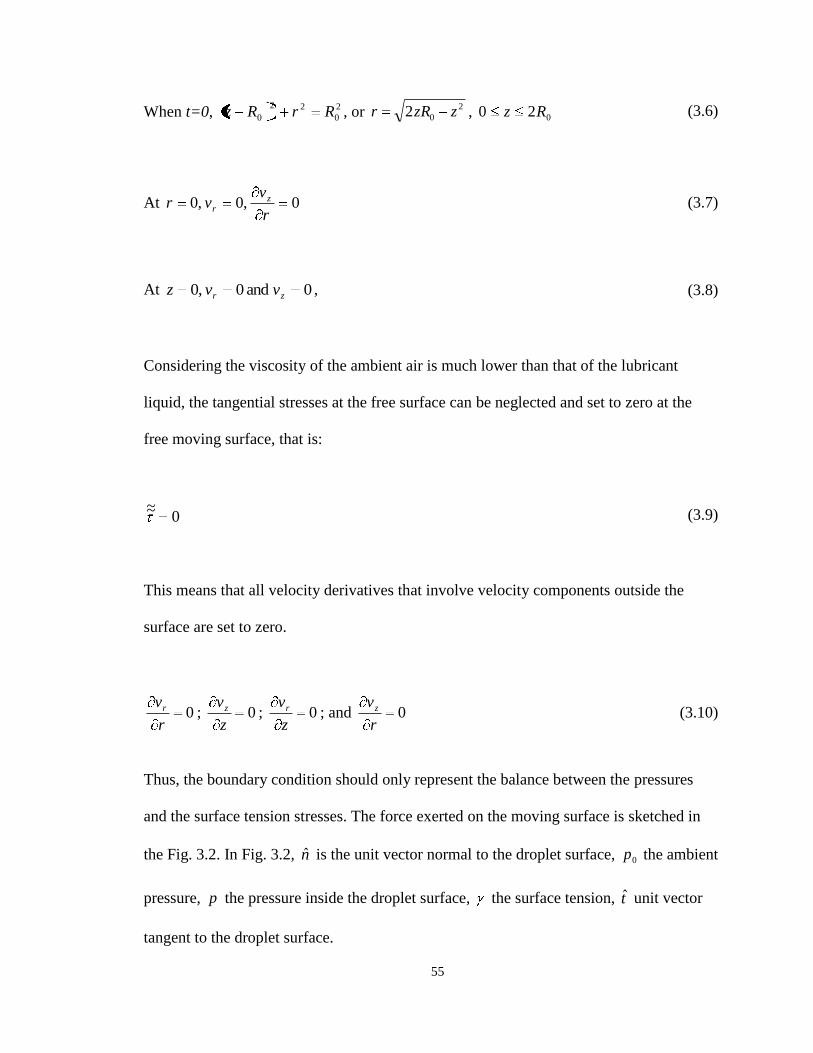
55
When t=0, 2
0
22
0 RrRz , or 2
02 zzRr , 020 Rz (3.6)
At 0 ,0 ,0r
vvr z
r (3.7)
At 0 and 0 ,0 zr vvz , (3.8)
Considering the viscosity of the ambient air is much lower than that of the lubricant
liquid, the tangential stresses at the free surface can be neglected and set to zero at the
free moving surface, that is:
0 ~~ (3.9)
This means that all velocity derivatives that involve velocity components outside the
surface are set to zero.
0 r
vr ; 0 z
vz ; 0 z
vr ; and 0 r
vz (3.10)
Thus, the boundary condition should only represent the balance between the pressures
and the surface tension stresses. The force exerted on the moving surface is sketched in
the Fig. 3.2. In Fig. 3.2, n̂ is the unit vector normal to the droplet surface, 0p the ambient
pressure, p the pressure inside the droplet surface, the surface tension, t̂ unit vector
tangent to the droplet surface.

56
At the free moving surface, the boundary condition should represent the balance between
the viscous and the surface tension stresses. The force exerted on the moving surface is
sketched in the Fig. 3.2.
As shown in the figure, the position along the surface is measured by the arc length s, and
the forces acted on a small increment ds on the surface are considered. The depth in the
direction perpendicular to the paper is taken as unit length for convenience of analysis.
Then, the total force acting on this area must be zero.
The pressure in the droplet provides a force of dsnp ˆ , the negative sign occurring
because the force acts opposite to the direction of n̂ . The contribution of the ambient air
to the droplet surface, the interface of the liquid and air, is due to its pressure, dsnp ˆ0 .
By introducing the unit vector t̂ that is tangent to the droplet surface, we have the surface
tension on the right side of the ds to be s
t̂ , the negative sign occurring because the
force acts opposite to the direction of t̂ . On the left side, the surface tension contribution
is dsds
tdt
s
)ˆ(ˆ .
Thus, this force balance can be written as:
0)ˆ(
ˆˆˆ ˆ 0 dsds
tdttdsnpdsnp
ss (3.11)

57
n̂
o r
z
s
t̂
dstdt /)ˆ(ˆ
dsnp ˆ
S+ds
S
dsnp ˆ0
Fig. 3.2. The boundary condition of free moving surface.

58
Considering:
tds
dnt
ds
d
ds
td
ds
tdˆˆˆ
ˆ)ˆ( (3.12)
where is the curvature of the surface. Then Equation (3.11) reduces to:
tds
dnpnp ˆ
)(ˆ)( ˆ 0 (3.13)
The second term includes the derivative of with the respect to position along the
surface. Because here we consider only fluid dynamic of the droplet and no temperature
changes along the surface, we can assume that surface tension is a constant and drop
out the derivative term in Equation (3.13). Introducing the mean curvature
212
1m , where, 21 and are the largest and smallest normal curvatures
respectively, we finally obtain the boundary condition at the droplet surface as:
mpp 20 (3.14)
Because each point on the free surface can be uniquely defined by a position vector
)](),([~~ szsrss , where s is the coordinate measured along the free surface of the
deforming droplet, as shown in Fig. 3.2. It has been shown by Lass [41] that
59
2/3222
222
])'()'[(2
'])'()'[()''''''(
zrr
rzzrrzzrrm (3.15)
Because the position of the droplet surface is part of the solution and we do not know
where the surface is, we need one more equation. Considering the normal velocity of the
surface will be the velocity of the surface itself, we obtain another boundary condition:
nnvvsurfaceˆ)ˆ~(~ (3.16)
This boundary condition can be used to find the droplet surface velocity and governs its
motion in time.
If the density ρ and viscosity μ of the lubricant is assumed to be constant, and the liquid is
regarded as Newtonian fluid, then the constitutive equation that describes the response of
the material to applied stresses is:
D~~
2~~ (3.17)
where D~~
is the rate of deformation tensor: TLLD~~~~
2
1~~, in which L
~~ is the velocity
gradient tensor and T
vL ~~~
. If Equation (3.17) is applied to Equations (3.2) and (3.3),
the balance equations turn out to be Navier-Stokes equations.

60
3.2.3 Scaling
Before proceeding to the scaling of the equations, we make a summary of what we have
obtained. The governing equations for the droplet impact on a solid surface include the
continuity balance equation (3.2), and momentum balance equation 3.4(a) and 3.4(b),
whereas the initial and boundary conditions are equations (3.5), (3.6), (3.7), (3.8), (3.10)
and (3.14), in which equations (3.10) and (3.14) are conditions for the moving free
surface of the deforming droplet surface.
In order to learn the characteristic values of all the problem variables, we use the scaling
analysis by introducing the following non-dimensional parameters:
0
*
R
rr (3.18)
0
*
R
zz (3.19)
0
*
v
vv z
z (3.20)
rc
rr
v
vv*
(3.21)
61
00
*
/ vR
tt (3.22)
0
*
/1 R
km
m (3.23)
CP
ppp 0*
(3.24)
2
0
*
v
ij
ij (3.25)
where rcv and CP characteristic values for rv and p respectively. They are unknown at
this time and will be determined in the late scaling procedure. The above non-
dimensional parameters are created so that their magnitude is of the order of one.
Introducing these non-dimensional parameters into the governing equations and initial
and boundary conditions, the scaled equations are then given by:
Scaled Mass Balance Equation
0)(1
0
*
** z
vvvr
rrv z
rrc (3.26)
62
Dividing the equation through by rcv , we have
0)(1 0*
** z
v
v
vvr
rr
z
rc
r (3.27)
Because there are only two terms in this equation, both derivatives must be )1( , and we
must have 0vvrc . So the scaled mass balance equation is:
0)(1 *
** z
vvr
rr
zr (3.28)
Scaled Momentum Balance Equations
*
***
**
0
2
0
*
*
0
*
**
*
**
*
*
0
2
0 1
zr
rrR
v
r
p
R
P
z
vv
r
vv
t
v
R
v rzrr
Crz
rr
r (3.29a)
gz
rrrR
v
z
p
R
P
z
vv
r
vv
t
v
R
v zzrz
Czz
zr
z
*
***
**
0
2
0
*
*
0
*
**
*
**
*
*
0
2
0 1 (3.29b)
Dividing the equations through by 0
2
0
R
v, we have
*
***
***
*
2
0
*
**
*
**
*
*1
zr
rrr
p
v
P
z
vv
r
vv
t
v rzrr
Crz
rr
r (3.30a)
63
2
0
0
*
***
***
*
2
0
*
**
*
**
*
*1
v
gR
zr
rrz
p
V
P
z
vv
r
vv
t
v zzrz
Czz
zr
z (3.30b)
Let 2
0vPC , the scaled momentum balance equations become:
*
***
***
*
*
**
*
**
*
*1
zr
rrr
p
z
vv
r
vv
t
v rzrr
rz
rr
r (3.31a)
Frzr
rrz
p
z
vv
r
vv
t
v zzrz
zz
zr
z 11*
***
***
*
*
**
*
**
*
*
(3.31b)
wheregR
vFr
0
2
0 is the Froude number. In a typical lubricant spray in hot forging with
average velocity of droplets 5-20 m/s and average radium 20-200 μm, the Fr is in the
range of 30 to 100,000. Thus, the gravity effect can be neglected in this case.
Scaled Initial and Boundary Conditions
I.
When 0*t , We
pandvv zr
2 ,1 ,0 *** (3.32)
II.
When 0*t , 11 2*2* rz , or )2( *** zzr , 20 *z (3.33)
III.

64
At 0 ,0 ,0*
***
r
vvr z
r (3.34)
IV.
At 0 and 0 ,0 ***
zr vvz , (3.35)
V. At the moving surface
Wep m
*
* 4 (3.36)
Where We is the Weber number: 0
2
02 RvWe .
nnvv ˆ)ˆ~(~ ** (3.37)
3.3 Numerical Solution – FLOW-3D Simulation
FLOW-3D is chosen to be the simulation tool for this study. FLOW-3D is a general
purpose, three-dimensional, computational fluid dynamic (CFD) program that has the
ability to predict flows with free surfaces. It has many capabilities. Using different input
data, researchers can select various physical options to represent a wide range of fluid
flow phenomena.

65
FLOW-3D uses the volume of fluid (VOF) method to predict free-surface fluid motions.
It numerically solves the fluid flow governing equations using finite-difference
approximations. The computational domain is divided into uniform/variable sized
rectangular cells and the geometric features are embedded in the mesh blocks. For each
cell, values are computed for the basic flow quantities (e.g., velocity, pressure,
temperature).
Before the discussion of the application of FLOW-3D for numerically solving the fluid
dynamic model of the lubricant droplet impact, it is important to understand how FLOW-
3D works to simulate the basic fluid flow, especially the Volume of Fluid (VOF) method.
In FLOW-3D free surfaces are modeled with the Volume of Fluid (VOF), a technique
first reported in Nichols and Hirt (1975), and more completely in Hirt and Nichols
(1981). The VOF method consists of three ingredients: a scheme to locate the surface, an
algorithm to track the surface as a sharp interface moving through a computational grid,
and a means of applying boundary conditions at the surface.
3.3.1 Fraction Function, Fractional Volume and Fractional Area
The fluid fraction function F is defined to be equal to 1.0 in the fluid and 0.0 outside
fluid, i.e. in the void. Averaged over a control volume (or a cell), the value of F will be
within the segment [0.0, 1.0], as shown in Fig. 3.3. The volume of fluid in a cell is
defined:
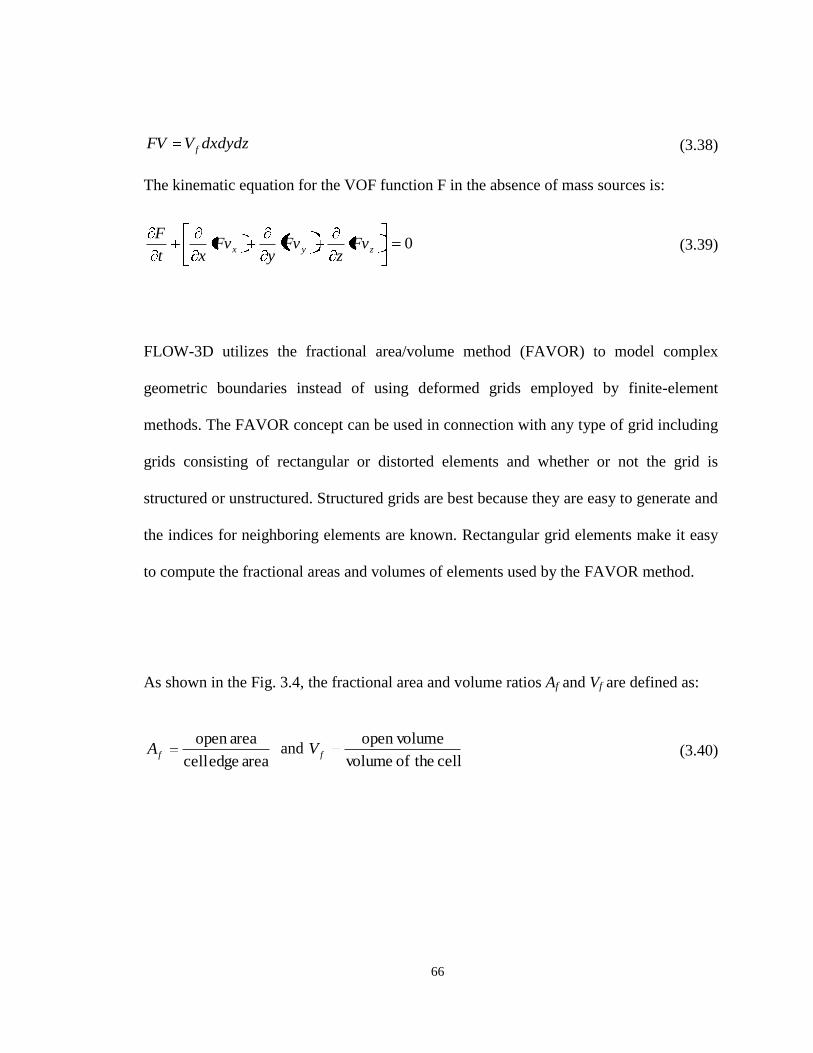
66
dxdydzVFV f (3.38)
The kinematic equation for the VOF function F in the absence of mass sources is:
0zyx Fvz
Fvy
Fvxt
F
(3.39)
FLOW-3D utilizes the fractional area/volume method (FAVOR) to model complex
geometric boundaries instead of using deformed grids employed by finite-element
methods. The FAVOR concept can be used in connection with any type of grid including
grids consisting of rectangular or distorted elements and whether or not the grid is
structured or unstructured. Structured grids are best because they are easy to generate and
the indices for neighboring elements are known. Rectangular grid elements make it easy
to compute the fractional areas and volumes of elements used by the FAVOR method.
As shown in the Fig. 3.4, the fractional area and volume ratios Af and Vf are defined as:
area edge cell
areaopen fA and
cell theof volume
eopen volumfV (3.40)
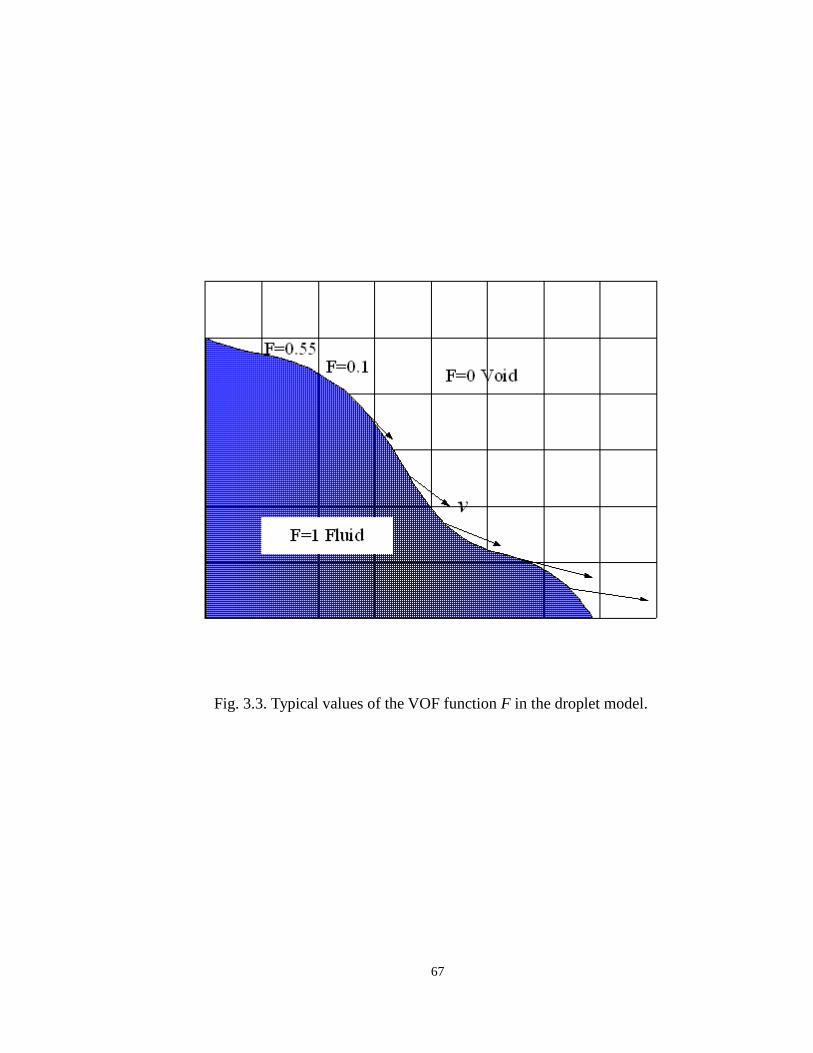
67
Fig. 3.3. Typical values of the VOF function F in the droplet model.
68
If there are geometrical constraints of the flow, then the kinematic equation of F is:
0)( FvAt
FV f
(3.41)
or
0zzyyxx vFAz
vFAy
vFAxt
F (3.42)
where fV and ),,( zyx AAAA
are the volume and area fractions describing the
geometrical constraints of the flow, ),,( zyx vvvv
is the flow velocity.
The numerical solution of Equation (3.41) or (3.42) must prevent unphysical distortion of
the interface and preserve its sharpness. The latter requirement means that the interface
between fluid and void must be no more than one cell wide.
Integrating the Af and Vf into conversion equations, we have the equation transformation
as:

69
z
CAFv
y
CAFv
x
CAFv
t
C
VFz
Cv
y
Cv
x
Cv
t
Czzyyxxzyx
1 (3.43)
Fig. 3.4. Fractional area/volume method (FAVOR).
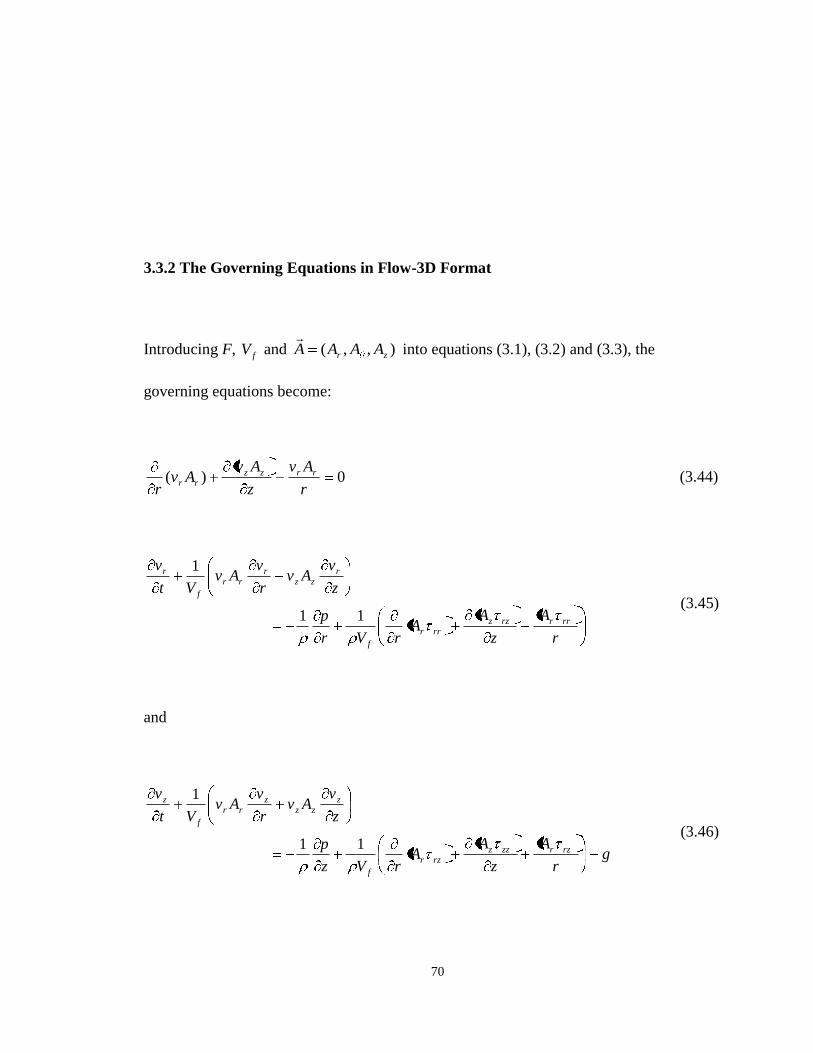
70
3.3.2 The Governing Equations in Flow-3D Format
Introducing F, fV and ),,( zr AAAA
into equations (3.1), (3.2) and (3.3), the
governing equations become:
0)(r
Av
z
AvAv
r
rrzzrr (3.44)
r
A
z
AA
rVr
p
z
vAv
r
vAv
Vt
v
rrrrzzrrr
f
rzz
rrr
f
r
11
1
(3.45)
and
gr
A
z
AA
rVz
p
z
vAv
r
vAv
Vt
v
rzrzzzrzr
f
zzz
zrr
f
z
11
1
(3.46)
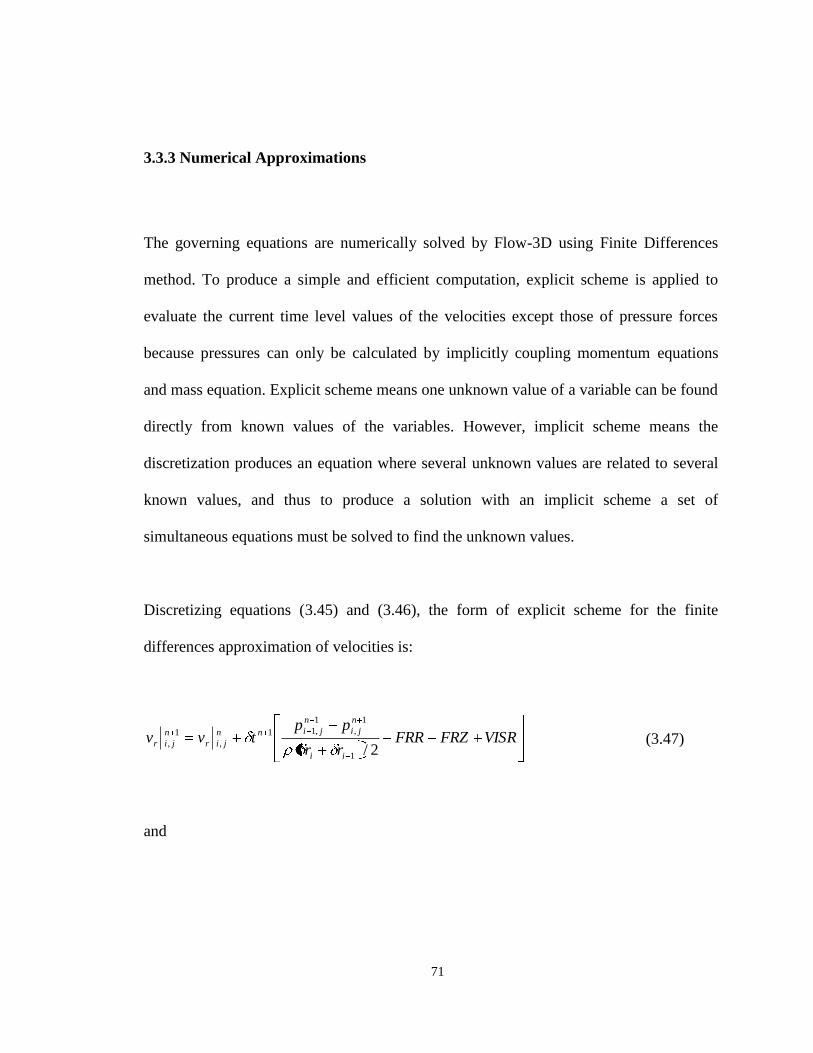
71
3.3.3 Numerical Approximations
The governing equations are numerically solved by Flow-3D using Finite Differences
method. To produce a simple and efficient computation, explicit scheme is applied to
evaluate the current time level values of the velocities except those of pressure forces
because pressures can only be calculated by implicitly coupling momentum equations
and mass equation. Explicit scheme means one unknown value of a variable can be found
directly from known values of the variables. However, implicit scheme means the
discretization produces an equation where several unknown values are related to several
known values, and thus to produce a solution with an implicit scheme a set of
simultaneous equations must be solved to find the unknown values.
Discretizing equations (3.45) and (3.46), the form of explicit scheme for the finite
differences approximation of velocities is:
VISRFRZFRRrr
pptvv
ii
n
ji
n
jinn
jir
n
jir2/1
1
,
1
,11
,
1
, (3.47)
and
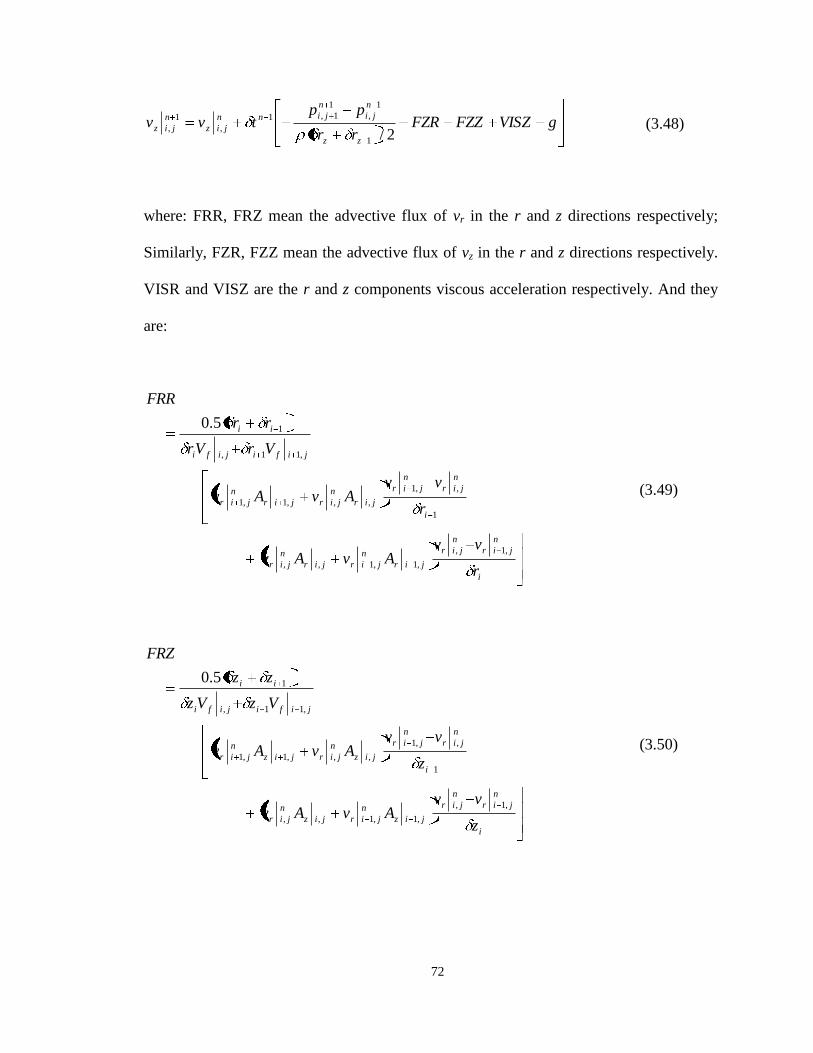
72
gVISZFZZFZRrr
pptvv
zz
n
ji
n
jinn
jiz
n
jiz2/1
1
,
1
1,1
,
1
, (3.48)
where: FRR, FRZ mean the advective flux of vr in the r and z directions respectively;
Similarly, FZR, FZZ mean the advective flux of vz in the r and z directions respectively.
VISR and VISZ are the r and z components viscous acceleration respectively. And they
are:
i
n
jir
n
jir
jir
n
jirjir
n
jir
i
n
jir
n
jir
jir
n
jirjir
n
jir
jifijifi
ii
r
vvAvAv
r
vvAvAv
VrVr
rr
FRR
,1,
,1,1,,
1
,,1
,,,1,1
,11,
1
5.0
(3.49)
i
n
jir
n
jir
jiz
n
jirjiz
n
jir
i
n
jir
n
jir
jiz
n
jirjiz
n
jir
jifijifi
ii
z
vvAvAv
z
vvAvAv
VzVz
zz
FRZ
,1,
,1,1,,
1
,,1
,,,1,1
,11,
1
5.0
(3.50)
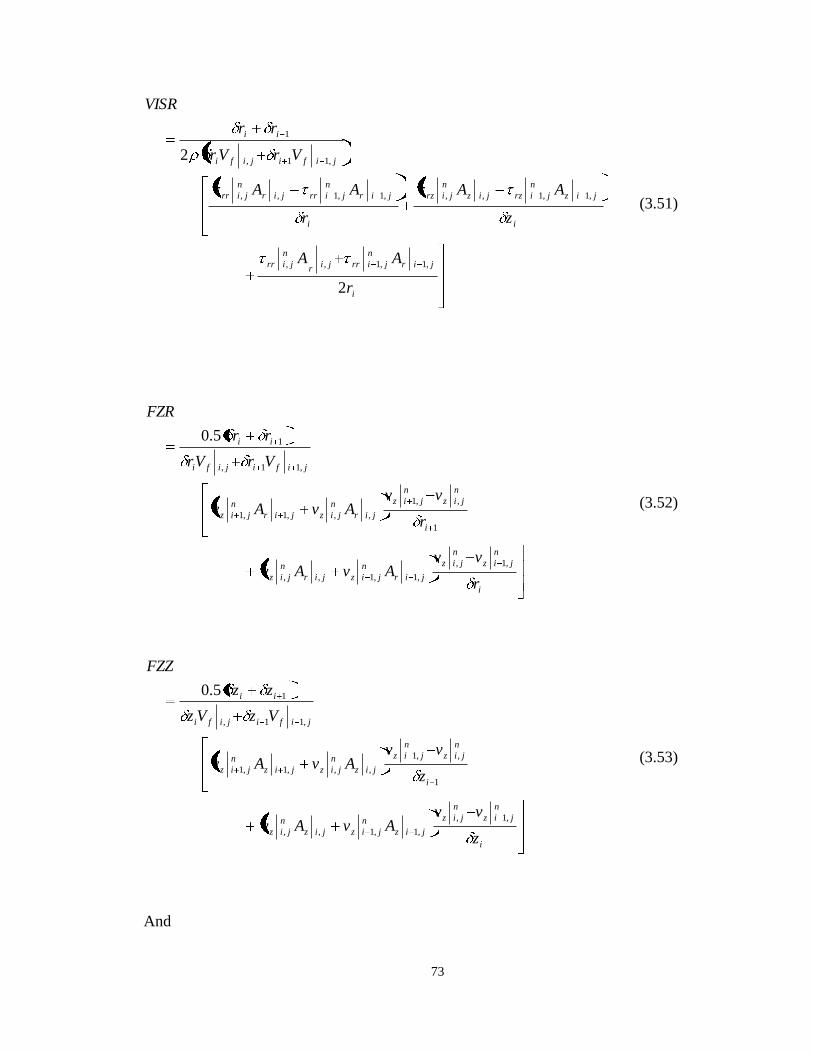
73
i
jir
n
jirrjir
n
jirr
i
jiz
n
jirzjiz
n
jirz
i
jir
n
jirrjir
n
jirr
jifijifi
ii
r
AA
z
AA
r
AA
VrVr
rr
VISR
2
2
,1,1,,
,1,1,,,1,1,,
,11,
1
(3.51)
i
n
jiz
n
jiz
jir
n
jizjir
n
jiz
i
n
jiz
n
jiz
jir
n
jizjir
n
jiz
jifijifi
ii
r
vvAvAv
r
vvAvAv
VrVr
rr
FZR
,1,
,1,1,,
1
,,1
,,,1,1
,11,
1
5.0
(3.52)
i
n
jiz
n
jiz
jiz
n
jizjiz
n
jiz
i
n
jiz
n
jiz
jiz
n
jizjiz
n
jiz
jifijifi
ii
z
vvAvAv
z
vvAvAv
VzVz
zz
FZZ
,1,
,1,1,,
1
,,1
,,,1,1
,11,
1
5.0
(3.53)
And

74
i
jir
n
jirzjir
n
jirz
i
jiz
n
jizzjiz
n
jizz
i
jir
n
jirzjir
n
jirz
jifijifi
ii
r
AA
z
AA
r
AA
VrVr
rr
VISZ
2
2
,1,1,,
,1,1,,,1,1,,
,11,
1
(3.54)
Equations (3.47) and (3.48) evaluate velocities by the advective and viscous terms of the
previous time level (n) values. However, the pressures at time level n+1 ( 1np ) are
unknown at the beginning of the cycle, and 1np in Equations (3.47) and (3.48) must be
placed by np to get a first guess for the new velocity.
The pressures must be solved by coupling the Equations (3.47) and (3.48) and the
following discretized mass balance equation:
02
,1,1,
1
,
1
,,,1
1
,
1
,,,1
1
,
i
jirjirjir
n
jir
i
jizjizjiz
n
jiz
i
jirjirjir
n
jir
r
AvAv
z
AvAv
r
AvAv
(3.55)
Then the updated pressures can be used in Equations (3.47) and (3.48) to get the values of
velocities for the next time level.

75
The initial condition Equation (3.6) is used to evaluate the beginning values of 0
, jiF ,
0
,
0
,
0
, and , , jifjizjir VAA , while Equation (3.5) is used to determine beginning values of
0
,
0
,
0
, and , , jijizjir pvv .
Then the boundary conditions are applied to get the values at the boundary points:
Equation (3.7) sets 0 ,
n
jirv and n
jiz
n
jiz vv ,1, for all cells at r = 0.
Equation (3.8) sets 0 ,
n
jirv and 0 ,
n
jizv for all cells at z = 0.
Equation (3.10) sets n
jir
n
jir vv ,1, , n
jir
n
jir vv 1,, , n
jiz
n
jiz vv ,1, and
n
jiz
n
jiz vv 1,, for all cells in which 10 F at free moving surface.
Equation (3.14) sets n
jim
n
ji pp ,0, 2 for all cells in which 10 F at free
moving surface. n
jim ,2 is approximated as the surface tension pressure, detailed in
[42].
Additionally, for the Newtonian liquid with constant viscosity, constitutive Equation
(3.17) sets:
1
,,1
, 2i
n
jir
n
jirn
jirrr
vv (3.56)
1
,,1
, 2i
n
jiz
n
jizn
jizzz
vv (3.57)
and
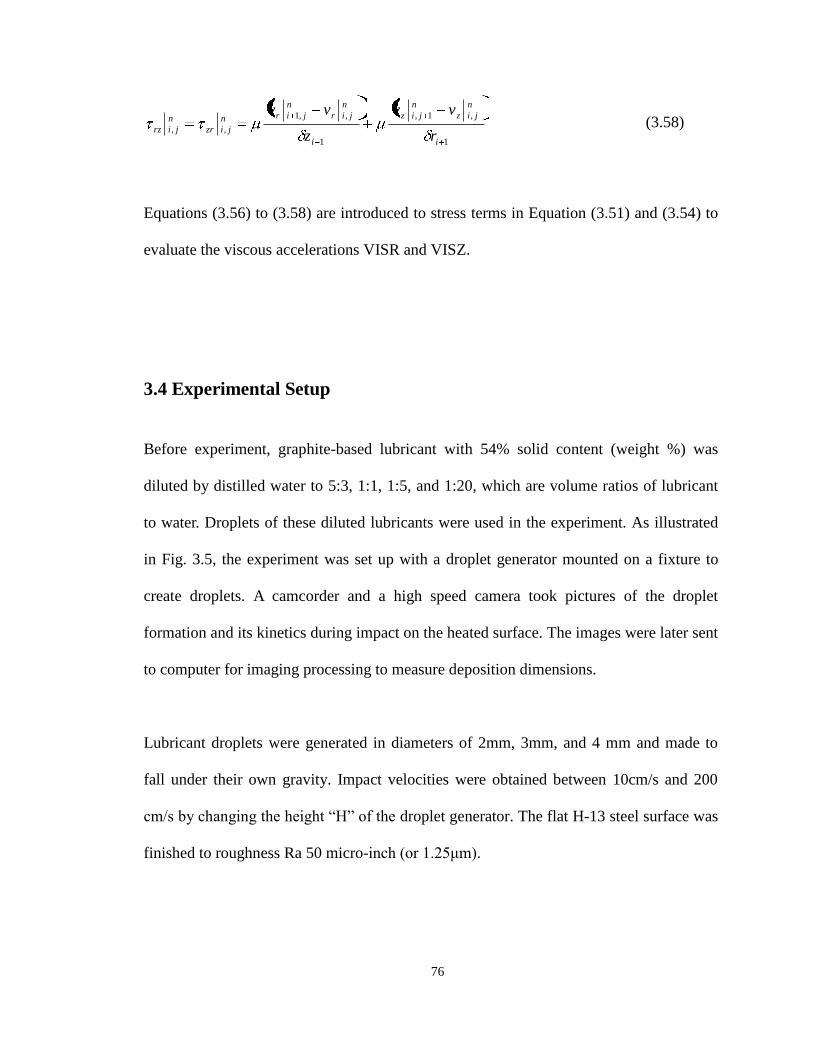
76
1
,1,
1
,,1
,,
i
n
jiz
n
jiz
i
n
jir
n
jirn
jizr
n
jirzr
vv
z
vv (3.58)
Equations (3.56) to (3.58) are introduced to stress terms in Equation (3.51) and (3.54) to
evaluate the viscous accelerations VISR and VISZ.
3.4 Experimental Setup
Before experiment, graphite-based lubricant with 54% solid content (weight %) was
diluted by distilled water to 5:3, 1:1, 1:5, and 1:20, which are volume ratios of lubricant
to water. Droplets of these diluted lubricants were used in the experiment. As illustrated
in Fig. 3.5, the experiment was set up with a droplet generator mounted on a fixture to
create droplets. A camcorder and a high speed camera took pictures of the droplet
formation and its kinetics during impact on the heated surface. The images were later sent
to computer for imaging processing to measure deposition dimensions.
Lubricant droplets were generated in diameters of 2mm, 3mm, and 4 mm and made to
fall under their own gravity. Impact velocities were obtained between 10cm/s and 200
cm/s by changing the height “H” of the droplet generator. The flat H-13 steel surface was
finished to roughness Ra 50 micro-inch (or 1.25μm).
77
3.5 Measurement of the Lubricant Properties
The lubricant contains many surfactants and binders that change the droplet surface
energy, rheology, physics and thermodynamics. The composition of the lubricant is often
a trade secret. Hence, we have to determine the properties of the lubricant before we go
further to build our fluid dynamic model.
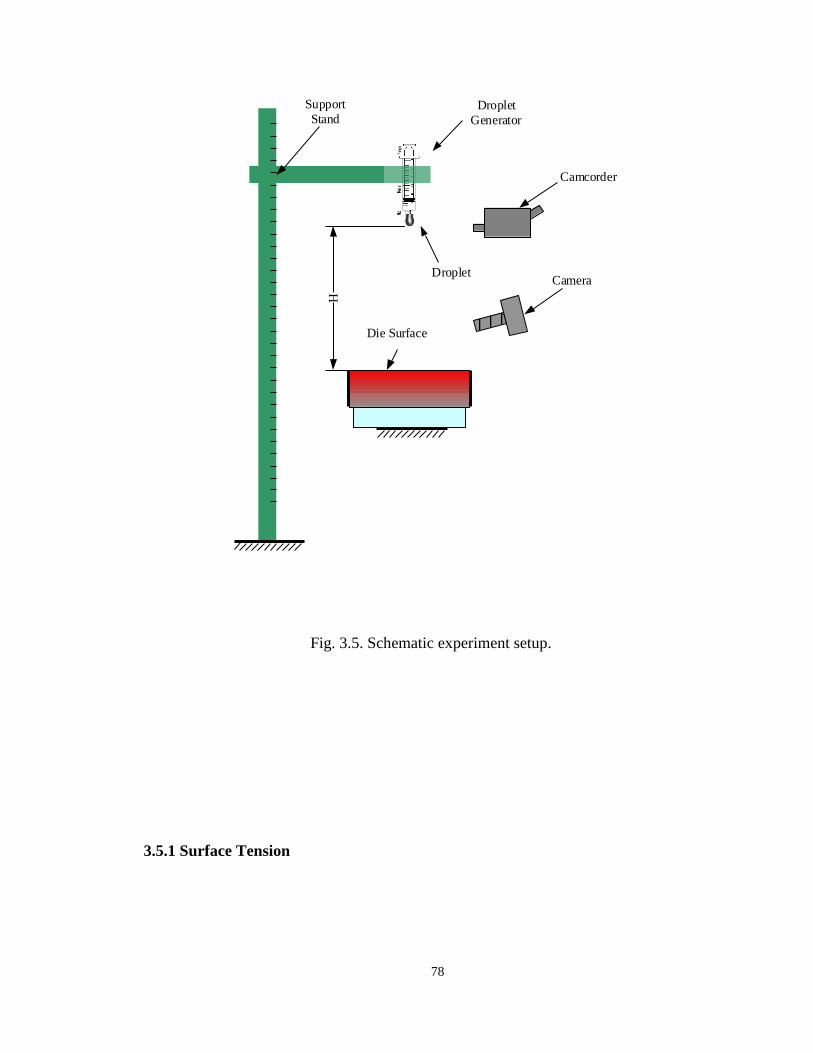
78
H
Droplet
Generator
Camcorder
CameraDroplet
Support
Stand
Die Surface
Fig. 3.5. Schematic experiment setup.
3.5.1 Surface Tension
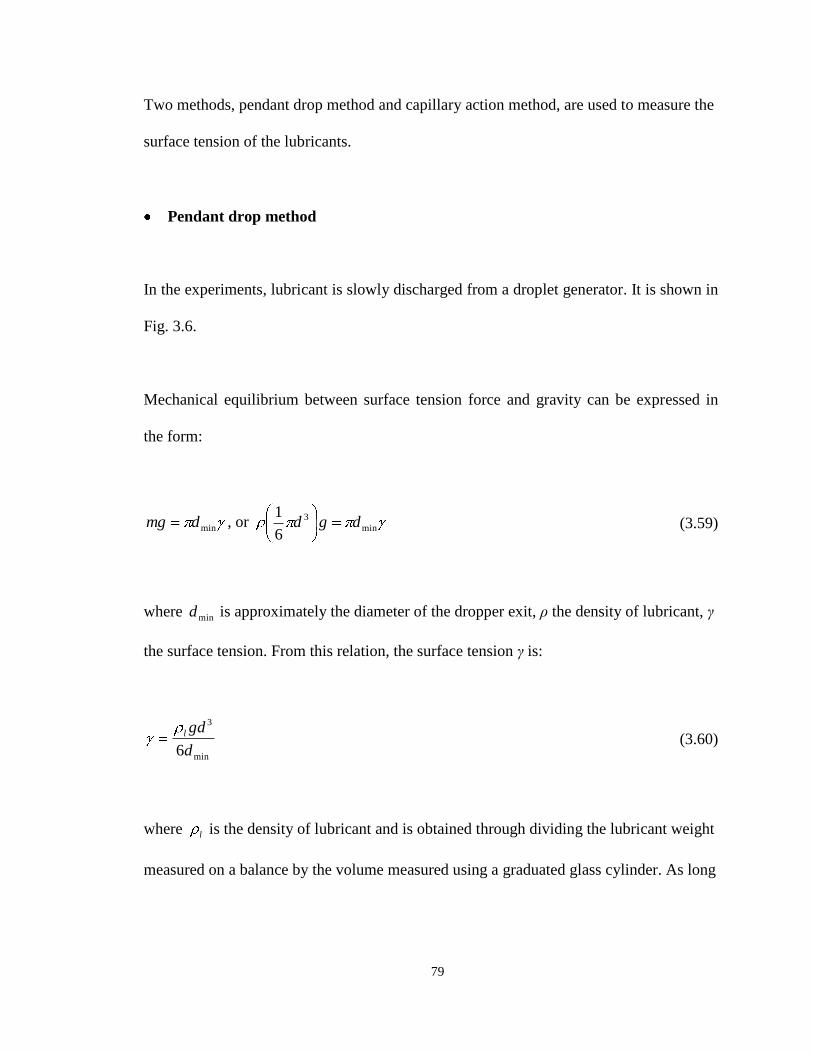
79
Two methods, pendant drop method and capillary action method, are used to measure the
surface tension of the lubricants.
Pendant drop method
In the experiments, lubricant is slowly discharged from a droplet generator. It is shown in
Fig. 3.6.
Mechanical equilibrium between surface tension force and gravity can be expressed in
the form:
mindmg , or min
3
6
1dgd (3.59)
where mind is approximately the diameter of the dropper exit, ρ the density of lubricant, γ
the surface tension. From this relation, the surface tension γ is:
min
3
6d
gdl (3.60)
where l is the density of lubricant and is obtained through dividing the lubricant weight
measured on a balance by the volume measured using a graduated glass cylinder. As long
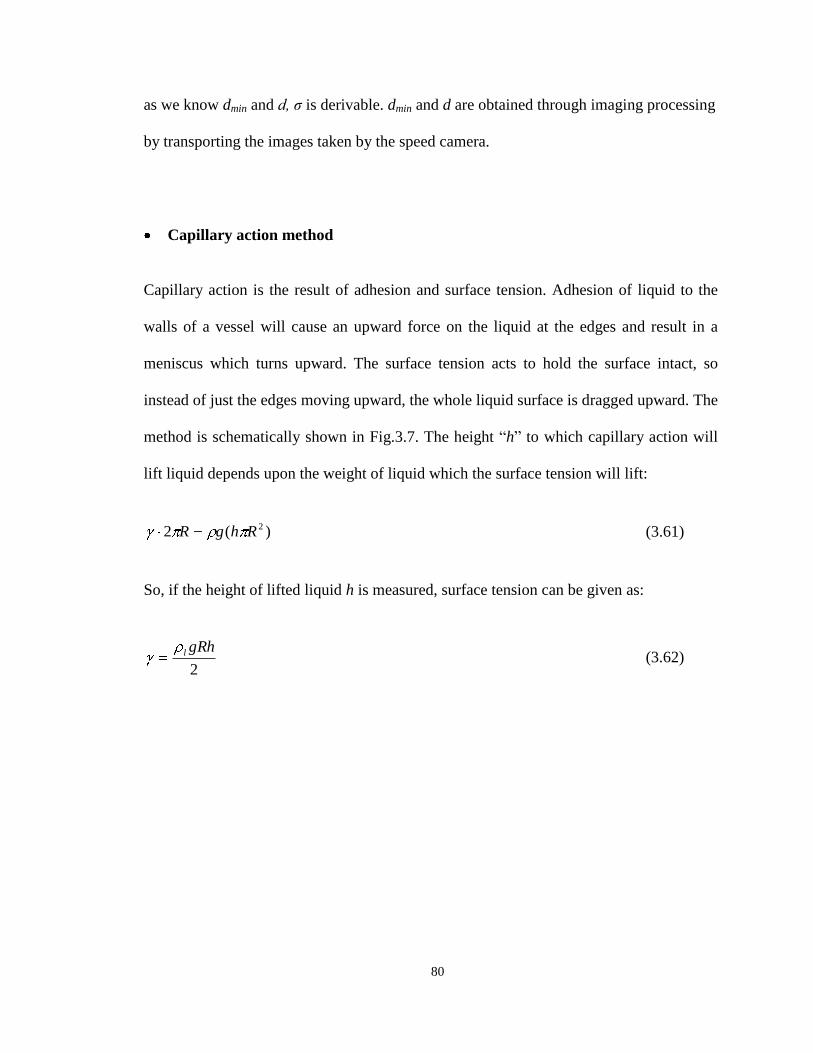
80
as we know dmin and d, σ is derivable. dmin and d are obtained through imaging processing
by transporting the images taken by the speed camera.
Capillary action method
Capillary action is the result of adhesion and surface tension. Adhesion of liquid to the
walls of a vessel will cause an upward force on the liquid at the edges and result in a
meniscus which turns upward. The surface tension acts to hold the surface intact, so
instead of just the edges moving upward, the whole liquid surface is dragged upward. The
method is schematically shown in Fig.3.7. The height “h” to which capillary action will
lift liquid depends upon the weight of liquid which the surface tension will lift:
)(2 2RhgR (3.61)
So, if the height of lifted liquid h is measured, surface tension can be given as:
2
gRhl (3.62)
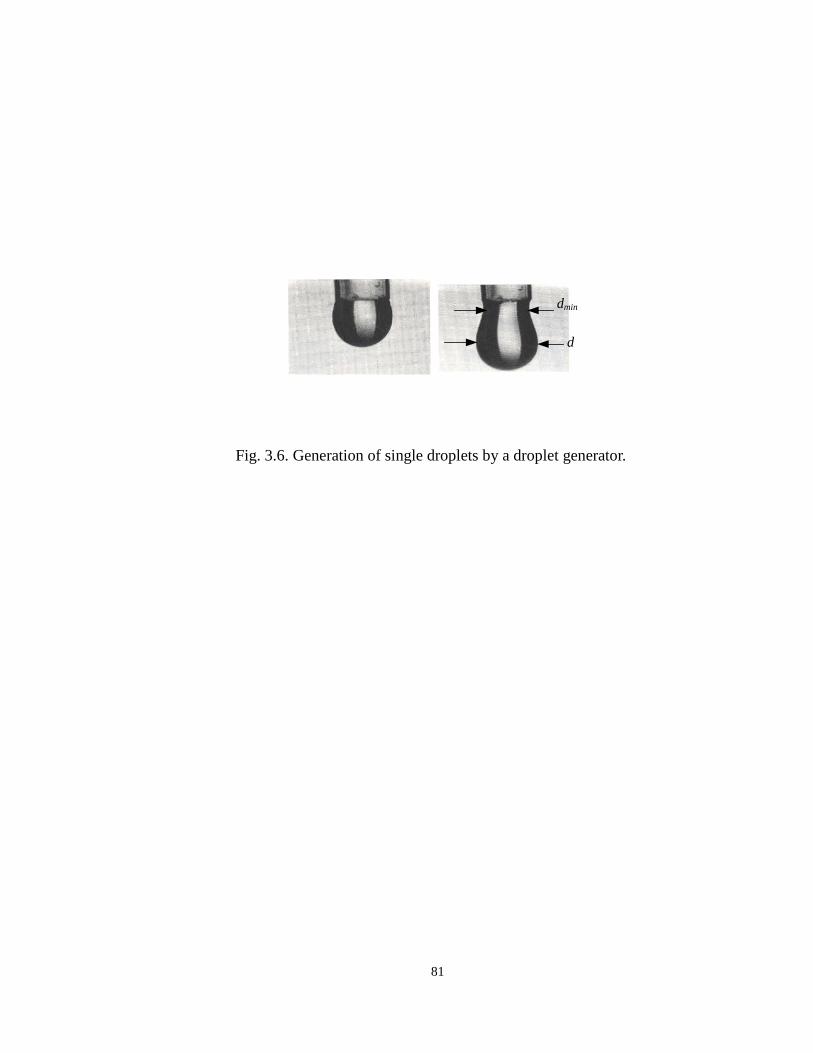
81
dmin
d
Fig. 3.6. Generation of single droplets by a droplet generator.

82
h
R
RForward 2
Fig. 3.7. Capillary action method.
3.5.2 Viscosity

83
With lubricant for which the shear stress and shear rates are proportional (Newtonian
flow behavior), the kinematic viscosity can be determined by measuring the time for a
volume of lubricant to flow under gravity through a calibrated glass capillary viscometer.
This method is recommended by the ASTM445-01. Shown in Fig.3.8, the kinematic
viscosity is obtained by multiplying the time of emptying a fixed volume of liquid by a
container constant C, which is calibrated by a liquid with known viscosity. Then we have
the dynamic viscosity by multiplying the kinematic viscosity, , by the density of the
lubricant.
3.5.3 Results of the Lubricant Properties
Table 3.1 shows the measured properties of lubricants. DP stands for pendant drop
method in Table 3.1 and CA capillary action method. Liquids tested include pure water.
One can observe the facts: a). higher dilution ratio companies with higher surface tension;
b). for liquids with dilution ratio larger than 1:1, the surface tension approaches to that of
the water. As we can see that all surface tensions estimated by drop pendant method are
less than those by capillary action method for about 10 dynes/cm though they share the
same trend. Considering the fact that surface tension for water is 72.8 dynes/cm, we
regard that results gained from capillary action method are closer to the true values.
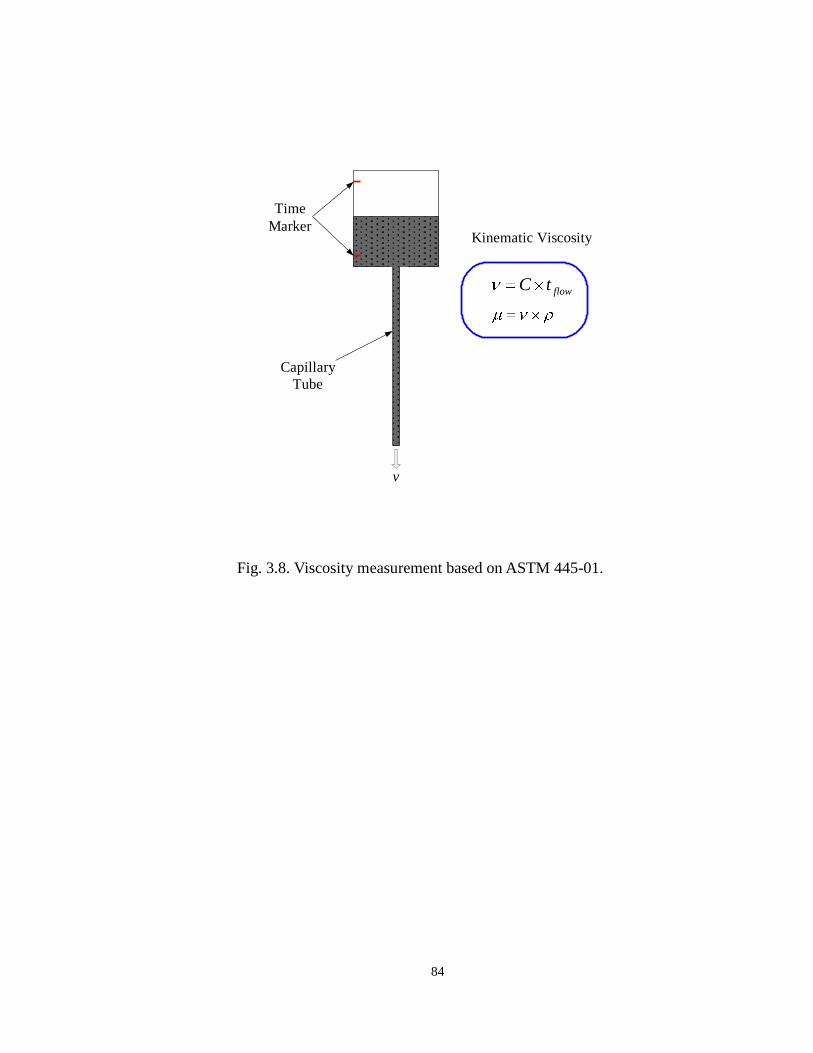
84
v
Time
Marker
Capillary
Tube
flowtC
Kinematic Viscosity
Fig. 3.8. Viscosity measurement based on ASTM 445-01.
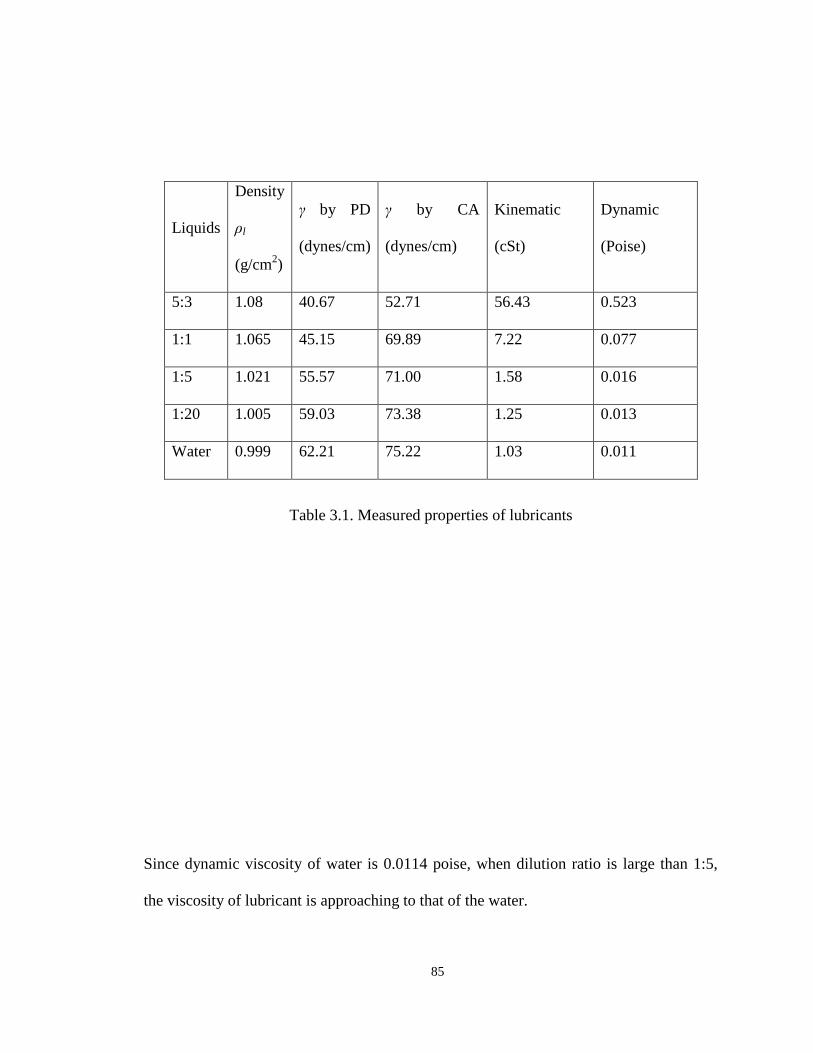
85
Liquids
Density
ρl
(g/cm2)
γ by PD
(dynes/cm)
γ by CA
(dynes/cm)
Kinematic
(cSt)
Dynamic
(Poise)
5:3 1.08 40.67 52.71 56.43 0.523
1:1 1.065 45.15 69.89 7.22 0.077
1:5 1.021 55.57 71.00 1.58 0.016
1:20 1.005 59.03 73.38 1.25 0.013
Water 0.999 62.21 75.22 1.03 0.011
Table 3.1. Measured properties of lubricants
Since dynamic viscosity of water is 0.0114 poise, when dilution ratio is large than 1:5,
the viscosity of lubricant is approaching to that of the water.
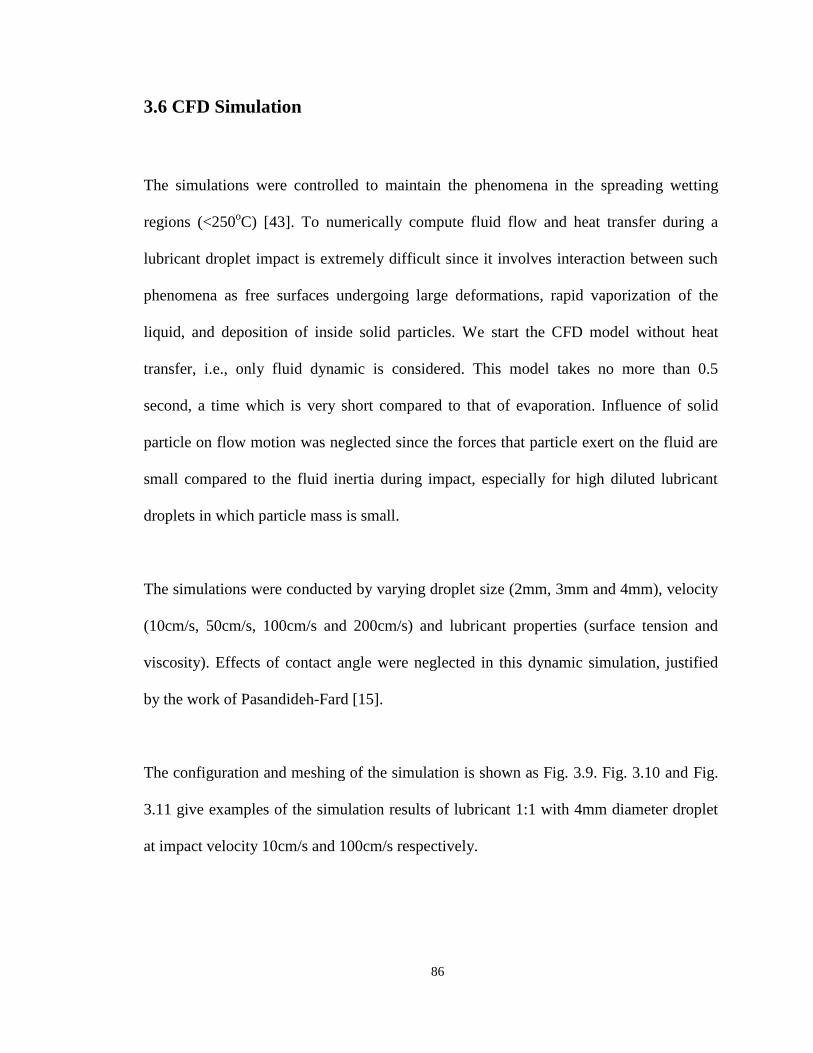
86
3.6 CFD Simulation
The simulations were controlled to maintain the phenomena in the spreading wetting
regions (<250oC) [43]. To numerically compute fluid flow and heat transfer during a
lubricant droplet impact is extremely difficult since it involves interaction between such
phenomena as free surfaces undergoing large deformations, rapid vaporization of the
liquid, and deposition of inside solid particles. We start the CFD model without heat
transfer, i.e., only fluid dynamic is considered. This model takes no more than 0.5
second, a time which is very short compared to that of evaporation. Influence of solid
particle on flow motion was neglected since the forces that particle exert on the fluid are
small compared to the fluid inertia during impact, especially for high diluted lubricant
droplets in which particle mass is small.
The simulations were conducted by varying droplet size (2mm, 3mm and 4mm), velocity
(10cm/s, 50cm/s, 100cm/s and 200cm/s) and lubricant properties (surface tension and
viscosity). Effects of contact angle were neglected in this dynamic simulation, justified
by the work of Pasandideh-Fard [15].
The configuration and meshing of the simulation is shown as Fig. 3.9. Fig. 3.10 and Fig.
3.11 give examples of the simulation results of lubricant 1:1 with 4mm diameter droplet
at impact velocity 10cm/s and 100cm/s respectively.
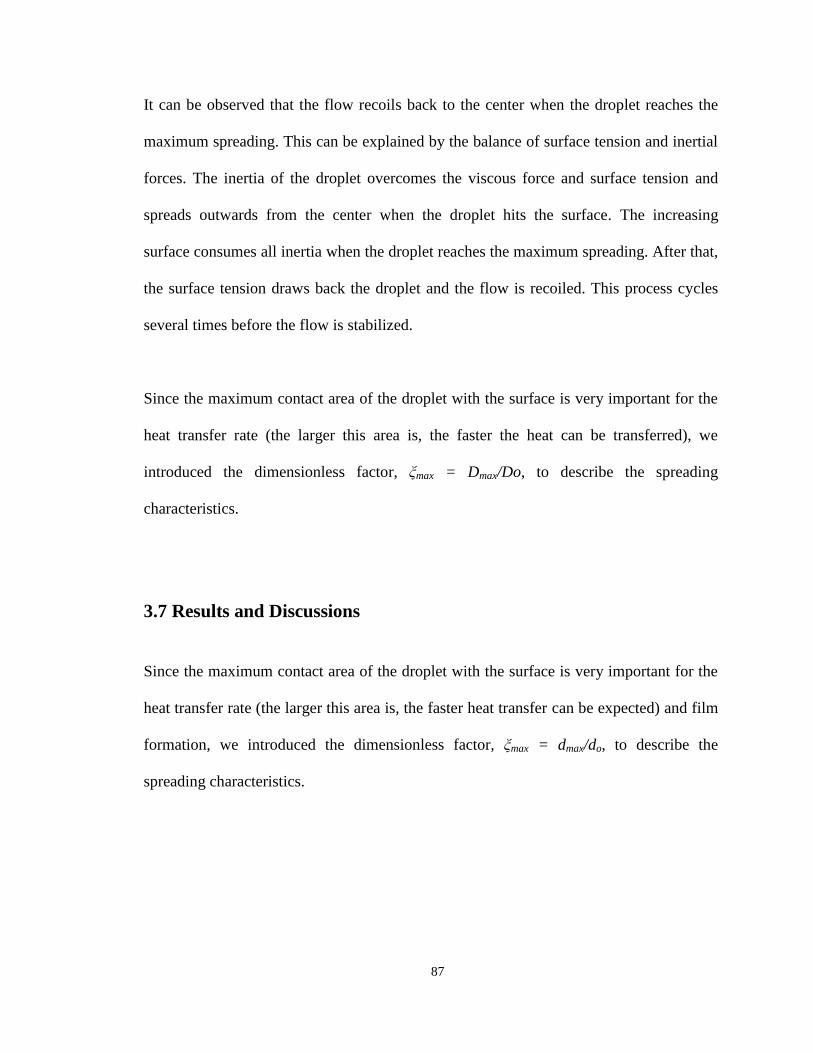
87
It can be observed that the flow recoils back to the center when the droplet reaches the
maximum spreading. This can be explained by the balance of surface tension and inertial
forces. The inertia of the droplet overcomes the viscous force and surface tension and
spreads outwards from the center when the droplet hits the surface. The increasing
surface consumes all inertia when the droplet reaches the maximum spreading. After that,
the surface tension draws back the droplet and the flow is recoiled. This process cycles
several times before the flow is stabilized.
Since the maximum contact area of the droplet with the surface is very important for the
heat transfer rate (the larger this area is, the faster the heat can be transferred), we
introduced the dimensionless factor, ξmax = Dmax/Do, to describe the spreading
characteristics.
3.7 Results and Discussions
Since the maximum contact area of the droplet with the surface is very important for the
heat transfer rate (the larger this area is, the faster heat transfer can be expected) and film
formation, we introduced the dimensionless factor, ξmax = dmax/do, to describe the
spreading characteristics.

88
Fig. 3.9. The configuration and meshing of the simulation.
5ms 10ms
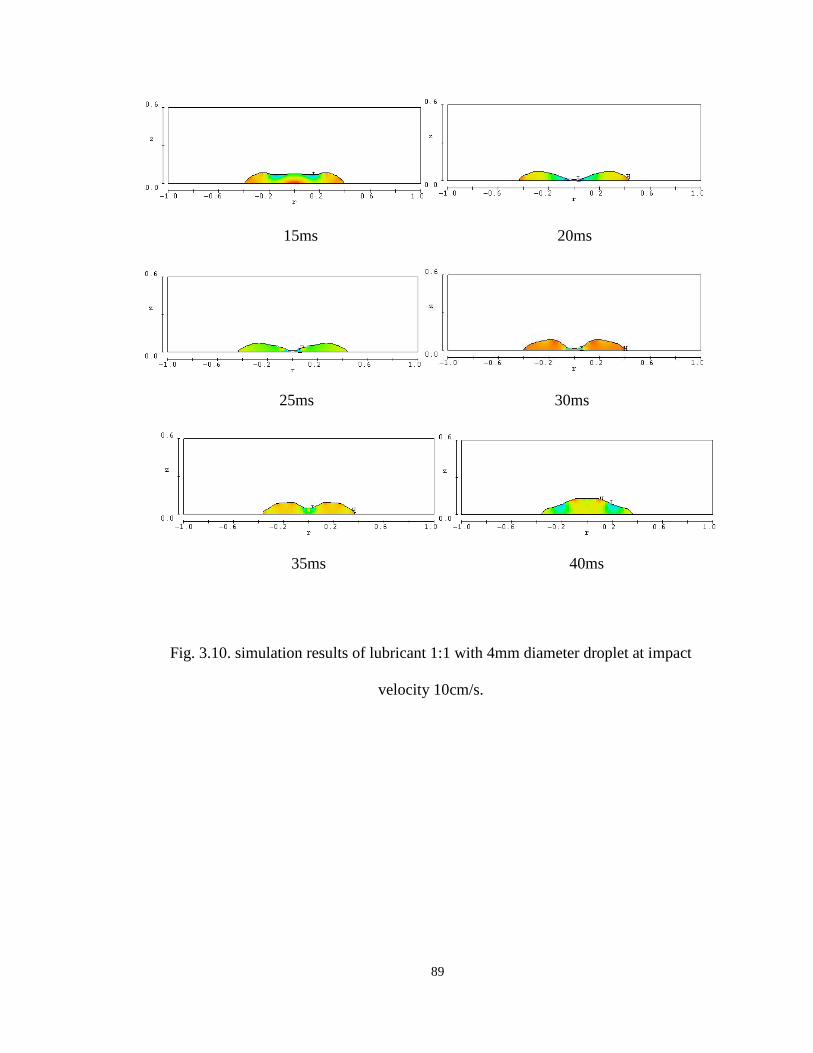
89
15ms 20ms
25ms 30ms
35ms 40ms
Fig. 3.10. simulation results of lubricant 1:1 with 4mm diameter droplet at impact
velocity 10cm/s.
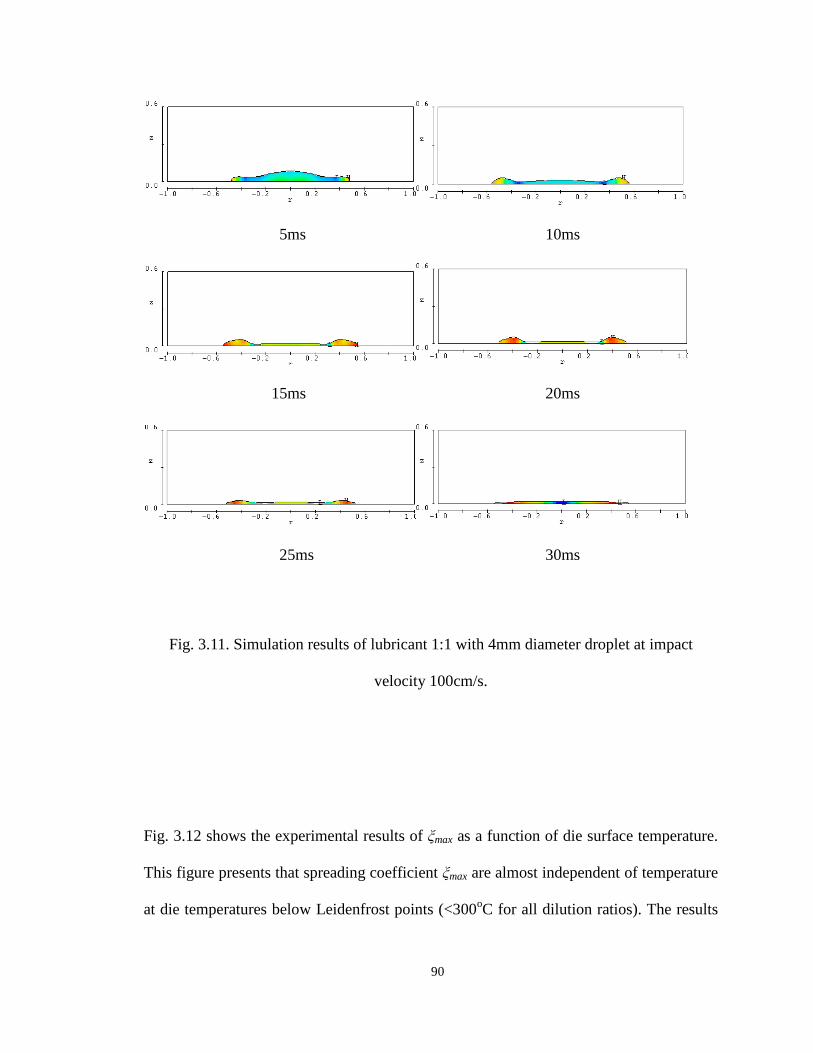
90
5ms 10ms
15ms 20ms
25ms 30ms
Fig. 3.11. Simulation results of lubricant 1:1 with 4mm diameter droplet at impact
velocity 100cm/s.
Fig. 3.12 shows the experimental results of ξmax as a function of die surface temperature.
This figure presents that spreading coefficient ξmax are almost independent of temperature
at die temperatures below Leidenfrost points (<300oC for all dilution ratios). The results

91
of water based graphite lubricants correspond with what observed in studies [23, 32-38]
and allow the fluid dynamic model to present the droplet spreading in the region of
nucleate and convection boiling.
Fig. 3.13 shows the comparison of experiment and simulation results of ξmax versus
Reyonlds number Re for lubricants with different dilution ratios, while Fig. 3.14 shows
the results of ξmax versus Weber number We.
Shown by both Fig. 3.13 and Fig. 3.14, results of experiment and simulation agree well
except at high values of We, the numbers close to critical We number Wecrit beyond
which droplet will undergo breakup. For all lubricants at high Weber numbers, results of
simulation are higher than those from experiments. This may be caused by the neglecting
effects of graphite suspended in the liquid in our simulation model. It is observed in the
simulations that spreading velocity in radial direction is 5 to 10 times higher than impact
velocity at the high end of We. The velocity change is high enough to make the liquid
with suspensions to be shear-thickening liquid [44-45], i.e., its viscosity increases as the
sheer rate increases.
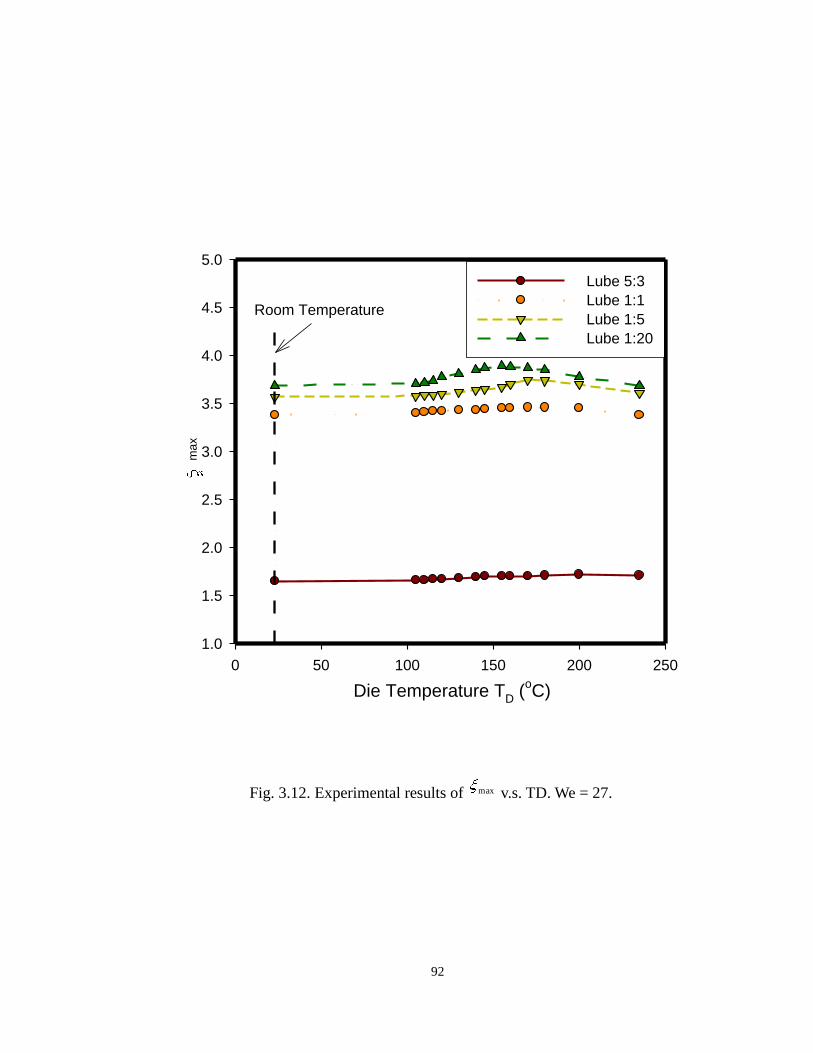
92
Die Temperature TD (
oC)
0 50 100 150 200 250
max
1.0
1.5
2.0
2.5
3.0
3.5
4.0
4.5
5.0
Lube 5:3
Lube 1:1
Lube 1:5
Lube 1:20
Room Temperature
Fig. 3.12. Experimental results of max v.s. TD. We = 27.
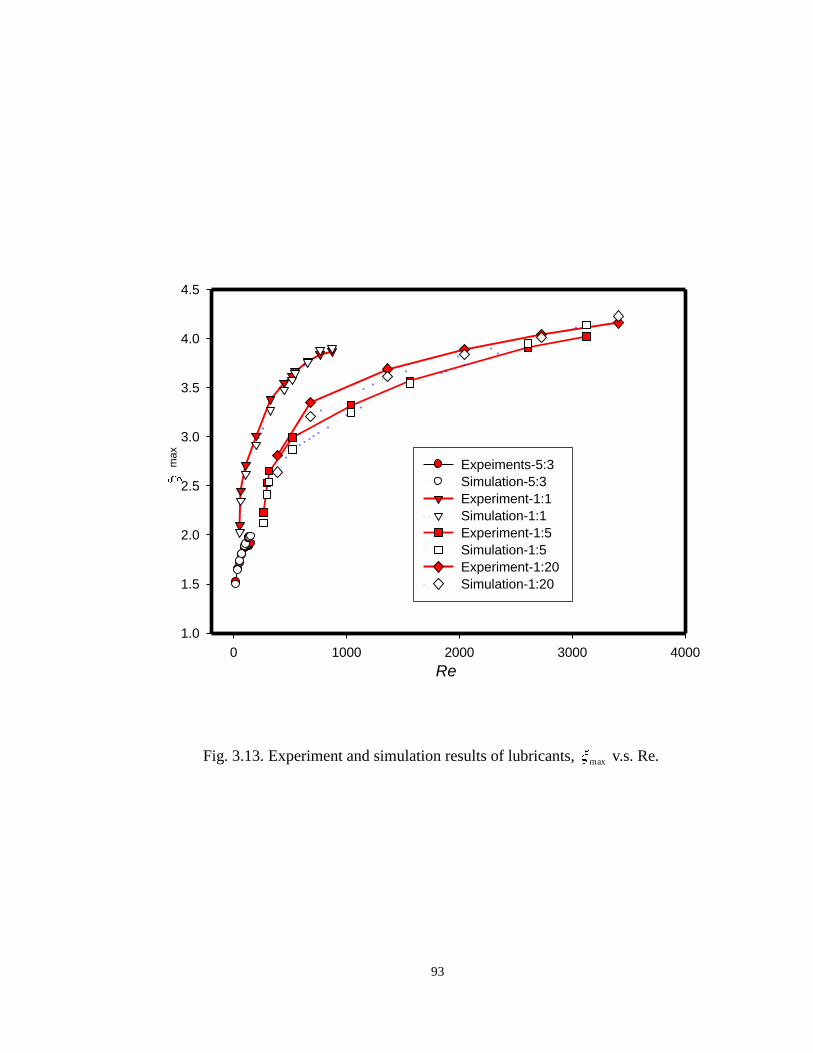
93
Re
0 1000 2000 3000 4000
ma
x
1.0
1.5
2.0
2.5
3.0
3.5
4.0
4.5
Expeiments-5:3
Simulation-5:3
Experiment-1:1
Simulation-1:1
Experiment-1:5
Simulation-1:5
Experiment-1:20
Simulation-1:20
Fig. 3.13. Experiment and simulation results of lubricants, max v.s. Re.
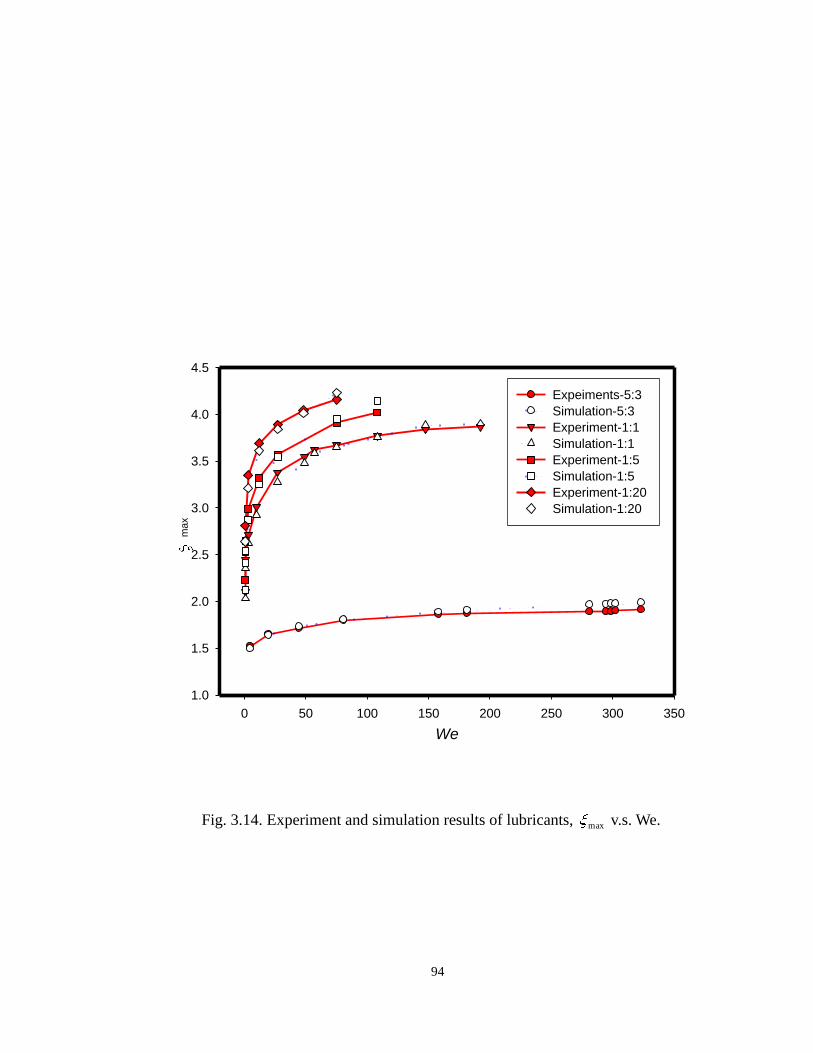
94
We
0 50 100 150 200 250 300 350
max
1.0
1.5
2.0
2.5
3.0
3.5
4.0
4.5
Expeiments-5:3
Simulation-5:3
Experiment-1:1
Simulation-1:1
Experiment-1:5
Simulation-1:5
Experiment-1:20
Simulation-1:20
Fig. 3.14. Experiment and simulation results of lubricants, max v.s. We.
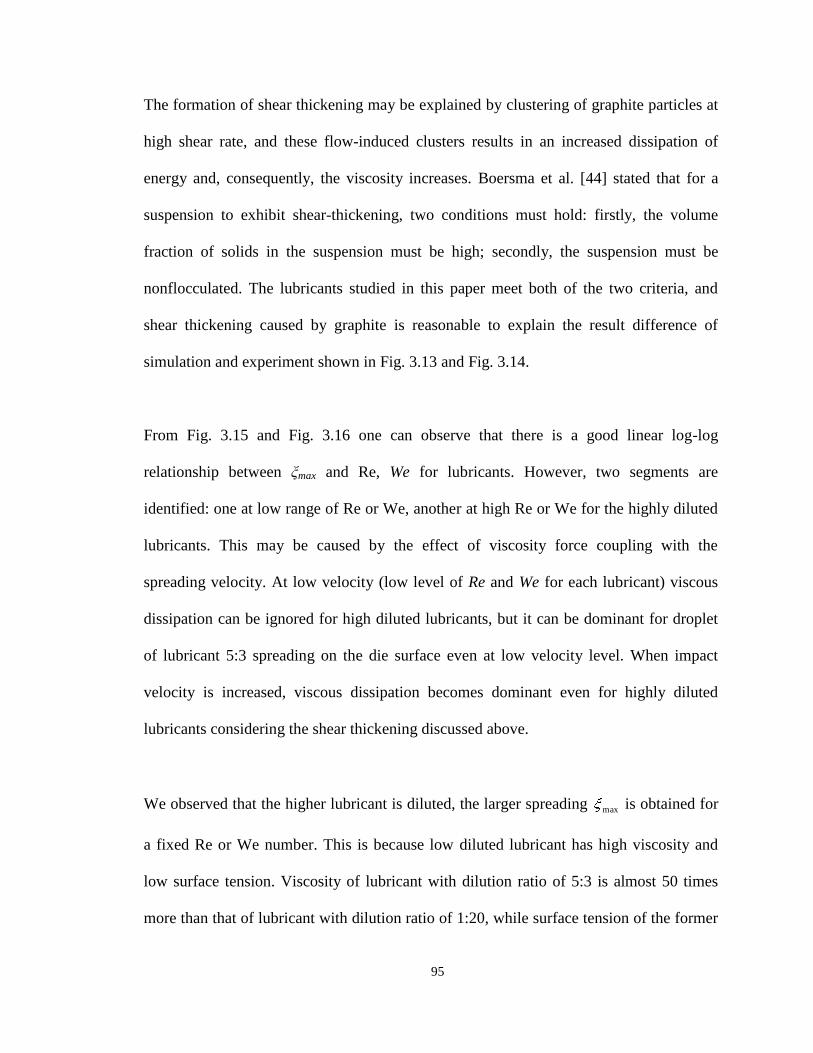
95
The formation of shear thickening may be explained by clustering of graphite particles at
high shear rate, and these flow-induced clusters results in an increased dissipation of
energy and, consequently, the viscosity increases. Boersma et al. [44] stated that for a
suspension to exhibit shear-thickening, two conditions must hold: firstly, the volume
fraction of solids in the suspension must be high; secondly, the suspension must be
nonflocculated. The lubricants studied in this paper meet both of the two criteria, and
shear thickening caused by graphite is reasonable to explain the result difference of
simulation and experiment shown in Fig. 3.13 and Fig. 3.14.
From Fig. 3.15 and Fig. 3.16 one can observe that there is a good linear log-log
relationship between ξmax and Re, We for lubricants. However, two segments are
identified: one at low range of Re or We, another at high Re or We for the highly diluted
lubricants. This may be caused by the effect of viscosity force coupling with the
spreading velocity. At low velocity (low level of Re and We for each lubricant) viscous
dissipation can be ignored for high diluted lubricants, but it can be dominant for droplet
of lubricant 5:3 spreading on the die surface even at low velocity level. When impact
velocity is increased, viscous dissipation becomes dominant even for highly diluted
lubricants considering the shear thickening discussed above.
We observed that the higher lubricant is diluted, the larger spreading max is obtained for
a fixed Re or We number. This is because low diluted lubricant has high viscosity and
low surface tension. Viscosity of lubricant with dilution ratio of 5:3 is almost 50 times
more than that of lubricant with dilution ratio of 1:20, while surface tension of the former

96
is more than half of the latter. This means that viscous dissipation is a dominant factor for
lubricant with high dilution ratio comparing with the effect of surface tension, especially
at the beginning of the impact when the change of surface area is small. Another reason
may also rely on the easier shear thickening for high volume fraction of graphite
suspensions in the low diluted lubricant.
Ignoring the turning of log- log curves at low Weber number We in Fig. 3.16, we fit these
curves by the least square method and obtain the relations shown in Table 3.2. We see
that for lubricants with diluted ratio higher than 1:1, the log-log relations between
spreading coefficient max v.s. Weber number We are pretty much close. We fit the
simulation results for all these lubricants together and have:
log(We) B A )log( max (3.63)
Where A = 0.3906 and B = 0.1038 for less than equal to one. Equation (3.63) in its
simple expression can be used in the evaluation of droplet impact of lubricant with high
dilution ratios in metal processing.
97
Re10 100 1000
ma
x
1
10
Expeiments-5:3
Simulation-5:3
Experiment-1:1
Simulation-1:1
Experiment-1:5
Simulation-1:5
Experiment-1:20
Simulation-1:20
Fig. 3.15. Experiment and simulation results of lubricants, log( max ) v.s. log(Re).

98
We1 10 100 1000
max
1
10Expeiments-5:3
Simulation-5:3
Experiment-1:1
Simulation-1:1
Experiment-1:5
Simulation-1:5
Experiment-1:20
Simulation-1:20
Fig. 3.16. Experiment and simulation results of lubricants, log( max ) v.s. log(We).
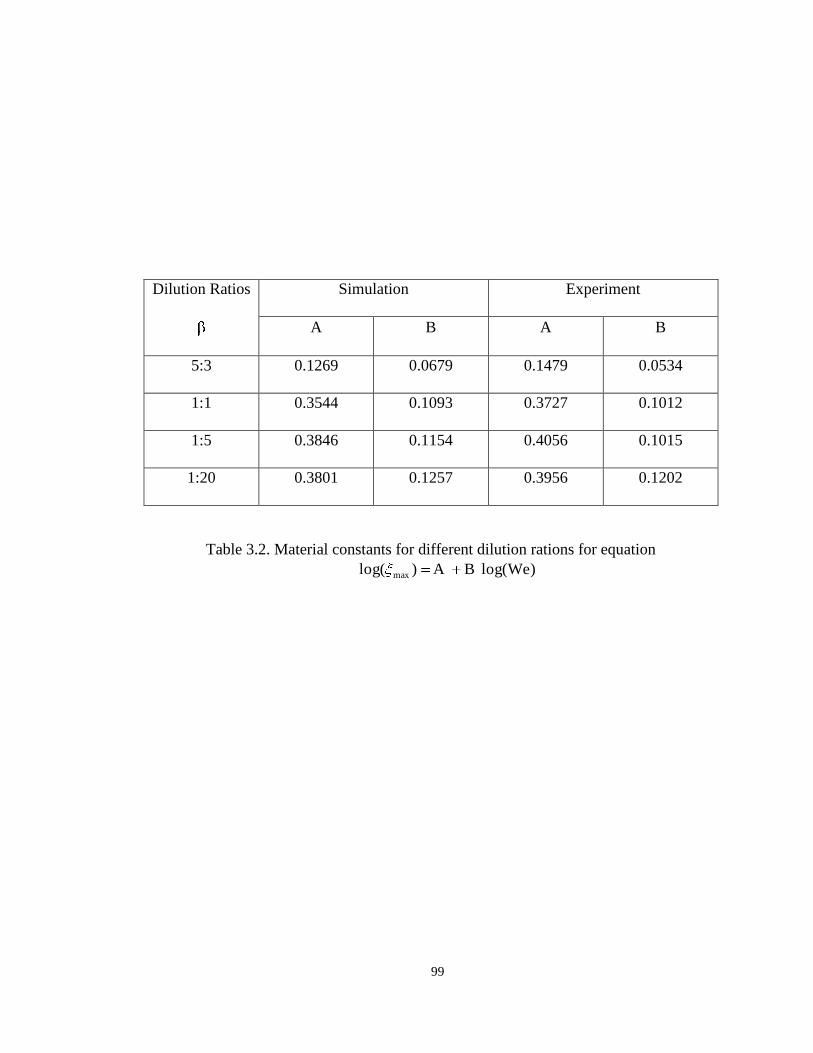
99
Dilution Ratios Simulation Experiment
A B A B
5:3 0.1269 0.0679 0.1479 0.0534
1:1 0.3544 0.1093 0.3727 0.1012
1:5 0.3846 0.1154 0.4056 0.1015
1:20 0.3801 0.1257 0.3956 0.1202
Table 3.2. Material constants for different dilution rations for equation
log(We) B A )log( max
100
3.8 Summary of the Chapter
In this chapter, an isothermal model based on momentum equations is proposed for
investigating lubricant spread on hot die surfaces. The governing equations are
discretized using the VOF finite difference scheme. The lubricant properties needed for
this model are determined by simple capillary experiments. This model is applied to the
study of droplet dynamics and spread for different lubricant properties and different
impact conditions. The model predictions are compared with those of single droplet
experiments at different Weber numbers and lubricant dilution ratios. It is seen that the
numerical model adequately simulates the droplet behavior including its spread over the
entire range of experimental conditions. Finally, a relation is derived between the spread
factor and the Weber number that is valid for all dilution ratios greater than unity (dilute
suspensions). This relation together with the numerical model can be used to determine
the best droplet spray parameters for the desired lubricant film thickness.
101
CHAPTER 4
4. MODELING OF THE LUBRICANT DRYOFF BEYOND LEIDENFROST POINT
Lubrication plays a critical role in the efficacy of metal flow, die surface thermal
softening, and quality during hot processing of metals. The lubricant is often applied to
the hot die surface between 250 to 700oC by spraying a dilute graphite suspension
through high pressure nozzles. The atomized droplets in the spray impact on the die
surface and undergo film boiling and nucleation boiling. The lubricant film is formed
after all the residue liquid on the hot surface is dried off. The evaporation time of droplets
is not only a productivity index in hot metal processing but also an important factor for
product quality and life of die. This chapter presents an analytical model to estimate the
evaporation time of a droplet impact on a die surface heated to temperature beyond
Leidenfrost point. Experiments are conducted to measure the dryoff times for lubricants
interested. Calculated and experimental evaporation times are compared and agree well
for highly diluted lubricants.
102
4.1 Introduction
In hot deformation processing, the dies are lubricated and cooled by spraying dilute water
based lubricants on the heated die surfaces. The lubricant not only cools the hot surface
from a temperature as high as 700oC but also deposits a lubricant film that aids in metal
flow. For example in hot forging, the lubricant is often a fine suspension of graphite
particles in water, with surfactants and binders added to aid in the spreading and the
formation of an adherent lubricant film. When droplets of the spray approach the die
surface heated to high temperatures, the fast evaporation rate can generate a “cushion” of
vapor between the die surface and the droplet to repel the droplet up and support the
droplet suspending above the die surface. This is so called film boiling of a droplet.
Evaporation time of the droplet not only influences the cooling rate and film formation
rate, but also effect of the die life and part quality of the metal processing. Residue liquid
lubricant remained in the die can lead to die crack at corners due to high vapor pressure
in the forging processes. Entrapped vapors of un-dried lubricant in the melt flow also
result in casting porosity for die casting processes. Therefore, the evaporation time of
droplets is the key factor to evaluate efficiency of metal processing.
Previous studies on the droplet impact on surface with temperature beyond Leidenfrost
have mainly focused on experimental research [46- 49]. Early theoretical approaches
were limited to model evaporation of a spherical droplet of which kinetic energy is
negligible, i.e., the droplet gently seats on the solid surface. Gottfried et al. [50] modeled

103
the film boiling of small droplets deposited on a hot flat at Leidenfrost temperature. The
model assumed that the droplet is in isothermal at the saturation temperature. Both
conduction and radiation were included in their model and the evaporation rate was found
by solving mass, momentum and heat balances equations. Wachters et al. [22] considered
the impact of droplets about 60 μm impacting a heated surface in the range of 5 m/s.
Their model yielded an estimate of the height of the gap between the drop and the surface.
Lifetimes of droplets agree well with experimental observations in this study.
Later studies took into account the inertia in the modeling of the impinging droplet.
Buyvich et al. [51] developed a heat transfer model in which they assumed the volume of
the droplet to be constant. Heat transfer in the liquid and solid was neglected and only
heat transfer in vapor was considered. Rein introduced a disk model in which the inertia
of both the droplet and the vapor were considered [52]. The disk model did not consider
the dynamic of the droplet and took the droplet as a disk with constant radium and
thickness. The vapor flow was described as an inviscid flow. Rein showed that the disk
model described the main features of the dynamic Leidenfrost phenomenon. Limited
droplet impact models were numerically solved by CFD methods. Harvie and Fletcher
[53] modeled the behavior of the vapor and heat transfer in the solid and droplet using the
computational code they named “BOUNCE”. Their simulation results were validated by
experiments and showed good agreement.
This chapter presents the analytical model to estimate the dryoff time of a lubricant
droplet impact on a die surface at temperature higher than Leidenfrost point. Instead of
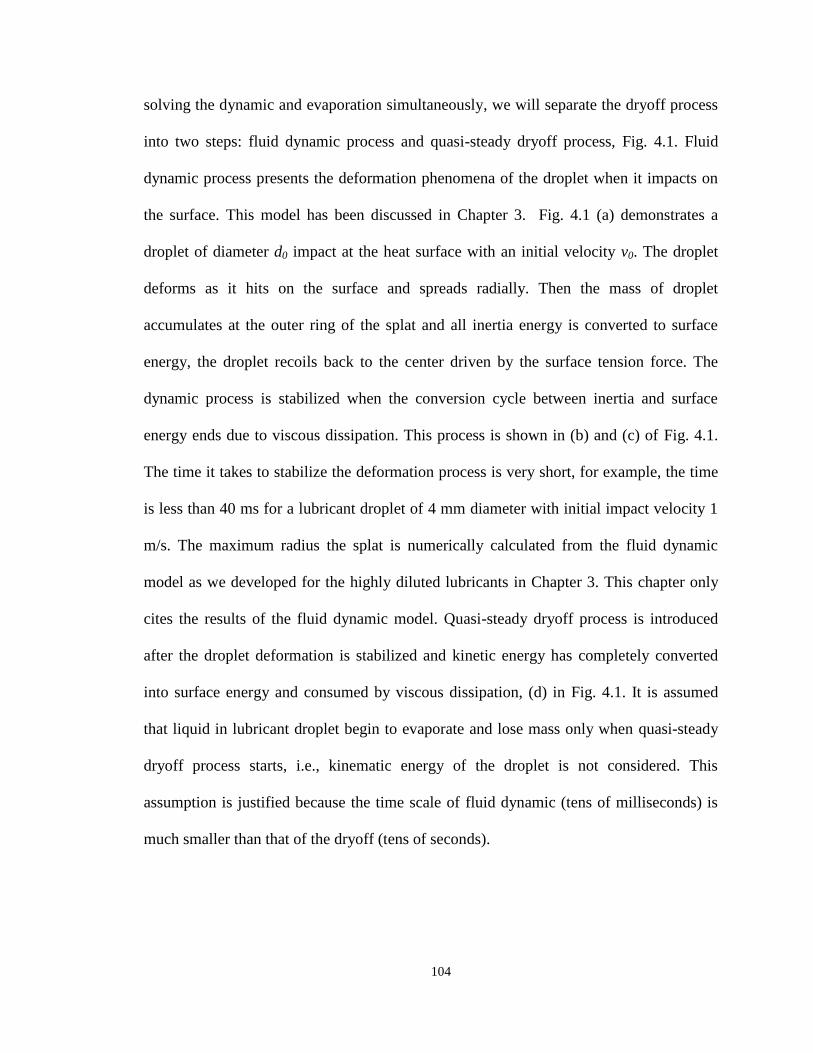
104
solving the dynamic and evaporation simultaneously, we will separate the dryoff process
into two steps: fluid dynamic process and quasi-steady dryoff process, Fig. 4.1. Fluid
dynamic process presents the deformation phenomena of the droplet when it impacts on
the surface. This model has been discussed in Chapter 3. Fig. 4.1 (a) demonstrates a
droplet of diameter d0 impact at the heat surface with an initial velocity v0. The droplet
deforms as it hits on the surface and spreads radially. Then the mass of droplet
accumulates at the outer ring of the splat and all inertia energy is converted to surface
energy, the droplet recoils back to the center driven by the surface tension force. The
dynamic process is stabilized when the conversion cycle between inertia and surface
energy ends due to viscous dissipation. This process is shown in (b) and (c) of Fig. 4.1.
The time it takes to stabilize the deformation process is very short, for example, the time
is less than 40 ms for a lubricant droplet of 4 mm diameter with initial impact velocity 1
m/s. The maximum radius the splat is numerically calculated from the fluid dynamic
model as we developed for the highly diluted lubricants in Chapter 3. This chapter only
cites the results of the fluid dynamic model. Quasi-steady dryoff process is introduced
after the droplet deformation is stabilized and kinetic energy has completely converted
into surface energy and consumed by viscous dissipation, (d) in Fig. 4.1. It is assumed
that liquid in lubricant droplet begin to evaporate and lose mass only when quasi-steady
dryoff process starts, i.e., kinematic energy of the droplet is not considered. This
assumption is justified because the time scale of fluid dynamic (tens of milliseconds) is
much smaller than that of the dryoff (tens of seconds).

105
Fig. 4.1. Dryoff process of a lubricant droplet at film boiling: (a)- (c) fluid dynamic
process, (d). quasi-steady dryoff process.
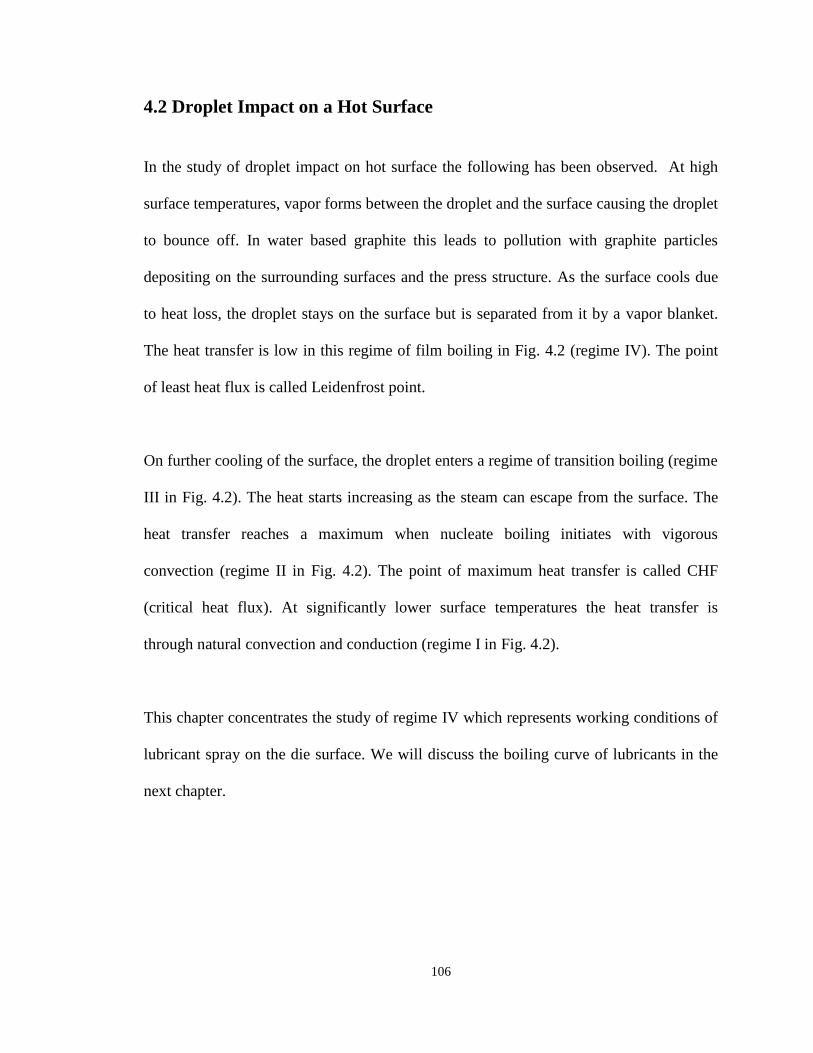
106
4.2 Droplet Impact on a Hot Surface
In the study of droplet impact on hot surface the following has been observed. At high
surface temperatures, vapor forms between the droplet and the surface causing the droplet
to bounce off. In water based graphite this leads to pollution with graphite particles
depositing on the surrounding surfaces and the press structure. As the surface cools due
to heat loss, the droplet stays on the surface but is separated from it by a vapor blanket.
The heat transfer is low in this regime of film boiling in Fig. 4.2 (regime IV). The point
of least heat flux is called Leidenfrost point.
On further cooling of the surface, the droplet enters a regime of transition boiling (regime
III in Fig. 4.2). The heat starts increasing as the steam can escape from the surface. The
heat transfer reaches a maximum when nucleate boiling initiates with vigorous
convection (regime II in Fig. 4.2). The point of maximum heat transfer is called CHF
(critical heat flux). At significantly lower surface temperatures the heat transfer is
through natural convection and conduction (regime I in Fig. 4.2).
This chapter concentrates the study of regime IV which represents working conditions of
lubricant spray on the die surface. We will discuss the boiling curve of lubricants in the
next chapter.

107
Fig. 4.2. Boiling curve of a droplet deposited on a hot solid surface.

108
4.3 Fluid Dynamic Model
The fluid dynamic model for lubricants was developed based on momentum equations.
The droplet was modeled as isothermal Newtonian liquid in the model. This model
simulates the impact of a liquid droplet on a solid from the moment that the lubricant
droplet comes into contact with the die surface and proceeding until the spreading
process is completed. The surface tension is included in the model as the linear force to
calculate the free moving boundary, part of the solution of governing equation. To
evaluate the influence of lubricant properties and spray parameters on the lubricant
spreading on the die surface, we simulate impact of lubricants with different dilution
ratios, droplet size and impact velocity on a polished die surface. Fig. 3.10 and Fig. 3.11
give the examples of the simulation result of lubricant 1:1 with 4mm diameter droplet at
impact velocities of 10 cm/s and 100 cm/s.
Summarizing the simulation results, a good log-log linear relationship are found between
spreading coefficient 0maxmax dd and Weber number 0
2
0 dvWe L for lubricant
with dilution ratio higher than 1:5 (volume ratio). Here maxd is the maximum diameter of
the splat, 0d the initial diameter of the droplet, L the density of droplet liquid, 0v
initial impact velocity, and surface tension. The relation is expressed as:
log(We) 0.1038 0.3906)log( max (4.1)
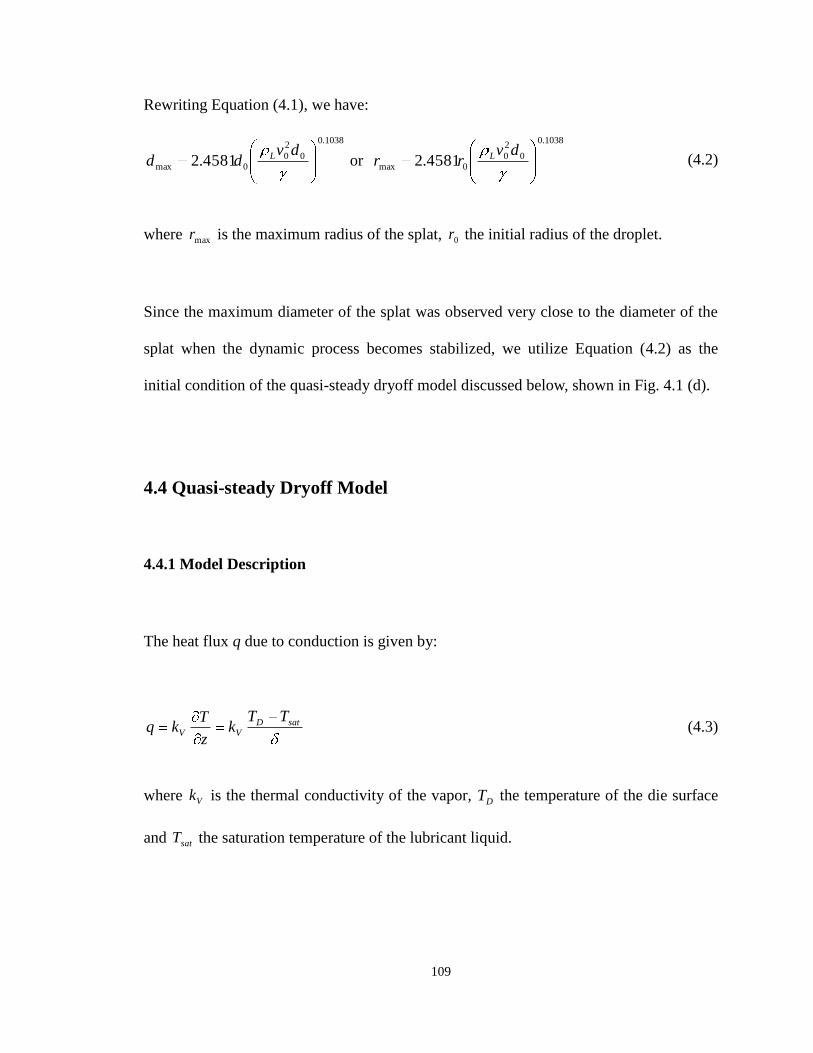
109
Rewriting Equation (4.1), we have:
1038.0
0
2
0
0max 4581.2dv
dd L or
1038.0
0
2
0
0max 4581.2dv
rr L (4.2)
where maxr is the maximum radius of the splat, 0r the initial radius of the droplet.
Since the maximum diameter of the splat was observed very close to the diameter of the
splat when the dynamic process becomes stabilized, we utilize Equation (4.2) as the
initial condition of the quasi-steady dryoff model discussed below, shown in Fig. 4.1 (d).
4.4 Quasi-steady Dryoff Model
4.4.1 Model Description
The heat flux q due to conduction is given by:
satD
VV
TTk
z
Tkq (4.3)
where Vk is the thermal conductivity of the vapor, DT the temperature of the die surface
and satT the saturation temperature of the lubricant liquid.

110
Fig. 4.3. Modeling of the quasi-steady dryoff of a lubricant droplet.

111
So Equation (4.3) can be written as:
1)(0
VV
satDV
zL
TTkv (4.4)
4.4.2 Governing Equations
Assuming the velocity of vapor in z direction ( z0 ) is negligible, then the mass
balance equation for any radius Lrr can yield:
0
0
22 zrV vrrdzv (4.5)
Introducing Equation (4.4), Equation (4.5) becomes:
r
L
TTkdzv
VV
satDV
rV2
)(
0
(4.6)
The general form of momentum balance equations in a two dimensional cylindrical
coordinates is:
2
21
z
vrv
rrrr
p
z
vv
r
vv
t
v rV
rVV
rV
zV
rV
rV
rV
V (4.7)
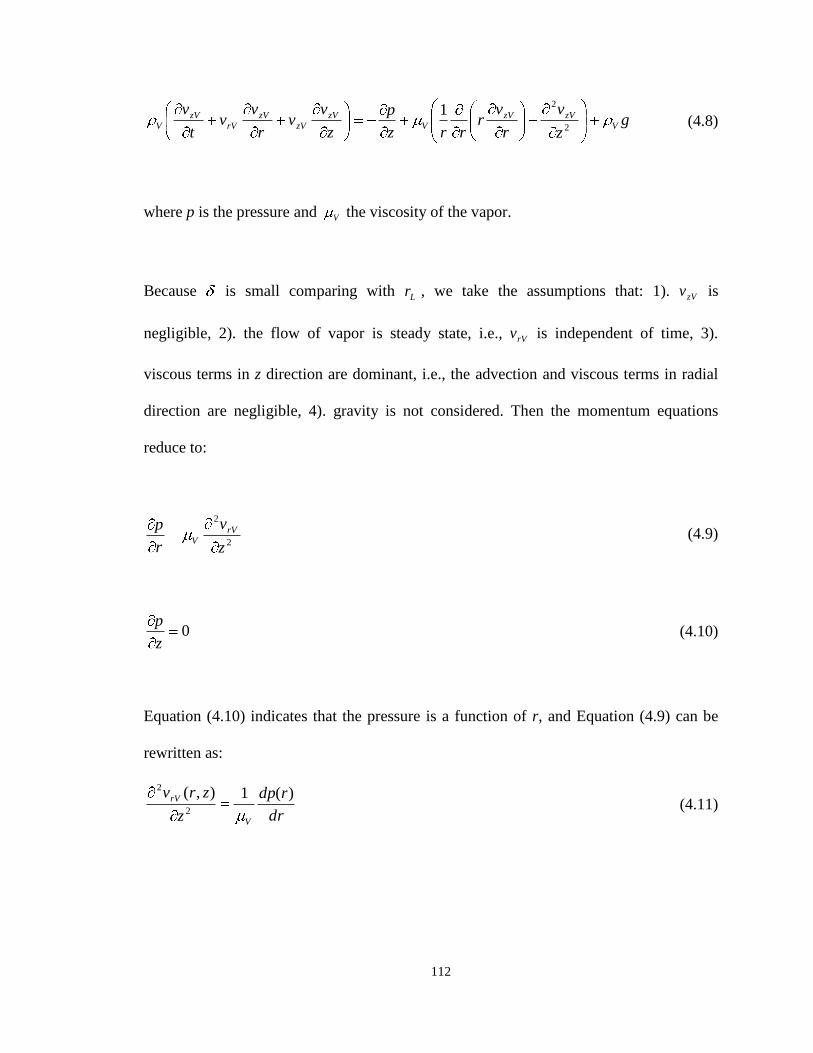
112
gz
v
r
vr
rrz
p
z
vv
r
vv
t
vV
zVzV
V
zV
zV
zV
rV
zV
V 2
21
(4.8)
where p is the pressure and V the viscosity of the vapor.
Because is small comparing with Lr , we take the assumptions that: 1). zVv is
negligible, 2). the flow of vapor is steady state, i.e., rVv is independent of time, 3).
viscous terms in z direction are dominant, i.e., the advection and viscous terms in radial
direction are negligible, 4). gravity is not considered. Then the momentum equations
reduce to:
2
2
z
v
r
p rV
V (4.9)
0z
p (4.10)
Equation (4.10) indicates that the pressure is a function of r, and Equation (4.9) can be
rewritten as:
dr
rdp
z
zrv
V
rV )(1),(2
2
(4.11)

113
4.4.3 Analytical Solution
To solve Equation (4.11), boundary conditions at the die surface and droplet bottom
surface are needed. Assumption of no-slip at both surfaces is made and it yields:
0rVv at z = 0 (4.12)
and
0rVv at z = δ (4.13)
Integrating Equation (4.11) twice over z and introducing Equation (4.12) and (4.13) to
determine the integral constants, the velocity rVv becomes:
r
pzzzrvrV
2
V2
1),( (4.14)
Replacing rVv in Equation (4.14) into mass balance equation (4.6), we have that:
4
V )(6 r
L
TTk
r
p
VV
satDV (4.15)
114
Taking another boundary condition that:
0pp at r = rL (4.16)
and integrating Equation (4.15) yields:
4
22
V
0
)(3 rr
L
TTkpp L
VV
satDV (4.17)
Let constant VV
satDVc
L
TTkF
)(3 V , which can be regarded as a characteristic force
introduced by the vapor generation, then the pressure is:
4
22
0
rrFpp L
c (4.18)
It is this pressure that supports the gravity of the droplet. As it is assumed that the droplet
is in quasi-steady state and forces exerted on the droplet must be balanced, we have:
gVrdrprr
Fp L
r
Lc
L
20
04
22
0 (4.19)
where L denotes the density of the lubricant and V the volume of the droplet.
115
Arranging Equation (4.19), we finally obtain the thickness of the vapor layer as:
L
L
c rgV
F4/1
2 (4.20)
Let
4/1
2 g
FC
L
c the coefficient of vapor layer height. Equation (4.20) represents linear
relationship between the thickness of the vapor layer and the radius of the impact splat
Lr for a given volume of the droplet. Since volume of the droplet is a function of time as
the liquid continuously escapes as the vapor from the bottom side of the droplet, the
height of the vapor δ changes with time.
To calculate the mass loss rate of the droplet, Equation (4.20) is introduced to Equation
(4.4):
LVV
satDV
zrCL
VTTkv
1)( 4/1
0 (4.21)
The splat radius rL in equation (4.21) can be approximated as the maximum radius rmax of
the splat fitted by the fluid dynamic model, which is given by the Equation (4.2). The
volume of the droplet V changes as a function of mass loss rate m and time t:
116
t
L
dtmVtV0
0
1)( (4.22)
where 6
3
0
0
dV is the initial volume of the droplet and drytt0 . tdry is the droyoff
time.
Introducing Equations (4.21) and (4.22), then the mass loss rate is:
Lr
zV rdrvm0
0 2
Lr t
LL
drdtmVrr
0
4/1
0
0
1
(4.23)
where V
satDV
CL
TTk )(2and
1038.0
0
2
0
02291.1dv
rr L
L .
Since the vapor leaves evenly along the radial direction of the bottom surface of the
droplet, m is independent of r. Therefore, the term
4/1
0
0
1t
L
dtmV can be taken out
of the integral and Equation (4.23) can be rewrite as:
2
14/1
0
0L
t
L
rdtmVm (4.24)
117
To find the solution of this nonlinear equation, we have to use numerical iteration
techniques. This paper uses Gauss-Newton method to find the solutions of mass loss rate
)(tm as a function of time t. The mass loss rate becomes unstable and unreasonably small
during the computation when evaporation time drytt or the volume of the droplet
0V . To compensate this but not lose the power of the model, we applied )( %90tm , the
mass loss rate at which the remaining volume of droplet is exactly 10% of the initial
volume of the droplet, to be the mass lost rate for the rest process of evaporation till all
droplet has been dried off.
If we assume that there is no mass loss in the dynamic process and mass loss only caused
by evaporation in the quasi-steady dryoff stage, droyoff time of the lubricant droplet in
boiling region tdry is given by:
dryt
dtmm0
0 (4.25)
where 0m is the initial mass of the droplet and 6
3
0
0
dm L .
Again, solving Equation (4.25) numerically using the results from Equation (4.24), we
can finally obtain the dryoff time tdry.
118
4.5 Experiment Setup
In this research, the fluid dynamics and thermal behaviors of a droplet impacting on a hot
die were experimentally studied by water-based graphite lubricant commonly used in hot
forging process. The experiment setup is similar to the one described in Chapter 3 except
thermal measurement configuration is included in this experiment.
Again, graphite-based lubricant with 54% solid content (weight %) is diluted by distilled
water to 1:1, 1:5, and 1:20 before experiment. Droplets of these diluted ratios are used in
the experiment. Properties of droplets are measured by experiments. The results of
properties are shown in Chapter 3.
As illustrated in Fig. 4.4, lubricant droplets were generated by a droplet generator with tip
diameters of 1.0mm, 1.5mm, and 2.0mm, and made to fall down onto a flat H13 die
under their own gravity.
Impact velocities were obtained by changing height of the droplet generator “H” and the
range of velocity was controlled at levels of 10cm/s continuously to 200cm/s. A
camcorder took pictures at the moment a droplet formed. The impact behaviors of the
droplet were also recorded by a speed camera. The images were later sent to computer for
imaging processing to measure deposition dimensions and dryoff time. Dryoff time was
also measured through a stop watch with precision of 0.01s.
119
The flat die surface was finished to roughness Ra 50μ inch (or 1.25μm). The die was
mounted around by an induction bind heater whose temperature was adjustable from
room temperature to 450oC. Temperature at die surface was measured by embedded fast
response thermocouples (response time≤ 2ms) which right beneath the impacting area of
the die surface. The distance of thermocouple tips to the die surface is 0.5 mm, 1 mm and
1.2 mm separately. The voltage signals of thermocouples were sent to National
Instrument (NI) Data Acquisition System so that the temperature could be monitored and
recorded.
The thermodynamic properties of vapor, which is regarded as gas phase of water in this
study, are function of temperature and pressure and are calculated using fitting equations
recommended in [54-56].
4.6 Results and Discussion
Fig. 4.5 shows the time-averaged vapor thickness calculated by the dryoff model versus
die surface temperature for droplets with different Weber numbers. Since most of the
lubricants interested demonstrate Leidenfrost points a few degrees lower than 300oC [57],
we start temperature at 305oC to locate the study in the film boiling regime.
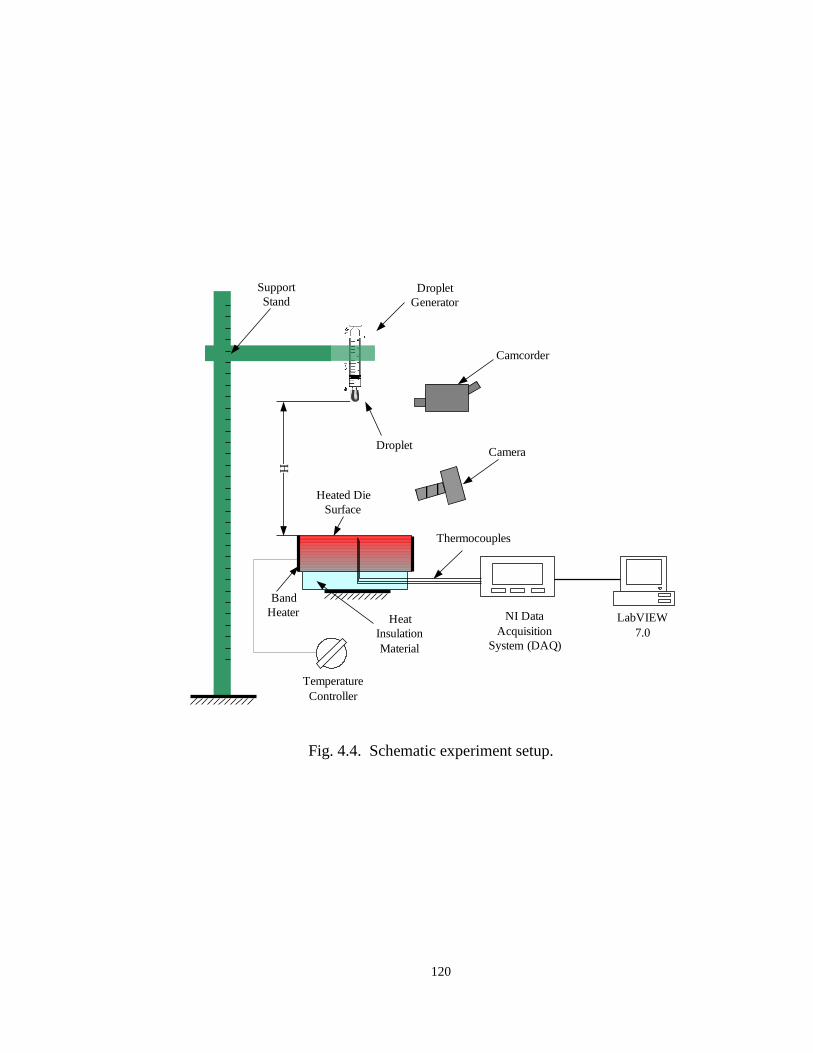
120
NI Data
Acquisition
System (DAQ)
Band
Heater
Temperature
Controller
LabVIEW
7.0
H
Droplet
Generator
Camcorder
CameraDroplet
Heat
Insulation
Material
Support
Stand
Thermocouples
Heated Die
Surface
Fig. 4.4. Schematic experiment setup.
121
From Fig. 4.5, the thickness of the vapor layer ranges from around 28 μm to 127 μm.
Though there are limited experimental data on the thickness of the vapor layer, Chandra
and Aziz [58] measured the thickness of the vapor layer between a deposited nitrogen
droplet and a glass surface. They measured the thickness by enlarging the images taken in
the experiments for different droplet sizes. The results of thickness of vapor layer beneath
the evaporating nitrogen droplet range from 15 μm to 50 μm in their experiments. Since
their measurements did not consider the inertia energy and thermal effects, the calculated
thickness of the vapor layer by the dryoff model agree well on the magnitude of the
results obtained by Chandra and Aziz at low surface temperatures and low Weber
numbers.
One can observe from Fig. 4.5 that the height of the vapor layer increases with
temperature, evidently at temperatures beyond 370 o
C, for all droplets with different
Weber number. This is because that the thermal conductivity k of vapor changes
dramatically from 0.1815 W/m/K at 370oC to 0.3238 W/m/K at 380
oC [57]. The
enhanced conduction generates more vapor than it can be promptly transported to the
outside of the shaded area of the droplet and increases the pressure of the vapor layer p.
The increased pressure difference 0pp lifts the droplet, and in return, the widened gap
decreases the vapor pressure p until the pressure difference 0pp drops to a level just
right to support the weight of droplet, see Equation (4.15).

122
TD (o
C)
300 320 340 360 380 400 420 440 460
60
80
100
120
140
160 We=0.6
We=14
We=56
We=127
We=180
( m)
Fig. 4.5. Averaged thickness of the vapor layer as a function of temperature and Weber
number.
123
Moreover, the thickness of vapor layer increases with the Weber number We, illustrated
in Fig. 4.5. This is mainly because that, as it can be read from Equation (4.2), high Weber
number brings about large spreading radius rL which enlarges the heat contact area and
improves the evaporation. Another direct explanation is that enlarged contact area needs
lower pressure to support the weight of the droplet than it does for a smaller contact area,
and thereby, a larger vapor layer height.
As Weber number of the droplet continues to increase, the thickness of the vapor layer
does not increase accordingly for all range of Weber number. Instead, a different physical
phenomenon is introduced for droplet-surface interactions of high Weber number.
Studies have shown that droplets of the lubricant break up on die surface at room
temperature normally at Weber number We greater than 180, a critical Weber number
which can be lower for a heated die surface [43]. Fig. 4.5 indicates that the vapor
generated by severe evaporation at high temperature may introduce high transient
pressure and help to blow the droplet apart.
Fig. 4.6 illustrates the time-weighted averaged mass loss rate m versus die surface
temperature for different Weber numbers. The increase of mass loss rate m with die
temperature correlates with the trend of the thickness of vapor layer shown in Fig. 4.5.
The mass loss rate is also observed to increase with Weber number. This is also caused
by enhanced heat transfer due to large diameters of splat for a high Weber number
impact, demonstrated by our fluid dynamic model. It should be noted that the density of
the vapor increases with temperature [54-55]. Therefore, even if the velocity of the vapor
124
leaving from the droplet keeps the same, the higher temperature will result in more mass
to be taken out by the vapor. This explains the observation that the mass loss accelerates
at the high temperature illustrated in Fig. 4.6.
The dryoff times calculated for a lubricant droplet with initial diameter d0 = 3mm are
shown in Fig. 4.7 comparing with the dryoff times obtained through experiments. The
droplets impact on the die surface at two impact velocities: 0.1 m/s and 1 m/s. The
calculated dryoff times for droplets with impact velocity v0=0.1 m/s are in the range of
70-90 s, while the range for those measured in experiments is 63-75 s. The comparison
for those droplets with impact velocity v0=1 m/s also shows that dryoff times calculated
by the model are of the correct order comparing with those measured in the experiment
(27-40 s from the model and 34-64 s from experiments).
The interesting finding is that the model predicts longer dryoff times than the times
observed in the experiments for droplets at low impact velocity, but it is opposite for
those with a relatively high velocity.
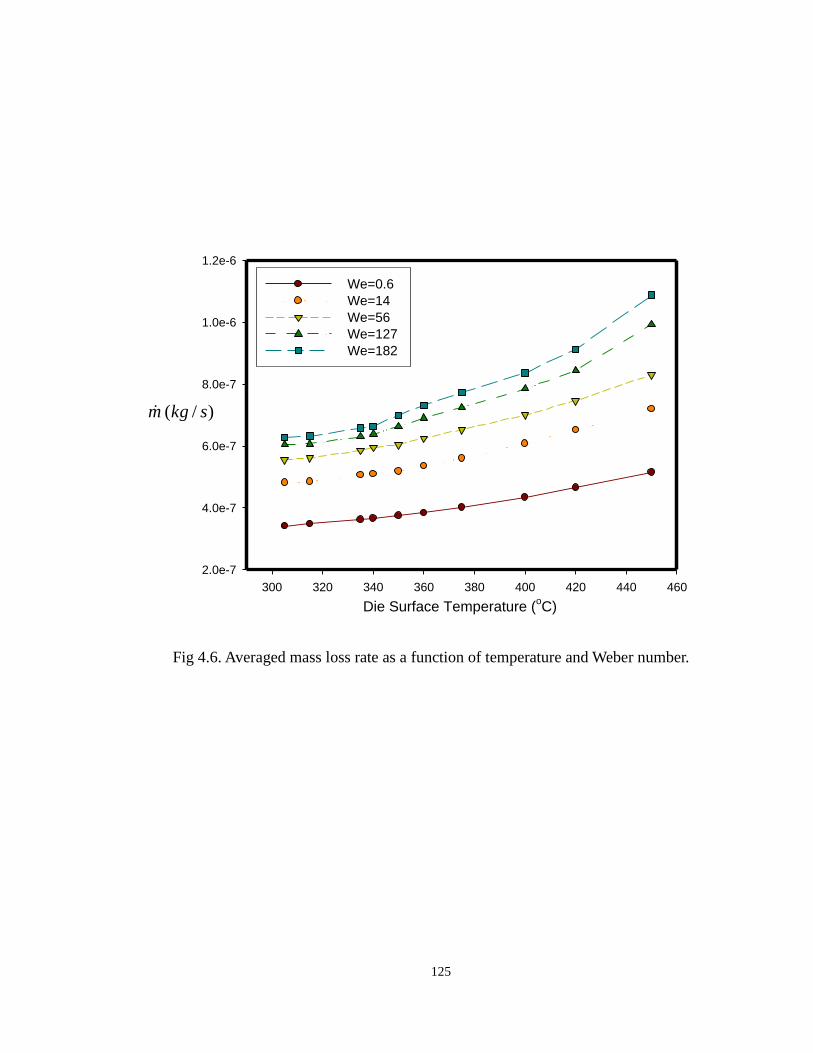
125
Die Surface Temperature (oC)
300 320 340 360 380 400 420 440 460
2.0e-7
4.0e-7
6.0e-7
8.0e-7
1.0e-6
1.2e-6
We=0.6
We=14
We=56
We=127
We=182
)/( skgm
Fig 4.6. Averaged mass loss rate as a function of temperature and Weber number.

126
The presence of lower prediction for high impact velocity droplets can be explained by
the assumption made in the model that the spreading radius, calculated from fluid
dynamic model, does not change with time afterwards at the quasi-steady dryoff stage.
This may not reflect the droplet dryoff process very well especially at the late life of the
droplet. In fact, the droplets were observed to draw back to a spheroidal shape after
impact because of high surface tension at vapor-liquid interface. This behavior reduces
the contact area of droplet with die surface and depresses the heat transfer. As the vapor
takes more and more mass from the lubricant droplet, the Bond number /2
0gdBo , a
ratio of the gravity to capillary effects, becomes smaller and smaller and capillarity solely
determines the shape of the droplet. At this end stage of dryoff, the shape of the droplet is
almost spheral, which is the poorest geometry condition for heat conduction.
The higher calculated dryoff times for droplets with a low impact velocity may be caused
by the underestimate of the spreading radius by the fluid dynamic model. A further study
on the effect of graphite suspensions on dry off should also be conducted because it is
observed in the experiments that graphite accumulate at the bottom of the droplet when
liquid leaves from the bottom of droplet as a form of vapor. The graphite forms a porous
phases through which the liquid passed and evaporates to compensate the mass loss in the
vapor layer. This phenomenon is not considered in the analytical mode discussed above
and may contribute the discrepancy of the prediction and experimental results.
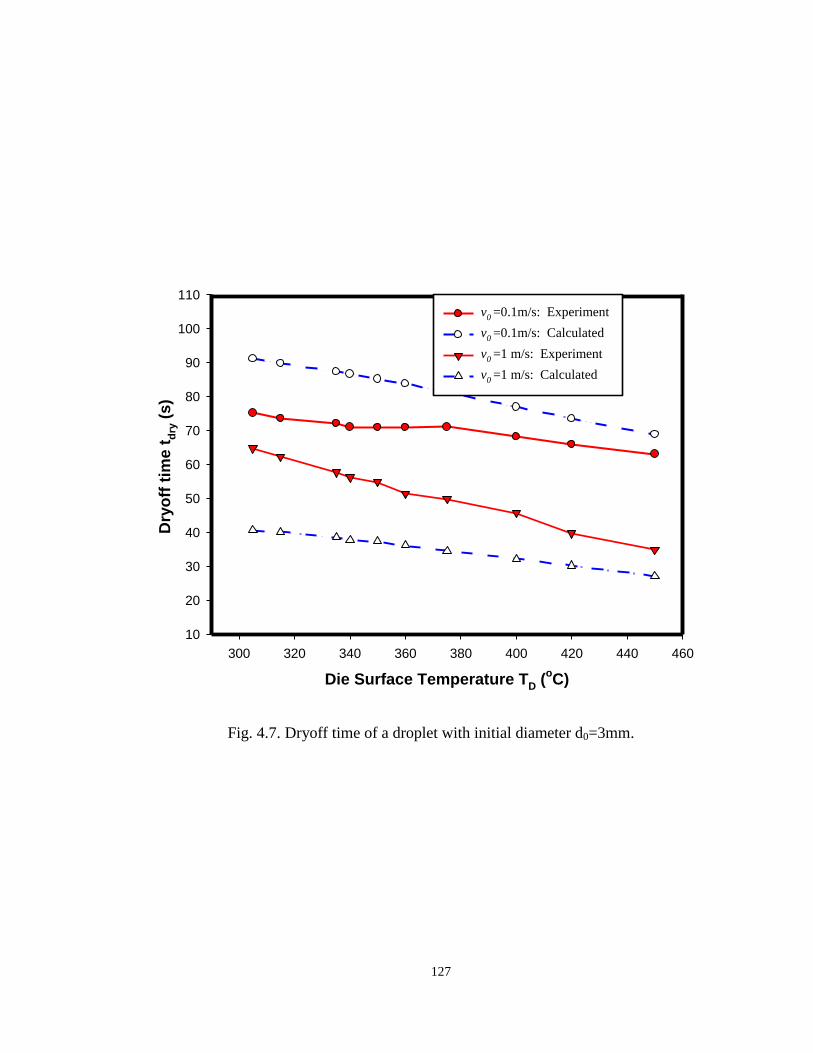
127
Die Surface Temperature TD (
oC)
300 320 340 360 380 400 420 440 460
Dry
off
tim
e t
dry
(s
)
10
20
30
40
50
60
70
80
90
100
110
v0 =0.1m/s: Experiment
v0 =0.1m/s: Calculated
v0 =1 m/s: Experiment
v0 =1 m/s: Calculated
Fig. 4.7. Dryoff time of a droplet with initial diameter d0=3mm.
128
4.7 Summary of the Chapter
A model has been developed to predict the dryoff time of a lubricant droplet impact on a
die surface heated to temperatures beyond Leidenfrost point. This model couples two
components: fluid dynamic model presented at a separate paper, and quasi-steady dryoff
model. Thickness of vapor layer and mass loss rate have been calculated from the model.
It is shown that thickness of vapor and mass loss rate are correlated with each other and
both increase with die surface temperature and Weber number We. Validation of the
model is accomplished by comparing dryoff times computed by the model and those
observed in the experiments. The calculated results agree with the experimental results in
the right magnitude.

129
CHAPTER 5
5. PHYSIOTHERMODYNAMICS OF LUBRICANT DEPOSITION
This chapter presents a methodology for studying lubricant behaviour during spraying on
hot die surfaces. It consists of a single droplet test to study the thermo-physical
phenomena and a “similitude” based approach to extend the results to geometrically
complex nozzle sprays. This methodology is applied to the published results on the
cooling of hot forging die surfaces and is found to predict both the magnitude and trends
reasonably well. It is observed that graphite in water lubricants with high dilutions
provide heat transfer coefficients similar to that of pure water while low dilutions provide
lower coefficients and longer dryoff times.
5.1 Introduction
In hot deformation processing, the dies are lubricated and cooled by spraying dilute water
based lubricants on the heated die surfaces. The lubricant not only cools the hot surface
from a temperature as high as 700oC and but also deposits a lubricant film that aids in
metal flow. For example in hot forging, the lubricant is often a fine suspension of
130
graphite particles in water, with surfactants and binders added to aid in the spreading and
the formation of an adherent lubricant film. Composition of the lubricant and the
selection of the spray parameters are often determined by the cooling and lubrication
needs of the intended application. This determination is often based on the domain
knowledge of lubricant and equipment suppliers and an empirical trial-and-error
procedure during set up. Fundamental understanding of lubricant behavior is lacking.
The work by Bariani et al. [27, 28] on water sprays in hot forging was the first systematic
attempt to study the effect of feed pressure and flow rate on the heat transfer coefficient
between heated flat dies and the coolant. Their experimental work includes results from
two different spray configurations: downwards towards the bottom die and upwards
towards the top die. They conclude that an increase in pressure and flow rate enhanced
the heat transfer coefficient for both the spray configurations. Studies reported on
lubricant sprays in die casting and rolling report similar conclusions that a higher liquid
flux density, defined as average liquid flow rate per unit area, provides a higher heat
transfer coefficient for a given surface temperature [24, 26, 29, 59- 60]. However, the
results reported in literature are confusing as the transfer coefficients in water spraying of
hot surfaces vary in the range 300 to 60,000W/m2.K; the results being very sensitive to
the spraying conditions.
Increasingly, researchers are focusing on understanding the fundamental physics
underlying the impact of liquid droplets on hot surfaces [13, 23, 61]. This knowledge not
only relevant to industrial processing but also to fuel injectors, ink jet printers, painting
131
and mist formation. In addition to experimental studies numerical simulations models
have also been developed to characterize the physics and thermodynamics of the process.
Many of these studies could be relevant to the forging lubrication field.
There are several challenges unique to spray lubrication in hot forging. The lubricant
contains many surfactants and binders that change the droplet surface energy, rheology,
physics and thermodynamics. The lubricant contains fine particles of graphite (submicron
to several microns in diameter) in colloidal suspension. Consequently, the flow is actually
multi-phase. The composition of the lubricant is often a trade secret. Therefore, an
inverse method must be developed to determine the properties of the lubricant relevant to
lubrication deposition and film formation.
The die surface temperatures, at the time of lubricant application, are normally between
300 to 450oC [27, 28, 62, 63]. The heat transfer phenomenon is transient and cyclic. The
spray consists of extremely fine droplets of varying diameters distributed spatially. It is
almost impossible to measure individual droplet size and their distribution. The die
surfaces are deep cavities with complex geometries, inclined surfaces and varying surface
temperatures.
This problem is too difficult to solve directly. Hence, this paper presents an approximate
methodology to capture the physics and thermodynamics of the process and use it for
predicting lubricant behavior. It consists of a simple single droplet experiment to
characterize the lubricant properties and study its behavior and a “similitude” based
132
approach that extends single droplet results to predicting physics and heat transfer in
complex liquid sprays. This methodology is applied to the thermal spray experiments
from Ref [27].to check its validity.
5.2 Droplet Impact on a Hot Surface
In the study of droplet impact on hot surface the following has been observed. At high
surface temperatures, steam forms between the droplet and the surface causing the
droplet to bounce off. In water based graphite this leads to pollution with graphite
particles depositing on the surrounding surfaces and the press structure. As the surface
cools due to heat loss, the droplet stays on the surface but is separated from it by a steam
blanket. The heat transfer is low in this regime of film boiling in Fig. 5.1 (regime IV).
The point of least heat flux is called Leidenfrost point.
On further cooling of the surface, the droplet enters a regime of transition boiling (regime
III in Fig. 5.1). The heat starts increasing as the steam can escape from the surface. The
heat transfer reaches a maximum when nucleate boiling initiates with vigorous
convection (regime II in Fig. 5.1). The point of maximum heat transfer is called CHF
(critical heat flux). At significantly lower surface temperatures the heat transfer is
through natural convection and vapor release (regime I in Fig. 5.1).
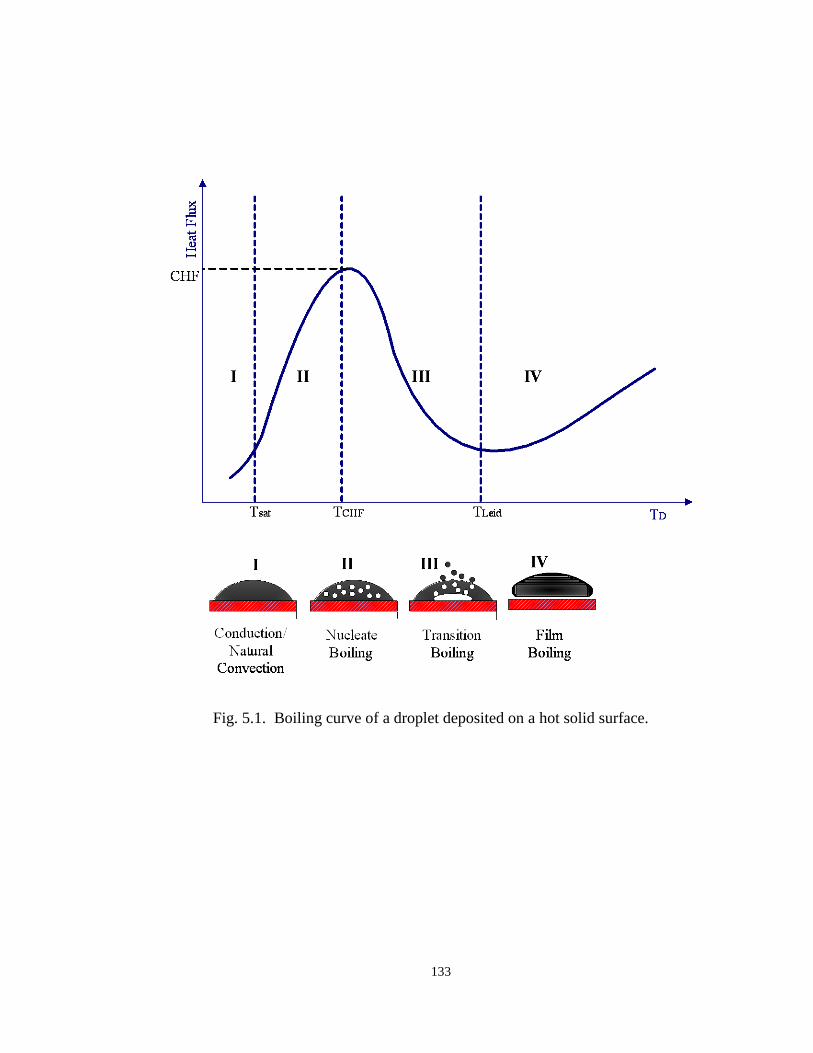
133
Fig. 5.1. Boiling curve of a droplet deposited on a hot solid surface.
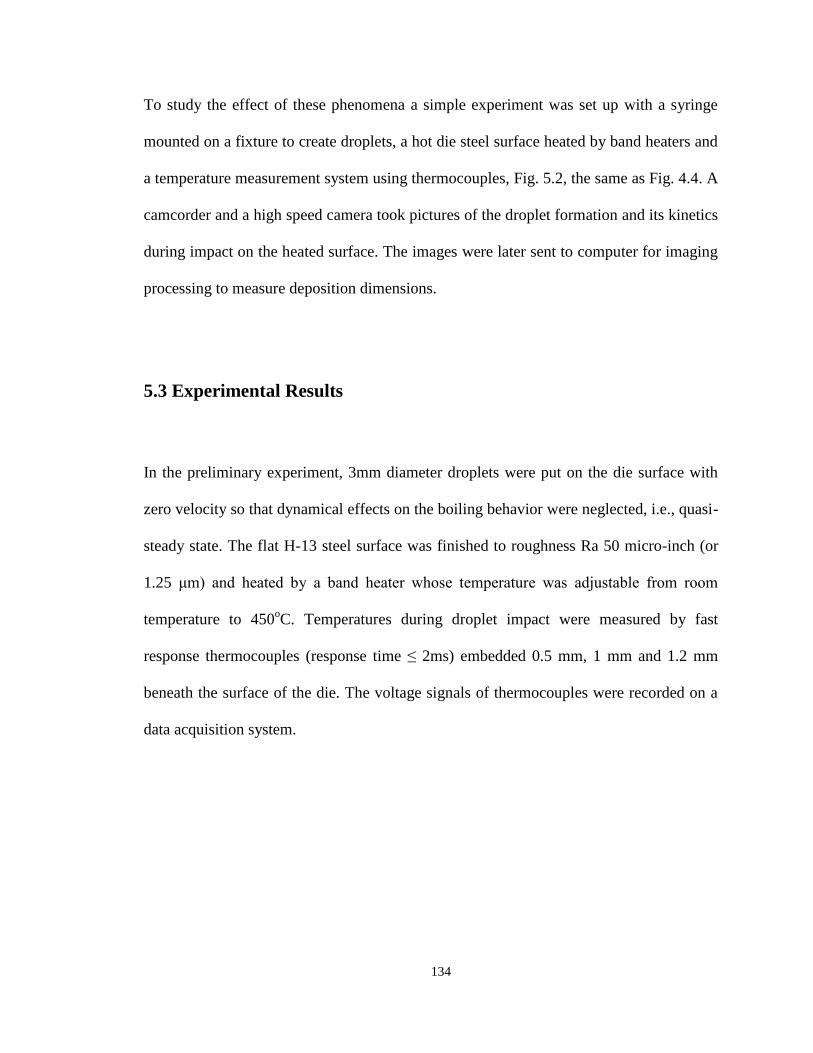
134
To study the effect of these phenomena a simple experiment was set up with a syringe
mounted on a fixture to create droplets, a hot die steel surface heated by band heaters and
a temperature measurement system using thermocouples, Fig. 5.2, the same as Fig. 4.4. A
camcorder and a high speed camera took pictures of the droplet formation and its kinetics
during impact on the heated surface. The images were later sent to computer for imaging
processing to measure deposition dimensions.
5.3 Experimental Results
In the preliminary experiment, 3mm diameter droplets were put on the die surface with
zero velocity so that dynamical effects on the boiling behavior were neglected, i.e., quasi-
steady state. The flat H-13 steel surface was finished to roughness Ra 50 micro-inch (or
1.25 μm) and heated by a band heater whose temperature was adjustable from room
temperature to 450oC. Temperatures during droplet impact were measured by fast
response thermocouples (response time ≤ 2ms) embedded 0.5 mm, 1 mm and 1.2 mm
beneath the surface of the die. The voltage signals of thermocouples were recorded on a
data acquisition system.
135
NI Data
Acquisition
System (DAQ)
Band
Heater
Temperature
Controller
LabVIEW
7.0
H
Syringe
Camcorder
CameraDroplet
Heat
Insulation
Material
Support
Stand
Thermocouples
Heated Die
Surface
Fig. 5.2. Schematic experiment setup.
136
5.3.1 Heat flux
Fig. 5.3 shows that lubricants with 1:20 and 1:5 dilution ratios have the best overall
cooling performance, highest average heat flux, as compared with water in the convective
boiling stage. As the dilution ratios are reduced, the behavior shifts from lubricants-in-
water to water-in-lubricant and the heat flux reverses. The reason behind this
phenomenon can be explained as the balance of the two opposite effects of suspended
graphite particles: helping to nucleating bubbles at low dilution ratios (almost as
contaminants) and thwarting of the bubble movement (due to high surface tension) at low
dilution ratios.
5.3.2 Critical Heat Flux (CHF) and Leidenfrost
With a low dilution ratio, such as 1:20 and 1:5, CHF temperature is around 140oC which
seems a few degrees lower than that for water. However, CHF temperature increases up
to almost 200oC for both 1:1 and 5:3 lubricants (higher solid content).
One possible explanation of the phenomena is that the fine graphite particles in the liquid
facilitate the generation of bubbles in the regime of nucleate boiling and enhance the
vaporization rate, which lowers the CHF temperature below that of the water. However,
when the dilution ration goes up the suspended particles become so dense that they start
to retard the movement of the bubbles which bring heat and mass out of the liquid
surface, and this effect overcomes the enhanced nucleating process.
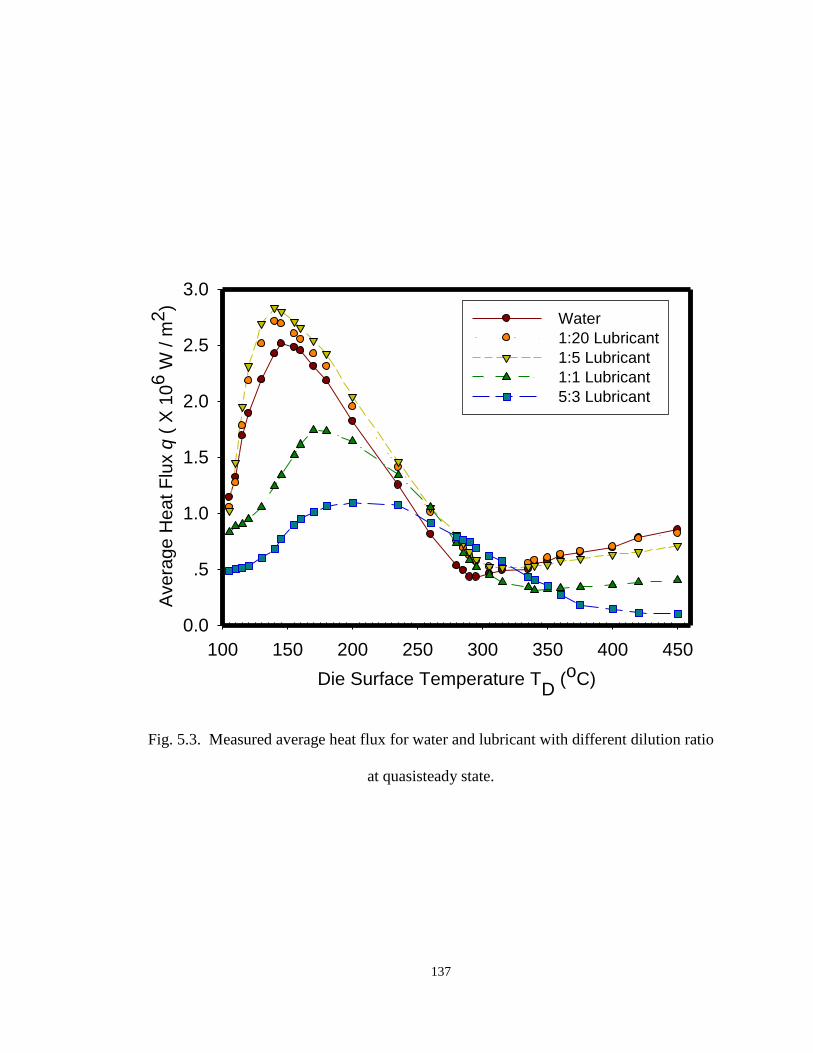
137
Die Surface Temperature TD (
oC)
100 150 200 250 300 350 400 450
Avera
ge H
eat
Flu
x q
( X
106 W
/ m
2)
0.0
.5
1.0
1.5
2.0
2.5
3.0
Water
1:20 Lubricant
1:5 Lubricant
1:1 Lubricant
5:3 Lubricant
Fig. 5.3. Measured average heat flux for water and lubricant with different dilution ratio
at quasisteady state.
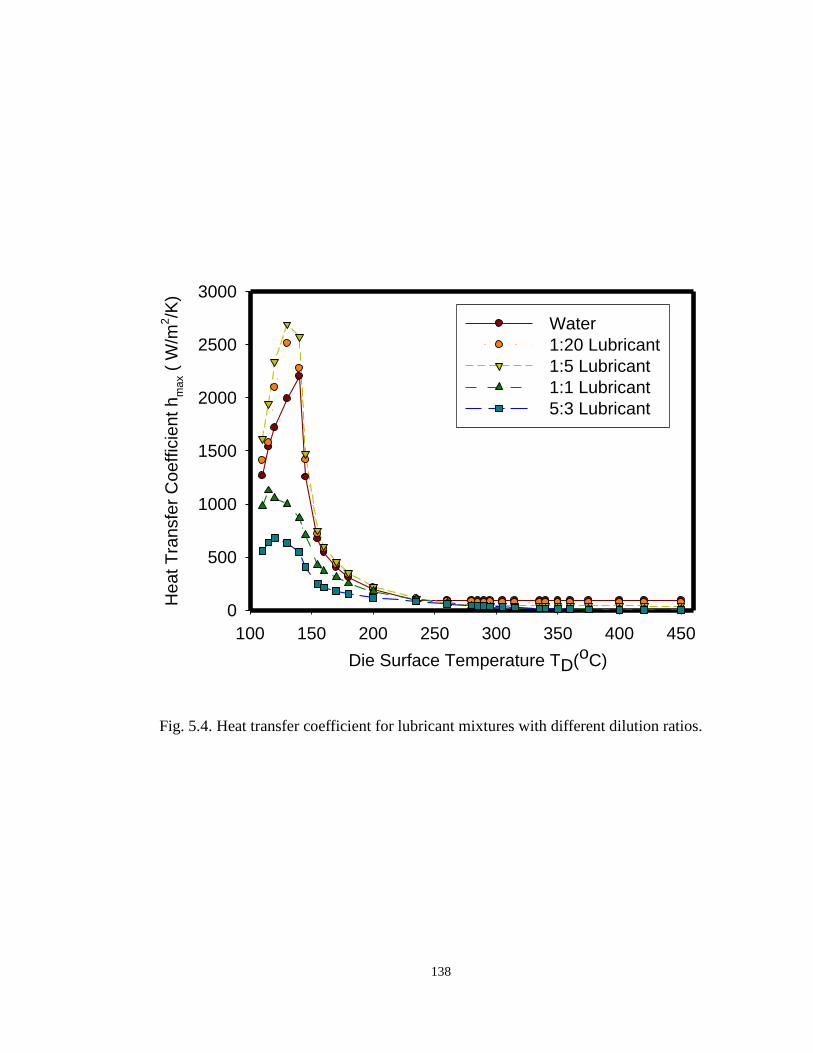
138
Die Surface Temperature TD(oC)
100 150 200 250 300 350 400 450
He
at
Tra
nsfe
r C
oe
ffic
ien
t h
ma
x (
W/m
2/K
)
0
500
1000
1500
2000
2500
3000
Water
1:20 Lubricant
1:5 Lubricant
1:1 Lubricant
5:3 Lubricant
Fig. 5.4. Heat transfer coefficient for lubricant mixtures with different dilution ratios.
139
Leidenfrost temperature increases as the dilution ratio increases from 1:20 to 5:3 while
the Leidenfrost temperature of the water, 285oC in the experiment, is lower than those of
the all diluted lubricants. The Leidenfrost temperature is defined as the temperature
where the droplet becomes completely separated from the heated die surface by an
intervening vapor layer. A droplet with higher dilution ratio requires higher surface
temperature to produce the critical vaporization rate to overcome the weight of the
droplet and lift itself. This means a higher Leidenfrost temperature.
5.3.3 Heat Transfer and Dryoff
Fig. 5.4 shows the heat transfer coefficient (HTC) between the heated droplet and the
heated die surface. Lubricants with 1:20 and 1:5 dilution ratio present the largest heat
transfer coefficient values when the die surface is below 200oC with highly dense
lubricants showing relatively low heat transfer. The coefficient in the film boiling
region, e.g. 0.34 W/m2/K for lubricant with 5:3 dilution ratio compared with that of the
water (9.45 W/m2/K). As the die surface is heated to over Leidenfrost temperature and
steam formation dominates, HTC becomes independent to the wall temperature as well as
almost independent of dilution ratios and keep almost constant.
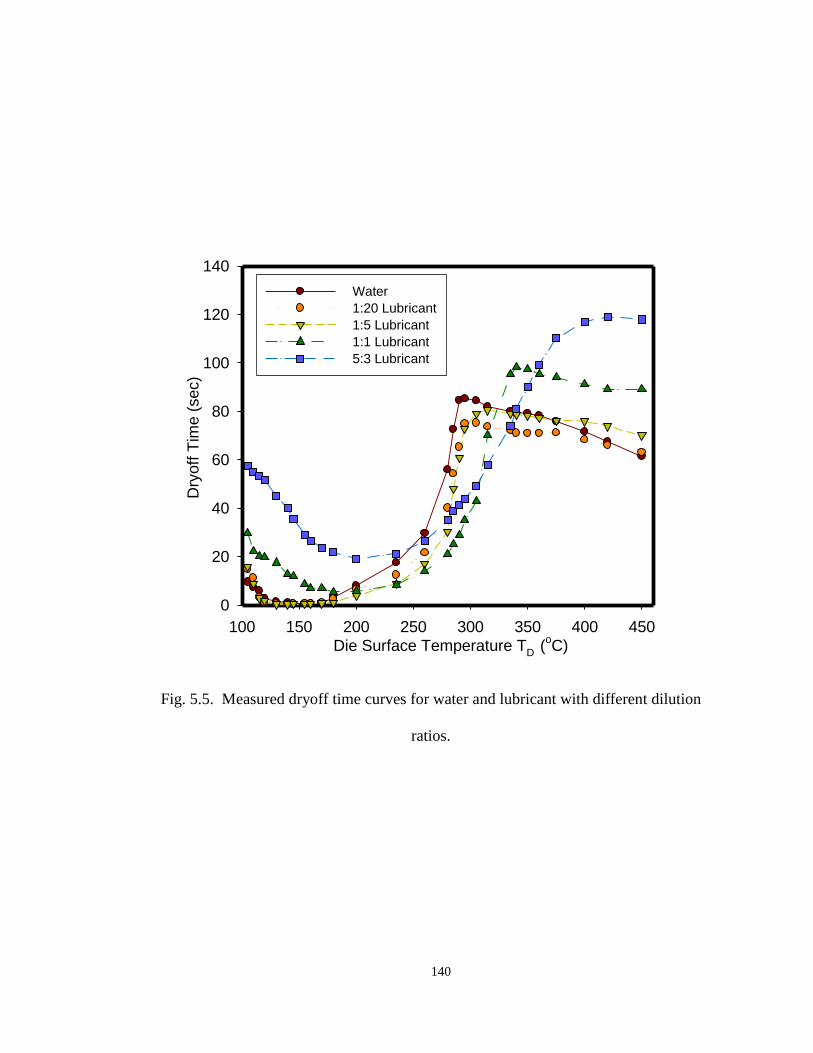
140
Die Surface Temperature TD
(oC)
100 150 200 250 300 350 400 450
Dry
off
Tim
e (
sec)
0
20
40
60
80
100
120
140
Water
1:20 Lubricant
1:5 Lubricant
1:1 Lubricant
5:3 Lubricant
Fig. 5.5. Measured dryoff time curves for water and lubricant with different dilution
ratios.
141
The dryoff time, defined as the duration from placing a droplet on the surface to complete
solid remained, is averaged from the measurements using stop watch and video image
combined. As expected, the dryoff times are higher for lubricants with higher solid
content because the overall heat flux is lower for less diluted lubricant than that for high
diluted ones, Fig. 5.5. It is interesting to note that between 150 to 250oC dryoff time is
almost independent of dilution ratio and results based on pure water are sufficient.
5.3.4 Effect of Drop Dynamics on Heat Transfer
Experiments were carried out to quantify the effect of droplet and hot surface parameters
such as droplet size, impact velocity and surface temperature were controlled variables in
these experiments. Lubricant droplets with the diameters of 2mm, 3mm, and 4 mm were
made to fall under their own gravity. Impact velocities were obtained between 10cm/s
and 200 cm/s by changing the height “h” of the droplet generator. Non dimensional
Weber number was used as it would enable the single droplet experiments to be
applicable to lubricant sprays.
The following equations were derived from the regression fit of experimental results for
the temperature range of 280 to 450 oC and for 100 to 280
oC respectively.
)(5279.0)(410079.9691.0
1 TheWeTh quasi
We
nWn
(5.1)
142
)(5347.1)(35.0
2 ThWeTh quasinW (5.2)
where 1Wh and 2Wh are heat transfer coefficients between droplet and die surface for each
of the temperature range, nWe the Weber number of the normal velocity element, and
quasih
the heat transfer coefficient at quasi-steady state shown in Fig. 5.4. The first terms in
Equation (5.1) and (5.2) define the contribution of droplet characteristics, while the
second terms introduce the effects of surface temperature on the heat transfer. The
Weber number is calculated as follows:
nWe = /2 Dvn (5.3)
where is the density of the water, the surface tension of the liquid, nv the normal
velocity of the drop.
5.4 Application to Sprays
5.4.1 Methodology for Plain-orifice Atomizers
To extend the single droplet approach to more complex spray systems where the droplet
sizes and the impact velocities vary in magnitude and also spatially, the following
assumptions are made: (a) The spray system is a plain orifice atomizer, most common in
143
liquid spraying, in which the jet break up into droplets is promoted by an increase in flow
velocity or air pressure. (b) The results of the large single droplet - low velocity
experiments can be applied to the small droplet-high velocity application using the
“similarity approach”. In this case Weber numbers (We= momentum force/ surface
tension force) will be used for this extrapolation. (c) The range of droplet sizes present in
the spray can be represented by the Sauter Mean Diameter (SMD).
With the above assumptions, the average diameter of the droplet in a spray, or SMD, can
be calculated using relation derived by Elktob [14]:
54.006.0737.00.385
L )(3.08 LAL PSMDD (5.4)
where L
is the kinematic viscosity of the liquid, L the density of the liquid,
A the
density of the air, and LP the pressure drop across the nozzle. This relation applies to the
plain orifice atomizer in which only pressure drop across the nozzle is used to atomize
the liquid jet.
The pressure drop LP in Equation (5.4) can be reversely calculated by:
2
C
QPL
(5.5)
where Q is the flow rate and C a constant representing the nozzle geometry.

144
The average of normal velocity of the droplets in the spray can be estimated as:
A
Qvn
(5.6)
where A is the discharge orifice area.
Introducing Equations (5.4), (5.5) and (5.6) into (5.3), the average Weber number nWe is
calculated for the spray and this is used in Equations (5.1) and (5.2) to calculate the heat
transfer coefficient and flow rate of a spray at a specific surface temperature.
5.4.2 Case Study: Hot Forging Lubrication
The above relations are used to predict the heat transfer coefficients for the lubricant
spray and the die surface temperatures used in the pure water experiments carried out by
Bariani et al. [27].
In their study, Bariani et al. generated sprays by atomizing water from a plain-orifice
atomizer. Three types of nozzles were used in their experiments [28] and their constant C,
defined in Equation (5.5), for these are determined as:2/113-8103.7378 Pasm ,
2/113-8107040.6 Pasm and 2/113-7101991.1 Pasm .

145
Flow Rate (X10-6m3/s)
50 60 70 80 90 100 110 120
He
at
Tra
nsfe
r C
oeff
icie
nt
(W/m
2/K
)
200
400
600
800
1000
1200
1400
1600
1800 Water
1:20 Lubricant
1:5 Lubricant
1:1 Lubricant
5:3 Lubricant
Fig. 5.6. Predicted heat transfer coefficient for lubricant sprays with different dilution
ratios.
Assuming that the droplets do not interact with each other and the impacting area of each
droplet on the die surface does not overlap, the transient heat transfer coefficient of the
146
spray can be calculated using Equations (5.1) and (5.2). If it is further assumed the heat
transfer coefficient can be averaged over time as the temperature of the die drops from
400oC to 100
oC, the overall spray heat transfer coefficient can be predicted. This is
plotted for different dilution ratios and flow rates in Fig. 5.6. Since the results in [27] do
not distinguish the nozzles types, one can only compare the magnitude and the trend of
the calculated heat transfer coefficient. Bariani et al. [27] report heat transfer coefficients
for Zone 2 to 4 in the range of 1800 to 1107 W/m2K for pure water. This agrees well
with results in Fig. 5.6 for water spray. Zone 1 directly under the spray in [27] has high
water accumulation and hence cannot be modeled by the proposed single droplet
methodology.
5.5 Summary of the Chapter
This chapter presents a methodology for calculating the heat transfer coefficients in
lubricant sprays in hot forging. It consists of two steps. First, the heat transfer
characteristics of the lubricants at various thermo-physical regimes on the hot surface are
determined using single droplet experiments. Then, the results of these experiments are
used along with equations based on a non-dimensional and averaging approach to predict
heat transfer coefficients for a complicated spray.
This methodology is applied to calculate the heat transfer coefficients for water spray
experiments carried out in References [27] and [28]. Validity of the methodology is
confirmed by comparing with average coefficients inverse calculated by Bariani et al.

147
using FE models [27]. It is found that both the magnitude and trends agree fairly well. It
is interesting to note that the heat transfer coefficients for highly diluted sprays are
similar to that for pure water spray, while those with high solid content (lightly diluted)
are significantly lower indicating less effect of steam.
148
CHAPTER 6
6. COMPREHENSIVE APPROACH TO FILM FORMATION,
POLLUTION AND HEAT TRANSFER IN HOT DIE
LUBRICATION
Lubrication plays a critical role in the efficacy of metal flow, die surface thermal
softening, and pollution during hot processing of metals. The lubricant is often applied to
the hot die surface between 250 to 600oC by spraying a dilute graphite suspension
through high pressure nozzles. This results in the formation of steam, followed by
nucleate boiling of the residual liquid, and in the end lubricant spreading and film
formation on the hot surface that is continuously loosing heat. This chapter presents a
comprehensive approach to study and model the effect of the lubricant properties,
dilution ratio, spraying parameters and the transient nature of the thermal and physical
phenomena. Results of single the droplet and the spray tests with graphite suspensions in
water have been included to demonstrate these effects.

149
6.1 Introduction
In the hot forging process, lubricant is applied by spraying a dilute water-based graphite
suspension on the heated dies during the forging cycle that consists of placing the billet
on the preheated dies, forging, ejection and post ejection lubricant spraying. The lubricant
spray chills the die surface which may reach a temperature as high as 700oC during
forging and about 450oC post ejection spraying. Best operating temperatures for hot
working die steels such as H-13 are in the range of 200 to 300oC. Therefore, the spray
process effects the deposition of the film and the heat transfer from the die which in turn
affect the thermal softening and thermal fatigue of the die surface. A large spray time and
slow flow rate increases the forging cycle time, affects productivity and increases thermal
softening, while a shorter time (large flow rate, large heat flux) increases thermal fatigue.
Current problems like poor lubrication performance, excessive lubricant consumption,
and lack of temperature control result from poor design of the spray system or poor
selection of spray parameters. Another major problem is air and water pollution during
due to the presence of graphite particles in the environment, Fig. 6.1. Overexposure to
graphite can cause coughing, dyspnea, black sputum, or impairment of the pulmonary
function. This is so important that OSHA has set up a TWA permissible exposure limit
(PEL) for graphite that is 2.5 mg/ m3. The goal is to completely eliminate aerosol
emissions within the forging plants.

150
Fig. 6.1. Excessive consumption of lubricant and significant pollution from lubrication.
151
The work by Bariani et al. [27, 28] on water sprays in hot forging is amongst the first
systematic attempt to study the effect of feed pressure and flow rate on the heat transfer
coefficient between heated flat dies and the lubricant. Their experimental work includes
results from two different spray configurations: downwards towards the bottom die and
upwards towards the top die. They conclude that the increase of the feed pressure and the
flow rate increases the heat transfer coefficient for both the spray configurations. Studies
reported on lubricant sprays in die casting and rolling processes also conclude that a
higher liquid flux density, defined as average liquid flow rate per unit area, provides a
higher heat transfer coefficient for a given surface temperature [25, 26, 29, 59, 62].
However, the heat transfer coefficients and the heat flux reported in literature vary by
factors of magnitude. Therefore, the recent studies have focused on understanding the
fundamental physics underlying the impact of liquid droplets on hot surfaces [33, 61].
This knowledge will help explain some of the conflicting results not only in liquid sprays
in industrial processing but also those in fuel injectors, ink jet printers, painting and mist
formation. In addition to experimental studies, numerical simulations models have also
been developed to characterize the physics and thermodynamics of the spray process [13].
Many of these studies could be relevant to the forging lubrication field. Consequently,
this paper takes a comprehensive look into the modeling of fundamentals phenomena and
their applications to hot forging lubrication.
152
6.2 Factors Affecting Lubrication in Hot Forging
There are several factors unique to spray lubrication in hot forging: The lubricant
contains fine particles of graphite (submicron to several microns in diameter) in colloidal
suspension in liquids (surfactants, binders, oil or water) that change the droplet surface
energy, rheology, physics and thermodynamics. The composition of the lubricant is often
a trade secret and cannot be directly determined. Hence, an inverse method must be used
to determine the properties of the lubricants relevant to lubricant deposition and the film
formation. The lubricant spray consists of extremely fine droplets of varying diameters
distributed spatially. It is almost impossible to measure individual droplet size and
distribution. A statistical procedure must be used to capture the spray dynamics. The die
surface temperature looses heat continuously due to steam formation, nucleate boiling,
convention and dryoff. This heat transfer phenomenon is transient and cyclic. The die
surfaces have deep cavities with complex geometries, inclined surfaces and varying
surface temperatures. Therefore, a strong coupling exists between the geometrical and
thermophysical attributes. This relationship is shown schematically in Fig. 6.2, the same
as Fig. 2.1 in Chapter 2. The die surface properties, the lubricant dilution ratios (and the
thermophysical properties), and the spray parameters determine the “spraying system”.
The parameters of this system affect the deposition mass of the lubricant on the die
surface (and its thickness distribution) and the heat flux (and the die surface temperature)
as functions of the lubrication time. Arrows in the plots indicate increasing solid content
in the lubricant (reducing dilution ratios).
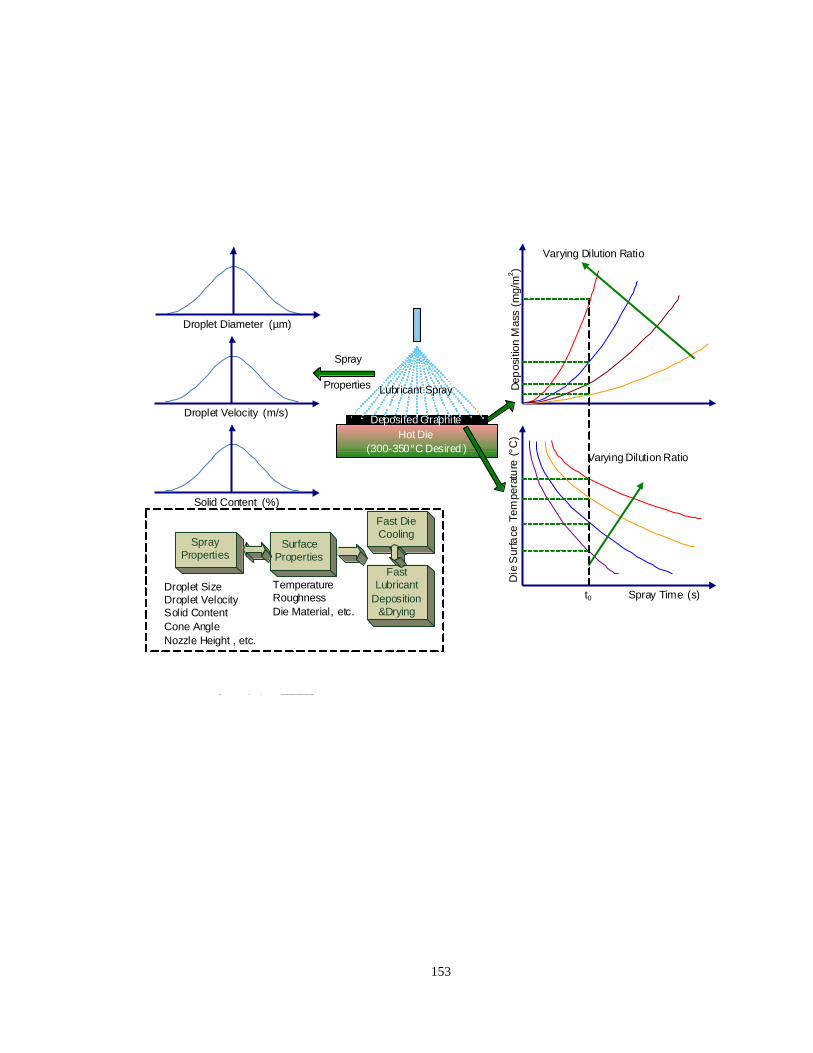
153
Hot Die
(300-350°C Desired )
Lubricant Spray
Deposited Graphite
Dep
osi
tion
Mass
(m
g/m
2)
Spray Time (s)
Die
Surfa
ce T
em
pera
ture
(°C
)
Varying Dilution Ratio
Varying Dilution Ratio
t0
Droplet Diameter (µm)
Droplet Velocity (m/s)
Solid Content (%)
Spray
Properties
Spray
PropertiesSurface
Properties
Fast Die
Cooling
Fast
Lubricant
Deposition
&Drying
Droplet Size
Droplet Velocity
Solid Content
Cone Angle
Nozzle Height , etc.
Temperature
Roughness
Die Material, etc.
Fig. 6.2. Factors influencing lubricant deposition and die cooling.
154
The interaction between the sprayed lubricant and the heated die surface is so
complicated that it is very difficult to optimize the die cooling, with the lubricant
deposition and droplet bouncing off simultaneously. Sometimes one can improve the rate
of lubricant deposition but may adversely affect die cooling. Therefore, it is essential to
tackle this problem in variety of ways including experiments, mathematical models
(deterministic as well as stochastic) and numerical simulations. A comprehensive
approach has been adopted at the Center for Excellence in Forging Technology at the
Ohio State University in studies that combines continuum mechanics, stochastic
modeling and simulation with observations and controlled experiments including:
Single droplet experiments to investigate the thermo-physics of different
phenomena such as steam formation (bounce off), first formation of bubbles on
the heated surface (Liedenfrost point, TLeid), nucleate boiling (bubbling and
wetting), spreading of the lubricant film and lastly the break up of the film at high
impact velocities. These phenomena are best represented through non-
dimensional Weber number We (ratio of kinetic energy to surface energy) that
defines the stability of bubbles in an isothermal system.
Single droplet numerical modeling and simulations to study the mechanics of
different phenomena and to inverse calculate the properties of the lubricants by
comparing the numerical predictions to actual observations.
Spray experiments using industrial lubricant spraying equipment and hot plates to
155
study the thermo-physical phenomena of multiple droplets with spatially and
temporarily distributed parameters.
Stochastic models of the spraying process (multiple-droplet sprays) that capture
the mechanics of the spray process and help determine the optimal spraying
conditions for desired deposition and heat transfer.
6.3 Bouncing, Wetting and Breaking up
The experimental set up for single droplet experiments consisted of a droplet generator
mounted on a fixture to create droplets, a hot die steel surface heated by band heaters and
a temperature measurement system using thermocouples. The setup is shown in Fig. 5.2.
A camcorder and a high speed camera took pictures of the droplet formation and its
kinetics during impact on the heated surface. The images were later sent to computer for
imaging processing to measure deposited film dimensions. Before the experiment,
graphite-based lubricant with 54% solid content (weight %) was diluted by distilled water
to 5:3, 1:1, 1:5, and 1:20 dilution ratios, which are volume ratio of lubricant to water.
Lubricant droplets were generated in diameters of 2 to 4 mm, and made to fall under their
own gravity. Impact velocities were obtained between 10 and 200 cm/s by changing the
height of the droplet generator. The flat H-13 steel surface was finished to roughness Ra
50 micro-inch (or 1.25 μm) and heated by a band heater whose temperature was
adjustable from room temperature to 450oC. Temperatures during droplet impact were
156
measured by fast response thermocouples (response times≤2ms) embedded 0.5, 1.0 and
1.2 mm beneath the surface of the die.
When a droplet impinging on a heated die surface with an initial velocity, it can spread
on the surface, break up to smaller droplets, or be rebounded from the surface [64 – 68],
similarly as in droplet impacts occurring under conditions without phase-change. Not
only dynamical parameters, particularly nondimensional Weber number
( /0
2dvWe ), but also thermal characteristics determine which result of the impact
will be. Weber number We is considered as the ratio of inertia force to the surface force,
where is the density of the droplet liquid, v the normal component of impact velocity,
0d the initial diameter of the droplet before impact, and the surface tension of the
droplet liquid. Without phase-change taking place, droplets will spread, and sometimes
rebound when the Weber number is small. Above a critical Weber number an impact
results in a disintegration of the drop, i.e., in a splash. The critical Weber number of
splashing depends on the roughness of the surface and also on the Reynolds number.
Actually, limiting conditions of splashing without phase-change are often expressed in
terms of the Ohnesorge number instead of the Weber number. However, in studies on the
interaction of droplets with hot walls normally a dependence on the Weber number is
considered. We will therefore stay with the Weber number in the following.
When drops impinge on a wall having a temperature that is above the saturation
temperature of the liquid, the wall temperature becomes another important variable - in

157
addition to the Weber number. The importance of further thermal parameters or of other
nondimensional numbers relating to thermal aspects has rarely been considered.
Therefore, in our experimental study of droplet impact on hot die surfaces both the
Weber number and the wall temperature have been changed with the other variable at a
fixed value. Waters and also lubricant with different dilution ratios were used in the
experiments. The experimental setup remained the same illustrated in Fig. 5.2.
In this study, regimes characteristic of droplets with different dilution ratio were mapped
in a Weber number (We) versus die surface temperature plots. As shown in Fig. 6.3 the
safe lubricant zone (constrained by bubbling, bounce off, Leidenfrost temperature and
spreading) increases as the solid content (less dilution) increases.
The experimental results are summarized in Fig. 6.3 (a), (b), (c) and (d) for lubricants
with four different dilution ratios. These characteristics are compared with those of water.
When Weber number is larger than a critical number, the droplet will always breakup to
smaller droplets. It is observed that all critical Weber numbers of the lubricants are larger
than that of the water. The more diluted the lubricant is, the closer the critical Weber
number to that of the water. This may be caused by the high viscosity of the lubricant
which decreases another important nondimensional parameter, Reynolds number
/Re 0Vd , where is the dynamic viscosity of the droplet liquid. For 5:3 lubricant,
the Reynolds number drops below the order of 10, which means the viscous dissipation
effect cannot be neglected. Part of the kinetic energy of the impacting droplet has to be

158
used to overcome the viscous shear force. Therefore, larger Weber number is expected to
contribute to the increased surface energy due to breakup and viscous dissipation than
that of the water droplet.
It is observed in Fig. 6.3 that the Leidenfrost temperature relating to a droplet with an
impacting velocity is greater than the quasi-state Leidenfrost point shown in Fig. 5.3 and
Fig. 5.4, i.e., the Leidenfrost point rises with the increasing of the velocity for a given
droplet. This is because the bounce-off is caused by the high pressure of the vapor
generated between the droplet and die surface. Now, in addition to balancing the gravity
of the droplet, the direction of its momentum also needs to be changed, and this requires
high surface temperature to generate faster evaporation rate. This phenomenon is the
dynamic analogue to film boiling and has therefore been called a dynamic Leidenfrost
phenomenon.
Fig. 6.3 also shows that the breakup is enhanced with decreased critical Weber number
when the die surface is heated above boiling temperature. The reason behind is obvious
that the fast boiling initiated by the contact of the droplet and die surface generates
dynamic pressure which helps to blow apart the droplet. However, this effect is not
evident for the lubricants with high dilution ratio. The stable evaporation rate of the
lubricant which is independent of temperature may contribute to this phenomenon.

159
We
0 50 100 150 200 250 300 350
Die
Surf
ace
Te
mp
era
ture
TD (
oC
)
0
100
200
300
400
500
Spreading Wetting
Bubbling Wetting
Bounce-off
Breakup
5:3 Lubricant
WaterTLeid
T'Leid
WecritWe'
crit
(a)
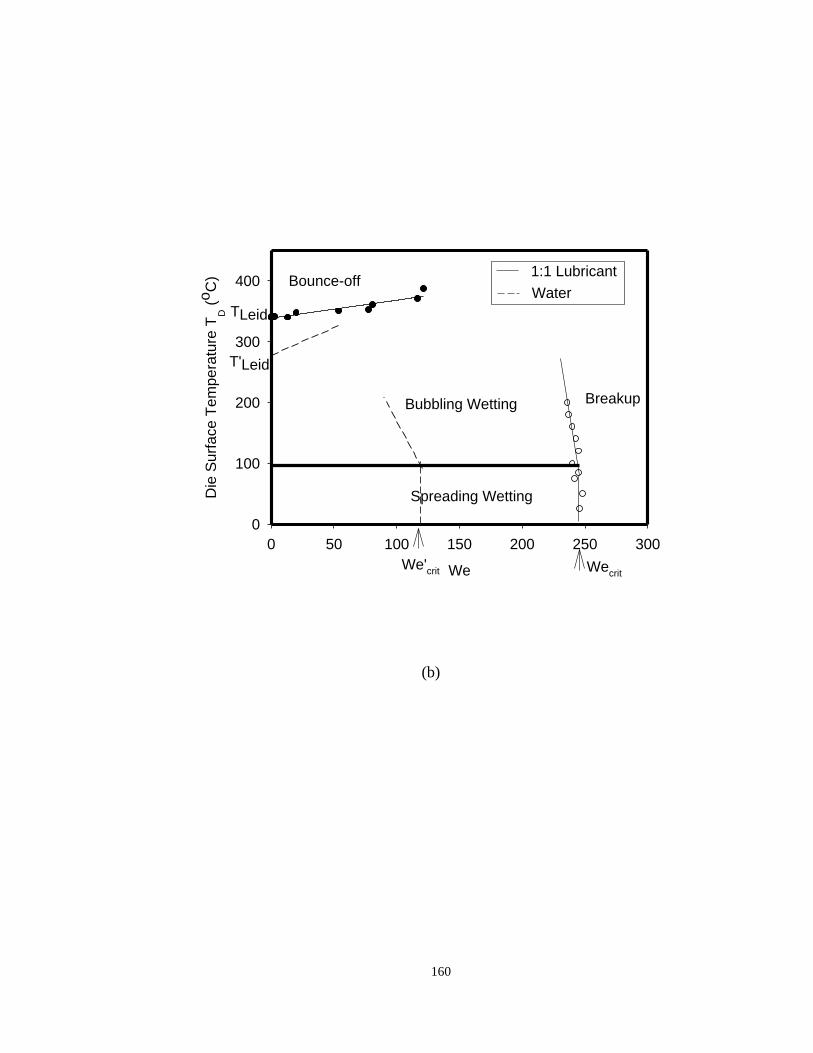
160
We
0 50 100 150 200 250 300
Die
Surf
ace T
em
pera
ture
TD (
oC
)
0
100
200
300
400
Spreading Wetting
Bubbling Wetting
Bounce-off
Breakup
1:1 Lubricant
Water
TLeid
T'Leid
Wecrit
We'crit
(b)
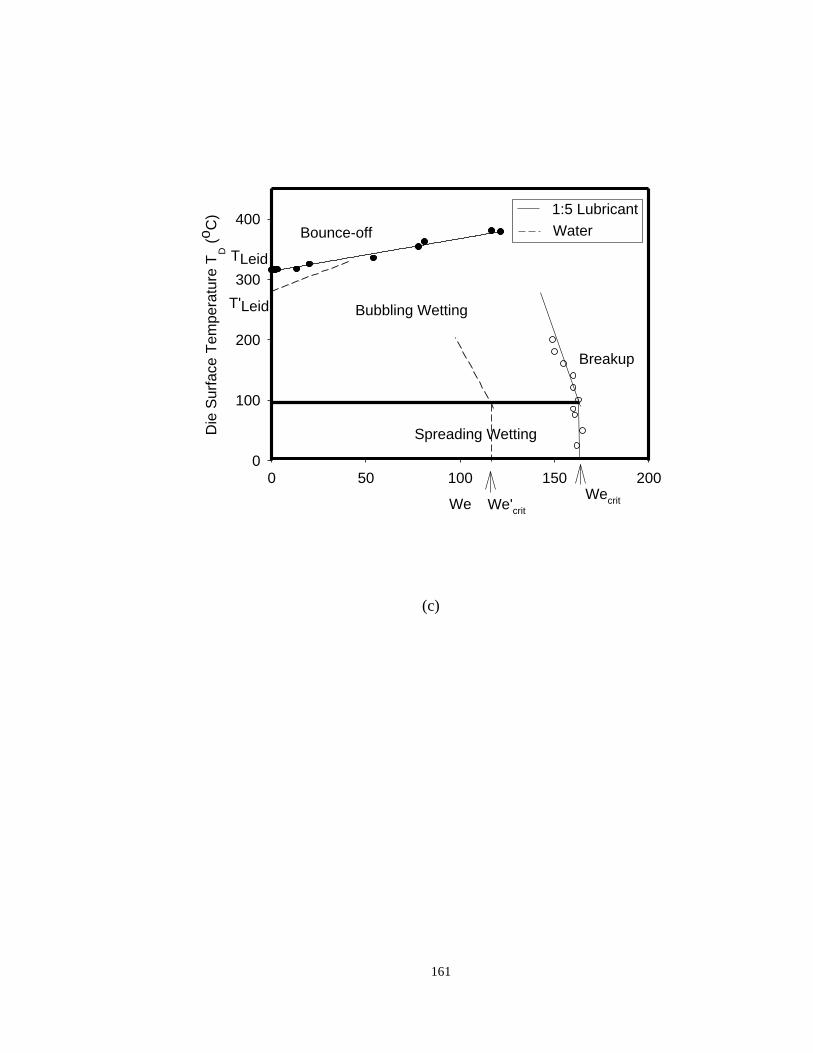
161
We
0 50 100 150 200
Die
Su
rfa
ce
Te
mpe
ratu
re T
D (
oC
)
0
100
200
300
400
Spreading Wetting
Bubbling Wetting
Bounce-off
Breakup
1:5 Lubricant
Water
TLeid
T'Leid
WecritWe'
crit
(c)
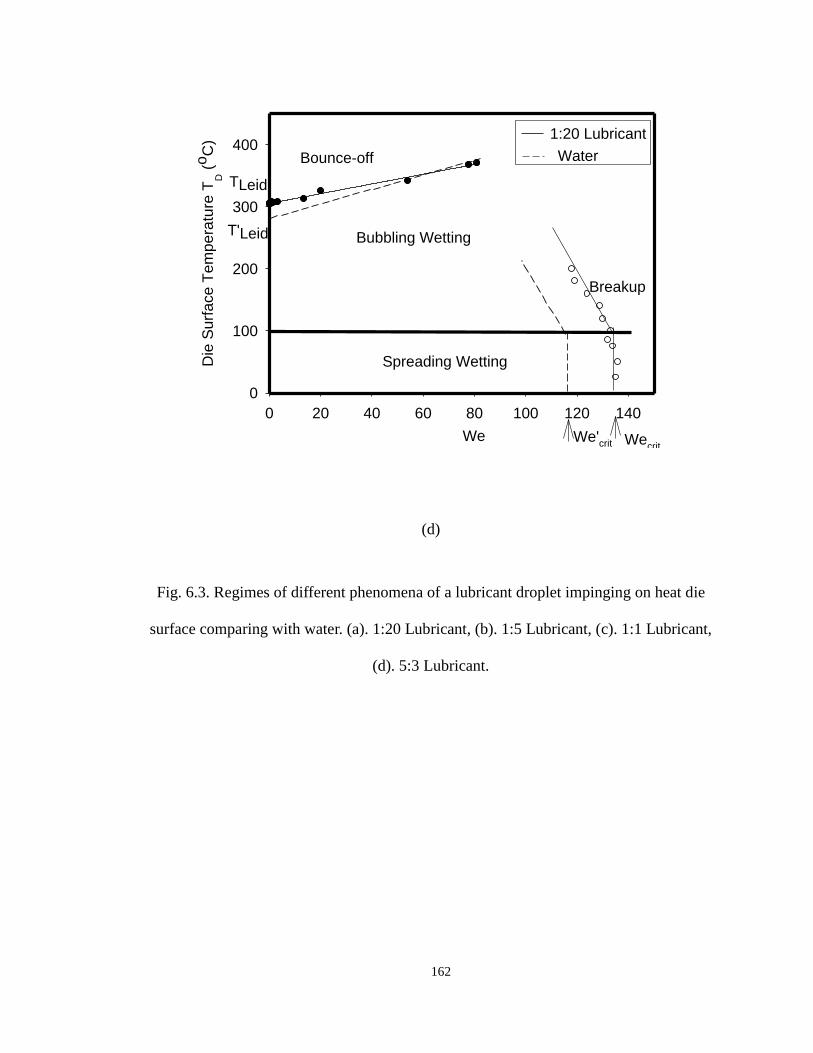
162
We
0 20 40 60 80 100 120 140
Die
Su
rfa
ce
Te
mp
era
ture
TD (
oC
)
0
100
200
300
400
Spreading Wetting
Bubbling Wetting
Bounce-off
Breakup
1:20 Lubricant
Water
TLeid
T'Leid
Wecrit
We'crit
(d)
Fig. 6.3. Regimes of different phenomena of a lubricant droplet impinging on heat die
surface comparing with water. (a). 1:20 Lubricant, (b). 1:5 Lubricant, (c). 1:1 Lubricant,
(d). 5:3 Lubricant.
163
6.4 Heat Flux During Lubricant Spraying
The spray cooling test was carried on a 20” diameter, 2” thick hot plate of H13 steel with
the aid of Acheson fix nozzle 682 spray system. A straight nozzle pipe with the inner
diameter 0.375” is chosen for spray. A 7100W ceramic radiant heater supported by
paralleled frame was used to heat up this steel plate to temperatures as high as 350oC.
Fifteen thermocouples were installed 0.02” beneath the hot plate surface at different
horizontal locations from the center of the hot plate. Temperature was measured at
various spray heights H (14, 17 and 20”), liquid pressures Pl (45, 60 and 75psi), and
dilution ratios (water and 1:20 dilution). Temperatures were measured at selected
positions (P1=0.0”, P2=1.5”, P3=2.5” and P4= 3.5”).
Temperature history data was continuously recorded and logged into computer through
data acquisition system. Selected results from these experiments are included in Fig. 6.4.
From the plots in this figure, the following is observed:
The instant heat transfer coefficient (HTC) peak happens after spray starts (0.5s to
1.0s), reaches around 30000 W/m2K and drops to 10000 W/m
2K gradually for the
location closest to the center of the spray. This drop off may be due to the heat
conduction from the neighboring locations at longer times. The temperature drop at
this location is also the highest. However as the spraying continues to 2s the heat
transfer at farther locations catch up with an average HTC around 10 to 15 KW/m2K
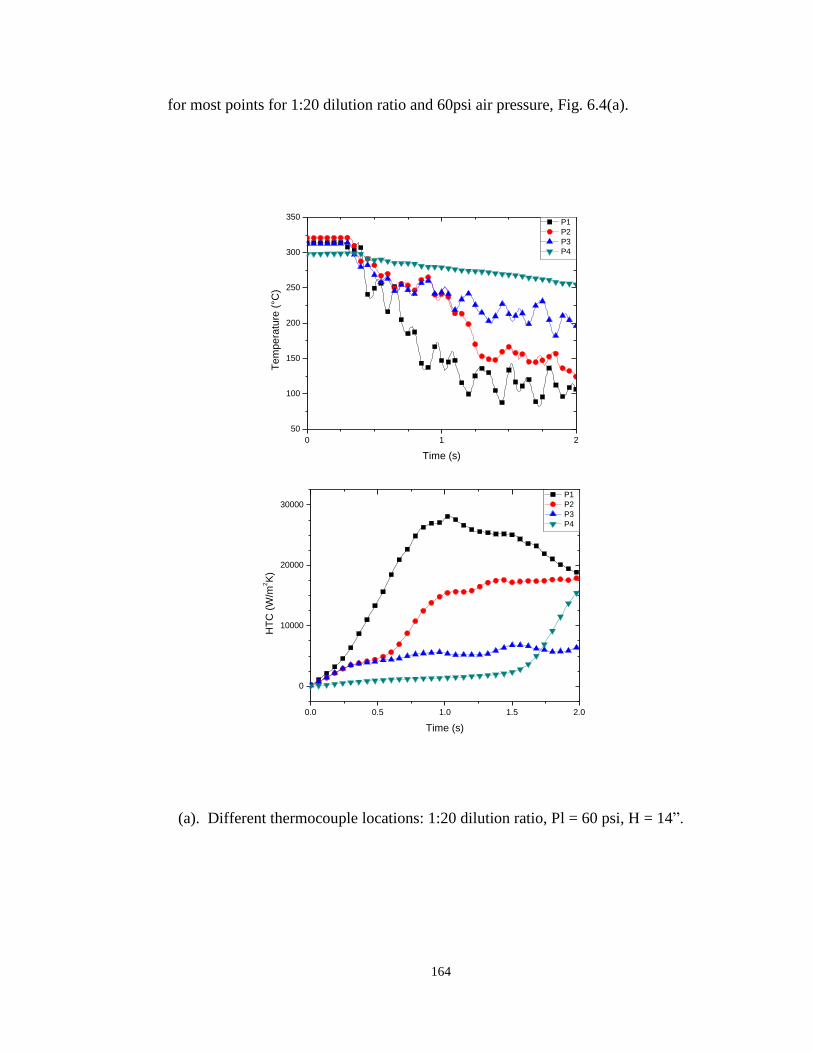
164
for most points for 1:20 dilution ratio and 60psi air pressure, Fig. 6.4(a).
0 1 2
50
100
150
200
250
300
350
Te
mp
era
ture
(°C
)
Time (s)
P1
P2
P3
P4
0.0 0.5 1.0 1.5 2.0
0
10000
20000
30000
HT
C (
W/m
2K
)
Time (s)
P1
P2
P3
P4
(a). Different thermocouple locations: 1:20 dilution ratio, Pl = 60 psi, H = 14”.

165
0 1 2
50
100
150
200
250
300
350
400
Te
mp
era
ture
(°C
)
Time (s)
75psi
60psi
45psi
0.0 0.5 1.0 1.5 2.0
0
10000
20000
30000
HT
C (
W/m
2K
)
Time (s)
75psi
60psi
45psi
(b). Different liquid pressures: 1:20 dilution ratio, at Point P0 (H = 14”).
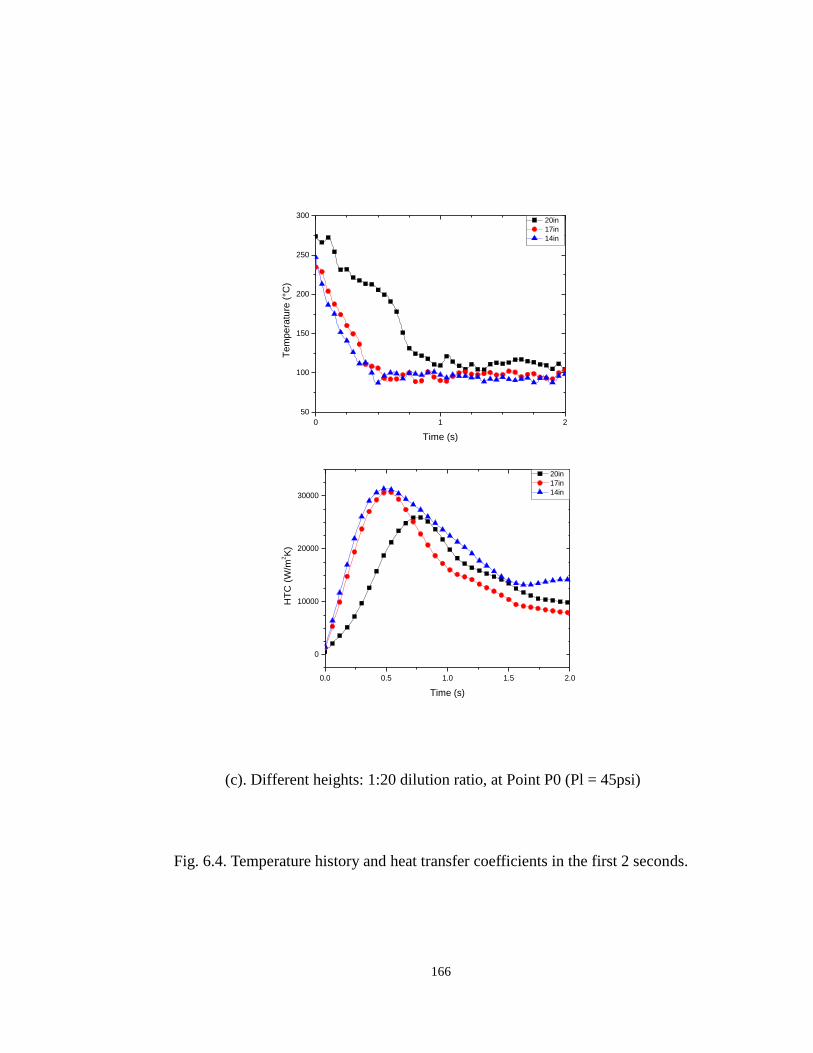
166
0 1 2
50
100
150
200
250
300
Te
mp
era
ture
(°C
)
Time (s)
20in
17in
14in
0.0 0.5 1.0 1.5 2.0
0
10000
20000
30000
HT
C (
W/m
2K
)
Time (s)
20in
17in
14in
(c). Different heights: 1:20 dilution ratio, at Point P0 (Pl = 45psi)
Fig. 6.4. Temperature history and heat transfer coefficients in the first 2 seconds.
167
For liquid pressure at 45psi, 60psi, and 75psi, the mass flow rates of water are rated at
0.618GPM, 0.736GPM, and 0.830GPM respectively, when air pressure is fixed at
75psi. At 45 and 60 psi HTC increases with water flow rate but at higher 75 psi the
water atomizes and lower heat transfer is observed, Fig. 6.4(b). The reasons behind
this anomaly needs further study.
Plots of temperature history and HTCs for different spray height imply the opposite
effects of droplets velocity on HTC, Fig. 6.4(c). At higher heights the impact
velocities are high and the droplets quickly fly away hot plate when they hit the hot
plate. This bouncing off phenomenon is also observed in the single droplet
experiments. After 0.5 seconds the HTC for 20” height catch up as a liquid layer is
now present and the droplets are plashing into this.
6.5 Summary of the Chapter
This chapter first outlines the problem of forging spray lubrication and the relations
between the spray parameters and the forging process parameters. Then it describes the
comprehensive research approach adopted at CEFT to model, predict and control the
phenomena of pollution, heat transfer and lubricant deposition. This approach includes
168
single droplet experiments to investigate fundamentals of the deposition process, and the
spray experiments to investigate the relationship between spray parameters and the heat
transfer coefficients. Based on the preliminary results the following conclusions can be
reached:
Results from single droplet test show that both Weber number We and die surface
temperature play important role on the lubricant wetting on the die.
Low dilution ratios (with higher solid contents) provide for greater lubricant
process window. However, it is possible that lower dilution my also provide lower
graphite air pollution due to higher Leidenfrost temperature (die surfaces below
430oC) may not experience bounce off. Also the lower dilution ratios delay the
break-up of the lubricant film to higher Weber numbers (We > 325) due to higher
viscous energy that stabilizes the bubbles.
The spray test results show that both liquid pressure and spray height increase
kinetic energy, cause droplets bouncing off from the hot plate, and hinder spray
cooling. This is a reverse of the role of flow flux density (flow rate) in increasing
the heat flux. This indicates that for lubricant sprays, the nozzle design and
atomization will play a major role in controlling the different physical ad thermal
phenomena. This is the goal of the ongoing study.

169
170
CHAPTER 7
7. CONCLUSIONS AND FUTURE WORK
7.1 Conclusions
The main objective of this research is to build models that relate formation of lubricant
film and heat transfer phenomena of the die to lubricant properties and lubricant
application characteristics. Studies focused on physical phenomena of single droplet of
water based graphite lubricant were conducted to fulfill the objective. Mathematical
models based on balance equations were developed to predict the interaction behaviors
between lubricant droplets and the hot die surface. Experiments were conducted to
validate the models and also to build an empirical heat transfer model.
The work completed can be summarized as follows:
1. An isothermal model for lubricant spread on the die surface is presented to study the
dynamics and spread of lubricant droplet on the hot die surface. The predictions were
validated by experimental results at different Weber numbers and lubricant dilution
171
ratios. A relation was derived between the spread factor and the Weber number that is
valid for all dilution ratios greater than unity (dilute suspensions).
2. The dryoff model for die temperatures beyond the so-called Leidenfrost point was
developed to predict dryoff time of the lubricant with high dilution ratios. The model
was solved under the assumption that the lubricant droplet begins to evaporate only
after the droplet deformation has stabilized and the kinetic energy has been
completely consumed. The dryoff times were predicted from the model for different
droplet impacts and compared well with experimental results.
3. Heat transfer experiments were conducted to build an empirical heat transfer
coefficient model and to map regions of physiothermodynamics of lubricant
deposition on the hot die. This model was applied to calculate the heat transfer
coefficients for water spray experiments. It was found that both the magnitude and
trends agree fairly well. It is interesting to note that the heat transfer coefficients for
highly diluted sprays are similar to that for pure water spray, while those with high
solid content (lightly diluted) are significantly lower indicating less effect of steam.
4. Single droplet experiments were conducted to investigate fundamentals of the
deposition, bounce-off, and breakup of the droplet as outcomes of droplet-surface
interactions. Results showed that both Weber number We and die surface temperature
play an important role on the lubricant wetting on the die. Low dilution ratios (with
higher solid contents) provide for greater lubricant process window. However, it is
172
possible that lower dilution may also provide lower graphite air pollution since higher
Leidenfrost temperature (die surfaces below 430oC) may not experience bounce off.
5. The spray test results showed that both liquid pressure and spray height increase
kinetic energy, causing droplets to bounce off from the hot plate, and hinder spray
cooling. This is a reversal of the role of flow flux density (flow rate) in increasing the
heat flux. This indicates that for lubricant sprays, the nozzle design and atomization
will play a major role in controlling the different physical and thermal phenomena.
7.2 Research Significance and Contribution
Through this project we get a fundamental understanding of the formation of lubricant
film and heat transfer phenomena of the die relating to lubricant properties and lubricant
application characteristics during the lubricant spray in hot forging. This is expected to
yield the following results of industrial relevance:
1. The dynamic/ thermal models of lubricant spray can help in optimizing lubricant
performance in hot forging processes or other hot metal working processes.
Engineers can use these models to optimize spray parameters if film patterns and heat
transfer of the spray are given. The objective of the optimization is energy saving and
pollution elimination.
173
2. The developed models can also assist engineers in lubricant selection. Given
lubrication and thermal requirements, the models can inversely calculate the lubricant
properties, based on which the lubricant is selected.
3. The knowledge of the relationship between spray performance (film deposition and
thermal cooling) and spray parameters / lubricant properties is very helpful for
engineers to design spray applicators.
7.3 Suggested Future Work
To have a full understanding of spray lubrication in hot metalworking processes, the
following tasks considering various aspects should be further investigated in the future:
1. Extensions to the research on computing spread and dryoff include the improvement
of the current method to take into account the effects of graphite suspensions
numerically and experimentally. Models to address the effects of colloidal suspension
inside the lubricant droplet would improve the accuracy of the prediction of spray
performance in lubricant application.
2. Analytical and experimental studies on the interaction between lubricant droplets and
more complex surface properties, such as roughness, temperature distribution, oblique
surface and arbitrary geometries should be carried out. These models can be used to
174
predict lubricant spray performance for industrial die cavities, which are composed of
several basic geometries.
3. The statistical model which will relate the droplet models to the spray models through
stochastic processes should be developed. This model would directly relate the spray
phenomena to the physical mechanisms obtained in the single droplet studies.

175
LIST OF REFERENCES
[1] Liu, H.: Science and engineering of droplets – fundamentals and applications,
Detroit, Michigan, ISBN 0-8155-1436-0, 1999.
[2] Masters, K.: Spray drying handbook, Longman Scientific & Technical, Harlow, 5th
edition, 1991.
[3] Lang, R.J.: Ultrasonic atomization of liquids, The Journal of the Acoustical Society
of America, 34, 1, p. 6-8, 1962.
[4] Jaworek, A. and Krupa, A.: Classification of the modes of EHD spraying. Journal
of Aerosol Science, Vol. 30, No. 7, pp.873-894, 1999.
[5] Law, C.K.: Recent advances in droplet vaporization and combustion, Prog. Energy
Combustion Science, Vol. 8, pp. 171-201, 1982.
[6] Elkotb, M.M., Aly, S.L., and Elsalmawy, H.A.: Evaporation characteristics of fuel
and multi-fuel droplets, Combustion and Flame, Vol. 85, pp. 300-308, 1991
[7] Harlow, F.H. and Welch, J.E.: Numerical calculation of time-dependent viscous
incompressible flow of fluid with free surface, The Physics of Fluids, Volume 8,
pp.1029-2332, December, 1965.
[8] Amsden, A.A. and Harlow, F.H.: A simplified MAC technique for incompressible
fluid flow calculation, Journal of Computational Physics, Volume 6, pp. 322-325,
1970.
[9] Hirt, C.W. and Nichols, B.D.: Volume of Fluid (VOF) method for the dynamics of
free boundaries., Journal of Computational Physics, Volume 39, pp. 201-225, 1981.
[10] Harlow, F.H., Shannon, J.P.: The splash of a liquid droplet, J. Appl. Phys. 38, 3855-
3866, 1967.
[11] Trapaga, G., Szekely, J.: Mathematical modeling of the isothermal impingement of
liquid droplets in spraying processes, Metall. Trans. B, 22B, 901, 1991.
176
[12] Bussmann, M, Mostaghimi, J., Chandra, S.: On a three-dimensional volume
tracking model of droplet impact, Physics of Fluids, Vol. 11, pp. 1406-1417, 1999.
[13] Pasandideh-Fard, M., Chandra, S., Mostaghimi, J.: a Three-dimensional model of
droplet impact and solidification, Int. J. Heat Mass Trans. 45, 2229-2242, 2002.
[14] Pasandideh-Fard, M., Aziz, S. D., Chandra, S. and Mostaghimi, J.: Cooling
effectiveness during the impact of cold water droplets on a hot steel plate:
simulations and experiments, International Journal of Heat and Fluid Flow, 22, pp.
201-210, 2001.
[15] Fukai, J., Zhao, Z., Poulikakos, D.: Modelling of the deformation of a liquid droplet
impinging upon a flat Surface, Physics of Fluids A 5, 2588-2599, 11, 1993.
[16] Chandra, S., Avedisian, C.T., On the collision of a droplet with a solid surface, Proc.
R. Soc. London A 432 (1991) 13–41.
[17] Chandra, S., Avedisian, C.T., Observations of droplet impingement on a ceramic
porous surface, Int. J. Heat Mass Transfer 35 (1992) 2377 – 2388.
[18] Aziz, S., Chandra, S., Impact, recoil and splashing of molten metal droplets, Int. J.
Heat Mass Transfer 43 (2000) 841–857.
[19] B.S. Kang, D.H. Lee, On the dynamic behavior of a liquid droplet impacting upon a
inclined heated surface, Expt. Fluids. 29 (2000) 380–387.
[20] Mundo, C., Sommerfeld, M. and Tropea, C.: Droplet-wall collisions: experimental
studies of the deformation and breakup process, Int. J. Multiphase Flow, 21, 151,
1995.
[21] Tamura, Z., Tanasawa, Y.: Evaporation and combustion of. a drop contacting with a
hot surface, Proc. Combust. Inst. 7, 509–522, 1959.
[22] Wachters, L.H.J., Westerling, N.A.J.: The heat transfer from a hot wall to impinging
water drops in a spheroidal state, Chem. Eng. Sci. 21, 1047–1056, 1966.
[23] Makino, K., Michiyoshi, I.: The behavior of a water droplet on heated surfaces, Int.
Journal of Heat Mass Transfer, Vol, pp.781-791, 1984.
[24] Karl, A., Frohn, A.: Experimental investigation of interaction processes between
droplets and hot walls, Physics of Fluids, 12, p785-796, 2000.
[25] Tseng, A.A., Lin, F.H., Gungeria, A.S., and Ni, D.S.: Roll cooling and its
relationship to roll life, Metallurgical Transactions, Vol. 20A, 1989.
177
[26] Horsky, J., Raudensky, M., Sauer, W.: Experimental study of cooling
characteristics in hot rolling, J. Mater. Proc., Tech., 45, pp. 131-135, 1994.
[27] Bariani, P. F., Dal Negro, T., Masiero, S.: Experimental evaluation and FE
simulation of thermal conditions at tool surface during cooling and deformation
phases in hot forging applications, Annals CIRP, 51/1/ 219-222, 2002.
[28] Bariani, P. F., Dal Negro, T. and Masiero, S: Influence of coolant spray conditions
on teat transfer at die surface in hot forging, Proc. 7th ICTP, Yokohama, Vol.1,
781-786, 2002.
[29] Liu, G.W., Morsi, Y.S., Clayton, B.R, Characterisation of the spray cooling heat
transfer involved in a high pressure die casting process, Int. J. Thermal Science 39,
582-591, 2000.
[30] Aoyama, S., Akase, M., Sakamoto, K., and Umemura, T.: Die lubricant deposit and
its effect on ejection in die casting, Trans. NADCA, 335-341, 1991.
[31] Altan, T., Chhabra, S., Chu, Y-L.: An investigation of cooling and lubrication of die
casting dies using a water/lubricant spraying, Die Casting Engineer, 24-27, 1993.
[32] Engel, O.G.: Waterdrop collisions with solid surfaces, J. Res. NBS 5, 281–298,
1955.
[33] Savic, P. and. Boult. G.T.: The fluid flow associated with the impact of liquid drops
with solid surfaces, National Research. Council of Canada, Report No. MT-26,
1955.
[34] Savic, P.: The cooling of a hot surface by drops boiling in contact with it. Report no.
MT-26, National Research Council of Canada , Ottawa, 1958.
[35] Inada, S., Miyasaka, Y., Mishida, K., and Chandratilleke, G.R.: Transient
temperature variation of a hot wall due to an impinging water drop: effect of
subcooling of the water drop, Proceedings of the Joint ASME/ JSME Thermal
Engineering Conference, Vol. 1, ASME, 173– 182, 1983.
[36] Toda, S.: A study of mist cooling - 2nd Report: Theory of mist cooling and its
fundamental experiments, Heat Transfer Japan, Res., 3, No.1, pp. 1–44, 1974.
[37] Akao, F., Araki, K., Mori, S., and Moriyama, A.: Deformation behaviors of a liquid
droplet impinging onto hot metal surface, Trans. Iron Steel Inst. Japan, 20, 737,
1980.

178
[38] Chandra, S., Avedisian, C.T.: On the collision of a droplet with a solid surface,
Proc. R. Soc. London A 432, 13–41, 1991.
[39] Manzello, S.L. and Yang, J.C.: Experimental study of high Weber number impact of
Methoxy-Nonafluorobutane C4F9OCH3 (HFE-7100) and n-heptane droplets on a
heated solid surface, Int. J. of Heat and Mass Transfer, Vol. 45, No.19, 3961-3971,
2002.
[40] Zhao, Z., Poulikakos, D. and Fukai, J.: Heat transfer and fluid dynamics during the
collision of a liquid droplet on a substrate: I-modeling," International Journal of
Heat and Mass Transfer, Vol. 39, pp. 2771-2789, 1996.
[41] Lass H.: Vector and Tensor Analysis, McGraw-Hill, New York, 1950.
[42] FLOW-3D Manual, Version 8.1, 2001.
[43] Yang, L., Liu, C., Shivpuri, R.: Comprehensive approach to film formation,
pollution and heat transfer in hot die lubrication, Proceedings of the ICTP, 2005.
[44] Boersma, W. H., Laven, J., and Stein, H. N., J., Computer simulations of shear
thickening of concentrated dispersions, Rheol. 39, 841, 1995.
[45] Bender, J. W., and Wagner, N. J., J, Optical measurement of the contributions of
colloidal forces to the rheology of concentrated suspensions, Colloid Interface Sci.
172, 171, 1995.
[46] King, M.D., Yang, J.C., Chien, W.S., Grosshandler, W.L., Evaporation of a small
water droplet containing an additive, Proceedings of the ASME National Heat
Transfer Conference, Baltimore, MD, 1997.
[47] Avedisian, C.T, Koplik, J., Leidenfrost boiling of methanol droplets on hot
porous/ceramic surfaces, Int. J. Heat Mass Transfer 30, 1587–1603, 1987.
[48] Downie, B., Polymeropoulos, C., Gogos, G., Interaction of a water mist with a
buoyant methane diffusion flame, Fire Safety J. 24, 359–381, 1995.
[49] Tamura, Z., Tanasawa, Y., Evaporation and combustion of a drop contacting with a
hot surface, Proc. Combust. Inst. 7, 509–522, 1959.
[50]. Gottfried, B.S., Lee, C.J., Bell, K.J., The Leidenfrost phenomenon: Film boiling
of liquid droplets on a flat plate, Int. J. Heat Mass Transfer 9, 1167-1187, 1966.
[51]. Buyevich, Y.A., Mankevich, V.N., Interaction of a dilute mist flow with a hot body,
Int., J., Heat Mass Transfer 38, 731-744, 1995.
179
[52]. Rein, M., The reflection of drops off hot surfaces, Math. Mech., 79(S3): S743-S744,
1999.
[53]. Harvie, J.E. and Fletcher, D.F., A hydrodynamic and thermodynamic simulation of
droplet impacts on hot surfaces, Part I: theoretical model, Int. J., Heat and Mass
Transfer, Vol. 44, pp.2633-2642, 2001.
[54]. Wagner, W., Pruss, A., The IAPWS formulation 1995 for the thermodynamic
properties of ordinary water substance for general and scientific use, J. Phys. Chem.
Ref. Data, 31, 2, 387-535, 2002.
[55]. Saul, A.; Wagner, W., A Fundamental equation for water covering the range from
the melting line to 1273 K at pressures up to 25000 MPa, J. Phys. Chem. Ref. Data,
18, 4, 1537-1564, 1989.
[56]. IAPWS, Revised Release on the IAPS Formulation 1985 for the Viscosity of
Ordinary Water Substance, International Association for the Properties of Water
and Steam, Erlangen, Germany, 15, 1997.
[57] Yang, L., Liu, C., Shivpuri, R.: Physiothermodynamics of lubricant deposition on
hot die surfaces, Annals of the CIRP, 54/1, 2005.
[58] Chandra, S. and Aziz, S.D., Leidenfrost evaporation of liquid nitrogen droplets”,
ASME Journal of Heat Transfer ,116, pp. 999-1006, 1994.
[59] Aoyama, S., Akase, M., Sakamoto, K., and Umemura, T., Die lubricant deposit and
its effect on ejection in die casting, Trans. NADCA, 335-341, 1991.
[60] Altan, T., Chhabra, S., Chu, Y-L, An investigation of cooling and lubrication of die
casting dies using a water/lubricant spraying, Die Casting Engineer, 24-27, 1993.
[61] Quiao, Y.M., Chandra, S., Experiments on adding a surfactant to water drops
boiling on a hot surface, Pro. R. Soc. Lond. A, 453, 673-689, 1997.
[62] Reiners, U., Jeschar, R., Scholz, R., Measuring method for quick determination of
local heat transfer coefficients in spray water cooling within the range of stable film
boiling, Steel Research 56,1985.
[63] Chang, C.C., Bramley, A.N., Determination of the heat transfer coefficient at the die
interface in forging, 7th ICTP, Yokohama, Vol.1, 775-780, 2002.
[64] J.D. Bernardin, C.J. Stebbins, I. Mudawar, Mapping of impact and heat transfer
regimes of water drops impinging on a polished surface, Int. J. Heat Mass Transfer
40 (1997) 247–267.
180
[65] M. Rein, Phenomena of liquid droplet impact, Fluid Dyn. Res. 12 (1993) 61–93.
[66] Y.S. Ko, S.H. Chung, An experiment on the breakup of impinging droplets on a hot
surface, Expt. Fluids 21 (1996) 118–123.
[67] L. Bolle, J.C. Moureau, Spray cooling of hot surfaces, in: J.D. Hewitt, N. Zuber
(Eds.), Multiphase Science and Technology, Hemisphere, New York, 1981, pp. 1–
92.
[68] Doege, E., Alasti, M., Schmidt-Jurgensen, R., Accurate friction and heat transfer
laws for enhanced simulation models for precision forging processes, J. Matl. Proc.
Tech., 150, 92-99, 2004.