Embed Size (px)
Citation preview

R04(Mgmt\StudentCensus\2006StudentCensusSystemOverview1)my.3457
lin
Susan Manning, Senior Manager and General Editor Issued by the Organizational Development Department, Research and Information Services
2006 STUDENT CENSUS, GRADES 7-12: SYSTEM OVERVIEW Maria Yau and Janet O’Reilly Project Co-ordinators 07/08 - 01 October 2007
Research Report
R04(Mgmt\StudentCensus\2006StudentCensusSystemOverview1)my.3457
2006 Student Census: System Overview Maria Yau and Janet O’Reilly Copyright © October 2007 Toronto District School Board
Reproduction of this document for use in schools of the Toronto District School Board is encouraged.
For any other purpose, permission must be requested and obtained in writing from: Toronto District School Board Organizational Development 1 Civic Centre Court, Lower Level Etobicoke, ON M9C 2B3
Tel.: 416-394-4929 Fax: 416-394-4946
Every reasonable precaution has been taken to trace the owners of copyrighted material and to make due acknowledgement. Any omission will gladly be rectified in future printings.

R04(Mgmt\StudentCensus\2006StudentCensusSystemOverview1)my.3457
i
TABLE OF CONTENTS INTRODUCTION ....................................................................................................Pg. 1 Background and Purpose.............................................................................Pg. 1 METHODOLOGY ...................................................................................................Pg. 3 Survey Design..............................................................................................Pg. 3 Survey Implementation ................................................................................Pg. 4 Data Confidentiality ......................................................................................Pg. 4 Data Processing and Verification .................................................................Pg. 5 Census Return Rates...................................................................................Pg. 5 OVERALL FINDINGS.............................................................................................Pg. 6 Scope of this Report.....................................................................................Pg. 6 Section A – Student Demographic Characteristics ...........................................Pg. 7 Gender .........................................................................................................Pg. 8 Student Place of Birth ..................................................................................Pg. 8 Parent Place of Birth ....................................................................................Pg. 9 Student Racial Background..........................................................................Pg. 10 Student Sexual Orientation ..........................................................................Pg. 11 Disabilities ....................................................................................................Pg. 12 Parental Presence at Home .........................................................................Pg. 13 Parent Educational Background...................................................................Pg. 14 Parent Employment Status...........................................................................Pg. 15 Family Socio-Economic Status (SES) ..........................................................Pg. 15
R04(Mgmt\StudentCensus\2006StudentCensusSystemOverview1)my.3457
ii
Section B – Student Experiences in School and Outside of School ................Pg. 17 School Climate .............................................................................................Pg. 18 Relationships with School Adults .................................................................Pg. 19 School and Community Safety .....................................................................Pg. 20 Inclusive School Experiences.......................................................................Pg. 22 Extra-curricular Activities..............................................................................Pg. 23 Extra-curricular Activities in School ...................................................Pg. 23 Extra-curricular Activities Outside of School......................................Pg. 24 Homework ....................................................................................................Pg. 26 Homework Hours...............................................................................Pg. 26 Homework Support after School........................................................Pg. 26 Challenges Related to Homework .....................................................Pg. 27 After-school Activities...................................................................................Pg. 29 Computer use....................................................................................Pg. 30 Home Support ..............................................................................................Pg. 31 Eating Habits .....................................................................................Pg. 33 Eyesight and Hearing Tests ..............................................................Pg. 33 Student Self-evaluation and Accomplishments ............................................Pg. 34 Leadership and Helping Roles in School...........................................Pg. 35 School Awards ..................................................................................Pg. 36 Outside Awards .................................................................................Pg. 37 Post-secondary Plans and Expectations......................................................Pg. 38 Future Career or Occupation.............................................................Pg. 39

R04(Mgmt\StudentCensus\2006StudentCensusSystemOverview1)my.3457
iii
NEXT RESEARCH STEPS ....................................................................................Pg. 41 TABLES Table 1: 2006 Student Census Return Rate by Age ....................................Pg. 5 Table 2: Detailed Racial Breakdown ............................................................Pg. 11 Table 3: Sexual Orientation Breakdown.......................................................Pg. 11 Table 4: Detailed Family Structure ...............................................................Pg. 14 Table 5: Mothers Who Are Not Employed....................................................Pg. 15 Table 6: Discussing Personal Problems with School Adults.........................Pg. 19 Table 7: Reasons for School Rules Not Being Fairly Applied.......................Pg. 20 Table 8: Reasons for Being Bullied ..............................................................Pg. 21 Table 9: Part-time Work ...............................................................................Pg. 28 FIGURES Figure 1: Gender Distribution of Grade 7-8 and Grade 9-12 Students ....................................................................Pg. 8 Figure 2: Region of Birth for Grade 7-8 Students .........................................Pg. 8 Figure 3: Region of Birth for Grade 9-12 Students .......................................Pg. 9 Figure 4: Parents’ Place of Birth...................................................................Pg. 9 Figure 5: Racial Distribution of Grade 9-12 Students ...................................Pg. 10 Figure 6: Racial Distribution of Grade 7-8 Students .....................................Pg. 10 Figure 7: Parental Presence among Grade 7-8 Students ............................Pg. 13 Figure 8: Parental Presence among Grade 9-12 Students ..........................Pg. 13 Figure 9: Parents’ Education Level ..............................................................Pg. 14
R04(Mgmt\StudentCensus\2006StudentCensusSystemOverview1)my.3457
iv
Figure 10: Parents’ Employment Status.......................................................Pg. 15 Figure 11: Family Socio-Economic Status....................................................Pg. 16 Figure 12: School Climate............................................................................Pg. 18 Figure 13: How Students are being Treated by School Adults .....................Pg. 19 Figure 14: Students’ Relationships with School Adults ................................Pg. 19 Figure 15: Students’ Perception of School and Community Safety ..............Pg. 20 Figure 16: Students’ Perception of School Rules .........................................Pg. 20 Figure 17: Bullying Experiences...................................................................Pg. 21 Figure 18: Inclusive School Experiences .....................................................Pg. 22 Figure 19: Participation in School Extra-curricular Activities ........................Pg. 23 Figure 20: Extra-curricular Activities in School among Grade 7-8 Students ....................................................................Pg. 23 Figure 21: Extra-curricular Activities in School among Grade 9-12 Students ..................................................................Pg. 24 Figure 22: Overall Participation in Outside of school Extra-curricular Activities ....................................................................................Pg. 24 Figure 23: Extra-curricular Activities Outside of school among Grade 7-8 Students ....................................................................Pg. 25 Figure 24: Extra-curricular Activities Outside of school among Grade 9-12 Students ..................................................................Pg. 25 Figure 25: Homework Help after School ......................................................Pg. 26 Figure 26: Factors Preventing Grade 7-8 Students from Finishing Homework ..................................................................................Pg. 27 Figure 27: Factors Preventing Grade 9-12 Students from Finishing Homework ..................................................................................Pg. 28 Figure 28: After-school Activities among Grade 7-8 Students......................Pg. 29 Figure 29: After-school Activities among Grade 9-12 Students....................Pg. 29

R04(Mgmt\StudentCensus\2006StudentCensusSystemOverview1)my.3457
v
Figure 30: Computer Use.............................................................................Pg. 30 Figure 31: Advice from Home about Schooling ............................................Pg. 31 Figure 32: Parents/Caregivers’ Involvement among Grade 7-8 Students ....Pg. 31 Figure 33: Parents/Caregivers’ Involvement among Grade 9-12 Students ..Pg. 32 Figure 34: People with Whom Students Felt Comfortable Discussing Their Personal Problems ............................................................Pg. 32 Figure 35: Eating Habits...............................................................................Pg. 33 Figure 36: Eyesight and Hearing Tests among Grade 7-8 Students ............Pg. 33 Figure 37: Self-evaluation of School Progress and Skills among Grade 7-8 Students ....................................................................Pg. 34 Figure 38: Self-evaluation of School Progress and Skills among Grade 9-12 Students ..................................................................Pg. 34 Figure 39: Students Being Selected to Lead in School ................................Pg. 35 Figure 40: Helping Roles Students Participated in School ...........................Pg. 35 Figure 41: Awards, Certificates, or Recognition Received in School............Pg. 36 Figure 42: Awards, Certificates, or Recognition Outside of school...............Pg. 37 Figure 43: Expectations to Complete High School .......................................Pg. 38 Figure 44: Parent Post-Secondary School Expectations vs. Student Own Plans among Grade 7-8 Students ......................................Pg. 38 Figure 45: Parent Post-Secondary School Expectations vs. Student Own Plans among Grade 9-12 Students ....................................Pg. 39 Figure 46: Future Career or Occupation .....................................................Pg. 39 Figure 47: Career Advice .............................................................................Pg. 40

R04(Mgmt\StudentCensus\2006StudentCensusSystemOverview1)my.3457
vi
APPENDICES Appendix A: Student Census Surveys Forms A and B.................................Pg. 43 Appendix B: Board Mandates and Recommendations.................................Pg. 61 Appendix C: Teacher’s Instructions..............................................................Pg. 65 Appendix D: Glossary of Terms ...................................................................Pg. 69 Appendix E: Data Verification Process.........................................................Pg. 73 Appendix F: Student Responses to All Census Questions...........................Pg. 77

R04(Mgmt\StudentCensus\2006StudentCensusSystemOverview1)my.3457 1
INTRODUCTION Background In late fall 2004; the Board passed the following motion:
That staff in consultation with the Ontario Human Rights Commission and educational
experts develop research proposals that identify the factors within the school system which
may inhibit student achievement. Such factors should include, but not be limited to,
differences in gender, race, ethnicity, mother tongue, income and place of residence.1
In response, two Committees were formed in early 2005.
1. An Advisory Committee on Student Achievement was established by the Chair of the
Board to provide staff with input into the development of the research proposals.
2. A Staff Committee was set up to act as a workgroup on behalf of the Advisory
Committee. This committee prepared relevant background information, a summary of
findings from various sources on demographic data collection, a variety of options
related to how demographic information could be collected in the TDSB, a legal
explanation of privacy and human rights legislative requirements, and a
communication/consultation plan.
With the information provided by the Staff Committee, a broad consultation process took place
to solicit feedback on different options for the collection of demographic information, to draft
demographic questions that could be asked, and to invite comment on questions surrounding
the initiative. Meetings and focus/discussion groups were held with central staff representatives,
elementary and secondary principals, senior staff, and system-wide parent group
representatives.
In November of the following year (2005), the Advisory Committee made recommendations2 to
the Board including:
• The TDSB collect student demographic and social environment data to assist the Board
in developing policies and strategies to close the achievement gap between groups of
students, as well as to establish a baseline of data to measure improvements in the
educational outcomes for all students;
1 See Appendix B for other related motions passed on November 17, 2004. 2 For other recommendations, refer to Appendix B.

R04(Mgmt\StudentCensus\2006StudentCensusSystemOverview1)my.3457 2
• The demographic and social environment data and its correlation with student
achievement data, and other relevant student information be used by the TDSB for the
following purposes:
o Developing programs and services for students who need specific interventions and
support; o Assessing the effectiveness of programs established to address specific student
needs; o Allocating resources to support students in need; and o Identifying systemic barriers to student achievement and implementing changes to
remove those barriers.
Purpose The purpose of this report is to provide the system overview of results based on the response
received from over 105,000 students in Grades 7-12.

R04(Mgmt\StudentCensus\2006StudentCensusSystemOverview1)my.3457 3
METHODOLOGY Survey Design
Based on the mandate of the Board and the recommendations made by the Advisory
Committee, the Staff Committee developed a survey consisting of two main areas of focus:
1. Questions on student demographic characteristics, and
2. Contextual questions about students’ perceptions of their experiences in school and outside of school.
The contextual questions provide the Board with an understanding of the circumstances which
might enhance or limit student achievement. Combined with the demographic data, the Board
will be able to determine whether or not certain factors have a greater impact on some groups of
students relative to others.
In consultation with different stakeholder groups (e.g., senior staff, teacher federations,
principals’ associations, support staff unions, parents, and community representatives), nearly
150 contextual survey items covering 10 different themes were developed. In order to ensure
the survey was comprehensive, while limiting the time demanded of individual respondents (i.e.,
not too long for students to complete within one class period), a matrix-sampling method3 was
employed. Using this method, two forms (Forms A and B) were designed (see Appendix A for
samples of the survey). The section on demographics for both forms was identical, but each
form had its own set of contextual questions with a few common items. Every second student
was randomly assigned to complete one of the two forms. In this way, alternate students within
the same class would complete Form A, while the other half would complete Form B.
In June 2006, Research and Information Services field-tested4 the matrix-sampling forms with
365 students from 16 classes in 10 schools representing different parts of the city. The focus of
this field test was to determine:
• if there were any questions that were unclear or difficult to answer because of the
options provided/not provided;
• if there were any questions that made students feel uncomfortable;
• if the survey length was appropriate and could be easily completed during one class
period.
Based on student feedback, a few wording changes were made. 3 See Appendix D: Glossary of Terms for details. 4 See Appendix D: Glossary of Terms for details.

R04(Mgmt\StudentCensus\2006StudentCensusSystemOverview1)my.3457 4
Survey Implementation Well before the actual administration of the survey, a series of communications and
implementation supports were provided. These included a message from the Director to
students, parents, teachers and principals, a student-friendly brochure and poster about Student
Census Week, and a Teacher’s Guide to the Student Census. A section of the TDSB’s website
was also devoted to providing information about the Student Census. Prior to the Student
Census Week, principals received detailed instructions on form distribution and collection, while
teachers received the Teacher’s Guide on how to administer the survey in their classrooms.
(See Appendix C on details about the Teacher’s Guide)
During the Census Week (November 6-10, 2006), all TDSB secondary schools plus all
elementary schools with Grades 7-8 conducted the Census. A total of 289 Toronto schools
were involved.
Data Confidentiality This Census was a confidential but not anonymous5 survey. Student identification numbers
were used so that the Census data could be linked to other centrally available data sources -
such as the TDSB Student Information System, EQAO, and student report cards - for cross-
checking and tracking purposes. To ensure confidentiality for students, teachers were
instructed to tell students to use one of the black markers provided to black out their name on
the front page prior to placing their completed Census into the return box at the front of the room.
When all students had placed their completed form in the box, teachers were instructed to close
the box and return it to the school office for delivery to the Research and Information Services
department. The forms were shipped directly to the Board’s Research and Information Services
department for scanning and storage. The large volume of forms are stored securely by the
department and will be shredded after all the key reports are published. The Census database
will continue to be kept confidential and used by the research department for research purposes
only. No individuals or schools outside the department will have access to the data with any
personally identifiable information.
5 See Appendix D: Glossary of Terms for details.
R04(Mgmt\StudentCensus\2006StudentCensusSystemOverview1)my.3457 5
Data Processing and Verification When the surveys were returned to the Board’s research unit in late November and early
December (2006), the forms were collated and prepared for scanning using the Teleform
software. Due to the large volume of multiple-page forms to be handled and the large amount
of open-ended responses to be verified, the scanning took over seven months to complete. To
ensure that the data were accurate, valid and reliable for analysis, multiple levels of data
verification procedures were administered by the research team over a period of two months.
(See Appendix E for details about the verification process)
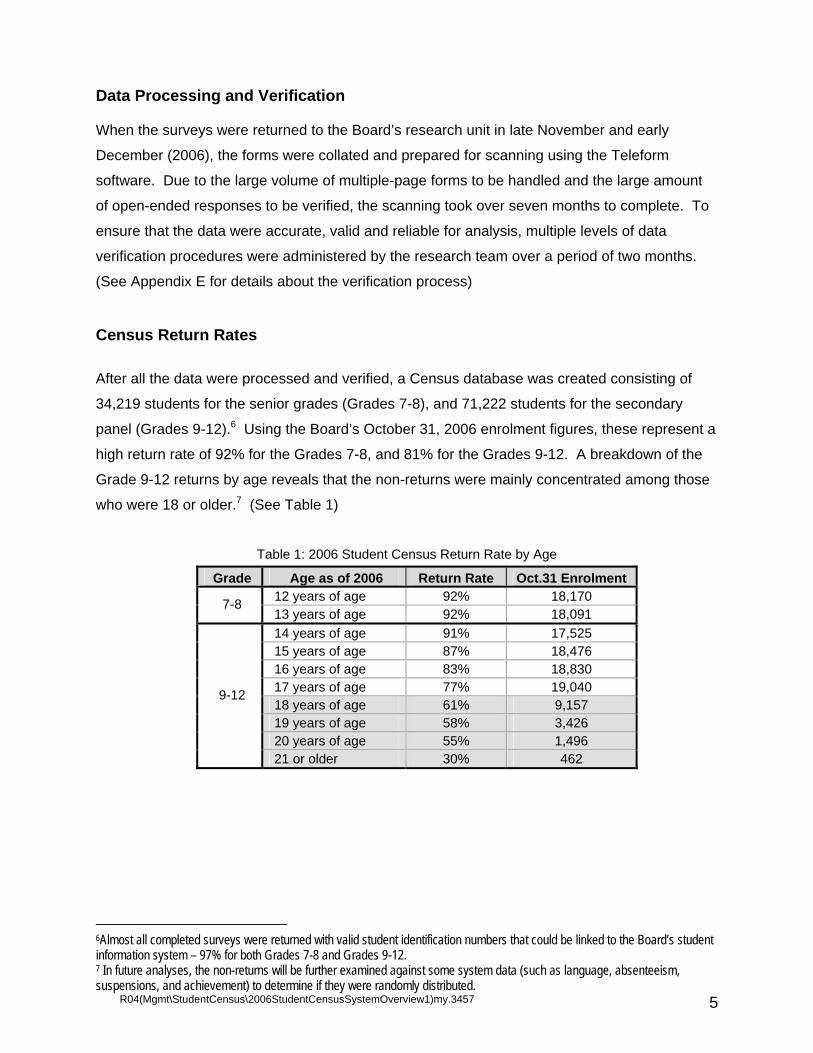
Census Return Rates After all the data were processed and verified, a Census database was created consisting of
34,219 students for the senior grades (Grades 7-8), and 71,222 students for the secondary
panel (Grades 9-12).6 Using the Board’s October 31, 2006 enrolment figures, these represent a
high return rate of 92% for the Grades 7-8, and 81% for the Grades 9-12. A breakdown of the
Grade 9-12 returns by age reveals that the non-returns were mainly concentrated among those
who were 18 or older.7 (See Table 1)
Table 1: 2006 Student Census Return Rate by Age
Grade Age as of 2006 Return Rate Oct.31 Enrolment 12 years of age 92% 18,170 7-8 13 years of age 92% 18,091 14 years of age 91% 17,525 15 years of age 87% 18,476 16 years of age 83% 18,830 17 years of age 77% 19,040 18 years of age 61% 9,157 19 years of age 58% 3,426 20 years of age 55% 1,496
9-12
21 or older 30% 462
6Almost all completed surveys were returned with valid student identification numbers that could be linked to the Board’s student information system – 97% for both Grades 7-8 and Grades 9-12. 7 In future analyses, the non-returns will be further examined against some system data (such as language, absenteeism, suspensions, and achievement) to determine if they were randomly distributed.

R04(Mgmt\StudentCensus\2006StudentCensusSystemOverview1)my.3457 6
OVERALL FINDINGS Scope of this Report The overall survey findings of this first TDSB Student Census are presented under two main
sections.
• Section A: Student Demographic Characteristics
• Section B: Student Experiences in School and Outside-of-school
The focus of this report is to show how the Grade 7-8 and the Grade 9-12 students responded
to each of the questions and items in the Census. The intent is to provide:
• a snapshot of who attended our senior grades and secondary schools – i.e., their
demographic profiles in terms of gender, place of birth, racial background, sexual
orientation, disability, family structure, parent education and employment, and socio-
economic status;
• an overview of how our senior and secondary school students in general perceived their
schooling and out-of-school experiences in 10 areas – school climate, relationships with
school adults, school safety, equity in education, extra-curricular activities, homework,
after-school activities, home support and involvement, self-evaluation and achievements,
and post-secondary plans and aspirations.

R04(Mgmt\StudentCensus\2006StudentCensusSystemOverview1)my.3457 7
Section A – Student Demographic Characteristics
1. Gender 2. Student Place of Birth 3. Parent Place of Birth 4. Student Racial Background 5. Student Sexual Orientation 6. Disabilities 7. Parental Presence at Home 8. Parent Educational Background 9. Parent Employment Status 10. Family Socio-Economic Status (SES)

R04(Mgmt\StudentCensus\2006StudentCensusSystemOverview1)my.3457 8
1) Gender In the TDSB, both the senior grades (Grades 7 and 8) and secondary schools have a slightly
higher enrolment of male than female students (52% versus 48%). This finding corroborates
with that derived from the Board’s Student Information System, and this gender split pattern has
been consistent throughout the history of the Toronto public school system. (See Figure 1)
Figure 1: Gender Distribution of Grade 7-8 and Grade 9-12 Students
Gender Distribution of Grade 7-8 and Grade 9-12 Students (Fall 2006)
Female, 48%Male, 52%
2) Student Place of Birth The majority (70%) of Grade 7-8 students in the TDSB are born in Canada. The remaining
students immigrated from over 200 countries from different continents. The two regions in
which most foreign-born students originated are East Asia (8%) and South Asia (8%). Other
regions of birth include Europe (4%), Africa (2%), and the Caribbean (2%).
(See Figure 2)8 Figure 2: Region of Birth for Grade 7-8 Students
Region of Birth for Grade 7-8 Students (Fall 2006)
Canada, 70%
Others, 4%
Europe, 4%
Caribbean, 2%
Central/South America, 2%
East Asia, 8%
Africa, 2%
South Asia, 8%
8 These figures were based on statistics extracted from the TDSB’s Student Information System (SIS) for 97% of the Grade 7-8s who participated in the Census and whose ID numbers could be linked to the SIS.
R04(Mgmt\StudentCensus\2006StudentCensusSystemOverview1)my.3457 9
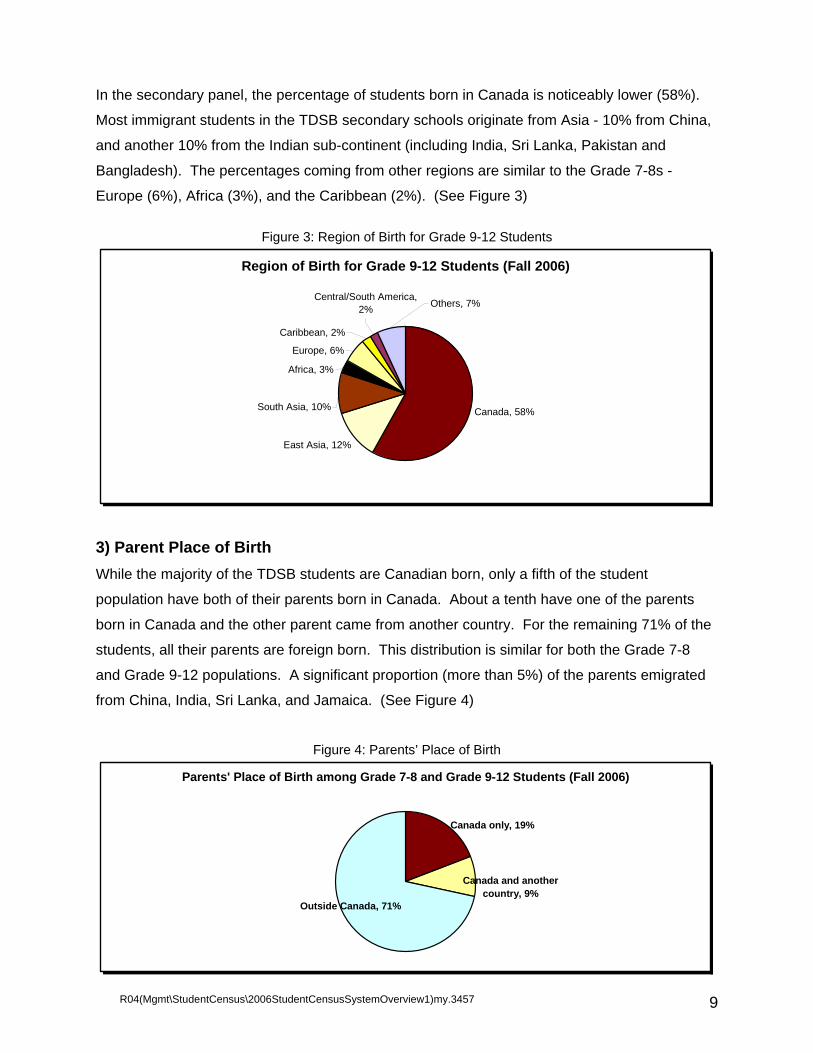
In the secondary panel, the percentage of students born in Canada is noticeably lower (58%).
Most immigrant students in the TDSB secondary schools originate from Asia - 10% from China,
and another 10% from the Indian sub-continent (including India, Sri Lanka, Pakistan and
Bangladesh). The percentages coming from other regions are similar to the Grade 7-8s -
Europe (6%), Africa (3%), and the Caribbean (2%). (See Figure 3)
Figure 3: Region of Birth for Grade 9-12 Students
Region of Birth for Grade 9-12 Students (Fall 2006)
Canada, 58%South Asia, 10%
Africa, 3%
East Asia, 12%
Central/South America, 2%
Caribbean, 2%
Europe, 6%
Others, 7%
3) Parent Place of Birth While the majority of the TDSB students are Canadian born, only a fifth of the student
population have both of their parents born in Canada. About a tenth have one of the parents
born in Canada and the other parent came from another country. For the remaining 71% of the
students, all their parents are foreign born. This distribution is similar for both the Grade 7-8
and Grade 9-12 populations. A significant proportion (more than 5%) of the parents emigrated
from China, India, Sri Lanka, and Jamaica. (See Figure 4)
Figure 4: Parents’ Place of Birth
Parents' Place of Birth among Grade 7-8 and Grade 9-12 Students (Fall 2006)
Outside Canada, 71%
Canada and another country, 9%
Canada only, 19%

R04(Mgmt\StudentCensus\2006StudentCensusSystemOverview1)my.3457 10
4) Student Racial Background The Census asked students to identify their racial/ethnic background. Almost all students
answered this set of related questions, with only 1% of the respondents who either skipped the
questions or did not answer them properly. Figure 5 illustrates the overall racial distribution of
secondary school students in Toronto. While White students are the largest racial group (a
third), there is no single majority race group among the TDSB student population. The three
other larger racial representations are East Asian (20%), South Asian (19%), and Black (12%).
The remaining includes students who are of Middle Eastern, Southeast Asian, Latin American,
Aboriginal9 and Mixed backgrounds.
Figure 5: Racial Distribution of Grade 9-12 Students
Racial Distribution of Grade 9-12 Students (Fall 2006)
White, 33%
South Asian, 19%
Black, 12%
East Asian, 20%
Southeast Asian, 3%
Middle Eastern, 5%Mixed, 5%
Aboriginal, 0.3%Latin American, 2%
The racial composition for the Grade 7-8s is very similar to that of the secondary, with only a
slight proportionate difference for some of the groups. (See Figure 6)
Figure 6: Racial Distribution of Grade 7-8 Students
Racial Distribution of Grade 7-8 Students (Fall 2006)
White, 31%
East Asian, 16%
Black, 15%
South Asian, 21%
Southeast Asian, 4%
Middle Eastern, 5%Mixed, 6%
Aboriginal, 0.3%Latin American, 2%
9 Many students who identified themselves as Aboriginal also classified themselves as “Mixed” in the question on racial identity. In many instances, they were mixed with those identifying themselves as White Canadian.

R04(Mgmt\StudentCensus\2006StudentCensusSystemOverview1)my.3457 11
Table 2 gives a further breakdown of students’ racial origins for both Grade 7-8 and Grade 9-12
students. Table 2: Detailed Racial Breakdown
Detailed Racial Breakdown Grade 7-8 Grade 9-12 White Canadian 21% 19% White European 10% 14% East Asian 16% 20% Southeast Asian 4% 3% South Asian 18% 16% Indo Caribbean 3% 3% Black Africa 4% 4% Black Canadian 5% 2% Black Caribbean 6% 6% Latin American 2% 2% Middle Eastern 5% 5% Mixed Background 6% 5% Aboriginal 0.3% 0.3% Other10 0.1% 0.1%
5) Student Sexual Orientation Secondary school students were asked to identify their sexual orientation based on a multiple-
choice question. Of the 96% of respondents who answered this question, 92% identified
themselves as heterosexual, 4% indicated “not sure” of and/or “questioning” their sexual identity,
1% reported being gay or lesbian, and 2% bisexual. (See Table 3) These results are similar to
those obtained by the Statistics Canada’s 2003 Canadian Community Health Survey, which
reported 1% of Canadians aged 18 to 59 identifying as homosexual and about 1% identifying as
bisexual.
Table 3: Sexual Orientation Breakdown
Sexual Orientation Breakdown Grade 9-12 Heterosexual (straight) 92% Not sure/Questioning 4% Bisexual 2% Gay/Lesbian 1% Others (e.g., Queer, Two-spirited, Transgender, Transexual, or a combination of any of the above) 1%
10 These students included mainly those who did not identify their background, refused to identify themselves, were unsure or did not know about their racial background.

R04(Mgmt\StudentCensus\2006StudentCensusSystemOverview1)my.3457 12
6) Disabilities Students were asked if they had a disability which had been assessed by a doctor or by school.
Six percent of the high school and eight percent of the senior school respondents checked off at
least one kind of disability. For both groups of students, disabilities related to learning (5% for
the Grade 7-8, and 3% for Grade 9-12) and sight (3% for the former and 2% for the latter) are
the two areas cited by a higher number of students. These figures are indeed comparable to or
slightly higher than those collected by Statistics Canada in its various related surveys in recent
years.11 For the other types of disabilities listed -such as hearing, speech, mobility, and mental
health, each was checked off by less than 1% of the respondents. (Note that students from
special education schools for physically or developmentally challenged were not included in this
Census collection, as these students would have difficulty completing the survey on their own.)
11 For instance, according to Statistics Canada’s 2001 Census, between 3 and 4 percent who were aged 0-24 were being identified as having disabilities, and 2.6% who were aged 5 to 14 were reported to have disabilities related to learning. And according to its National Longitudinal Survey of Children and Youth (NLSCY), of children aged 6 to 15, 6.2% had a learning disability. On the 2001 Participation and Activity Limitation Survey (PALS), 1.2% of the young people aged 16 to 21 said that they had a learning disability.
R04(Mgmt\StudentCensus\2006StudentCensusSystemOverview1)my.3457 13
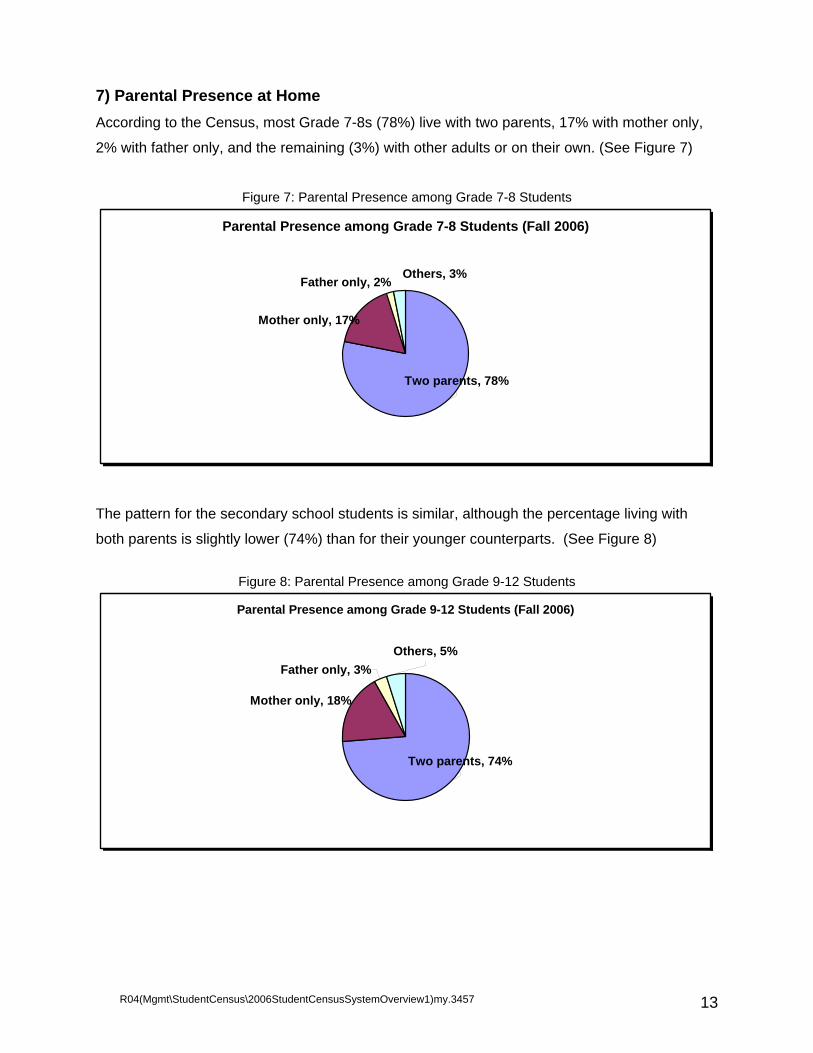
7) Parental Presence at Home According to the Census, most Grade 7-8s (78%) live with two parents, 17% with mother only,
2% with father only, and the remaining (3%) with other adults or on their own. (See Figure 7)
Figure 7: Parental Presence among Grade 7-8 Students
Parental Presence among Grade 7-8 Students (Fall 2006)
Two parents, 78%
Others, 3%Father only, 2%
Mother only, 17%
The pattern for the secondary school students is similar, although the percentage living with
both parents is slightly lower (74%) than for their younger counterparts. (See Figure 8)
Figure 8: Parental Presence among Grade 9-12 Students
Parental Presence among Grade 9-12 Students (Fall 2006)
Two parents, 74%
Others, 5%Father only, 3%
Mother only, 18%

R04(Mgmt\StudentCensus\2006StudentCensusSystemOverview1)my.3457 14
It should be noted that students living with two parents include 10% who live with each of the
parents half of the time, and those living with their step-parents. Table 4 gives the detailed
breakdown of the student family structure.
Table 4: Detailed Family Structure Detailed Family Structure Grade 7-8 Grade 9-12
Those living with two parents: • Father and Mother together 68% 65% • Mother and Step-father 4% 4% • Father and Step-mother 1% 1% • Half of the time with each 5% 3% Those living with single parent: • Mother only 17% 19% • Father only 2% 3% Others: • Adult relatives/guardians 2% 3% • On their own 0.1% 1% • Group home, foster parents,
with friends or others
1% 1%
8) Parent Educational Background In the Census, students were asked to indicate their parents’ educational level. About a quarter
of the secondary school students and nearly 40% of the Grade 7-8s answered “don’t know”.
(See Figure 9)12 For the rest of the students, most report that their parents have university
degrees. The percentage is higher for fathers than for mothers. In contrast, proportionately
more mothers than fathers have completed up to high school or college level.
Figure 9: Parents’ Education Level
Parents' Education Level among Senior and Secondary School Students (Fall 2006)
47%
37%
40%
34%
14%
18%
11%
14%
16%
21%
10%
12%
23%
24%
39%
39%
0% 50% 100%
Father (Gr.9-12)
Mother (Gr.9-12)
Father (Gr.7-8)
Mother (Gr.7-8)
University College High School Don't know
12 The calculation of these figures counted only those who lived with both or one of the parents related to the question concerned. Therefore, students who did not live with their fathers, for example, were not included in the calculation of the distribution of father’s educational level.

R04(Mgmt\StudentCensus\2006StudentCensusSystemOverview1)my.3457 15
9) Parent Employment Status According to the Census, parents, especially fathers, of most students work full-time. Figure 10
shows separately the mother and father employment status for the Grade 7-8s and Grade 9-12s
in Toronto. Figure 10: Parents’ Employment Status
Parents' Employment Status among Senior and Secondary School Students (Fall 2006)
81%
57%
74%
49%
6%
14%
10%
18%
7%
23%
5%
22%
6%
6%
11%
11%
0% 50% 100%
Father (Gr.9-12)
Mother (Gr.9-12)
Father (Gr.7-8)
Mother (Gr.7-8)
Full time Part time Not employed Don't Know
It should be noted that 6% of the secondary school students and 11% of the Grade 7-8s are not
sure of their parents’ employment status. And for mothers who are unemployed, most are stay-
at-home parents. (See Table 5)
Table 5: Mothers Who Are Not Employed
Mothers who are not employed Grade 7-8 Grade 9-12 Unemployed 3% 5% Stay-at-home parent 18% 17% Retired 1% 1% Fathers who are not employed Grade 7-8 Grade 9-12 Unemployed 2% 3% Stay-at-home parent 2% 2% Retired 1% 2%
10) Family Socio-Economic Status (SES) In addition to indicating their parents’ employment status, students were asked to specify their
parents’ occupations by writing in their parents’ or caregivers’ jobs. The purpose is to derive
their family socio-economic background. After the data were entered into the research unit’s
database, each job description was coded using Statistics Canada’s National Occupational
Classification for Statistics (NOC-S). To ensure coding accuracy and reliability, each unique job
description was coded independently by two individual coders. Inter-rater reliability was

R04(Mgmt\StudentCensus\2006StudentCensusSystemOverview1)my.3457 16
calculated; any disagreed, undetermined, or questionable codes were reviewed by more senior
research staff who would assign the final codes.
The occupational codes were then classified according to Pineo-Porter-McRoberts’ 16-category
scale. For the final analysis, the 16 categories were further grouped into 5 major SES levels13 –
(1) professional and senior management, (2) semi-professional and middle management, (3)
skilled/semi-skilled clerical and trades, (4) unskilled clerical and trades, and (5) non-
remunerative (e.g., homemaker, unemployed, retired, etc.). For two-parent families, both
parents’ SES codes were considered and the higher one was used to denote the family’s socio-
economic level.
After conducting several rounds of coding, cleaning and categorization of data on parent/
caregiver occupations, the research unit was able to derive the family SES information from
about 70% of the student respondents (73% of Grade 7-8s and 70% of Grade 9-12s). As
illustrated in Figure 11, over half of the TDSB senior and secondary school students are
represented by the two higher SES groups – professional and senior management, and semi-
professional and middle management, about a quarter by the lower middle category (skilled
/semi-skilled clerical and trades), and less than 20% by the two low SES groups (unskilled
clerical and trades, and non-remunerative). It should be noted that the proportion represented
by the professional and senior management category is slightly higher for the older students
than for their younger counterparts (29% versus 25%).
Figure 11: Family Socio-Economic Status
Family Socio-economic Status (Fall 2006)
29%
25%
24% 12%
14%
3%
4%
32%
29% 28%
0% 50% 100%
Grade 9-12
Grade 7-8
Professional/Senior Management Semi-Professional/Middle ManagementSkilled/Semi-skilled Clerical/Trades Unskilled Clerical/TradesNon-Remunerative
13 Examples of occupations for each category are shown in Appendix D.

R04(Mgmt\StudentCensus\2006StudentCensusSystemOverview1)my.3457 17
Section B – Student Experiences in School and Outside of School
1. School Climate 2. Relationships with School Adults 3. School and Community Safety 4. Inclusive School Experiences 5. Extra-curricular Activities 6. Homework 7. After-school Activities 8. Home Support 9. Student Self-evaluation and Accomplishments 10. Post-secondary Plans and Expectations

R04(Mgmt\StudentCensus\2006StudentCensusSystemOverview1)my.3457 18
1) School Climate Students were asked how they felt about their school by responding to a set of school climate
questions. The responses of the Grade 7-8s and the Grade 9-12s were similar in terms of their
relationships with other students and feeling welcome in taking part in school activities. But the
Grade 7-8s seemed more positive than their high school counterparts in items related to extra
help and extra-curricular activities available at school, enjoying school, their comfort level in
class participation, and their school building. (See Figure 12) Figure 12: School Climate
School Climate According to Student Perception(Fall 2006)
45%
81%
64%
55%
63%
62%
86%
44%
53%
60%
71%
75%
77%
81%
71%
59%
69%
72%
85%
63%
64%
68%
77%
85%
76%
81%
0% 50% 100%
This school offers specialized courses that I need (% yes)
This school offers courses that I need (% yes)
This school offers extra-curricular activities I'm interested in (%yes)
I feel comfortable speaking up in class to give my opinion
I feel comfortable answering questions in class
I feel comfortable participating in class activities anddiscussions
I feel welcome in all school activities that I'd like to take part in
My school building is an attractive and great place to learn
I enjoy school
My school is a friendly and welcoming place
I feel accepted by adults in my school
Extra help is available at this school when I need it
I feel accepted by students in my school
I get along well with other students in my school
Percent responding "all the time" or "often"
Grade 9-12 Grade 7-8
Grade 9-12 students were further asked if their school offered them courses that they needed.
Regarding general courses, most (81%) answered “yes”; but for specialized courses, 45%
answered “yes” and a third (34%) were not sure.

R04(Mgmt\StudentCensus\2006StudentCensusSystemOverview1)my.3457 19
2) Relationships with School Adults Most Grade 7-8 and Grade 9-12 students reported that they were treated the “same as
everyone else” by adults in their schools. (See Figure 13) Figure 13: How Students are being Treated by School Adults
How Students are being Treated by School Adults (Fall 2006)
82%
84%
8%
7%9%
10%
0% 50% 100%
Grade 9-12
Grade 7-8
Same as everyone else Better than others Worse than others
When specific questions were asked about their teachers (for example, the ways their teachers
teach, support, and encourage them), the Grade 7-8s were more positive than the high
schoolers. (See Figure 14)
Figure 14: Students’ Relationships with School Adults
Students' Relationships with School Adults (Fall 2006)
37%
60%
61%
88%
85%
48%
77%
79%
93%
92%
0% 50% 100%
I feel comfortable discussing aproblem with my teachers
I feel supported andencouraged by my teachers
I am satisfied with the waysmy teachers teach me
My school's staff respect mybackground
My teachers expect me tosucceed in school
Percent indicating 'all' or 'most' teachers
Grade 9-12 Grade 7-8
When asked how often they felt comfortable discussing personal problems with their school’s
staff, few answered “all the time” or “often”. In fact, a large percentage, especially the high
schoolers, indicated that they “rarely” or “never” felt comfortable to do so. (See Table 6)
Table 6: Discussing Personal Problems with School Adults Rarely/never felt comfortable
discussing personal problems with Grade 7-8 Grade 9-12
Teachers 45% 56% Guidance counsellors 54% 56% Principals or vice-principals 60% 72%

R04(Mgmt\StudentCensus\2006StudentCensusSystemOverview1)my.3457 20
3) School and Community Safety Both Grade 7-8 and Grade 9-12 students had a similar perception of safety in school and in the
surrounding areas. Both groups felt most safe in the classroom, followed by other parts of the
school buildings. The majority (about 70%) also felt safe outdoors – either in school yards or in
the neighbourhood. (See Figure 15) Figure 15: Students’ Perception of School and Community Safety
Student Perception of School and Community Safety (Fall 2006)
81%
73%
69%
77%
89%
73%
70%
72%
77%
91%
0% 50% 100%
When communicating onthe internet
In the neighbourhood
Outside on school property
In other parts of the schoolbuilding
In the classroom
Percent responding feeling safe"all the time" or "often"
Grade 9-12 Grade 7-8
Regarding school rules, about two thirds of both the senior and the secondary school students
reported that school rules had been fairly applied to them “all the time” or “most of the time”.
(See Figure 16) Figure 16: Students’ Perception of School Rules
School Rules Being Fairly Applied to Them (Fall 2006)
36%
44%
20%
16%
10%
9%
8%
8%23%
26%
0% 50% 100%
Grade 9-12
Grade 7-8
All the time Most of the time Sometimes Rarely Unsure
For those who indicated that the school rules had not been fairly applied to them “all the time”
(not including “unsure”), their frequently cited reasons were their school marks/grades,
racial/cultural background, body image, and gender. (See Table 7)
Table 7: Reasons for School Rules Not Being Fairly Applied Reasons for school rules not
being fairly applied “all the time” Grade 7-8 Grade 9-12
Grades or marks 17% 17% Cultural or racial background 7% 12% Body image 8% 9% Gender 6% 6%

R04(Mgmt\StudentCensus\2006StudentCensusSystemOverview1)my.3457 21
Students were asked if they themselves had been bullied in school. Figure 17 shows the
different types of bullying behaviours and the corresponding percentages of students who
reported being bullied “all the time/often” or “sometimes”. Insults or name-calling was the more
frequently reported type, and physical bullying was least reported. Figure 17: Bullying Experiences
Bullying Experiences among Grade 7-8 and Grade 9-12 Students(Fall 2006)
3%
4%
6%
6%
6%
13%
4%
6%
7%
8%
8%
19%
4%
6%
11%
10%
10%
18%
6%
10%
12%
13%
13%
22%
7%
10%
17%
16%
16%
31%
10%
16%
19%
21%
21%
41%
0% 50% 100%
Physical bullying by a group or gang
Physical bullying by an individual
Theft or destruction of your personal property
Threats to hurt you
Being excluded or shut out from a group
Insults or name calling
GRADE 9-12
Physical bullying by a group or gang
Physical bullying by an individual
Theft or destruction of your personal property
Threats to hurt you
Being excluded or shut out from a group
Insults or name calling
GRADE 7-8
All the time/Often Sometimes
A further analysis shows that 60% of the Grade 9-12s and 50% of the Grade 7-8s reported
having “never” or “rarely” experienced bullying incidents in school. For those who had
experienced bullying “all the time”, “often”, or “sometimes”, the three most frequently cited
reasons were body image, school grades/marks, and cultural/racial background. (See Table 8
for other reasons) Table 8: Reasons for Being Bullied
Reasons for Being Bullied Grade 7-8 Grade 9-12 Body image 38% 27% Grades or marks 17% 12% Cultural or racial background 11% 14% Language 7% 7% Gender 6% 4% Religion 5% 5% Income 5% 5%

R04(Mgmt\StudentCensus\2006StudentCensusSystemOverview1)my.3457 22
4) Inclusive School Experiences Figure 18 represents the percentages of students who reported having learned about the
experiences and achievements of different identified groups in school “all the time”, “often”, or
“sometimes”. About 80% indicated that they had learned about different cultural and racial
groups in school. Most Grade 7-8s also reported having studied about Aboriginal people – a
topic which was part of the Grade 7-8 curriculum. The secondary students reported having
more opportunities to learn about women’s issues. However, a third or more of the students
had rarely or never learned in school about topics related to different religious/faith groups,
people of different social classes, homosexual people, or persons with disabilities. Figure 18: Inclusive School Experiences
Inclusive School Experiences (Fall 2006)
43%
45%
55%
69%
63%
67%
67%
63%
70%
68%
75%
31%
41%
54%
65%
63%
79%
80%
38%
49%
58%
72%
57%
69%
71%
60%
63%
69%
74%
44%
81%
54%
61%
65%
79%
0% 50% 100%
make no difference to me
help me do better in school
help me enjoy school more
make learning more interesting for me
LEARNING MORE ABOUT MY CULTURE/RACE WOULD:
in extra-curricular activities
in materials teachers use in class
in topics we study in class
in pictures/posters in the school
in school publications
in displays of student work
in special events/celebrations
PEOPLE OF DIFFERENT BACKGROUNDS ARE SEEN/HEARD:
homosexual people
persons with disabilities
aboriginal people
people of different social classes
different religious/faith groups
women
different cultural/racial groups
IN SCHOOL, I'VE LEARNED ISSUES ABOUT:
Percent "All the time"/"Often"/"Sometimes" or "Strongly agree"/"Agree"
Grade 9-12 Grade 7-8
Students were asked if they had seen or heard about people of different backgrounds in their
school. Most agreed that they had such exposures from what they studied in class and from the
school as a whole. Over two thirds agreed that learning about their own cultural or racial
background would make learning more interesting for them, and over half indicated it would help
them enjoy school more. About half said that it would actually help them do better in school.

R04(Mgmt\StudentCensus\2006StudentCensusSystemOverview1)my.3457 23
5) Extra-curricular Activities
Extra-curricular Activities in School
In school, most students had participated in at least one type of extra-curricular activity during
their school year, and many took part on a regular (weekly or monthly) basis. As illustrated in
Figure 19, between the two groups of students, the Grade 7-8s seemed to be the more active
ones in these school activities. Figure 19: Participation in School Extra-curricular Activities
Overall Participation in School Extra-curricular Activities (Fall 2006)
62%
77%
19%
13%
81%
90%
0% 50% 100%
Grade 9-12
Grade 7-8
Weekly/Monthly A few times this year
Figure 20 shows how often and the kinds of in-school extra-curricular activities the Grade 7-8s
took part in during the school year. The most regularly (weekly or monthly) attended activities
were sports, music, and arts. Activities related to leadership, school council, publications, or
cultural groups were attended regularly by less than 20% of the Grade 7-8s.
Figure 20: Extra-curricular Activities in School among Grade 7-8 Students
Extra-curricular Activities in School among Grade 7-8 Students (Fall 2006)
7%
9%
7%
10%
19%
28%
40%
13%
38%
7%
9%
8%
9%
10%
7%
6%
21%
14%
16%
15%
20%
19%
19%
22%
14%
34%
21%
30%
33%
35%
38%
48%
57%
60%
68%
73%
0% 50% 100%
Cultural group activities
Student Council activities
Student publications
Leadership programs
School clubs
Arts
Music
School special events
Sports
Weekly Monthly A few times this year

R04(Mgmt\StudentCensus\2006StudentCensusSystemOverview1)my.3457 24
Figure 21 shows the Grade 9-12s’ participation level in different school extra-curricular activities.
Although secondary school students participated in similar extra-curricular activities in school as
their peers in Grades 7-8, their participation rate was noticeably lower. For instance, whereas
over half of the Grade 7-8s participated in school sports weekly or monthly, only a third (35%) of
the secondary school students did so regularly. Figure 21: Extra-curricular Activities in School among Grade 9-12 Students
Extra-curricular Activities in School among Grade 9-12 Students(Fall 2006)
5%
6%
5%
7%
16%
17%
16%
6%
25%
5%
6%
5%
6%
4%
7%
5%
13%
10%
14%
15%
19%
17%
12%
16%
22%
34%
21%
24%
27%
29%
30%
32%
40%
43%
53%
56%
0% 50% 100%
Student publications
Student Council activities
Cultrual group activities
Leadership programs
Music
School clubs
Arts
School special events
Sports
Weekly Monthly A few times this year
Extra-curricular Activities Outside of School
Aside from school, most students in the TDSB were also involved in at least one type of extra-
curricular activity outside of school during the year, and many participated on a regular basis. It
should be noted that the Grade 7-8s’ participation rate in school still seemed to be slightly
higher (90%) than their involvement outside of school (85%). On the other hand, secondary
school students seemed as equally active as the Grade 7-8s in outside of school activities. In
fact, according to the Census, more high schoolers were regularly involved outside of school
than in school extra-curricular activities (70% versus 62%, see Figure 22 and Figure 19) Figure 22: Overall Participation in Outside of school Extra-curricular Activities
Overall Participation in Out-of-school Extra-curricular Activities (Fall 2006)
70%
73%
14%
12%
84%
85%
0% 50% 100%
Grade 9-12
Grade 7-8
Weekly/Monthly A few times this year

R04(Mgmt\StudentCensus\2006StudentCensusSystemOverview1)my.3457 25
Sports were also the most popular outside of school activities among the Grade 7-8s. Over half
(55%) participated in sports activities outside of school on a weekly or monthly basis. Figure 23
shows other types of outside of school activities Grade 7-8 students had taken part in.
Figure 23: Extra-curricular Activities Outside of school among Grade 7-8 Students
Extra-curricular Activities Outside of School among Grade 7-8 Students (Fall 2006)
6%
10%
14%
17%
17%
9%
27%
44%
5%
6%
8%
7%
8%
10%
6%
11%
13%
13%
15%
15%
15%
23%
11%
16%
24%
29%
37%
39%
40%
42%
44%
71%
0% 50% 100%
Leadership programs
Cultrual group activities
Clubs
Arts
Religious activities
Volunteer activities
Music
Sports
Weekly Monthly A few times this year
For the secondary school students, aside from sports, volunteer work was cited as a more
frequently participated activity outside of school. One third of the Grade 9-12s were involved in
volunteer work on a weekly or monthly basis, and another third for at least a few times during
the year. See Figure 24 for other types of outside of school extra-curricular activities that
secondary school students had been involved in.
Figure 24: Extra-curricular Activities Outside of school among Grade 9-12 Students
Extra-curricular Activities Outside of School among Grade 9-12 Students (Fall 2006)
6%
9%
7%
20%
15%
16%
33%
16%
5%
7%
7%
5%
7%
8%
12%
16%
15%
15%
18%
11%
16%
17%
18%
33%
26%
31%
32%
36%
38%
41%
63%
65%
0% 50% 100%
Leadership programs
Clubs
Cultrual group activities
Music
Arts
Religious activities
Sports
Volunteer activities
Weekly Monthly A few times this year

R04(Mgmt\StudentCensus\2006StudentCensusSystemOverview1)my.3457 26
6) Homework Homework Hours
Students were asked about the average number of hours they spent on homework each week.
Based on their responses, the mean number of hours per week was 10 for the Grade 7-8s, and
12 for the secondary school students.
Homework Support after School
Sixteen percent of the Grade 7-8s and 20% of the Grade 9-12s reported that they did not need
help with their homework. For the Grade 7-8s who needed help, most received the support
from home, especially their parents. For the secondary students, the support was more external
– e.g., friends and tutors. It should, however, be noted that about one in three (30%) of the
high school students and one in six (16%) of the Grade 7-8s had no one to turn to for homework
assistance outside of school. (See Figure 25) Figure 25: Homework Help after School
Homework Help After School - Grade 7-8 and Grade 9-12 Students(Fall 2006)
30%
1%
3%
6%
9%
12%
22%
37%
36%
16%
1%
2%
11%
6%
15%
30%
31%
61%
0% 50% 100%
No one
People in the community
Free tutor(s) from school
Other family members
Paid tutor(s)
Teachers
Siblings
Friend(s)
Parents/caregivers
Grade 9-12 Grade 7-8

R04(Mgmt\StudentCensus\2006StudentCensusSystemOverview1)my.3457 27
Challenges Related to Homework
Students were asked what factors prevented them from finishing their homework. For the
senior school students, almost half cited “spending time with friends”, “difficulty of the
homework”, and “sports and recreational activities” as the main reasons. (See Figure 26)
Figure 26: Factors Preventing Grade 7-8 Students from Finishing Homework
Factors Preventing Grade 7-8 Students from Finishing Homework(Fall 2006)
6%
5%
8%
14%
16%
20%
16%
23%
7%
10%
11%
19%
19%
26%
32%
26%
9%
13%
15%
19%
33%
35%
46%
48%
49%
3%
3%
4%
6%
7%
0% 50% 100%
Part-time job
Health reasons
No proper space at home to do homework
No study materials to help me
Religious/faith activities
Household chores and responsibilities
Frequent distractions at home
Sports or recreation activities
Difficulty of the homework
Spending time with friends
All the time/Often Sometimes

R04(Mgmt\StudentCensus\2006StudentCensusSystemOverview1)my.3457 28
For the Grade 9-12s, the main reasons were the same as the Grade 7-8s’; but a higher
proportion of the secondary school students identified these reasons, especially the top two, as
factors preventing them from finishing their school work. “Frequent distractions at home” also
posed as a challenge to nearly half of the secondary school students. (See Figure 27)
Figure 27: Factors Preventing Grade 9-12 Students from Finishing Homework
Factors Preventing Grade 9-12 Students from Finishing Homework(Fall 2006)
4%
6%
7%
5%
12%
13%
18%
22%
22%
29%
8%
10%
10%
13%
13%
20%
26%
23%
37%
32%
12%
16%
17%
18%
25%
33%
44%
45%
59%
61%
0% 50% 100%
Health reasons
Religious/faith activities
No proper space at home to do homework
No study materials to help me
Part-time job
Household chores and responsibilities
Sports or recreation activities
Frequent distractions at home
Difficulty of the homework
Spending time with friends
All the time/Often Sometimes
Also, whereas part-time job was not a factor for most of the younger students, it did affect a
quarter of the high school students. According to the Census, about one in three of the high
school students and about one in six of the Grade 7-8s worked part-time for pay. (See Table 9)
For the former, they spent an average of 13 hours per week in their part-time jobs, and for their
younger counterparts who worked part-time, they spent an average of 7 hours per week.
Table 9: Part-time Work
Part-time Work Grade 7-8 Grade 9-12 % of students who work for pay 17% 31% Average hours per week 7 hrs. 13 hrs.
R04(Mgmt\StudentCensus\2006StudentCensusSystemOverview1)my.3457 29
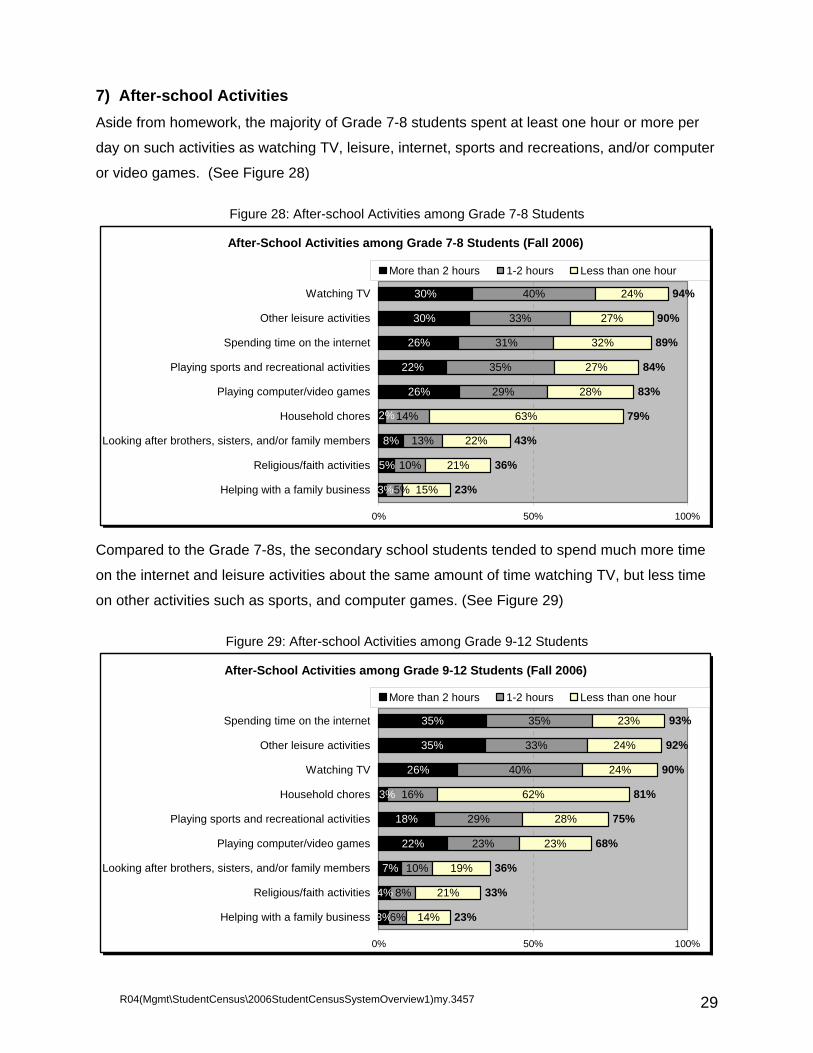
7) After-school Activities Aside from homework, the majority of Grade 7-8 students spent at least one hour or more per
day on such activities as watching TV, leisure, internet, sports and recreations, and/or computer
or video games. (See Figure 28)
Figure 28: After-school Activities among Grade 7-8 Students
After-School Activities among Grade 7-8 Students (Fall 2006)
5%
8%
26%
22%
26%
30%
30%
10%
13%
14%
29%
35%
31%
33%
40%
15%
21%
22%
63%
28%
27%
32%
27%
24%
23%
36%
43%
79%
83%
84%
89%
90%
94%
3%
2%
5%
0% 50% 100%
Helping with a family business
Religious/faith activities
Looking after brothers, sisters, and/or family members
Household chores
Playing computer/video games
Playing sports and recreational activities
Spending time on the internet
Other leisure activities
Watching TV
More than 2 hours 1-2 hours Less than one hour
Compared to the Grade 7-8s, the secondary school students tended to spend much more time
on the internet and leisure activities about the same amount of time watching TV, but less time
on other activities such as sports, and computer games. (See Figure 29)
Figure 29: After-school Activities among Grade 9-12 Students
After-School Activities among Grade 9-12 Students (Fall 2006)
3%
4%
7%
22%
18%
26%
35%
35%
6%
8%
10%
23%
29%
16%
40%
33%
35%
14%
21%
19%
23%
28%
62%
24%
24%
23%
23%
33%
36%
68%
75%
81%
90%
92%
93%
3%
0% 50% 100%
Helping with a family business
Religious/faith activities
Looking after brothers, sisters, and/or family members
Playing computer/video games
Playing sports and recreational activities
Household chores
Watching TV
Other leisure activities
Spending time on the internet
More than 2 hours 1-2 hours Less than one hour
R04(Mgmt\StudentCensus\2006StudentCensusSystemOverview1)my.3457 30
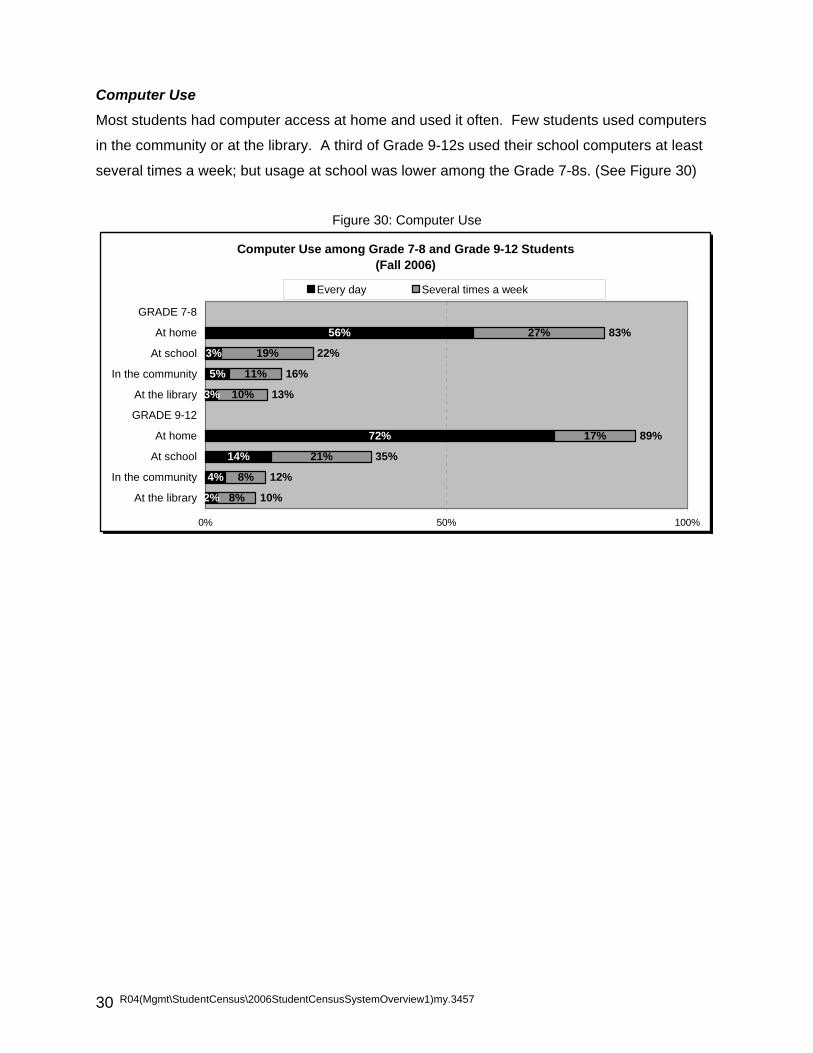
Computer Use
Most students had computer access at home and used it often. Few students used computers
in the community or at the library. A third of Grade 9-12s used their school computers at least
several times a week; but usage at school was lower among the Grade 7-8s. (See Figure 30)
Figure 30: Computer Use
Computer Use among Grade 7-8 and Grade 9-12 Students(Fall 2006)
2%
4%
14%
72%
3%
5%
3%
56%
8%
8%
21%
17%
10%
11%
19%
27%
10%
12%
35%
89%
13%
16%
22%
83%
0% 50% 100%
At the library
In the community
At school
At home
GRADE 9-12
At the library
In the community
At school
At home
GRADE 7-8
Every day Several times a week
R04(Mgmt\StudentCensus\2006StudentCensusSystemOverview1)my.3457 31
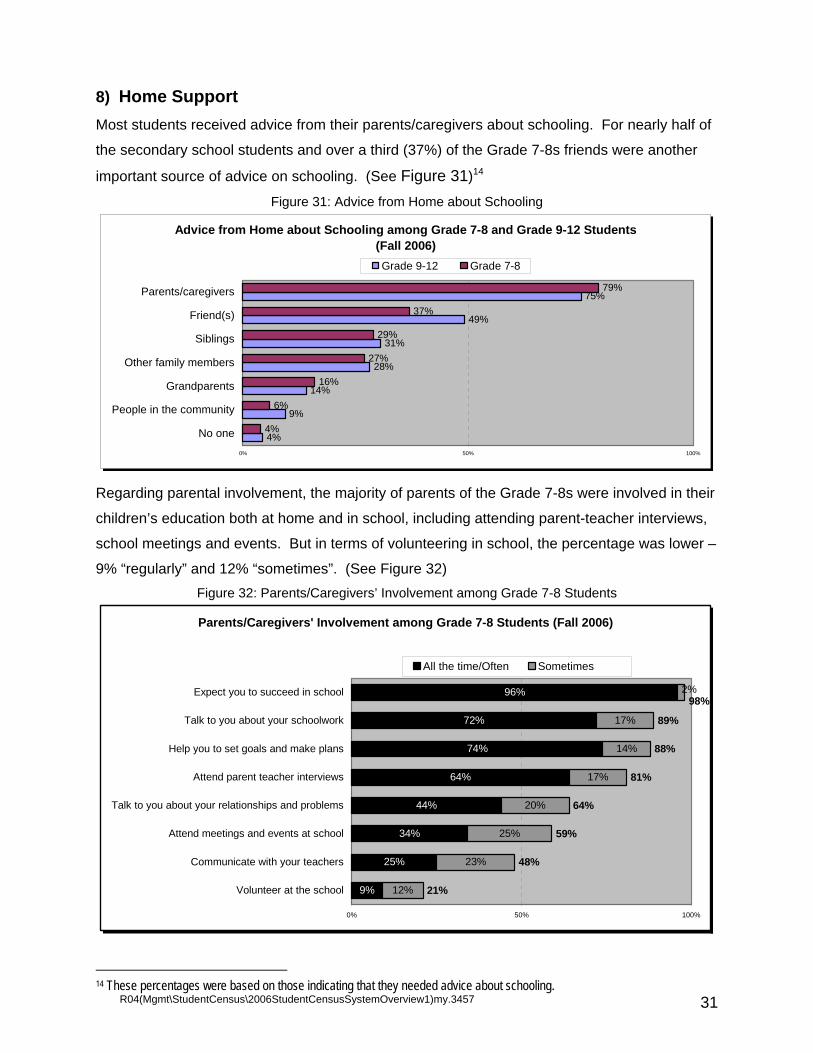
8) Home Support Most students received advice from their parents/caregivers about schooling. For nearly half of
the secondary school students and over a third (37%) of the Grade 7-8s friends were another
important source of advice on schooling. (See Figure 31)14
Figure 31: Advice from Home about Schooling
Advice from Home about Schooling among Grade 7-8 and Grade 9-12 Students(Fall 2006)
4%
9%
14%
28%
31%
49%
75%
4%
6%
16%
27%
29%
37%
79%
0% 50% 100%
No one
People in the community
Grandparents
Other family members
Siblings
Friend(s)
Parents/caregivers
Grade 9-12 Grade 7-8
Regarding parental involvement, the majority of parents of the Grade 7-8s were involved in their
children’s education both at home and in school, including attending parent-teacher interviews,
school meetings and events. But in terms of volunteering in school, the percentage was lower –
9% “regularly” and 12% “sometimes”. (See Figure 32) Figure 32: Parents/Caregivers’ Involvement among Grade 7-8 Students
Parents/Caregivers' Involvement among Grade 7-8 Students (Fall 2006)
9%
25%
34%
44%
64%
74%
72%
96%
12%
23%
25%
20%
17%
14%
17%
21%
48%
59%
64%
81%
88%
89%
2%98%
0% 50% 100%
Volunteer at the school
Communicate with your teachers
Attend meetings and events at school
Talk to you about your relationships and problems
Attend parent teacher interviews
Help you to set goals and make plans
Talk to you about your schoolwork
Expect you to succeed in school
All the time/Often Sometimes
14 These percentages were based on those indicating that they needed advice about schooling.
R04(Mgmt\StudentCensus\2006StudentCensusSystemOverview1)my.3457 32
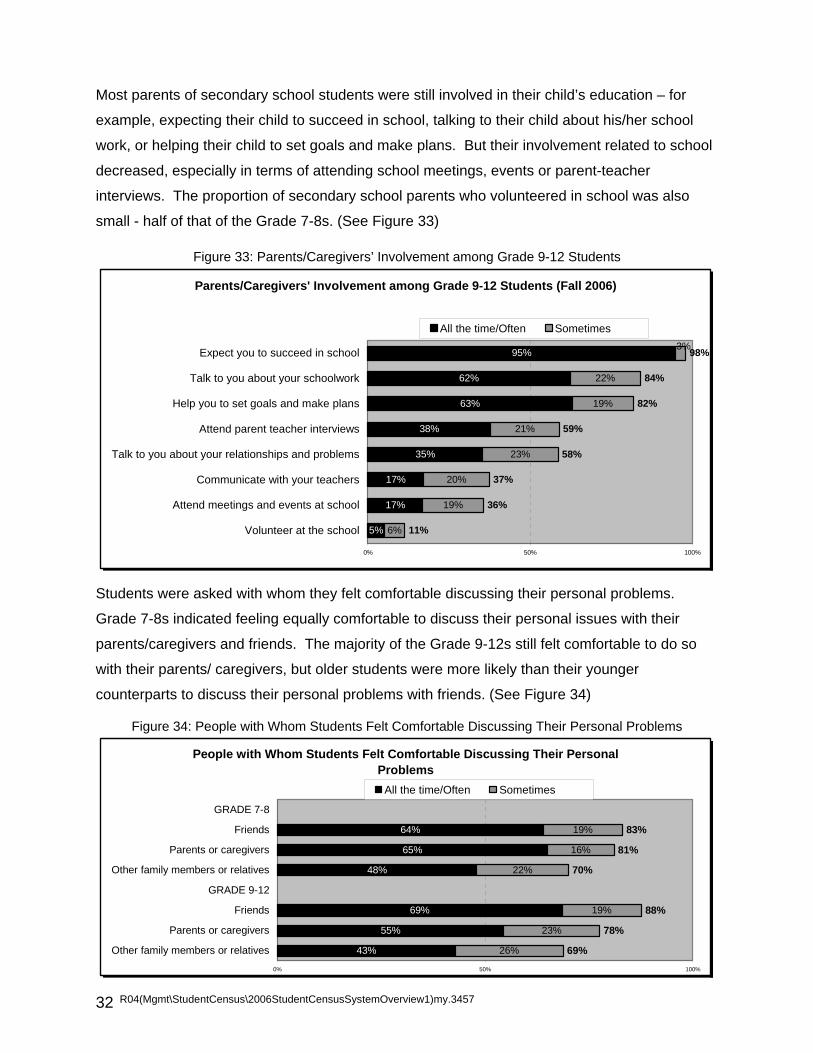
Most parents of secondary school students were still involved in their child’s education – for
example, expecting their child to succeed in school, talking to their child about his/her school
work, or helping their child to set goals and make plans. But their involvement related to school
decreased, especially in terms of attending school meetings, events or parent-teacher
interviews. The proportion of secondary school parents who volunteered in school was also
small - half of that of the Grade 7-8s. (See Figure 33)
Figure 33: Parents/Caregivers’ Involvement among Grade 9-12 Students
Parents/Caregivers' Involvement among Grade 9-12 Students (Fall 2006)
5%
17%
17%
35%
38%
63%
62%
95%
6%
19%
20%
23%
21%
19%
22%
11%
36%
37%
58%
59%
82%
84%
98%3%
0% 50% 100%
Volunteer at the school
Attend meetings and events at school
Communicate with your teachers
Talk to you about your relationships and problems
Attend parent teacher interviews
Help you to set goals and make plans
Talk to you about your schoolwork
Expect you to succeed in school
All the time/Often Sometimes
Students were asked with whom they felt comfortable discussing their personal problems.
Grade 7-8s indicated feeling equally comfortable to discuss their personal issues with their
parents/caregivers and friends. The majority of the Grade 9-12s still felt comfortable to do so
with their parents/ caregivers, but older students were more likely than their younger
counterparts to discuss their personal problems with friends. (See Figure 34)
Figure 34: People with Whom Students Felt Comfortable Discussing Their Personal Problems
People with Whom Students Felt Comfortable Discussing Their Personal Problems(Fall 2006)
43%
55%
69%
48%
65%
64%
26%
23%
19%
22%
16%
19%
69%
78%
88%
70%
81%
83%
0% 50% 100%
Other family members or relatives
Parents or caregivers
Friends
GRADE 9-12
Other family members or relatives
Parents or caregivers
Friends
GRADE 7-8
All the time/Often Sometimes

R04(Mgmt\StudentCensus\2006StudentCensusSystemOverview1)my.3457 33
Eating Habits
The Census also included a question on student eating habits. The responses reveal that not
all students ate breakfast or lunch everyday. This is especially so for the high school students;
fewer than half of these students had breakfast everyday, and fewer than 60% had daily lunch.
Most students did, however, have dinner every evening; but only some students regularly had a
snack during the school day. (See Figure 35)
Figure 35: Eating Habits
Eating Habits among Grade 7-8 and Grade 9-12 Students(Fall 2006)
27%
83%
58%
41%
30%
89%
79%
56%
17%
12%
24%
18%
19%
8%
14%
17%
44%
95%
82%
59%
49%
97%
93%
73%
0% 50% 100%
Have a snack during the school day
Eat dinner
Eat lunch
Eat breakfast before coming to school
GRADE 9-12
Have a snack during the school day
Eat dinner
Eat lunch
Eat breakfast before coming to school
GRADE 7-8
Everyday Most days
Eyesight and Hearing Tests
The Grade 7-8s were further asked if they had ever had their eyesight and hearing tested by a
doctor. Most (75%) students had their eyesight checked, but less than a third (31%) knew that
they had their hearing examined by a doctor. (See Figure 36)
Figure 36: Eyesight and Hearing Tests among Grade 7-8 Students
Eyesight and Hearing Tests among Grade 7-8 Students(Fall 2006)
31%
75%
25%
9%16%
44%
0% 50% 100%
Hearing
Eyesight
Yes No Don't know

R04(Mgmt\StudentCensus\2006StudentCensusSystemOverview1)my.3457 34
9) Student Self-evaluation and Accomplishments About three quarters of the Grade 7-8s rated themselves as progressing well (“excellent” or
“good”) in school and in social skills. However, it should be noted that about a third to half of the
students did not think they were “excellent” or “good” in other skill areas such as reading,
problem solving, communication, leadership, math, and technology. (See Figure 37) Figure 37: Self-evaluation of School Progress and Skills among Grade 7-8 Students
Self Evaluation of School Progress and Skills, Grade7-8 Students (Fall 2006)
20%
26%
18%
30%
21%
25%
26%
39%
22%
35%
31%
40%
32%
43%
40%
41%
37%
51%
55%
57%
58%
62%
64%
65%
67%
76%
73%
0% 50% 100%
Technology
Leadership
Writing
Math
Oral communication
Problem solving
Reading
Social skills
Own progress at school
Excellent Good
The percentage of Grade 9-12s who rated themselves “excellent” or “good” in their school
progress was somewhat lower than the Grade 7-8s (66% versus 73%). But their self rating in
other skill areas was similar, except for mathematics. Only half of Grade 9-12s thought they
were doing well in math, compared to nearly two thirds (62%) of Grade 7-8s. (See Figure 38) Figure 38: Self-evaluation of School Progress and Skills among Grade 9-12 Students
Self Evaluation of School Progress and Skills, Grade 9-12 Students (Fall 2006)
21%
19%
24%
20%
26%
28%
29%
40%
17%
29%
32%
33%
39%
41%
42%
40%
37%
49%
50%
51%
57%
59%
67%
70%
69%
77%
66%
0% 50% 100%
Math
Technology
Leadership
Writing
Oral communication
Problem solving
Reading
Social skills
Own progress at school
Excellent Good

R04(Mgmt\StudentCensus\2006StudentCensusSystemOverview1)my.3457 35
Leadership and Helping Roles in School
About three quarters of the senior and secondary school students reported that they had been
selected at least a few times to lead an activity, a group or a team in school. But the proportion
of students who had been selected regularly or sometimes was less than half. (See Figure 39)
Figure 39: Students Being Selected to Lead in School
Students Being Selected to Lead in School(Fall 2006)
15%
16%
27%
29%
33%
35%
75%
80%
0% 50% 100%
Grade 9-12
Grade 7-8
Many times Sometimes A few times
The Census asked if students had been selected at school to help others in such roles as a
peacemaker, ready buddy, mentor, etc. Not too many students, especially those at the
secondary school level, reported that they had been selected in school to do so. For those who
did, the two most common roles were being a reading buddy and being a tutor. (See Figure 40)
Less than 10% of the students reported that they had taken other roles such as peacemakers,
mentors, or school ambassadors.
Figure 40: Helping Roles Students Participated in School
Helping Roles Students Participated in School (Fall 2006)
57%
5%
7%
8%
16%
16%
42%
6%
6%
8%
12%
39%
0% 50% 100%
Not yet
Ambassador
Mentor
Peacemaker
Tutor
Reading buddy
Grade 9-12 Grade 7-8
R04(Mgmt\StudentCensus\2006StudentCensusSystemOverview1)my.3457 36
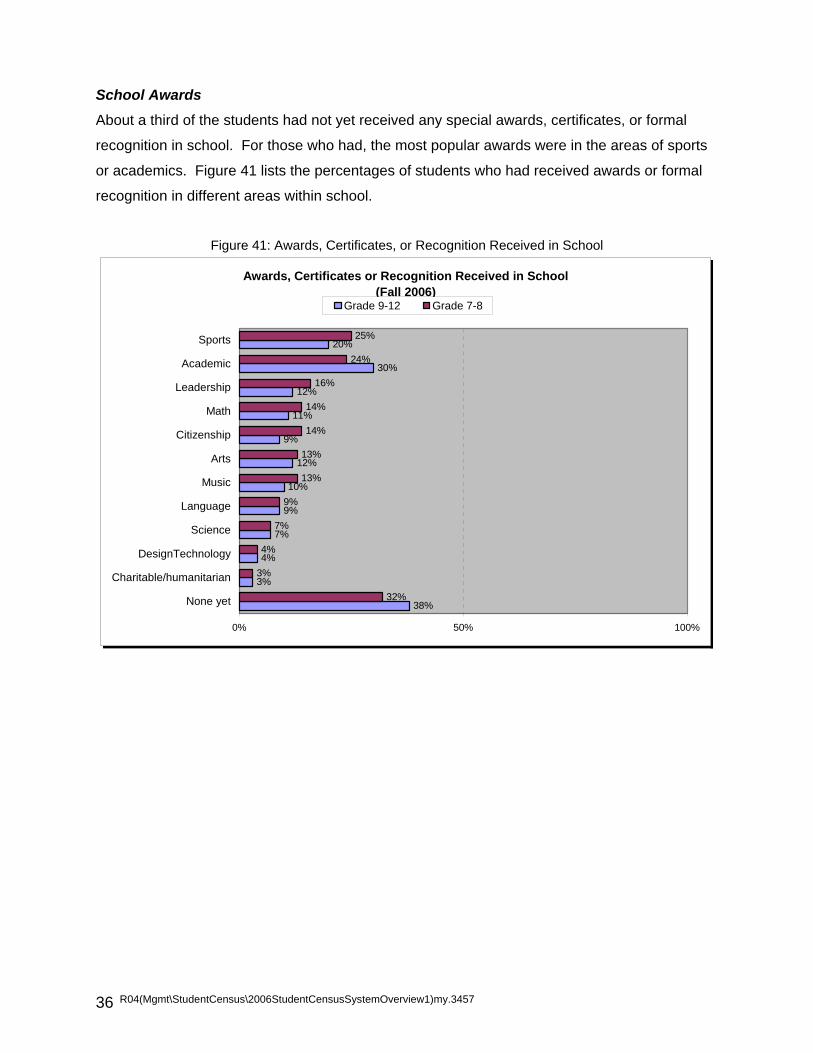
School Awards
About a third of the students had not yet received any special awards, certificates, or formal
recognition in school. For those who had, the most popular awards were in the areas of sports
or academics. Figure 41 lists the percentages of students who had received awards or formal
recognition in different areas within school.
Figure 41: Awards, Certificates, or Recognition Received in School
Awards, Certificates or Recognition Received in School (Fall 2006)
38%
3%
4%
7%
9%
10%
12%
9%
11%
12%
30%
20%
32%
3%
4%
7%
9%
13%
13%
14%
14%
16%
24%
25%
0% 50% 100%
None yet
Charitable/humanitarian
DesignTechnology
Science
Language
Music
Arts
Citizenship
Math
Leadership
Academic
Sports
Grade 9-12 Grade 7-8
R04(Mgmt\StudentCensus\2006StudentCensusSystemOverview1)my.3457 37
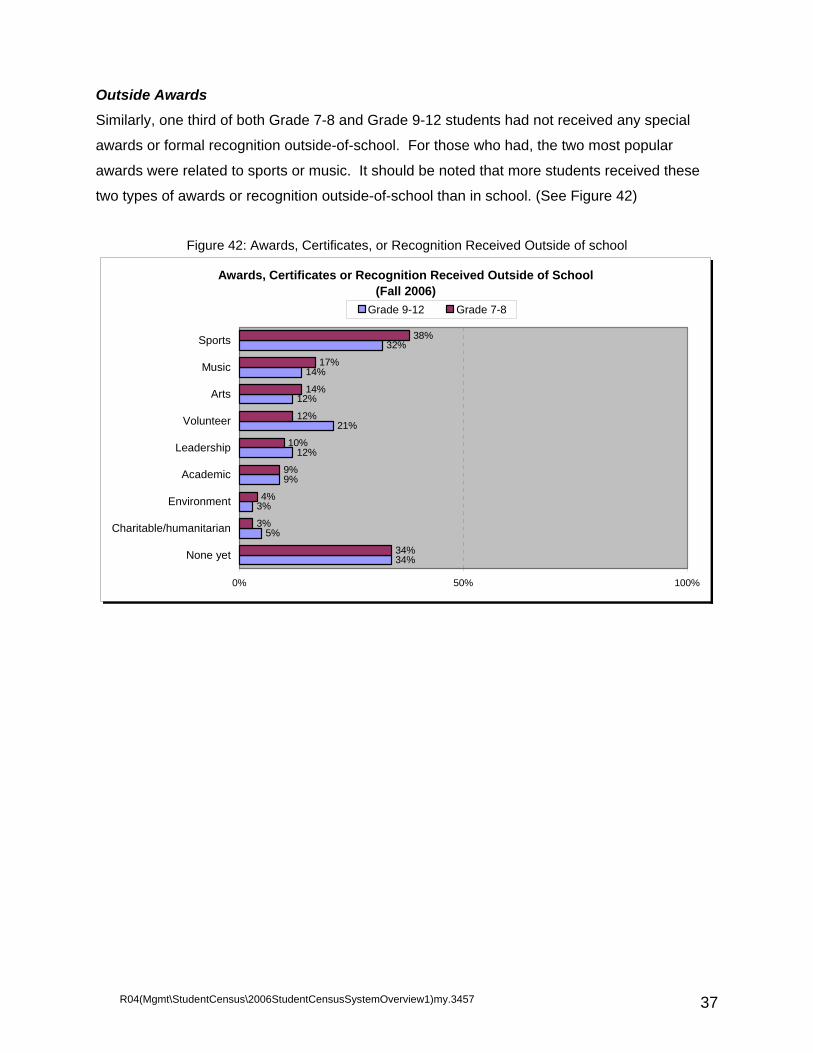
Outside Awards
Similarly, one third of both Grade 7-8 and Grade 9-12 students had not received any special
awards or formal recognition outside-of-school. For those who had, the two most popular
awards were related to sports or music. It should be noted that more students received these
two types of awards or recognition outside-of-school than in school. (See Figure 42)
Figure 42: Awards, Certificates, or Recognition Received Outside of school
Awards, Certificates or Recognition Received Outside of School (Fall 2006)
34%
5%
3%
9%
12%
21%
12%
14%
32%
34%
3%
4%
9%
10%
12%
14%
17%
38%
0% 50% 100%
None yet
Charitable/humanitarian
Environment
Academic
Leadership
Volunteer
Arts
Music
Sports
Grade 9-12 Grade 7-8

R04(Mgmt\StudentCensus\2006StudentCensusSystemOverview1)my.3457 38
10) Post-secondary Plans and Expectations The majority of students indicated that they would definitely finish high school, although the
percentage was lower among the Grade 7-8s than their high school counterparts (52% versus
72%). For the former, over a third (38%) did think that they would complete high school.
(See Figure 43)
Figure 43: Expectations to Complete High School
Expectations to Complete High School - Grade 7-8 vs. Grade 9-12 Students(Fall 2006)
1%
4%
22%
72%
2%
9%
38%
52%
0% 50% 100%
I don't think I will
I'm not sure
I think I will
I definitely will
Grade 9-12 Grade 7-8
For the Grade 7-8s, their post-secondary school plans and their perceived parents’ expectations
were similar. Over half of these students and their parents expected that they would attend
university after secondary school, and about 1 in 6 expected to attend college. But quite a
significant proportion (19%) of the Grade 7-8s and about a fifth (23%) of their parents indicated
they were not yet sure of their post-secondary plans. (See Figure 44)
Figure 44: Parent Post-secondary School Expectations vs. Student Own Plans among Grade 7-8 Students
Parent Post-Secondary Expectations vs. Student Own Plans, Grade 7-8 Students(Fall 2006)
1%
2%
2%
23%
16%
57%
2%
3%
3%
19%
18%
56%
0% 50% 100%
An Apprenticeship
Work
Other Plans
Not sure
Attend College
Attend University
Parent Expectations Student Plans

R04(Mgmt\StudentCensus\2006StudentCensusSystemOverview1)my.3457 39
By the secondary school level, the percentage of students who were sure of their post-
secondary school plans was higher, so were their parents’ expectations. But more parents of
the secondary school students than those of the Grade 7-8s expected their children to attend
university; indeed, the percentage of parents who expected so was also somewhat higher than
that of their children who planned to do so. The percentage of secondary school students and
their parents who expected to attend college was about the same as their younger counterparts.
(See Figure 45) Figure 45: Parent Post-secondary School Expectations vs. Student Own Plans among
Grade 9-12 Students
Parent Post-Secondary Expectations vs. Student Own Plans, Grade 9-12 Students(Fall 2006)
1%
1%
3%
13%
15%
67%
3%
3%
4%
14%
16%
60%
0% 50% 100%
An Apprenticeship
Work
Other Plans
Not sure
Attend College
Attend University
Parent Expectations Student Plans
Future Career or Occupation
Both the Grade 7-8s and the Grade 9-12s responded similarly when asked about their future
career or occupation. About a third had decided on their future career, over half were thinking
about it, and over 10% had no idea at this point. (See Figure 46)
Figure 46: Future Career or Occupation
Thinking about Future Career or Occupation(Fall 2006)
12%
55%
33%
12%
56%
32%
0% 50% 100%
I have not idea at this point
I've been thinking about it
I've decided on my futurecareer
Grade 9-12 Grade 7-8

R04(Mgmt\StudentCensus\2006StudentCensusSystemOverview1)my.3457 40
Regarding career advice, two thirds of both the Grade 7-8 and Grade 9-12 students reported
that their parents/caregivers had helped them decide on their future career or occupation. A
quarter of the students also gained advice from other family members. However, secondary
school students were more likely than their younger counterparts to turn to other sources such
as friends, teachers, and guidance counsellors for advice about their future career. It should,
however, be noted that nearly a quarter of the students reported that they had no one helping
them in this area. (See Figure 47)
Figure 47: Career Advice
Career Advice - Grade 7-8 and Grade 9-12 Students(Fall 2006)
23%
2%
13%
20%
25%
30%
62%
21%
1%
7%
17%
25%
23%
67%
0% 50% 100%
No one
Other counsellors
Guidance counsellor(s)
Teacher(s)
Other family members
Friends
Parents/caregivers
Grade 9-12 Grade 7-8

R04(Mgmt\StudentCensus\2006StudentCensusSystemOverview1)my.3457 41
NEXT RESEARCH STEPS Based on the preliminary analysis of this first TDSB Student Census, the current report provides
the Board an overview of its diverse student population and the experiences of its students in
and outside-of-school. It should be noted that this report makes no attempt to establish any
correlations or causal relationships among the different variables. Further analyses are required
to have a deeper understanding of students’ various experiences, achievement gaps, and
school career over time. Specifically, in-depth studies should be conducted to explore patterns
in student success, and to examine if gaps exist among different demographic groups in relation
to four key student-success outcome areas: a) school experiences, b) academic achievement,
c) leadership opportunities, and d) post-secondary school plans.
Each of these areas will be correlated with such variables as gender, race, immigration, parent
and family background, and other related factors - e.g., after-school activities and home support.
These analyses will result in four major studies. The findings will help the system to identify
gaps in student learning and outcomes, and to determine appropriate supports and resources to
ensure success for all students. (See chart below for details.)
Areas of Focus
School Experiences
How to ensure all students are connected and engaged
learners
Academic Achievement
How to ensure equity of success for all students
Leadership Opportunities
How to ensure all students are prepared as
responsible citizens
Post-Secondary School Plans
How to ensure equity of access to post-
secondary opportunities
Some suggested
issues
Overall school climate Inclusive school
experiences Peer and adult
relationships School programs and
facilities School rules and safety
Credit accumulation Program of study EQAO School report cards Graduation / dropout
rates
Extra-curricular activities
Leadership opportunities
Awards and formal recognition
Different skill sets (e.g., problem-solving, communication)
Expectations to complete high school
Post-secondary school plans
Post-secondary applications
Future career and occupations
How do the factors below relate or impact each of the 4 areas of focus above? Gender Race Immigration Parent/Family Factor Other Variables
Including: Female Male Sexual
orientation
Including: Race identity Culture/Ethnicity Home language(s)
Including: Student place of birth Parent place of birth Recency of arrival
Including: Parent education level Parent presence at
home Socio-economic status
Including: After-school activities Home support Homework Eating habits School programs

R04(Mgmt\StudentCensus\2006StudentCensusSystemOverview1)my.3457 42
R04(Mgmt\StudentCensus\2006StudentCensusSystemOverview1)my.3457
43
Appendix A: Student Census Survey Forms A and B

R04(Mgmt\StudentCensus\2006StudentCensusSystemOverview1)my.3457
44
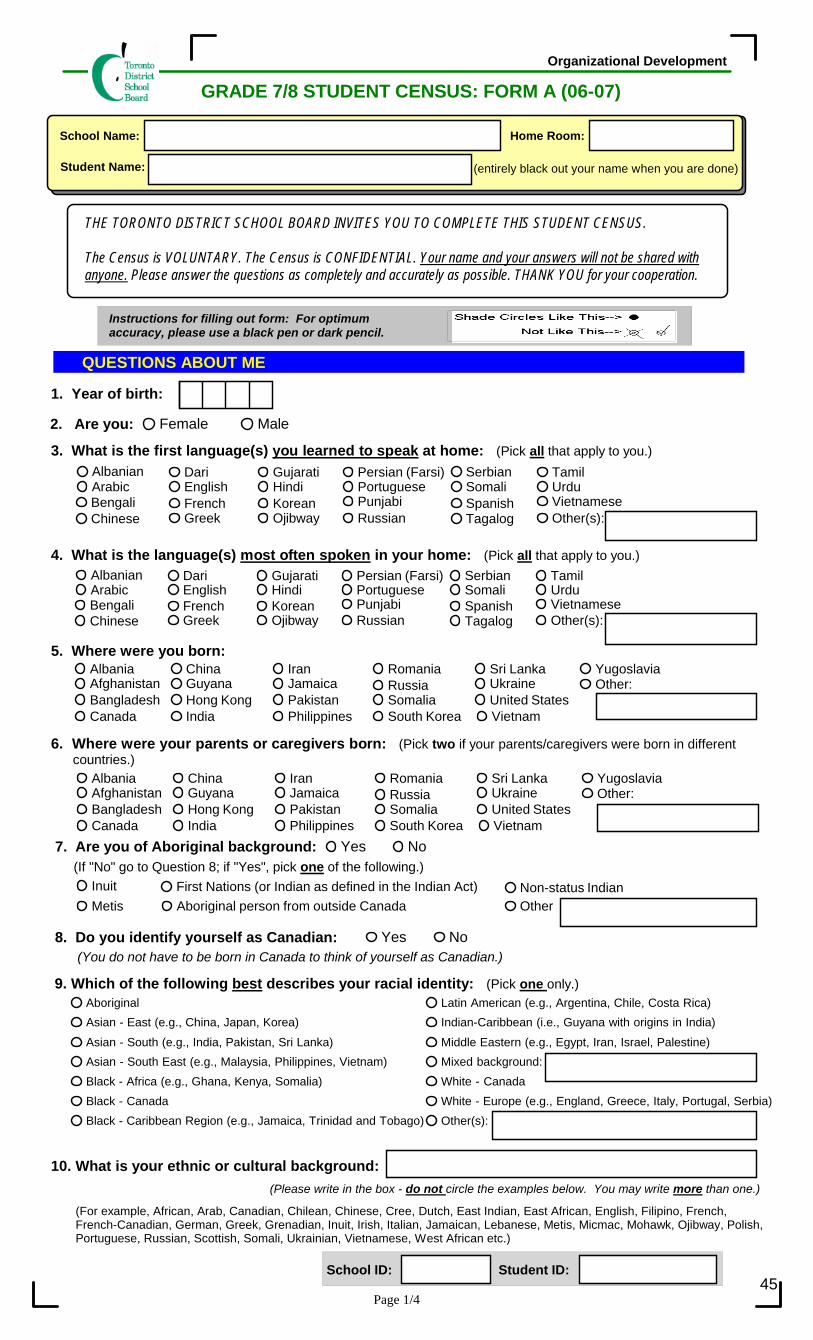
Page 1/4
GRADE 7/8 STUDENT CENSUS: FORM A (06-07)Organizational Development
Home Room:School Name:
(entirely black out your name when you are done)
3. What is the first language(s) you learned to speak at home: (Pick all that apply to you.)
7. Are you of Aboriginal background: Yes No(If "No" go to Question 8; if "Yes", pick one of the following.)
Instructions for filling out form: For optimumaccuracy, please use a black pen or dark pencil.
THE TORONTO DISTRICT SCHOOL BOARD INVITES YOU TO COMPLETE THIS STUDENT CENSUS.
The Census is VOLUNTARY. The Census is CONFIDENTIAL. Your name and your answers will not be shared withanyone. Please answer the questions as completely and accurately as possible. THANK YOU for your cooperation.
QUESTIONS ABOUT ME
1. Year of birth:
AlbanianArabicBengaliChinese
DariEnglishFrenchGreek
GujaratiHindiKoreanOjibway
Persian (Farsi)PortuguesePunjabiRussian
SerbianSomaliSpanishTagalog
TamilUrduVietnameseOther(s):
4. What is the language(s) most often spoken in your home: (Pick all that apply to you.)
5. Where were you born:AlbaniaAfghanistanBangladeshCanada
ChinaGuyanaHong KongIndia
IranJamaicaPakistanPhilippines
RomaniaRussiaSomaliaSouth Korea
Sri LankaUkraineUnited StatesVietnam
YugoslaviaOther:
Inuit First Nations (or Indian as defined in the Indian Act) Non-status IndianMetis Aboriginal person from outside Canada Other
8. Do you identify yourself as Canadian: Yes No(You do not have to be born in Canada to think of yourself as Canadian.)
9. Which of the following best describes your racial identity: (Pick one only.)AboriginalAsian - East (e.g., China, Japan, Korea)
Asian - South (e.g., India, Pakistan, Sri Lanka)Asian - South East (e.g., Malaysia, Philippines, Vietnam)Black - Africa (e.g., Ghana, Kenya, Somalia)Black - CanadaBlack - Caribbean Region (e.g., Jamaica, Trinidad and Tobago)
Latin American (e.g., Argentina, Chile, Costa Rica)Indian-Caribbean (i.e., Guyana with origins in India)
Middle Eastern (e.g., Egypt, Iran, Israel, Palestine)Mixed background:White - CanadaWhite - Europe (e.g., England, Greece, Italy, Portugal, Serbia)Other(s):
6. Where were your parents or caregivers born: (Pick two if your parents/caregivers were born in different countries.)
10. What is your ethnic or cultural background:
(For example, African, Arab, Canadian, Chilean, Chinese, Cree, Dutch, East Indian, East African, English, Filipino, French,French-Canadian, German, Greek, Grenadian, Inuit, Irish, Italian, Jamaican, Lebanese, Metis, Micmac, Mohawk, Ojibway, Polish,Portuguese, Russian, Scottish, Somali, Ukrainian, Vietnamese, West African etc.)
(Please write in the box - do not circle the examples below. You may write more than one.)
2. Are you: Female Male
AlbanianArabicBengaliChinese
DariEnglishFrenchGreek
GujaratiHindiKoreanOjibway
Persian (Farsi)PortuguesePunjabiRussian
SerbianSomaliSpanishTagalog
TamilUrduVietnameseOther(s):
AlbaniaAfghanistanBangladeshCanada
ChinaGuyanaHong KongIndia
IranJamaicaPakistanPhilippines
RomaniaRussiaSomaliaSouth Korea
Sri LankaUkraineUnited StatesVietnam
YugoslaviaOther:
Student Name:
Student ID:School ID:45
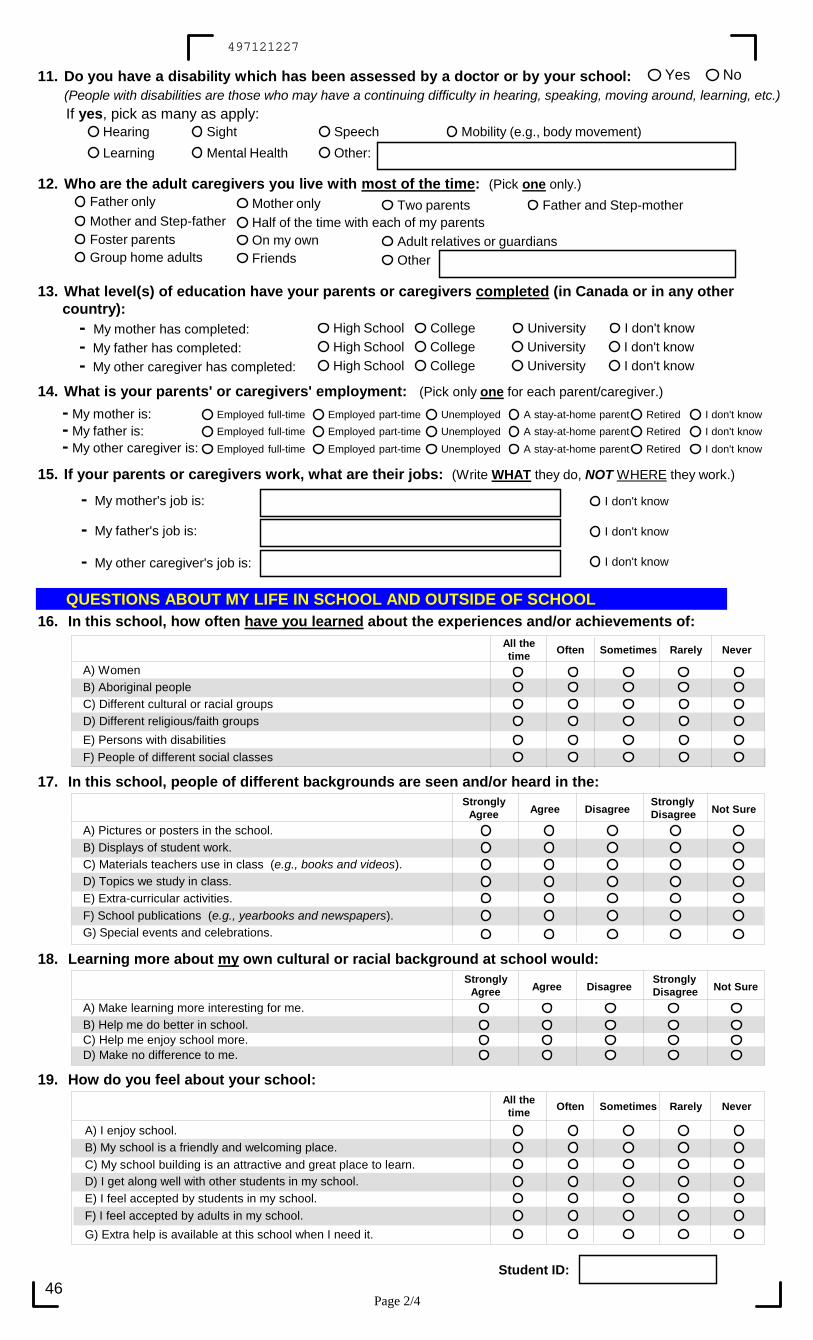
QUESTIONS ABOUT MY LIFE IN SCHOOL AND OUTSIDE OF SCHOOL16. In this school, how often have you learned about the experiences and/or achievements of:
A) WomenB) Aboriginal peopleC) Different cultural or racial groupsD) Different religious/faith groupsE) Persons with disabilitiesF) People of different social classes
SometimesOften Rarely NeverAll thetime
Page 2/4
17. In this school, people of different backgrounds are seen and/or heard in the:
A) Pictures or posters in the school.B) Displays of student work.C) Materials teachers use in class (e.g., books and videos).D) Topics we study in class.E) Extra-curricular activities.F) School publications (e.g., yearbooks and newspapers).G) Special events and celebrations.
18. Learning more about my own cultural or racial background at school would:
A) Make learning more interesting for me.B) Help me do better in school.C) Help me enjoy school more.D) Make no difference to me.
StronglyAgree Agree Disagree
StronglyDisagree Not Sure
StronglyAgree Agree Disagree
StronglyDisagree Not Sure
19. How do you feel about your school:
A) I enjoy school.B) My school is a friendly and welcoming place.C) My school building is an attractive and great place to learn.D) I get along well with other students in my school.E) I feel accepted by students in my school.
G) Extra help is available at this school when I need it.F) I feel accepted by adults in my school.
If yes, pick as many as apply:Hearing Sight Speech Mobility (e.g., body movement)Learning Mental Health Other:
(People with disabilities are those who may have a continuing difficulty in hearing, speaking, moving around, learning, etc.)11. Do you have a disability which has been assessed by a doctor or by your school: Yes No
Father only Mother only Two parents Father and Step-motherMother and Step-father Half of the time with each of my parentsFoster parents On my own Adult relatives or guardiansGroup home adults Friends Other
12. Who are the adult caregivers you live with most of the time: (Pick one only.)
13. What level(s) of education have your parents or caregivers completed (in Canada or in any other country):
14. What is your parents' or caregivers' employment: (Pick only one for each parent/caregiver.)
15. If your parents or caregivers work, what are their jobs: (Write WHAT they do, NOT WHERE they work.)
- My mother has completed: High School College University I don't know- My father has completed: High School College University I don't know- My other caregiver has completed: High School College University I don't know
I don't know
I don't know
I don't know
- My mother is: Employed full-time Employed part-time Unemployed A stay-at-home parent Retired I don't know- My father is: Employed full-time Employed part-time Unemployed A stay-at-home parent Retired I don't know- My other caregiver is: Employed full-time Employed part-time Unemployed A stay-at-home parent Retired I don't know
All thetime Often Sometimes Rarely Never
- My mother's job is:
- My father's job is:
- My other caregiver's job is:
Student ID:
497121227
46

22. In school, have you ever experienced the following:
A) Threats to hurt you.B) Physical bullying by an individual.C) Physical bullying by a group or a gang.D) Insults or name calling.E) Theft or destruction of your personal property.F) Being excluded or shut out from a group.
Page 3/4
If you have been threatened, bullied or harmed by anyone at school do you think it is because of:(You may pick more than one reason.)
Your aboriginal backgroundYour genderYour cultural or racial backgroundYour language backgroundYour religion or faith backgroundYour family income level (high, middle or low)
Your sexual orientationYour disabilityYour body image (how you look)Your grades or marksOther reason(s)
If you answered "all the time", skip to Question 24.All the time Most of the time Sometimes Rarely Unsure
23. How often do you feel the school rules have been fairly applied to you:
If the school rules have not been fairly applied to you, do you think it is because of:(You may pick more than one reason.)
Your aboriginal backgroundYour genderYour cultural or racial backgroundYour language backgroundYour religion or faith background
Your family income level (high, middle or low)Your disabilityYour body image (how you look)Your grades or marksOther reason(s)
20. This school offers extracurricular activities that I am interested in:Yes No Not sure
21. Do you feel safe:
A) In the classroom.B) In other parts of the school building (e.g., cafeteria, washroom, hallways).C) Outside on school property (e.g., schoolyard, playing field, school parking lot).D) On your street or in your neighbourhood.E) When communicating on the internet (e.g., email, text messaging, chat rooms etc.).
SometimesOften Rarely NeverAll thetime
G) Other:
If you answered "All the time", "Often", or "Sometimes" to any of the above in Question 22, please continue with thefollowing sub-question. Otherwise, go to Question 23.
24. How often do you feel comfortable discussing personal problems with:
A) Your teachersB) Your guidance counsellor(s)C) Your principal or vice-principal(s)D) Your friendsE) Your parents or caregiversF) Other family members or relatives
SometimesOften Rarely NeverAll thetime
G) Other:
25. How often do you feel comfortable:
A) Answering questions in classB) Speaking up in class to give your opinionC) Participating in class activities and discussions
All thetime Often Sometimes Rarely Never
SometimesOften Rarely NeverAll thetime
Student ID:
9437212277471
47

Yes No I don't know26. Have you ever had your eyesight tested by a doctor:
Yes No I don't know
27. Have you ever had your hearing tested by a doctor:
28. How often do you take part in the following types of extracurricular activities in school:
A) Arts (e.g., visual arts, drama, dance)B) Cultural group activitiesC) Music (e.g., band, choir)D) School clubs (e.g., chess, environment)E) Sports (including house leagues, sport teams)F) Student council activitiesG) Student publications (e.g., yearbook, newspaper, magazine) H) School special events (e.g., dances, concerts)
J) Other:
29. How often do you take part in the following types of activites outside of school?
A) Arts (e.g., visual arts, drama, dance)B) Cultural group activitiesC) Music (e.g., piano lessons, band, choir)D) ClubsE) Religious activitiesF) Sports (e.g., swimming lessons, community sport teams)G) Volunteer ActivitiesH) Leadership programsI) Other:
I) Leadership programs
Weekly Monthly A few timesthis year Never
Weekly MonthlyA few times
this year Never
30. What awards, certificates or recognition have you received in school: (pick all that apply to you.)None yetAcademicCitizenshipLeadershipMusic
Arts (e.g., visual arts, drama, dance)Language(s)MathematicsSports
Design and TechnologyCharitable or humanitarian activitiesScienceOther:
31. What awards, certificates or recognition have you received outside of school: (pick all that apply to you.)
None yetAcademicVolunteerEnvironmentLeadershipMusic
Charitable or humanitarian activitiesSports/RecreationArts (e.g., visual arts, drama, dance)Other:
32. How do you rate yourself in each of the following areas:
A) Oral communicationB) ReadingC) WritingD) MathE) TechnologyF) Social skills (e.g., getting along with others)G) Problem solving (e.g., finding ways to solve personal/social problems)H) Leadership (e.g., leading a group or team)
AverageGood Weak Not sureExcellent
33. How would you rate your own progress at school:Excellent Good Fair/Average Having Difficulty
Thank you for your participation!
Page 4/4
Student ID:
298621227948
48

3. What is the first language(s) you learned to speak at home: (Pick all that apply to you.)
Page 1/4
GRADE 7/8 STUDENT CENSUS: FORM B (06-07)
7. Are you of Aboriginal background: Yes No(If "No" go to Question 8; if "Yes", pick one of the following.)
Instructions for filling out form: For optimumaccuracy, please use a black pen or dark pencil.
Organizational Development
Home Room:School Name:
THE TORONTO DISTRICT SCHOOL BOARD INVITES YOU TO COMPLETE THIS STUDENT CENSUS.
The Census is VOLUNTARY. The Census is CONFIDENTIAL. Your name and your answers will not be shared withanyone. Please answer the questions as completely and accurately as possible. THANK YOU for your cooperation.
QUESTIONS ABOUT ME
1. Year of birth:
AlbanianArabicBengaliChinese
DariEnglishFrenchGreek
GujaratiHindiKoreanOjibway
Persian (Farsi)PortuguesePunjabiRussian
SerbianSomaliSpanishTagalog
TamilUrduVietnameseOther(s):
4. What is the language(s) most often spoken in your home: (Pick all that apply to you.)
5. Where were you born:AlbaniaAfghanistanBangladeshCanada
ChinaGuyanaHong KongIndia
IranJamaicaPakistanPhilippines
RomaniaRussiaSomaliaSouth Korea
Sri LankaUkraineUnited StatesVietnam
YugoslaviaOther:
Inuit First Nations (or Indian as defined in the Indian Act) Non-status IndianMetis Aboriginal person from outside Canada Other
8. Do you identify yourself as Canadian: Yes No(You do not have to be born in Canada to think of yourself as Canadian.)
9. Which of the following best describes your racial identity: (Pick one only.)AboriginalAsian - East (e.g., China, Japan, Korea)
Asian - South (e.g., India, Pakistan, Sri Lanka)Asian - South East (e.g., Malaysia, Philippines, Vietnam)Black - Africa (e.g., Ghana, Kenya, Somalia)Black - CanadaBlack - Caribbean Region (e.g., Jamaica, Trinidad and Tobago)
Latin American (e.g., Argentina, Chile, Costa Rica)Indian-Caribbean (i.e., Guyana with origins in India)
Middle Eastern (e.g., Egypt, Iran, Israel, Palestine)Mixed background:White - CanadaWhite - Europe (e.g., England, Greece, Italy, Portugal, Serbia)Other(s):
(entirely black out your name when you are done)
6. Where were your parents or caregivers born: (Pick two if your parents/caregivers were born in different countries.)
10. What is your ethnic or cultural background:
(For example, African, Arab, Canadian, Chilean, Chinese, Cree, Dutch, East Indian, East African, English, Filipino, French,French-Canadian, German, Greek, Grenadian, Inuit, Irish, Italian, Jamaican, Lebanese, Metis, Micmac, Mohawk, Ojibway, Polish,Portuguese, Russian, Scottish, Somali, Ukrainian, Vietnamese, West African etc.)
(Please write in the box - do not circle the examples below. You may write more than one.)
2. Are you: Female Male
AlbanianArabicBengaliChinese
DariEnglishFrenchGreek
GujaratiHindiKoreanOjibway
Persian (Farsi)PortuguesePunjabiRussian
SerbianSomaliSpanishTagalog
TamilUrduVietnameseOther(s):
AlbaniaAfghanistanBangladeshCanada
ChinaGuyanaHong KongIndia
IranJamaicaPakistanPhilippines
RomaniaRussiaSomaliaSouth Korea
Sri LankaUkraineUnited StatesVietnam
YugoslaviaOther:
Student ID:School ID:
Student Name:
49

If yes, pick as many as apply:Hearing Sight Speech Mobility (e.g., body movement)Learning Mental Health Other:
(People with disabilities are those who may have a continuing difficulty in hearing, speaking, moving around, learning, etc.)11. Do you have a disability which has been assessed by a doctor or by your school: Yes No
Father only Mother only Two parents Father and Step-motherMother and Step-father Half of the time with each of my parentsFoster parents On my own Adult relatives or guardiansGroup home adults Friends Other
12. Who are the adult caregivers you live with most of the time: (Pick one only.)
QUESTIONS ABOUT MY LIFE IN SCHOOL AND OUTSIDE OF SCHOOL16. How do you feel about your school:
A) I enjoy school.B) My school is a friendly and welcoming place.C) My school building is an attractive and great place to learn.D) I get along well with other students in my school.E) I feel accepted by students in my school.
G) Extra help is available at this school when I need it.F) I feel accepted by adults in my school.
SometimesOften Rarely NeverAll thetime
Page 2/4
13. What level(s) of education have your parents or caregivers completed (in Canada or in any other country):
14. What is your parents' or caregivers' employment: (Pick only one for each parent/caregiver.)
15. If your parents or caregivers work, what are their jobs: (Write WHAT they do, NOT WHERE they work.)
17. Are there school activities that you would like to take part in but do not feel welcome:
b) If you do not feel welcome, do you think that it is because of: (Pick all that apply.)Your aboriginal backgroundYour genderYour cultural or racial backgroundYour language backgroundYour religion or faith background
Your family income level (high, middle or low)Your disabilityYour body image (how you look)Your grades or marksOther reason(s)
(If you answered "same as everyone else", skip to question 19).Same as everyone else Better than others Worse than others
18. How do you feel that you are treated by the adults in your school:
b) Do you think you are treated differently because of: (Pick all that apply.)
Your aboriginal backgroundYour genderYour cultural or racial backgroundYour language backgroundYour religion or faith background
Your family income level (high, middle or low)Your disabilityYour body image (how you look)Your grades or marksOther reason(s)
- My mother has completed: High School College University I don't know- My father has completed: High School College University I don't know- My other caregiver has completed: High School College University I don't know
I don't know
I don't know
I don't know
- My mother is: Employed full-time Employed part-time Unemployed A stay-at-home parent Retired I don't know- My father is: Employed full-time Employed part-time Unemployed A stay-at-home parent Retired I don't know- My other caregiver is: Employed full-time Employed part-time Unemployed A stay-at-home parent Retired I don't know
Yes No (If you answered "No", skip to question 18).
- My mother's job is:
- My father's job is:
- My other caregiver's job is:
Student ID:
7083060891
50
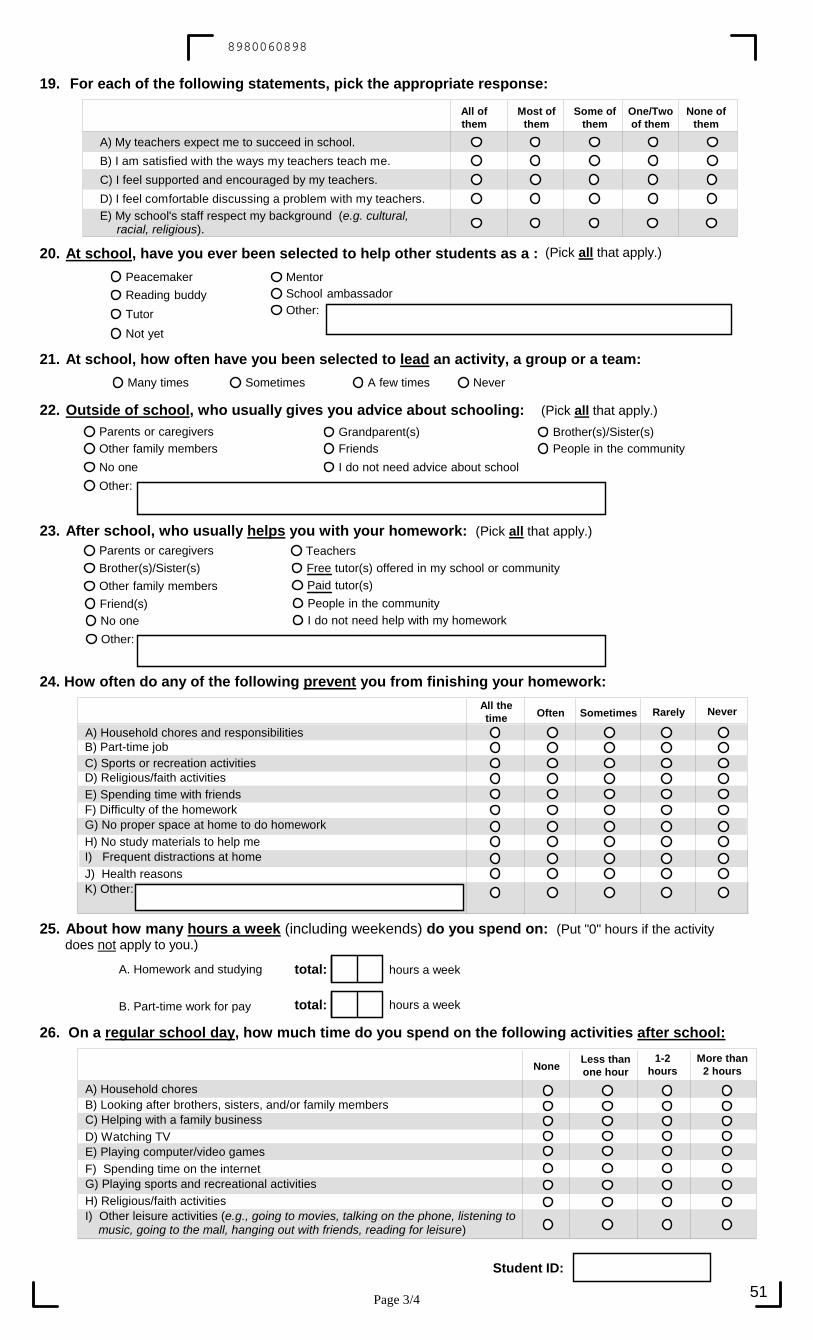
Page 3/4
19. For each of the following statements, pick the appropriate response:
A) My teachers expect me to succeed in school.
E) My school's staff respect my background (e.g. cultural, racial, religious).
B) I am satisfied with the ways my teachers teach me.C) I feel supported and encouraged by my teachers. D) I feel comfortable discussing a problem with my teachers.
Peacemaker MentorReading buddy School ambassador
Tutor Other:
Not yet
Many times Sometimes A few times Never
21. At school, how often have you been selected to lead an activity, a group or a team:
Parents or caregivers Grandparent(s) Brother(s)/Sister(s)Other family members Friends People in the communityNo one I do not need advice about schoolOther:
22. Outside of school, who usually gives you advice about schooling: (Pick all that apply.)
23. After school, who usually helps you with your homework: (Pick all that apply.)
20. At school, have you ever been selected to help other students as a : (Pick all that apply.)
24. How often do any of the following prevent you from finishing your homework:
A) Household chores and responsibilitiesB) Part-time jobC) Sports or recreation activities
E) Spending time with friends F) Difficulty of the homeworkG) No proper space at home to do homework
J) Health reasons K) Other:
D) Religious/faith activities
H) No study materials to help meI) Frequent distractions at home
A. Homework and studying
25. About how many hours a week (including weekends) do you spend on: (Put "0" hours if the activity does not apply to you.)
B. Part-time work for pay total: hours a week
total: hours a week
All thetime Often Sometimes Rarely Never
26. On a regular school day, how much time do you spend on the following activities after school:
A) Household choresB) Looking after brothers, sisters, and/or family membersC) Helping with a family business D) Watching TVE) Playing computer/video gamesF) Spending time on the internetG) Playing sports and recreational activities
I) Other leisure activities (e.g., going to movies, talking on the phone, listening to music, going to the mall, hanging out with friends, reading for leisure)
H) Religious/faith activities
None Less thanone hour
1-2hours
More than2 hours
All ofthem
Most ofthem
Some ofthem
One/Twoof them
None ofthem
Parents or caregivers TeachersBrother(s)/Sister(s) Free tutor(s) offered in my school or communityOther family members Paid tutor(s)Friend(s) People in the communityNo one I do not need help with my homeworkOther:
Student ID:
8980060898
51
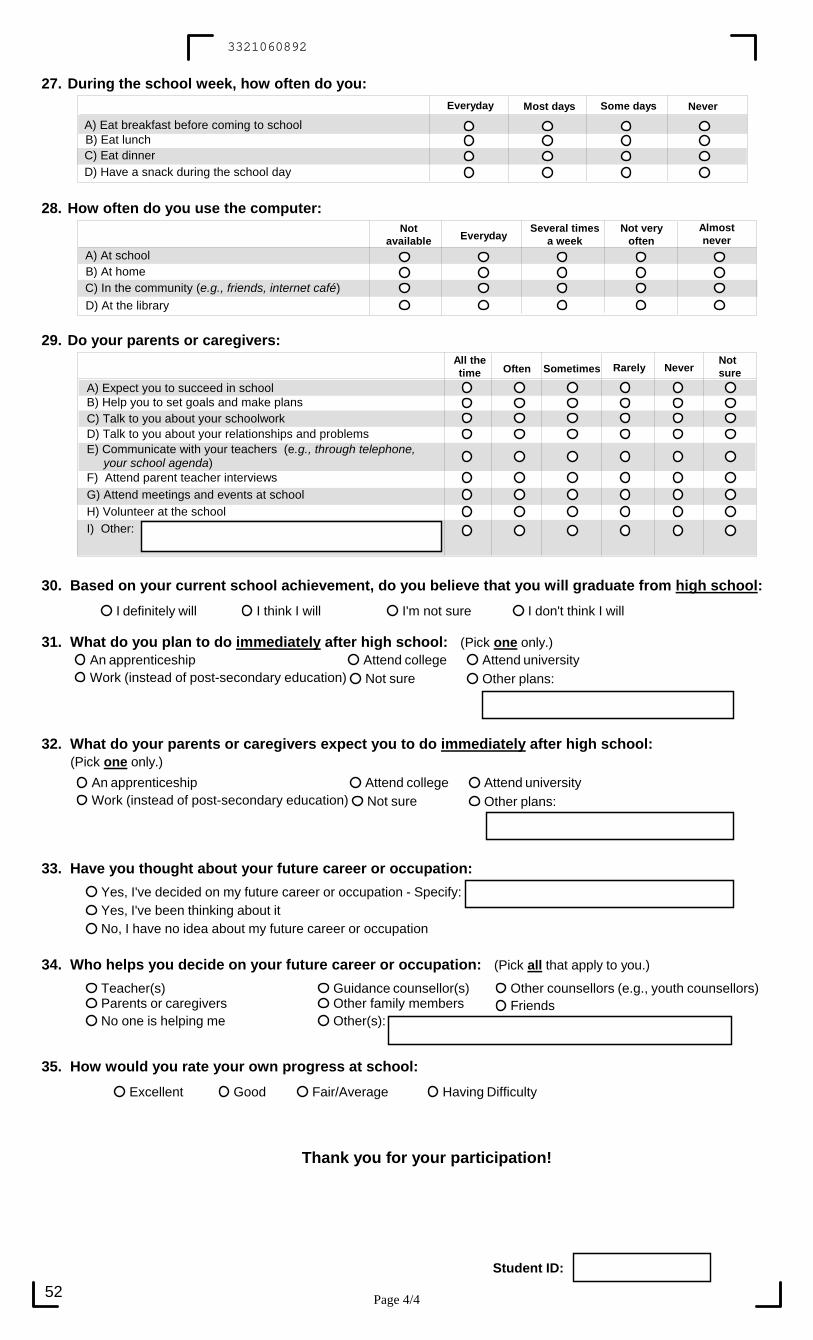
Page 4/4
27. During the school week, how often do you:
A) Eat breakfast before coming to schoolB) Eat lunchC) Eat dinner D) Have a snack during the school day
28. How often do you use the computer:
A) At schoolB) At home C) In the community (e.g., friends, internet café)D) At the library
29. Do your parents or caregivers:
A) Expect you to succeed in schoolB) Help you to set goals and make plansC) Talk to you about your schoolworkD) Talk to you about your relationships and problemsE) Communicate with your teachers (e.g., through telephone, your school agenda)F) Attend parent teacher interviewsG) Attend meetings and events at school H) Volunteer at the school I) Other:
35. How would you rate your own progress at school:Excellent Good Fair/Average Having Difficulty
Thank you for your participation!
Everyday Most days Some days Never
I definitely will I think I will I'm not sure I don't think I will
30. Based on your current school achievement, do you believe that you will graduate from high school:
An apprenticeship Attend college Attend universityWork (instead of post-secondary education) Not sure Other plans:
31. What do you plan to do immediately after high school: (Pick one only.)
33. Have you thought about your future career or occupation:Yes, I've decided on my future career or occupation - Specify:Yes, I've been thinking about itNo, I have no idea about my future career or occupation
34. Who helps you decide on your future career or occupation: (Pick all that apply to you.)
An apprenticeship Attend college Attend universityWork (instead of post-secondary education) Not sure Other plans:
32. What do your parents or caregivers expect you to do immediately after high school: (Pick one only.)
Notavailable Everyday
Several timesa week
Not veryoften
Almostnever
All thetime Often Sometimes Rarely Never
Notsure
Student ID:
Teacher(s) Guidance counsellor(s) Other counsellors (e.g., youth counsellors)Parents or caregivers Other family members FriendsNo one is helping me Other(s):
3321060892
52

3. What is the first language(s) you learned to speak at home: (Pick all that apply to you.)
Page 1/4
GRADE 9-12 STUDENT CENSUS: FORM A (06-07)
7. Are you of Aboriginal background: Yes No(If "No" go to Question 8; if "Yes", pick one of the following.)
Instructions for filling out form: For optimumaccuracy, please use a black pen or dark pencil.
Organizational Development
Home Room:School Name:
THE TORONTO DISTRICT SCHOOL BOARD INVITES YOU TO COMPLETE THIS STUDENT CENSUS.
The Census is VOLUNTARY. The Census is CONFIDENTIAL. Your name and your answers will not be shared withanyone. Please answer the questions as completely and accurately as possible. THANK YOU for your cooperation.
QUESTIONS ABOUT ME
1. Year of birth:
AlbanianArabicBengaliChinese
DariEnglishFrenchGreek
GujaratiHindiKoreanOjibway
Persian (Farsi)PortuguesePunjabiRussian
SerbianSomaliSpanishTagalog
TamilUrduVietnameseOther(s):
4. What is the language(s) most often spoken in your home: (Pick all that apply to you.)
5. Where were you born:AlbaniaAfghanistanBangladeshCanada
ChinaGuyanaHong KongIndia
IranJamaicaPakistanPhilippines
RomaniaRussiaSomaliaSouth Korea
Sri LankaUkraineUnited StatesVietnam
YugoslaviaOther:
Inuit First Nations (or Indian as defined in the Indian Act) Non-status IndianMetis Aboriginal person from outside Canada Other
8. Do you identify yourself as Canadian: Yes No(You do not have to be born in Canada to think of yourself as Canadian.)
9. Which of the following best describes your racial identity: (Pick one only.)AboriginalAsian - East (e.g., China, Japan, Korea)
Asian - South (e.g., India, Pakistan, Sri Lanka)Asian - South East (e.g., Malaysia, Philippines, Vietnam)Black - Africa (e.g., Ghana, Kenya, Somalia)Black - CanadaBlack - Caribbean Region (e.g., Jamaica, Trinidad and Tobago)
Latin American (e.g., Argentina, Chile, Costa Rica)Indian-Caribbean (i.e., Guyana with origins in India)
Middle Eastern (e.g., Egypt, Iran, Israel, Palestine)Mixed background:White - CanadaWhite - Europe (e.g., England, Greece, Italy, Portugal, Serbia)Other(s):
(entirely black out your name when you are done)
6. Where were your parents or caregivers born: (Pick two if your parents/caregivers were born in different countries.)
10. What is your ethnic or cultural background:
(For example, African, Arab, Canadian, Chilean, Chinese, Cree, Dutch, East Indian, East African, English, Filipino, French,French-Canadian, German, Greek, Grenadian, Inuit, Irish, Italian, Jamaican, Lebanese, Metis, Micmac, Mohawk, Ojibway, Polish,Portuguese, Russian, Scottish, Somali, Ukrainian, Vietnamese, West African etc.)
(Please write in the box - do not circle the examples below. You may write more than one.)
2. Are you? Female Male
AlbanianArabicBengaliChinese
DariEnglishFrenchGreek
GujaratiHindiKoreanOjibway
Persian (Farsi)PortuguesePunjabiRussian
SerbianSomaliSpanishTagalog
TamilUrduVietnameseOther(s):
AlbaniaAfghanistanBangladeshCanada
ChinaGuyanaHong KongIndia
IranJamaicaPakistanPhilippines
RomaniaRussiaSomaliaSouth Korea
Sri LankaUkraineUnited StatesVietnam
YugoslaviaOther:
Student ID:School ID:
Student Name:
53

If yes, pick as many as apply:Hearing Sight Speech Mobility (e.g., body movement)Learning Mental Health Other:
(People with disabilities are those who may have a continuing difficulty in hearing, speaking, moving around, learning, etc.)11. Do you have a disability which has been assessed by a doctor or by your school: Yes No
Father only Mother only Two parents Father and Step-motherMother and Step-father Half of the time with each of my parentsFoster parents On my own Adult relatives or guardiansGroup home adults Friends Other
13. Who are the adult caregivers you live with most of the time: (Pick one only.)
QUESTIONS ABOUT MY LIFE IN SCHOOL AND OUTSIDE OF SCHOOL17. In this school, how often have you learned about the experiences and/or achievements of:
A) Women.B) Aboriginal people.C) Different cultural or racial groups.D) Different religious/faith groups.E) Persons with disabilities.
G) People of different social classes.F) Gay, lesbian, bisexual, transgender, transsexual or two-spirited people.
SometimesOften Rarely NeverAll thetime
Page 2/4
14. What level(s) of education have your parents or caregivers completed (in Canada or in any other country):
15. What is your parents' or caregivers' employment: (Pick only one for each parent/caregiver.)
16 If your parents or caregivers work, what are their jobs: (Write WHAT they do, NOT WHERE they work.)
- My mother has completed: High School College University I don't know- My father has completed: High School College University I don't know- My other caregiver has completed: High School College University I don't know
I don't know
I don't know
I don't know
- My mother is: Employed full-time Employed part-time Unemployed A stay-at-home parent Retired I don't know- My father is: Employed full-time Employed part-time Unemployed A stay-at-home parent Retired I don't know- My other caregiver is: Employed full-time Employed part-time Unemployed A stay-at-home parent Retired I don't know
18. In this school, people of different backgrounds are seen and/or heard in the:
A) Pictures or posters in the school.B) Displays of student work.C) Materials teachers use in class (e.g., books and videos).D) Topics we study in class.E) Extra-curricular activities.F) School publications (e.g., yearbooks and newspapers).G) Special events and celebrations.
19. Learning more about my own cultural or racial background at school would:
A) Make learning more interesting for me.B) Help me do better in school.C) Help me enjoy school more.D) Make no difference to me.
StronglyAgree Agree Disagree
StronglyDisagree Not Sure
StronglyAgree Agree Disagree
StronglyDisagree Not Sure
12. How do you identify your sexual orientation: (You may pick more than one).
- My mother's job is:
- My father's job is:
- My other caregiver's job is:
Heterosexual (straight)LesbianGay
BisexualTransgenderTransexual
QueerTwo-spiritedQuestioning
Not sure
Student ID:
1207600488
54

20. How do you feel about your school:
A) I enjoy school.B) My school is a friendly and welcoming place.C) My school building is an attractive and great place to learn.D) I get along well with other students in my school.E) I feel accepted by students in my school.
G) Extra help is available at this school when I need it.F) I feel accepted by adults in my school.
SometimesOften Rarely NeverAll thetime
21. This school offers:
23. In school, have you ever experienced the following:
A) Threats to hurt you.B) Physical bullying by an individual.C) Physical bullying by a group or a gang.D) Insults or name calling.E) Theft or destruction of your personal property.F) Being excluded or shut out from a group.
SometimesOften Rarely NeverAll thetime
If you have been threatened, bullied or harmed by anyone at school do you think it is because of:(You may pick more than one reason.)
Your aboriginal backgroundYour genderYour cultural or racial backgroundYour language backgroundYour religion or faith background
Your family income level (high, middle or low)Your sexual orientationYour disabilityYour body image (how you look)Your grades or marks
Other reason(s)
If you answered "all the time", skip to Question 25.All the time Most of the time Sometimes Rarely Unsure
24. How often do you feel the school rules have been fairly applied to you:
If the school rules have not been fairly applied to you, do you think it is because of:(You may pick more than one reason.)
Your aboriginal backgroundYour genderYour cultural or racial backgroundYour language backgroundYour religion or faith background
Your family income level (high, middle or low)Your sexual orientationYour disabilityYour body image (how you look)Your grades or marks
Other reason(s)
22. Do you feel safe:
A) In the classroom.B) In other parts of the school building (e.g., cafeteria, washroom, hallways).C) Outside on school property (e.g., schoolyard, playing field, school parking lot).D) On your street or in your neighbourhood.E) When communicating on the internet (e.g., email, text messaging, chat rooms etc.).
G) Other:
If you answered "All the time", "Often", or "Sometimes" to any of the above in Question 23, please continue with thefollowing sub-question. Otherwise, go to Question 24.
25. How often do you feel comfortable discussing personal problems with:
A) Your teachersB) Your guidance counsellor(s)C) Your principal or vice-principal(s)D) Your friendsE) Your parents or caregiversF) Other family members or relatives
SometimesOften Rarely NeverAll thetime
G) Other:
Page 3/4
Yes No Not sureA) Courses that I need.B) Specialized courses that I need.C) Extracurricular activities that I am interested in.
All thetime Often Sometimes Rarely Never
Student ID:
2719600487
55

Page 4/4
26. How often do you feel comfortable:
A) Answering questions in classB) Speaking up in class to give your opinionC) Participating in class activities and discussions
SometimesOften Rarely NeverAll thetime
27. How often do you take part in the following types of extracurricular activities in school:
A) Arts (e.g., visual arts, drama, dance)B) Cultural group activitiesC) Music (e.g., band, choir)D) School clubs (e.g., chess, environment)E) Sports (including house leagues, sport teams)F) Student council activitiesG) Student publications (e.g., yearbook, newspaper, magazine) H) School special events (e.g., dances, concerts)
J) Other:
28. How often do you take part in the following types of activites outside of school?
A) Arts (e.g., visual arts, drama, dance)B) Cultural group activitiesC) Music (e.g., piano lessons, band, choir)D) ClubsE) Religious activitiesF) Sports (e.g., swimming lessons, community sport teams)G) Volunteer ActivitiesH) Leadership programsI) Other:
I) Leadership programs
29. What awards, certificates or recognition have you received in school: (pick all that apply to you.)None yetAcademicCitizenshipLeadershipMusic
Arts (e.g., visual arts, drama, dance)Language(s)MathematicsSports
Design and TechnologyCharitable or humanitarian activitiesScienceOther:
30. What awards, certificates or recognition have you received outside of school: (pick all that apply to you.)
None yetAcademicVolunteerEnvironmentLeadershipMusic
Charitable or humanitarian activitiesSports/RecreationArts (e.g., visual arts, drama, dance)Other:
31. How do you rate yourself in each of the following areas:
A) Oral communicationB) ReadingC) WritingD) MathE) TechnologyF) Social skills (e.g., getting along with others)G) Problem solving (e.g., finding ways to solve personal/social problems)H) Leadership (e.g., leading a group or team)
32. How would you rate your own progress at school:Excellent Good Fair/Average Having Difficulty
Thank you for your participation!
Excellent Good Average Weak Not sure
Weekly Monthly NeverA few times
this year
Weekly Monthly NeverA few timesthis year
Student ID:
118360048156
56
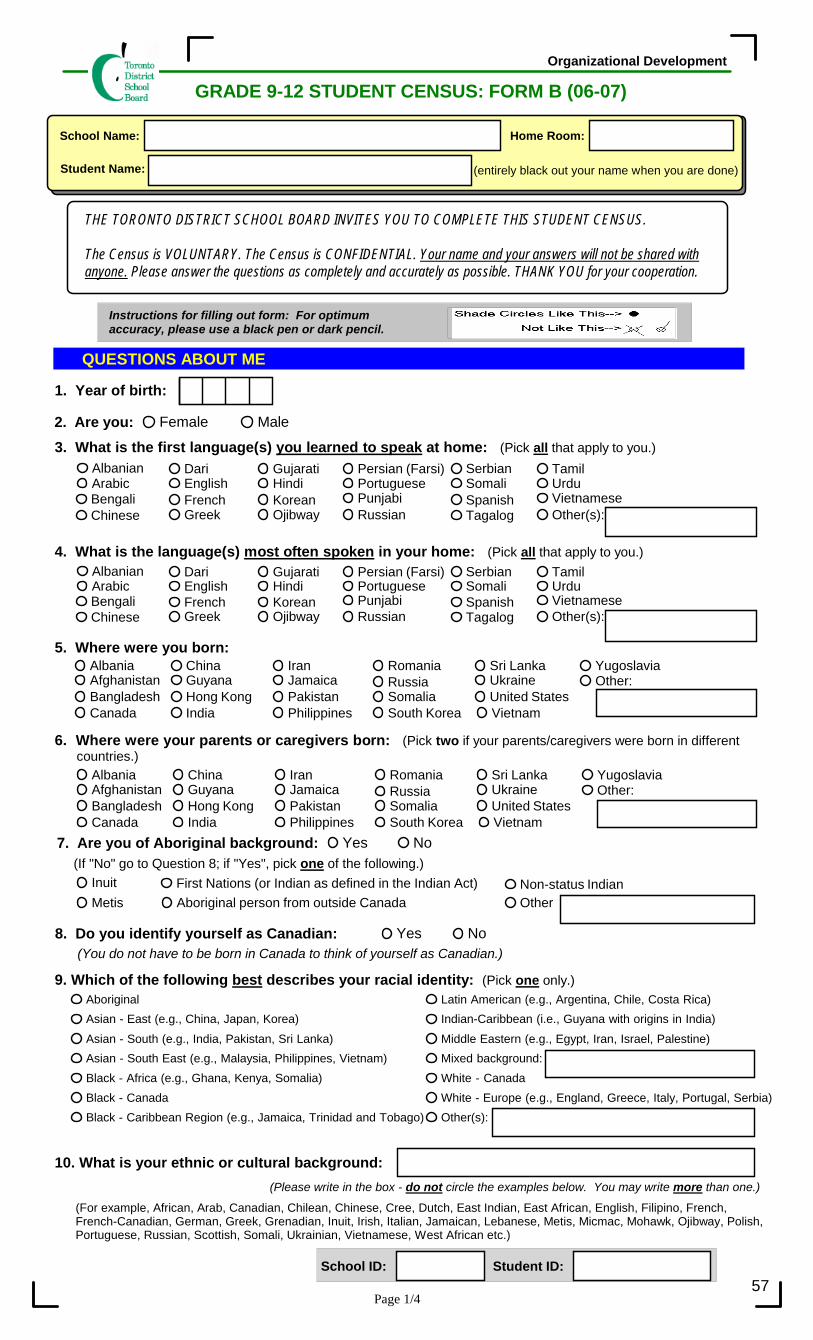
3. What is the first language(s) you learned to speak at home: (Pick all that apply to you.)
Page 1/4
GRADE 9-12 STUDENT CENSUS: FORM B (06-07)
7. Are you of Aboriginal background: Yes No(If "No" go to Question 8; if "Yes", pick one of the following.)
Instructions for filling out form: For optimumaccuracy, please use a black pen or dark pencil.
Organizational Development
Home Room:School Name:
THE TORONTO DISTRICT SCHOOL BOARD INVITES YOU TO COMPLETE THIS STUDENT CENSUS.
The Census is VOLUNTARY. The Census is CONFIDENTIAL. Your name and your answers will not be shared withanyone. Please answer the questions as completely and accurately as possible. THANK YOU for your cooperation.
QUESTIONS ABOUT ME
1. Year of birth:
AlbanianArabicBengaliChinese
DariEnglishFrenchGreek
GujaratiHindiKoreanOjibway
Persian (Farsi)PortuguesePunjabiRussian
SerbianSomaliSpanishTagalog
TamilUrduVietnameseOther(s):
4. What is the language(s) most often spoken in your home: (Pick all that apply to you.)
5. Where were you born:AlbaniaAfghanistanBangladeshCanada
ChinaGuyanaHong KongIndia
IranJamaicaPakistanPhilippines
RomaniaRussiaSomaliaSouth Korea
Sri LankaUkraineUnited StatesVietnam
YugoslaviaOther:
Inuit First Nations (or Indian as defined in the Indian Act) Non-status IndianMetis Aboriginal person from outside Canada Other
8. Do you identify yourself as Canadian: Yes No(You do not have to be born in Canada to think of yourself as Canadian.)
9. Which of the following best describes your racial identity: (Pick one only.)AboriginalAsian - East (e.g., China, Japan, Korea)
Asian - South (e.g., India, Pakistan, Sri Lanka)Asian - South East (e.g., Malaysia, Philippines, Vietnam)Black - Africa (e.g., Ghana, Kenya, Somalia)Black - CanadaBlack - Caribbean Region (e.g., Jamaica, Trinidad and Tobago)
Latin American (e.g., Argentina, Chile, Costa Rica)Indian-Caribbean (i.e., Guyana with origins in India)
Middle Eastern (e.g., Egypt, Iran, Israel, Palestine)Mixed background:White - CanadaWhite - Europe (e.g., England, Greece, Italy, Portugal, Serbia)Other(s):
(entirely black out your name when you are done)
6. Where were your parents or caregivers born: (Pick two if your parents/caregivers were born in different countries.)
10. What is your ethnic or cultural background:
(For example, African, Arab, Canadian, Chilean, Chinese, Cree, Dutch, East Indian, East African, English, Filipino, French,French-Canadian, German, Greek, Grenadian, Inuit, Irish, Italian, Jamaican, Lebanese, Metis, Micmac, Mohawk, Ojibway, Polish,Portuguese, Russian, Scottish, Somali, Ukrainian, Vietnamese, West African etc.)
(Please write in the box - do not circle the examples below. You may write more than one.)
2. Are you: Female Male
AlbanianArabicBengaliChinese
DariEnglishFrenchGreek
GujaratiHindiKoreanOjibway
Persian (Farsi)PortuguesePunjabiRussian
SerbianSomaliSpanishTagalog
TamilUrduVietnameseOther(s):
AlbaniaAfghanistanBangladeshCanada
ChinaGuyanaHong KongIndia
IranJamaicaPakistanPhilippines
RomaniaRussiaSomaliaSouth Korea
Sri LankaUkraineUnited StatesVietnam
YugoslaviaOther:
Student Name:
Student ID:School ID:57

If yes, pick as many as apply:Hearing Sight Speech Mobility (e.g., body movement)Learning Mental Health Other:
(People with disabilities are those who may have a continuing difficulty in hearing, speaking, moving around, learning, etc.)11. Do you have a disability which has been assessed by a doctor or by your school: Yes No
Father only Mother only Two parents Father and Step-motherMother and Step-father Half of the time with each of my parentsFoster parents On my own Adult relatives or guardiansGroup home adults Friends Other
13. Who are the adult caregivers you live with most of the time: (Pick one only.)
QUESTIONS ABOUT MY LIFE IN SCHOOL AND OUTSIDE OF SCHOOL
Page 2/4
14. What level(s) of education have your parents or caregivers completed (in Canada or in any other country):
15. What is your parents' or caregivers' employment: (Pick only one for each parent/caregiver.)
16 If your parents or caregivers work, what are their jobs: (Write WHAT they do, NOT WHERE they work.)
I don't know
I don't know
I don't know
Heterosexual (straight)LesbianGay
BisexualTransgenderTransexual
QueerTwo-spiritedQuestioning
Not sure12. How do you identify your sexual orientation: (You may pick more than one).
17. How do you feel about your school:
A) I enjoy school.B) My school is a friendly and welcoming place.C) My school building is an attractive and great place to learn.D) I get along well with other students in my school.E) I feel accepted by students in my school.
G) Extra help is available at this school when I need it.F) I feel accepted by adults in my school.
18. Are there school activities that you would like to take part in but do not feel welcome:
b) If you do not feel welcome, do you think that it is because of: (Pick all that apply.)Your aboriginal backgroundYour genderYour cultural or racial backgroundYour language backgroundYour religion or faith backgroundYour family income level (high, middle or low)
Your sexual orientationYour disabilityYour body image (how you look)Your grades or marksOther reason(s)
(If you answered "same as everyone else", skip to question 20).Same as everyone else Better than others Worse than others
19. How do you feel that you are treated by the adults in your school:
b) Do you think you are treated differently because of: (Pick all that apply.)
- My mother has completed: High School College University I don't know- My father has completed: High School College University I don't know- My other caregiver has completed: High School College University I don't know
- My mother is: Employed full-time Employed part-time Unemployed A stay-at-home parent Retired I don't know- My father is: Employed full-time Employed part-time Unemployed A stay-at-home parent Retired I don't know- My other caregiver is: Employed full-time Employed part-time Unemployed A stay-at-home parent Retired I don't know
(If you answered "No", skip to question 19).Yes No
- My mother's job is:
- My father's job is:
- My other caregiver's job is:
Your aboriginal backgroundYour genderYour cultural or racial backgroundYour language backgroundYour religion or faith backgroundYour family income level (high, middle or low)
Your sexual orientationYour disabilityYour body image (how you look)Your grades or marksOther reason(s)
All thetime Often Sometimes Rarely Never
Student ID:
5669643199
58

Page 3/4
20. For each of the following statements, pick the appropriate response:
A) My teachers expect me to succeed in school.
E) My school's staff respect my background (e.g. cultural, racial, religious).
B) I am satisfied with the ways my teachers teach me.C) I feel supported and encouraged by my teachers.
D) I feel comfortable discussing a problem with my teachers.
Peacemaker MentorReading buddy School ambassador
Tutor Other:
Not yet
Many times Sometimes A few times Never
22. At school, how often have you been selected to lead an activity, a group or a team:
Parents or caregivers Grandparent(s) Brother(s)/Sister(s)Other family members Friends People in the communityNo one I do not need advice about schoolOther:
23. Outside of school, who usually gives you advice about schooling: (Pick all that apply.)
24. After school, who usually helps you with your homework: (Pick all that apply.)
21. At school, have you ever been selected to help other students as a : (Pick all that apply.)
25. How often do any of the following prevent you from finishing your homework:
A) Household chores and responsibilitiesB) Part-time jobC) Sports or recreation activities
E) Spending time with friends F) Difficulty of the homeworkG) No proper space at home to do homework
J) Health reasons K) Other:
D) Religious/faith activities
H) No study materials to help meI) Frequent distractions at home
A. Homework and studying
26. About how many hours a week (including weekends) do you spend on: (Put "0" hours if the activity does not apply to you.)
B. Part-time work for pay total: hours a week
total: hours a week
All thetime Often Sometimes Rarely Never
27. On a regular school day, how much time do you spend on the following activities after school:
A) Household choresB) Looking after brothers, sisters, and/or family membersC) Helping with a family business D) Watching TVE) Playing computer/video gamesF) Spending time on the internetG) Playing sports and recreational activities
I) Other leisure activities (e.g., going to movies, talking on the phone, listening to music, going to the mall, hanging out with friends, reading for leisure)
H) Religious/faith activities
None Less thanone hour
1-2hours
More than2 hours
Some ofthem
All ofthem
Most ofthem
One/Twoof them
None ofthem
Parents or caregivers TeachersBrother(s)/Sister(s) Free tutor(s) offered in my school or communityOther family members Paid tutor(s)Friend(s) People in the communityNo one I do not need help with my homeworkOther:
Student ID:
743864319559
59

Page 4/4
28. During the school week, how often do you:
A) Eat breakfast before coming to schoolB) Eat lunchC) Eat dinner D) Have a snack during the school day
29. How often do you use the computer:
A) At schoolB) At home C) In the community (e.g., friends, internet café)D) At the library
30. Do your parents or caregivers:
A) Expect you to succeed in schoolB) Help you to set goals and make plansC) Talk to you about your schoolworkD) Talk to you about your relationships and problemsE) Communicate with your teachers (e.g., through telephone, your school agenda)F) Attend parent teacher interviewsG) Attend meetings and events at school H) Volunteer at the school I) Other:
36. How would you rate your own progress at school:Excellent Good Fair/Average Having Difficulty
Thank you for your participation!
Everyday Most days Some days Never
I definitely will I think I will I'm not sure I don't think I will31. Based on your current school achievement, do you believe that you will graduate from high school:
An apprenticeship Attend college Attend universityWork (instead of post-secondary education) Not sure Other plans:
32. What do you plan to do immediately after high school: (Pick one only.)
34. Have you thought about your future career or occupation:Yes, I've decided on my future career or occupation - Specify:Yes, I've been thinking about itNo, I have no idea about my future career or occupation
Teacher(s) Guidance counsellor(s) Other counsellors (e.g., youth counsellors)Parents or caregivers Other family members FriendsNo one is helping me Other(s):
35. Who helps you decide on your future career or occupation: (Pick all that apply to you.)
An apprenticeship Attend college Attend universityWork (instead of post-secondary education) Not sure Other plans:
33. What do your parents or caregivers expect you to do immediately after high school: (Pick one only.)
Notavailable Everyday Several times
a weekNot very
oftenAlmostnever
All thetime Often Sometimes Rarely Never
Notsure
Student ID:
3143643194
60

R04(Mgmt\StudentCensus\2006StudentCensusSystemOverview1)my.3457
61
Appendix B: Board Mandates and Recommendations

R04(Mgmt\StudentCensus\2006StudentCensusSystemOverview1)my.3457
62

R04(Mgmt\StudentCensus\2006StudentCensusSystemOverview1)my.3457
63
On November 17, 2004, as part of a series of motions, the Board decided:
• That staff in consultation with the Ontario Human Rights Commission and educational experts develop research proposals that identify the factors within the school system which may inhibit student achievement. Such factors should include, but not be limited to, differences in gender, race, ethnicity, mother tongue, income and place of residence;
• That in undertaking such research proposals, the Board reaffirm the long-established
fact that there is no correlation between these factors and the inherent capacity of students to learn and achieve success, and that the results of such research and its ensuing recommendations be used to assist the Board in implementing strategies to help all students achieve their fullest potential for success in our schools;
• That as part of the research proposals, staff identify the costs of the program and outline
how the data will be collected and where and when the data will be collected; and • That an advisory committee be established to provide staff with input when developing
the research proposals and that the advisory committee be comprised of three trustees, experts and eminent community representatives, as appointed by the Chair.
In November of 2005, the Advisory Committee made ten recommendations to the Board including:
• The TDSB collect student demographic and social environment data to assist the Board in developing policies and strategies to close the achievement gap between groups of students, as well as to establish a base line of data in order to measure improvements in the educational outcomes for all students;
• The demographic and social environment data and its correlation with student
achievement data and other relevant student information be used by the TDSB for the following purposes:
o Developing programs and services for students who need specific interventions
and support; o Assessing the effectiveness of programs established to address specific student
needs;
o Allocating resources to support students in need; and o Identifying systemic barriers to student achievement and implementing changes
to remove those barriers.
• The TDSB continue to collect data on the gender, age, country of birth, mother tongue, language spoken at home, place of residence of its students and include new data on race, ethnicity, disability, family structure, parent education levels, employment status and occupation;
• The data be collected for students from Junior Kindergarten to Grade 12;

R04(Mgmt\StudentCensus\2006StudentCensusSystemOverview1)my.3457
64
• The data for students from JK to Grade 6 be collected through student registration or
other means completed by parents and guardians; and data for students from Grade 7 to 12 be collected using surveys completed by the students themselves;
• The data collection process be preceded by mechanisms for engaging parents, staff,
students and the larger community in understanding the purposes, use, and desired outcomes of the data collection in order to build shared commitment to effective implementation; and
• The TDSB be extremely diligent in establishing a process and controls to ensure the
confidentiality of the data collected, including ways to securely store the data.
On December 14, 2005, the recommendations of the Advisory Committee and the Staff Committee’s report “Closing the Achievement Gap” were received by the Board and the Board decided:
• That the recommendations of the Advisory Committee on Student Achievement and the staff report “Closing the Achievement Gap” be received and appreciation be expressed to the committee members;
• That data on race, ethnicity, disability, and other factors from all students JK to Grade 12
be collected, through a combination of parent surveys (JK-6) and student surveys (7-12); and
• That implementation begin in October 2006 following an information campaign to build
understanding and expertise among staff, students and parents to facilitate implementation; …

R04(Mgmt\StudentCensus\2006StudentCensusSystemOverview1)my.3457
65
Appendix C: Teacher’s Instructions

R04(Mgmt\StudentCensus\2006StudentCensusSystemOverview1)my.3457
66

R04(Mgmt\StudentCensus\2006StudentCensusSystemOverview1)my.3457
67
Before the Census Week, each teacher received the Teacher’s Guide which included
information about what teachers would receive in their class package, and instructions for
administering the Student Census in their classroom. The Guide also included a list of all of the
questions from the Student Census, and some were accompanied by explanatory notes. The
explanations were based on consultations with teachers and the field testing with students.
Where questions were considered self-explanatory, no explanations were provided. The Guide
concluded with a list of Frequently Asked Questions to assist teachers in answering questions
from students, parents and the community.
Following the instructions provided in the Teacher’s Guide, teachers briefed the students about
the overall purpose of the Student Census using sample text provided in the Guide, and
distributed the individualized forms according to the pre-printed name on the front page. To
ensure confidentiality for students, teachers were instructed to tell students to use one of the
black markers provided to black out their name on the front page prior to placing their completed
Census into the return box at the front of the room. When all students had placed their
completed form in the box, teachers were instructed to close the box and return it to the school
office for delivery to the Research and Information Services department.

R04(Mgmt\StudentCensus\2006StudentCensusSystemOverview1)my.3457
68

R04(Mgmt\StudentCensus\2006StudentCensusSystemOverview1)my.3457
69
Appendix D: Glossary of Terms

R04(Mgmt\StudentCensus\2006StudentCensusSystemOverview1)my.3457
70

R04(Mgmt\StudentCensus\2006StudentCensusSystemOverview1)my.3457
71
Anonymous survey does not collect any personally identifiable information. Therefore, the
responses of individual respondents cannot be linked to other data sources, nor can the data be
tracked overtime.
Confidential survey includes personally identifiable information, which allows individual results
to be linked and tracked with other existing and future data sources. To ensure confidentiality,
careful steps are taken to store and restrict the usage of identifiable data by internal staff for
research purposes only.
Field testing is a way to ensure an instrument is valid, clear and manageable for the target
population before system-wide administration. A small representative sample of the population
is randomly selected to test the instrument in a “real” setting. Any feedback or issues that arise
during the testing are considered for revising and finalizing the instrument before full
implementation.
Matrix sampling is an established sampling method commonly used in large-scale
assessments or surveys. Representative samples of respondents complete only a portion of
the test or questionnaire items. Group results of the full test or survey are obtained to reflect the
overall performance or perception of the target population. The advantage is to collect a large
set of information without making the instrument too long for individual respondents.
SES levels – In this report, family SES is classified into five broad levels based on Pineo-
Porter’s 16 ranked occupational categories. Examples for each of the 5 broad SES levels are
listed below:
1. Professional and senior management – e.g., doctors, lawyers, chief executive officers,
senior managers, school teachers
2. Semi-professional and middle management – e.g., computer programmers, artists,
optometrists, production managers, sales supervisors 3. Skilled/semi-skilled clerical and trades – e.g., secretaries, police officers, carpenters, real
estate salespersons 4. Unskilled clerical and trades – e.g., general office clerks, mail carriers, parking
attendants, messengers 5. Non-remunerative – e.g., retired, unemployed, homemakers.

R04(Mgmt\StudentCensus\2006StudentCensusSystemOverview1)my.3457
72

R04(Mgmt\StudentCensus\2006StudentCensusSystemOverview1)my.3457
73
Appendix E: Data Verification Process

R04(Mgmt\StudentCensus\2006StudentCensusSystemOverview1)my.3457
74
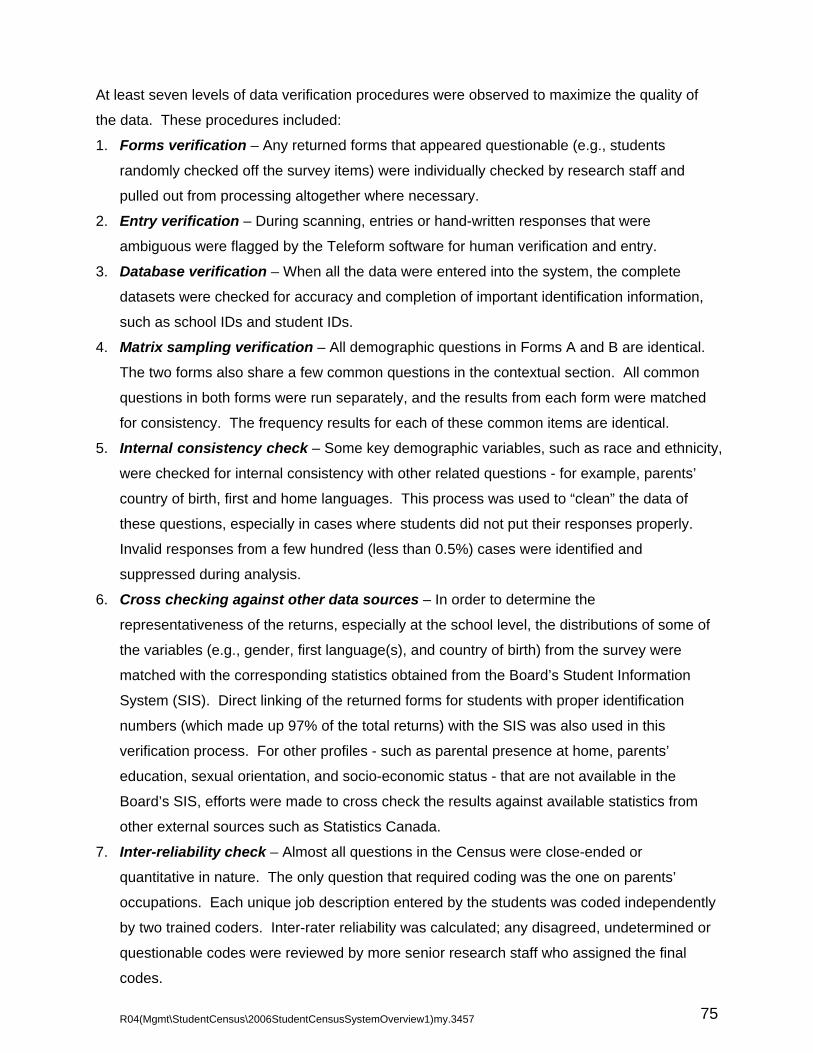
R04(Mgmt\StudentCensus\2006StudentCensusSystemOverview1)my.3457
75
At least seven levels of data verification procedures were observed to maximize the quality of
the data. These procedures included:
1. Forms verification – Any returned forms that appeared questionable (e.g., students
randomly checked off the survey items) were individually checked by research staff and
pulled out from processing altogether where necessary.
2. Entry verification – During scanning, entries or hand-written responses that were
ambiguous were flagged by the Teleform software for human verification and entry.
3. Database verification – When all the data were entered into the system, the complete
datasets were checked for accuracy and completion of important identification information,
such as school IDs and student IDs.
4. Matrix sampling verification – All demographic questions in Forms A and B are identical.
The two forms also share a few common questions in the contextual section. All common
questions in both forms were run separately, and the results from each form were matched
for consistency. The frequency results for each of these common items are identical.
5. Internal consistency check – Some key demographic variables, such as race and ethnicity,
were checked for internal consistency with other related questions - for example, parents’
country of birth, first and home languages. This process was used to “clean” the data of
these questions, especially in cases where students did not put their responses properly.
Invalid responses from a few hundred (less than 0.5%) cases were identified and
suppressed during analysis.
6. Cross checking against other data sources – In order to determine the
representativeness of the returns, especially at the school level, the distributions of some of
the variables (e.g., gender, first language(s), and country of birth) from the survey were
matched with the corresponding statistics obtained from the Board’s Student Information
System (SIS). Direct linking of the returned forms for students with proper identification
numbers (which made up 97% of the total returns) with the SIS was also used in this
verification process. For other profiles - such as parental presence at home, parents’
education, sexual orientation, and socio-economic status - that are not available in the
Board’s SIS, efforts were made to cross check the results against available statistics from
other external sources such as Statistics Canada.
7. Inter-reliability check – Almost all questions in the Census were close-ended or
quantitative in nature. The only question that required coding was the one on parents’
occupations. Each unique job description entered by the students was coded independently
by two trained coders. Inter-rater reliability was calculated; any disagreed, undetermined or
questionable codes were reviewed by more senior research staff who assigned the final
codes.

R04(Mgmt\StudentCensus\2006StudentCensusSystemOverview1)my.3457
76

R04(Mgmt\StudentCensus\2006StudentCensusSystemOverview1)my.3457
77
Appendix F: Student Responses to All Census Questions

R04(Mgmt\StudentCensus\2006StudentCensusSystemOverview1)my.3457
78

(A) DEMOGRAPHIC PROFILE
GenderRacial BackgroundSexual OrientationDisabilityCanadian IdentityParents' Place of BirthParental Presence at HomeMother's Education BackgroundFather's Education BackgroundMother's Employment StatusFather's Employment StatusFamily Socio-economic Status (SES)
(B) QUESTIONS ABOUT MY LIFE IN SCHOOL AND OUTSIDE OF SCHOOL
1. School Climate2. Relationships with School Adults3. School Safety 4. Inclusive School Experiences5. Extra-Curricular Activities 6. Homework 7. After-School Activities 8. Home Support 9. Student Self-Evaluation & Achievement 10. Post-Secondary Aspirations
TDSB Student Census (Fall 2006)
79
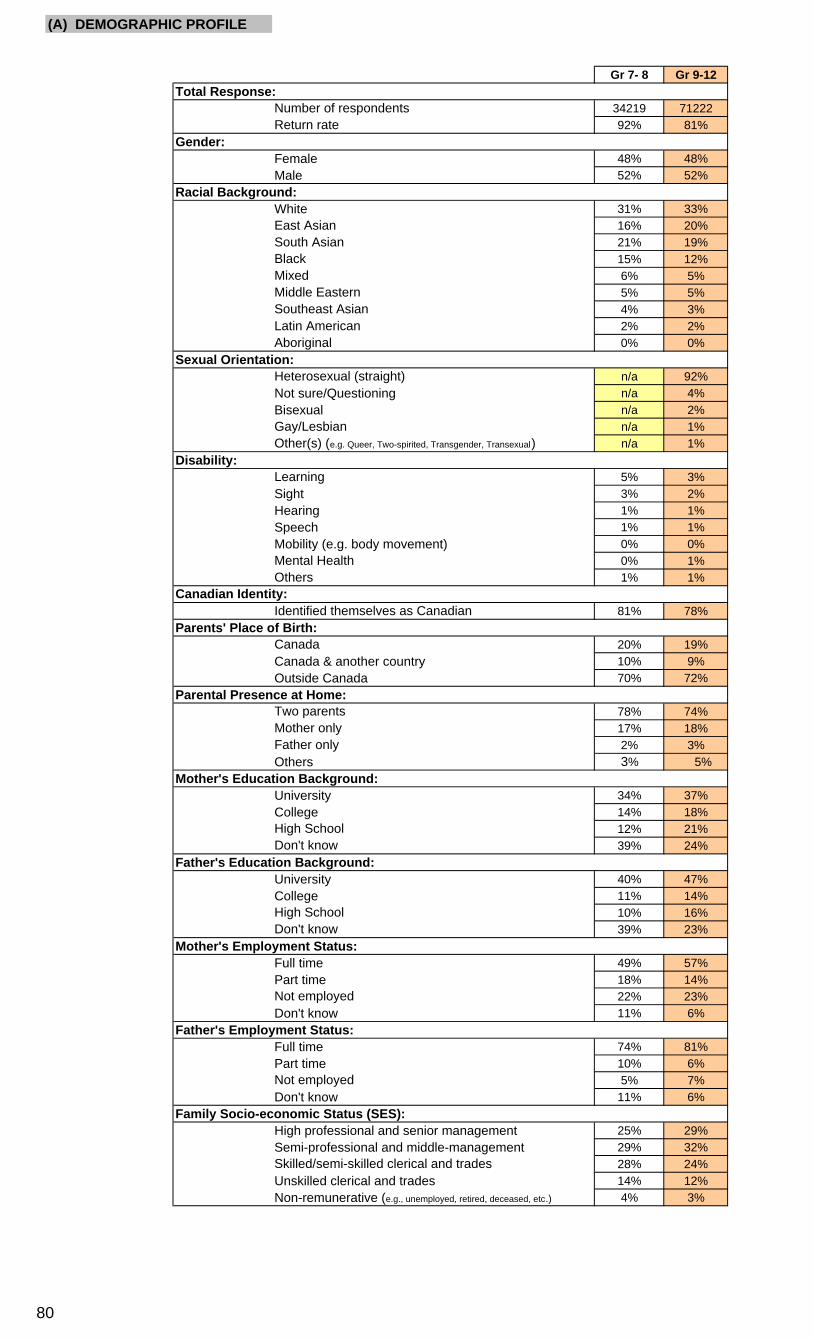
(A) DEMOGRAPHIC PROFILE
Gr 7- 8 Gr 9-12Total Response:
Number of respondents 34219 7122292% 81%
Gender:Female 48% 48%Male 52% 52%
Racial Background:White 31% 33%
16% 20%21% 19%15% 12%6% 5%5% 5%4% 3%2% 2%0% 0%
Sexual Orientation:n/a 92%
Not sure/Questioning n/a 4%Bisexual n/a 2%
n/a 1%Other(s) (e.g. Queer, Two-spirited, Transgender, Transexual) n/a 1%
Disability:Learning 5% 3%Sight 3% 2%Hearing 1% 1%Speech 1% 1%Mobility (e.g. body movement) 0% 0%Mental Health 0% 1%Others 1% 1%
Identified themselves as Canadian 81% 78%Parents' Place of Birth:
20% 19%Canada & another country 10% 9%Outside Canada 70% 72%
Parental Presence at Home:78% 74%17% 18%2% 3%
Others 3% 5%Mother's Education Background:
University 34% 37%College 14% 18%
12% 21%39% 24%
Father's Education Background:University 40% 47%College 11% 14%
10% 16%39% 23%
Mother's Employment Status:Full time 49% 57%Part time 18% 14%
22% 23%Don't know 11% 6%
Father's Employment Status:Full time 74% 81%Part time 10% 6%
5% 7%Don't know 11% 6%
Family Socio-economic Status (SES):High professional and senior management 25% 29%Semi-professional and middle-management 29% 32%
28% 24%Unskilled clerical and trades 14% 12%Non-remunerative (e.g., unemployed, retired, deceased, etc.) 4% 3%
Gay/Lesbian
Canadian Identity:
Skilled/semi-skilled clerical and trades
Canada
Father only
High School
Not employed
Don't know
Not employed
Don't know
Two parentsMother only
High School
East AsianSouth AsianBlack
Return rate
MixedMiddle EasternSoutheast AsianLatin AmericanAboriginal
Heterosexual (straight)
80

(B) QUESTIONS ABOUT MY LIFE IN SCHOOL AND OUTSIDE OF SCHOOL
SCHOOL CLIMATE
How do you feel about your school: Gr 7- 8 Gr 9-12
a) I enjoy school. All the time/ Often 64% 53%Sometimes 28% 34%Rarely / Never 8% 12%
b) My school is a friendly and welcoming place. All the time/ Often 68% 60%Sometimes 23% 28%Rarely / Never 10% 12%All the time/ Often 63% 44%Sometimes 25% 31%Rarely / Never 12% 25%All the time/ Often 81% 81%Sometimes 15% 14%Rarely / Never 4% 5%
e) I feel accepted by students in my school. All the time/ Often 76% 77%Sometimes 17% 17%Rarely / Never 6% 6%
f) I feel accepted by adults in my school. All the time/ Often 77% 71%Sometimes 16% 20%Rarely / Never 7% 8%All the time/ Often 85% 75%Sometimes 11% 18%Rarely / Never 4% 7%
This school offers:Gr 7- 8 Gr 9-12
a) Courses that I need. Yes n/a 81%No n/a 8%Not sure n/a 10%
b) Specialized courses that I need. Yes n/a 45%No n/a 21%Not sure n/a 34%
c) Extra-curricular activities that I am interested in. Yes 71% 64%No 11% 19%Not sure 17% 16%
Are there school activities that you would like to take part in but do not feel welcome:
Gr 7- 8 Gr 9-12No 85% 86%
b) If you do not feel welcome, do you think that it is because of: Gr 7- 8 Gr 9-12
Your aboriginal background 0% 1%Your gender 1% 1%Your cultural or racial background 2% 3%Your language background 1% 2%Your religion or faith background 1% 1%Your family income level (high, middle or low) 1% 1%Your sexual orientation n/a 1%Your disability 1% 1%Your body image (how you look) 6% 5%Your grades or marks 4% 3%
How often do you feel comfortable:Gr 7- 8 Gr 9-12
a) Answering questions in class. All the time/ Often 69% 63%Sometimes 22% 27%Rarely / Never 9% 11%
b) Speaking up in class to give your opinion. All the time/ Often 59% 55%Sometimes 24% 28%Rarely / Never 17% 17%
c) Participating in class activities and discussion. All the time/ Often 72% 62%Sometimes 20% 27%Rarely / Never 9% 11%
g) Extra help is available at this school when I need it.
c) My school building is an attractive and great place to learn.
d) I get along well with other students in my school.
81

RELATIONSHIPS WITH SCHOOL ADULTS
How do you feel that you are treated by the adults in your school: Gr 7- 8 Gr 9-12
Same as everyone else 84% 82%Better than others 9% 10%Worse than others 7% 8%
b) Do you think you are treated differently because of: Gr 7- 8 Gr 9-12
Your aboriginal background 0% 1%Your gender 2% 2%Your cultural or racial background 2% 4%Your language background 1% 3%Your religion or faith background 1% 2%Your family income level (high, middle or low) 1% 1%Your sexual orientation n/a 1%Your disability 1% 1%Your body image (how you look) 4% 4%Your grades or marks 8% 9%
For each of the following statements, pick the appropriate response: Gr 7- 8 Gr 9-12
a) My teachers expect me to succeed in school. All / Most of them 92% 85%Some of them 6% 11%One / Two of them 2% 3%None of them 1% 1%
b) I am satisfied with the ways my teachers teach me. All / Most of them 79% 61%Some of them 15% 27%One / Two of them 5% 11%None of them 1% 2%
c) I feel supported and encouraged by my teachers. All / Most of them 77% 60%Some of them 16% 27%One / Two of them 5% 11%None of them 2% 3%All / Most of them 48% 37%Some of them 21% 24%One / Two of them 16% 20%None of them 15% 19%All / Most of them 93% 88%Some of them 4% 8%One / Two of them 2% 3%None of them 1% 2%
How often do you feel comfortable discussing personal problems with: Gr 7- 8 Gr 9-12
a) Your teachers. All the time/ Often 27% 19%Sometimes 28% 26%Rarely / Never 45% 56%
b) Your guidance counsellor(s). All the time/ Often 24% 20%Sometimes 21% 24%Rarely / Never 54% 56%
c) Your principal or vice-principal(s). All the time/ Often 20% 12%Sometimes 20% 16%Rarely / Never 60% 72%
e). My school’s staff respect my background (e.g. cultural, racial, religious ).
d) I feel comfortable discussing a problem with my teachers.
82
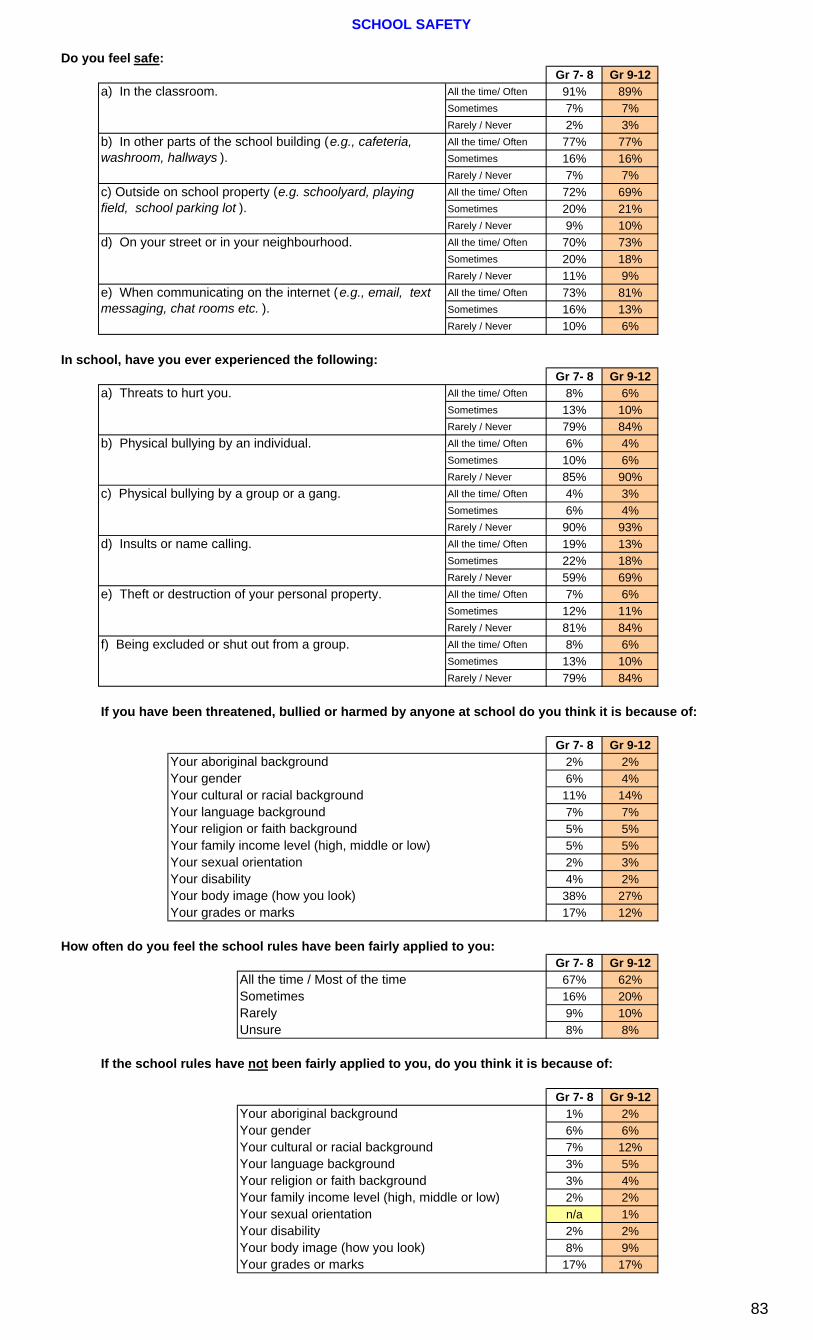
SCHOOL SAFETY
Do you feel safe:Gr 7- 8 Gr 9-12
a) In the classroom. All the time/ Often 91% 89%Sometimes 7% 7%Rarely / Never 2% 3%All the time/ Often 77% 77%Sometimes 16% 16%Rarely / Never 7% 7%All the time/ Often 72% 69%Sometimes 20% 21%Rarely / Never 9% 10%All the time/ Often 70% 73%Sometimes 20% 18%Rarely / Never 11% 9%All the time/ Often 73% 81%Sometimes 16% 13%Rarely / Never 10% 6%
In school, have you ever experienced the following:Gr 7- 8 Gr 9-12
a) Threats to hurt you. All the time/ Often 8% 6%Sometimes 13% 10%Rarely / Never 79% 84%
b) Physical bullying by an individual. All the time/ Often 6% 4%Sometimes 10% 6%Rarely / Never 85% 90%
c) Physical bullying by a group or a gang. All the time/ Often 4% 3%Sometimes 6% 4%Rarely / Never 90% 93%
d) Insults or name calling. All the time/ Often 19% 13%Sometimes 22% 18%Rarely / Never 59% 69%
e) Theft or destruction of your personal property. All the time/ Often 7% 6%Sometimes 12% 11%Rarely / Never 81% 84%
f) Being excluded or shut out from a group. All the time/ Often 8% 6%Sometimes 13% 10%Rarely / Never 79% 84%
If you have been threatened, bullied or harmed by anyone at school do you think it is because of:
Gr 7- 8 Gr 9-12Your aboriginal background 2% 2%Your gender 6% 4%Your cultural or racial background 11% 14%Your language background 7% 7%Your religion or faith background 5% 5%Your family income level (high, middle or low) 5% 5%Your sexual orientation 2% 3%Your disability 4% 2%Your body image (how you look) 38% 27%Your grades or marks 17% 12%
How often do you feel the school rules have been fairly applied to you:Gr 7- 8 Gr 9-12
All the time / Most of the time 67% 62%Sometimes 16% 20%Rarely 9% 10%Unsure 8% 8%
If the school rules have not been fairly applied to you, do you think it is because of:
Gr 7- 8 Gr 9-12Your aboriginal background 1% 2%Your gender 6% 6%Your cultural or racial background 7% 12%Your language background 3% 5%Your religion or faith background 3% 4%Your family income level (high, middle or low) 2% 2%Your sexual orientation n/a 1%Your disability 2% 2%Your body image (how you look) 8% 9%Your grades or marks 17% 17%
d) On your street or in your neighbourhood.
e) When communicating on the internet (e.g., email, text messaging, chat rooms etc. ).
b) In other parts of the school building (e.g., cafeteria, washroom, hallways ).
c) Outside on school property (e.g. schoolyard, playing field, school parking lot ).
83

INCLUSIVE SCHOOL EXPERIENCES
In this school, how often have you learned about the experiences and/or achievements of:
Gr 7- 8 Gr 9-12a) Women. All the time/ Often 25% 40%
Sometimes 40% 39%Rarely / Never 36% 21%
b) Aboriginal people. All the time/ Often 49% 21%Sometimes 32% 33%Rarely / Never 19% 46%
c) Different cultural or racial groups. All the time/ Often 43% 46%Sometimes 36% 34%Rarely / Never 21% 20%
d) Different religious/faith groups. All the time/ Often 27% 30%Sometimes 34% 33%Rarely / Never 40% 37%
e) Persons with disabilities. All the time/ Often 15% 13%Sometimes 29% 28%Rarely / Never 56% 58%All the time/ Often n/a 12%Sometimes n/a 19%Rarely / Never n/a 69%
g) People of different social classes. All the time/ Often 22% 30%Sometimes 32% 35%Rarely / Never 45% 35%
At this school, people of different backgrounds are seen and/or heard in the:
Gr 7- 8 Gr 9-12a) Pictures or posters in the school. Strongly Agree/ Agree 60% 63%
Not Sure 26% 19%Disagree/ Strongly Disagree 14% 17%
b) Displays of student work. Strongly Agree/ Agree 69% 68%Not Sure 19% 17%Disagree/ Strongly Disagree 12% 15%Strongly Agree/ Agree 69% 67%Not Sure 18% 15%Disagree/ Strongly Disagree 13% 17%
d) Topics we study in class. Strongly Agree/ Agree 71% 67%Not Sure 17% 15%Disagree/ Strongly Disagree 12% 18%
e) Extra-curricular activities. Strongly Agree/ Agree 57% 63%Not Sure 24% 19%Disagree/ Strongly Disagree 19% 18%Strongly Agree/ Agree 63% 70%Not Sure 22% 16%Disagree/ Strongly Disagree 15% 13%
g) Special events and celebrations. Strongly Agree/ Agree 74% 75%Not Sure 17% 15%Disagree/ Strongly Disagree 8% 10%
Learning more about my own cultural or racial background at school would:
Gr 7- 8 Gr 9-12a) Make learning more interesting for me. Strongly Agree/ Agree 72% 69%
Not Sure 12% 12%Disagree/ Strongly Disagree 16% 19%
b) Help me do better in school. Strongly Agree/ Agree 49% 45%Not Sure 19% 18%Disagree/ Strongly Disagree 32% 37%
c) Help me enjoy school more. Strongly Agree/ Agree 58% 55%Not Sure 16% 16%Disagree/ Strongly Disagree 25% 28%
d) Make no difference to me. Strongly Agree/ Agree 38% 43%Not Sure 18% 15%Disagree/ Strongly Disagree 45% 42%
f) School publications (e.g., yearbooks and newspapers ).
c) Materials teachers use in class (e.g., books and videos ).
f) Gay, lesbian, bisexual, transgender, transexual or two-spirited people.
84

EXTRA-CURRICULAR ACTIVITIES
How often do you take part in the following types of extra-curricular activities in school? Gr 7- 8 Gr 9-12
a) Arts (e.g., visual arts, drama, dance ). Weekly 28% 16%Monthly 7% 5%A few times this year 22% 22%Never 43% 57%
b) Cultural group activities. Weekly 7% 5%Monthly 7% 5%A few times this year 16% 19%Never 70% 71%
c) Music (e.g., band, choir ). Weekly 40% 16%Monthly 6% 4%A few times this year 14% 12%Never 40% 68%
d) School clubs (e.g., chess, environment ). Weekly 19% 17%Monthly 10% 7%A few times this year 19% 16%Never 53% 59%
e) Sports (including house leagues, sport teams ). Weekly 38% 25%Monthly 14% 10%A few times this year 21% 21%Never 28% 43%
f) Student council activities. Weekly 9% 6%Monthly 9% 6%A few times this year 15% 15%Never 68% 73%Weekly 7% 5%Monthly 8% 5%A few times this year 20% 14%Never 66% 76%
h) School special events (e.g. dances, concerts ). Weekly 13% 6%Monthly 21% 13%A few times this year 34% 34%Never 32% 47%
i) Leadership programs. Weekly 10% 7%Monthly 9% 6%A few times this year 19% 17%Never 62% 70%
How often do you take part in the following types of activities outside of school?Gr 7- 8 Gr 9-12
a) Arts (e.g., visual arts, drama, dance ). Weekly 17% 15%Monthly 7% 7%A few times this year 15% 16%Never 60% 62%
b) Cultural group activities. Weekly 10% 7%Monthly 6% 7%A few times this year 13% 18%Never 71% 68%
c) Music (e.g., piano lessons, band, choir ). Weekly 27% 20%Monthly 6% 5%A few times this year 11% 11%Never 56% 63%
d) Clubs. Weekly 14% 9%Monthly 8% 7%A few times this year 15% 15%Never 63% 69%
e) Religious activities. Weekly 17% 16%Monthly 8% 8%A few times this year 15% 17%Never 60% 59%Weekly 44% 33%Monthly 11% 12%A few times this year 16% 18%Never 29% 37%
g) Volunteer activities. Weekly 9% 16%Monthly 10% 16%A few times this year 23% 33%Never 57% 35%
h) Leadership programs. Weekly 6% 6%Monthly 5% 5%A few times this year 13% 15%Never 75% 74%
g) Student publications (e.g., yearbook, newspaper, magazine ).
f) Sports (e.g., swimming lessons, community sport teams ).
85

HOMEWORK
About how many hours a week (including weekends) do you spend on homework and studying:
Gr 7- 8 Gr 9-12Average hours per week on homework and studying 10 12
After school, who usually helps you with your homework:Gr 7- 8 Gr 9-12
Parents or caregivers 53% 30%Teachers 13% 10%Brother(s)/Sister(s) 26% 18%Free tutor(s) offered in my school or community 2% 2%Other family members 9% 5%Paid tutor(s) 5% 7%Friend(s) 27% 32%People in the community 1% 1%No one 15% 27%I do not need help with my homework 16% 20%
How often do any of the following prevent you from finishing your homework:
Gr 7- 8 Gr 9-12a) Household chores and responsibilities All the time/ Often 14% 13%
Sometimes 19% 20%Rarely / Never 67% 66%
b) Part-time job All the time/ Often 3% 12%Sometimes 4% 13%Rarely / Never 92% 74%
c) Sports or recreation activities All the time/ Often 20% 18%Sometimes 26% 26%Rarely / Never 54% 56%
d) Religious/faith activities All the time/ Often 8% 6%Sometimes 11% 10%Rarely / Never 81% 84%
e) Spending time with friends All the time/ Often 23% 29%Sometimes 26% 32%Rarely / Never 51% 40%
f) Difficulty of the homework All the time/ Often 16% 22%Sometimes 32% 37%Rarely / Never 52% 41%
g) No proper space at home to do homework All the time/ Often 6% 7%Sometimes 7% 10%Rarely / Never 87% 82%
h) No study materials to help me All the time/ Often 5% 5%Sometimes 10% 13%Rarely / Never 85% 81%
i) Frequent distractions at home All the time/ Often 16% 22%Sometimes 19% 23%Rarely / Never 65% 55%
j) Health reasons All the time/ Often 3% 4%Sometimes 6% 8%Rarely / Never 91% 88%
86

AFTER-SCHOOL ACTIVITIES
About how many hours a week (including weekends) do you spend on part-time work for pay:
Gr 7- 8 Gr 9-12% of students who worked part-time 17% 31%Average hours per week on part-time work 7 13
On a regular school day, how much time do you spend on the following activities after school:
Gr 7- 8 Gr 9-12a) Household chores None 21% 19%
Less than one hour 63% 62%1-2 hours 14% 16%More than 2 hours 2% 3%
b) Looking after brothers, sisters, and/or family members None 57% 64%Less than one hour 22% 19%1-2 hours 13% 10%More than 2 hours 8% 7%
c) Helping with a family business None 77% 77%Less than one hour 15% 14%1-2 hours 5% 6%More than 2 hours 3% 3%
d) Watching TV None 6% 10%Less than one hour 24% 24%1-2 hours 40% 40%More than 2 hours 30% 26%
e) Playing computer/video games None 17% 31%Less than one hour 28% 23%1-2 hours 29% 23%More than 2 hours 26% 22%
f) Spending time on the internet None 12% 7%Less than one hour 32% 23%1-2 hours 31% 35%More than 2 hours 26% 35%
g). Playing sports and recreational activities None 16% 26%Less than one hour 27% 28%1-2 hours 35% 29%More than 2 hours 22% 18%
h) Religious/faith activities None 64% 67%Less than one hour 21% 21%1-2 hours 10% 8%More than 2 hours 5% 4%None 11% 8%Less than one hour 27% 24%1-2 hours 33% 33%More than 2 hours 30% 35%
How often do you use the computer: Gr 7- 8 Gr 9-12
a) At school Not available 5% 3%Everyday 3% 14%Several times a week 19% 21%Not very often 55% 39%Almost never 18% 23%
b) At home Not available 4% 3%Everyday 56% 72%Several times a week 27% 17%Not very often 10% 6%Almost never 3% 2%
c) In the community (e.g., friends, internet café) Not available 14% 9%Everyday 5% 4%Several times a week 11% 8%Not very often 30% 31%Almost never 41% 48%
d) At the library Not available 7% 4%Everyday 3% 2%Several times a week 10% 8%Not very often 35% 34%Almost never 45% 51%
i) Other leisure activities (e.g., going to movies, talking on the phone, listening to music, going to the mall, hanging out with friends, reading for leisure )
87

HOME SUPPORT
Outside of school, who usually gives you advice about schooling:
Gr 7- 8 Gr 9-12Parents or caregivers 75% 71%Grandparent(s) 16% 13%Brother(s)/Sister(s) 28% 29%Other family members 26% 27%Friends 35% 47%People in the community 5% 9%No one 4% 5%I do not need advice about school 6% 7%
Do your parents or caregivers:
Gr 7- 8 Gr 9-12a) Expect you to succeed in school All the time/ Often 96% 95%
Sometimes 2% 3%Rarely / Never 1% 1%Not sure 1% 1%
b) Help you to set goals and make plans All the time/ Often 74% 63%Sometimes 14% 19%Rarely / Never 9% 16%Not sure 3% 2%
c) Talk to you about your schoolwork All the time/ Often 72% 62%Sometimes 17% 22%Rarely / Never 10% 15%Not sure 1% 1%
d) Talk to you about your relationships and problems All the time/ Often 44% 35%Sometimes 20% 23%Rarely / Never 31% 39%Not sure 5% 3%All the time/ Often 25% 17%Sometimes 23% 20%Rarely / Never 44% 57%Not sure 8% 5%
f) Attend parent teacher interviews All the time/ Often 64% 38%Sometimes 17% 21%Rarely / Never 14% 38%Not sure 4% 3%
g) Attend meetings and events at school All the time/ Often 34% 17%Sometimes 25% 19%Rarely / Never 36% 60%Not sure 5% 5%
h) Volunteer at the school All the time/ Often 9% 5%Sometimes 12% 6%Rarely / Never 69% 81%Not sure 10% 7%
How often do you feel comfortable discussing personal problems with:
Gr 7- 8 Gr 9-12d) Your friends. All the time/ Often 64% 69%
Sometimes 19% 19%Rarely / Never 17% 12%
e) Your parents or caregivers. All the time/ Often 65% 55%Sometimes 16% 23%Rarely / Never 19% 22%
f) Other family members or relatives. All the time/ Often 48% 43%Sometimes 22% 26%Rarely / Never 29% 31%
e) Communicate with your teachers (e.g., through telephone, your school agenda )
88

During the school week, how often do you:Gr 7- 8 Gr 9-12
a) Eat breakfast before coming to school Everyday 56% 41%Most days 17% 18%Some days 18% 24%Never 8% 17%
b) Eat lunch Everyday 79% 58%Most days 14% 24%Some days 6% 15%Never 1% 3%
c) Eat dinner Everyday 89% 83%Most days 8% 12%Some days 3% 5%Never 1% 1%
d) Have a snack during the school day Everyday 30% 27%Most days 19% 17%Some days 29% 35%Never 21% 21%
Have you ever had your eyesight tested by a doctor:Gr 7- 8 Gr 9-12
75% n/a16% n/a9% n/a
Have you ever had your hearing tested by a doctor:Gr 7- 8 Gr 9-12
31% n/a44% n/a25% n/a
NoDon't know
Yes
YesNoDon't know
89

STUDENT SELF-EVALUATION & ACHIEVEMENT
How would you rate your own progress at school?
Gr 7- 8 Gr 9-12Excellent 22% 17%Good 51% 49%Fair / Average 22% 28%Having Difficulty 5% 6%
How do you rate yourself in each of the following areas?
Gr 7- 8 Gr 9-12a) Oral communication Excellent 21% 26%
Good 43% 41%Average 26% 24%Weak 6% 7%Not sure 4% 2%
b) Reading Excellent 26% 29%Good 41% 40%Average 25% 24%Weak 7% 6%Not sure 2% 1%
c) Writing Excellent 18% 20%Good 40% 39%Average 30% 29%Weak 10% 10%Not sure 2% 2%
d) Math Excellent 30% 21%Good 32% 29%Average 22% 27%Weak 13% 21%Not sure 2% 2%
e) Technology Excellent 20% 19%Good 35% 32%Average 28% 31%Weak 8% 12%Not sure 8% 7%
f) Social skills (e.g., getting along with others ) Excellent 39% 40%Good 37% 37%Average 16% 16%Weak 5% 4%Not sure 3% 2%Excellent 25% 28%Good 40% 42%Average 24% 23%Weak 7% 5%Not sure 4% 3%
h) Leadership (e.g., leading a group or team ) Excellent 26% 24%Good 31% 33%Average 24% 27%Weak 11% 11%Not sure 8% 6%
At school, have you ever been selected to help other students as a:
Gr 7- 8 Gr 9-12Peacemaker 8% 8%Mentor 6% 7%Reading buddy 39% 16%School ambassador 6% 5%Tutor 12% 16%Not yet 42% 57%
At school, how often have you been selected to lead an activity, a group or a team:
Gr 7- 8 Gr 9-12Many times 16% 15%Sometimes 29% 27%A few times 35% 33%Never 21% 25%
g) Problem solving (e.g., finding ways to solve personal/social problems )
90

What awards, certificates or recognition have you received in school?
Gr 7- 8 Gr 9-12None yet 32% 38%Academic 24% 30%Citizenship 14% 9%Leadership 16% 12%Music 13% 10%Arts (e.g., visual arts, drama, dance) 13% 12%Language(s) 9% 9%Mathematics 14% 11%Sports 25% 20%Design and Technology 4% 4%Charitable or humanitarian activities 3% 3%Science 7% 7%
What awards, certificates or recognition have you received outside of school?
Gr 7- 8 Gr 9-12None yet 34% 34%Academic 9% 9%Volunteer 12% 21%Environment 4% 3%Leadership 10% 12%Music 17% 14%Charitable or humanitarian activities 3% 5%Sports/Recreation 38% 32%
14% 12%
Based on your current school achievement, do you believe that you will graduate from high school:
Gr 7- 8 Gr 9-12I definitely will 52% 72%I think I will 38% 22%I'm not sure 9% 4%I don't think I will 2% 1%
What do you plan to do immediately after high school: Gr 7- 8 Gr 9-12
An apprenticeship 2% 3%Attend college 18% 16%Attend university 56% 60%Work (instead of post-secondary education) 3% 3%Not sure 19% 14%
What do your parents or caregivers expect you to do immediately after high school:
Gr 7- 8 Gr 9-12An apprenticeship 1% 1%Attend college 16% 15%Attend university 57% 67%Work (instead of post-secondary education) 2% 1%Not sure 23% 13%
Have you thought about your future career or occupation:Gr 7- 8 Gr 9-12
Yes, I’ve decided on my future career or occupation 32% 33%Yes, I've been thinking about it 56% 55%No, I have no idea about my future career or occupation 12% 12%
Who helps you decide on your future career or occupation: Gr 7- 8 Gr 9-12
Teacher(s) 17% 20%Guidance Counsellor(s) 7% 13%Other counsellors (e.g., youth counsellors) 1% 2%Parents or caregivers 67% 62%Other family members 25% 25%Friends 23% 30%No one is helping me 21% 23%
POST-SECONDARY ASPIRATIONS
Arts (e.g., visual arts, drama, dance )
91